Predicting the effects of nutrient loads, management regimes and climate change on water quality of Lake Rotorua - Bay of Plenty Regional ...
←
→
Page content transcription
If your browser does not render page correctly, please read the page content below
Predicting the effects of nutrient loads,
management regimes and climate change
    on water quality of Lake Rotorua

                                October 2012

                                 ERI report: 005
              Prepared for Bay of Plenty Regional Council

 By David P. Hamilton1, Deniz Özkundakci1, Chris G. McBride1, Wei
     Ye1, Liancong Luo1,2, Warwick Silvester1 and Paul White3
                               1. Environmental Research Institute
         The University of Waikato, Private Bag 3105, Hamilton 3240, New Zealand
    2. Nanjing Institute of Geography and Limnology, Chinese Academy of Sciences, China
                         3. Institute of Geological and Nuclear Sciences
                          Private Bag 2000, Taupo 3352, New Zealand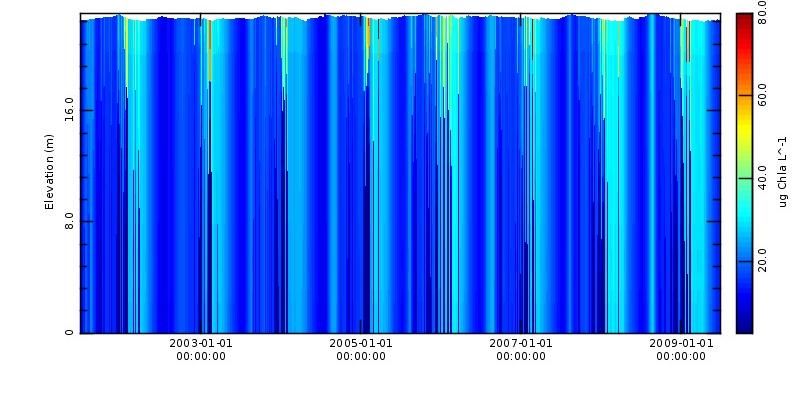
Lake Rotorua modelling

Reviewed by:            Approved      for   release   by:

                        John Tyrell

University of Waikato   University of Waikato

Affiliation             Affiliation

                                                       ii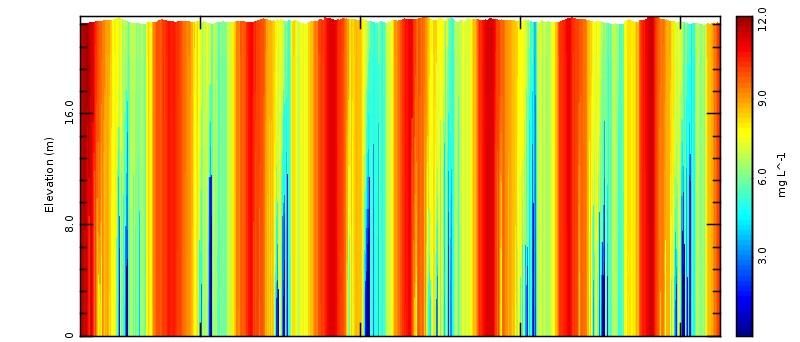
Lake Rotorua modelling

Executive Summary
   Lake Rotorua is a large body of water (area = 80 km2, mean depth = 10 m) which is of
   great cultural significance to the Te Arawa people, and is a focal point for the city of
   Rotorua’s tourism, recreational activity such as boating, kayaking and swimming, as
   well as an important trout fishery. Water quality has declined progressively in Lake
   Rotorua since the 1960s in response to influences including inputs of treated
   wastewater, and land use change from forest to pasture. The input of treated
   wastewater to the lake from the urban settlement ceased in 1991, but there has been
   ongoing pastoral expansion and intensification since that time, particularly expansion
   of dairy and increasing nitrogen-based fertilizer applications. Most of the conversion
   of forest to pastoral land was from 1970 to 1990. Current challenges to managing
   water quality of Lake Rotorua include not only nutrient loads both from current land
   use, but also legacy effects as the dominant cold-water spring inflows to the lake have
   long response times that reflect gradual enrichment of nitrate in the groundwater
   sources of these springs in association with changes in land use. Furthermore, there
   are large nutrient pools in the lake sediments and, with increasing trophic status and
   intermittent deoxygenation of bottom waters during periods of temperature
   stratification in the lake, there is an associated high internal (bottom-sediment)
   nutrient load. Because of the complexity of both spatial and temporal variations in
   catchment nutrient loads, and the way in which Lake Rotorua responds to these loads,
   a modelling approach is the best way to allow for quantitative assessments of the
   water quality effects of different land uses, climates and in-lake actions for the
   purposes of managing lake water quality. For water managers, quantitative statistics
   are required in order to clearly demonstrate the effects of land use change on water
   quality. These statistics must be science-based, defensible from the perspective of
   policy implementation, and open to challenge by affected groups. We linked together
   different system-specific models to simulate time-varying water quality responses
   which were expressed primarily in terms of the trophic state of the lake, based on a
   trophic level index (TLI). The models used in this study include:

   • SimCLIM: a model developed in the International Global Change Institute at the
   University of Waikato, that downscales data from atmosphere-ocean general
   circulation models used by the International Panel for Climate Change (IPCC) to
   hindcast past climates and predict a future climate, up to 2100. For the present case
   SimCLIM was used to generate past and future air temperature and rainfall within the
   Rotorua catchment at a spatial scale of 25 m. This model output was then used as
   rainfall input for ROTAN (see below) and as the rainfall and air temperature input for
   DYRESM-CAEDYM (see below).

                                                                                         iii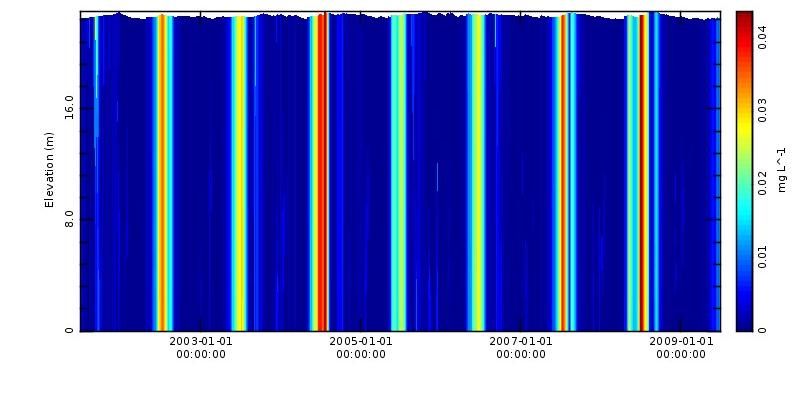
Lake Rotorua modelling

• ROTAN: the ROtorua TAupo Nitrogen model, developed by the National Institute of
Water and Atmospheric Sciences (NIWA). ROTAN is a rainfall-runoff-groundwater
model that produces streamflows for sub-catchments of Lake Rotorua. Nitrate is
included as a solute transported between surface water and groundwater
compartments of ROTAN, with provision of non-conservative processes due to
biogeochemical fluxes of nitrate. Outputs of stream discharge and nitrate
concentrations were then used as input data for the lake model simulations.

• CLUES: the Catchment Land Use for Environmental Sustainability (CLUES) model
developed by NIWA. This model produces annual average total phosphorus loads in
streams, which were adjusted to stream phosphorus concentrations using discharges
simulated with ROTAN, to provide daily input concentrations suitable for the lake
model.

• DYRESM-CAEDYM is a coupled hydrodynamic-ecological model developed by the
Centre for Water Research, University of Western Australia, that simulates the one-
dimensional (vertical) distribution of water temperature and chemical and biological
constituents of water that are relevant to lake trophic state. Raw data output from
DYRESM-CAEDYM was transformed to obtain indices of direct relevance to the
assessment of trophic state in the lake, such as the Trophic Level Index (TLI).

The results showed that it would be necessary to remove at least 350 tonnes of
nitrogen per year (t y-1) and a similarly large relative fraction of phosphorus load from
the lake catchment nutrient load in order to firstly arrest the present trend of
declining water quality, reduce the duration of bottom water anoxia and frequency of
cyanobacterial blooms, and subsequently to achieve a sustained reduction of TLI at or
near the target value of 4.2. This goal may necessitate land use change as well as
improved management of nutrients from all sources, i.e., potentially reversing some
of the land use trends that have taken place until the mid 2000s. Climate change
would make the lake water quality targets more difficult to attain because of increases
in stratification duration and intensity in this polymictic lake which has intermittent
periods of stratification in calm weather interspersed with mixed periods at other
times. Without improvements in water quality, increased stratification will extend the
duration and extent of anoxia in bottom waters and increase internal releases of
nutrients (i.e., those arising from the bottom sediments). The modelling also
considered mechanisms to reduce internal loading of nutrients, specifically using
chemical flocculants in one-off dosing of sediments across a large area of the lake.
Our empirical data suggest that the duration of effective sediment capping may be of
the order of four years. We simulated the lake water quality using nutrient release
rates from bottom sediments that we altered in order to approximate the effects of a
flocculation/sediment capping treatment. This treatment hastened the effects of land

                                                                                       iv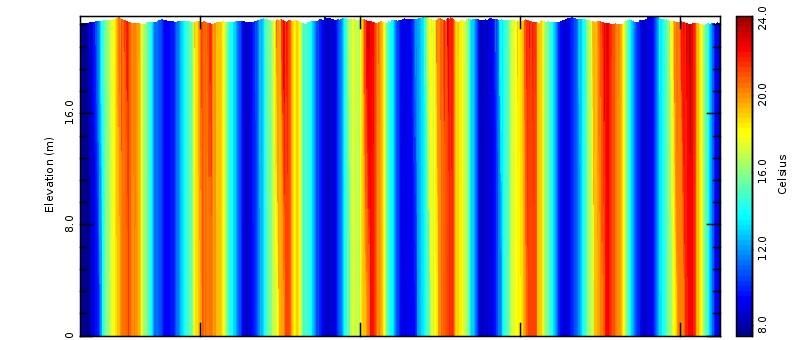
Lake Rotorua modelling

use change and offset a deterioration in water quality resulting from climate change,
but it must still be considered a risky option if catchment nutrient loads are not
attenuated effectively first, and will likely have limited duration of effectiveness. In
summary the model results indicate that only a sustained and pro-active nutrient
management strategy to reduce catchment nutrient loads will make it possible to
reverse the present buildup of nitrate in groundwater aquifers within the catchment
and to confer resilience of lake water quality to a changing climate, thereby
sustainably meeting the TLI targets set for improvements in water quality of Lake
Rotorua.

                                                                                      v
Lake Rotorua modelling

Acknowledgements
   We thank the following people and organisations for assistance in making the report
   possible: Kit Rutherford and Chris Palliser from NIWA for providing ROTAN simulation
   output, Sandy Elliot for assistance with CLUES, Uwe Morgenstern from GNS for
   information and discussion of groundwater ages and Simon Park from Headway Ltd
   for nutrient loads associated with different land use scenarios. We thank Andy Bruere,
   Rob Donald and Paul Scholes for comments received in the preparation of this report,
   as well as Glenn Ellery (Bay of Plenty Regional Council) and John McIntosh (Lochmoigh
   Consultants) for provision of data. The model DYRESM-CAEDYM was obtained from
   the Centre for Water Research, University of Western Australia.

                                                                                       vi
Lake Rotorua modelling

Contents

     Executive Summary ................................................................................ iii

     Acknowledgements ................................................................................ vi

     List of Figures ......................................................................................... ix

     List of Tables .......................................................................................... xi

     1. Introduction ....................................................................................... 1

     2. Methods ............................................................................................. 5

 2.1 Study site – Lake Rotorua .................................................................................................5
 2.2 Lake model description ....................................................................................................7
 2.3 Model timesteps and baseline simulation period ...........................................................7
 2.4 Meteorology .....................................................................................................................9
 2.5 Water balance ..................................................................................................................9
 2.6 Surface inflow, groundwater and rainfall parameterisation .........................................14
   2.6.1 Temperature ......................................................................................................................... 14
   2.6.2 Dissolved oxygen ................................................................................................................... 15
   2.6.3 Nutrients ............................................................................................................................... 15
   2.6.4 Phytoplankton ....................................................................................................................... 16
 2.7 Model calibration and validation ...................................................................................17
 2.8 Scenarios ........................................................................................................................19
   2.8.1 Historical and future simulations based on past land use and no modification to future
   land use (R0)................................................................................................................................... 19
 2.9 Sediment parameterisation ...........................................................................................21
 2.10 Lake restoration scenarios ...........................................................................................25
 2.11 Catchment Land Use for Environmental Sustainability (CLUES) ..................................25
 2.12 Additional scenarios .....................................................................................................26
   2.12.1 Hamurana spring diversion ................................................................................................. 26
   2.12.2 Sediment management ....................................................................................................... 26
   2.12.3 Additional land use phosphorus mitigation scenarios ........................................................ 28

                                                                                                                                                 vii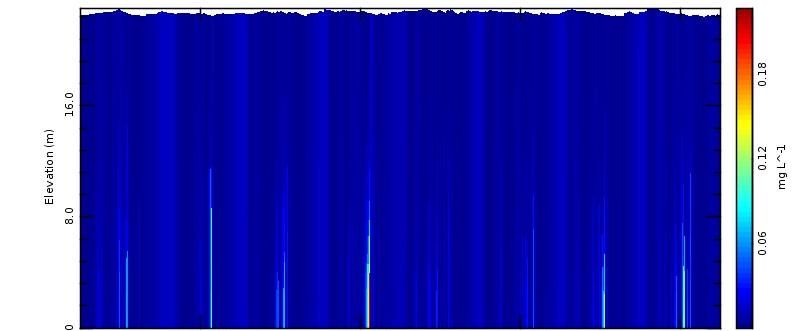
Lake Rotorua modelling

2.13 Comparison of scenarios ..............................................................................................29

    3. Results .............................................................................................. 32

3.1 Calibration and validation ..............................................................................................32
3.2 Base scenario..................................................................................................................43
3.3 Scenarios for effect of reduced nutrient loading on TLI ................................................43
3.4 Sediment management ..................................................................................................45
3.5 The effect of reduced nutrient loading on frequency of cyanobacteria blooms ...........45
3.6 The effect of reduced nutrient loading on bottom water oxygen concentrations .......49

    4. Discussion ......................................................................................... 52

4.1 Nutrient load reduction .................................................................................................52
4.2 Climate change ...............................................................................................................53
4.3 Sediment management ..................................................................................................54
4.4 Hamurana diversion .......................................................................................................55

    5. Conclusions ....................................................................................... 56

    6. References ........................................................................................ 57

                                                                                                                                viii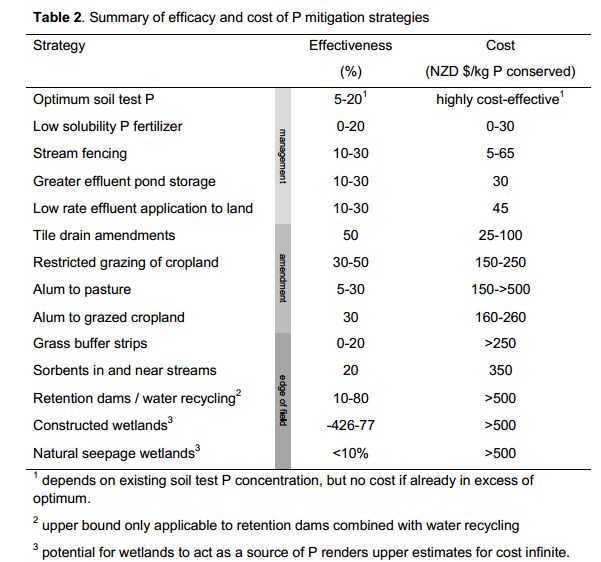
Lake Rotorua modelling
List of Figures
Figure 1. Estimated Trophic Level Index (Burns et al. 1999) of Lake Rotorua for
calendar years between 1990 and 2009. ......................................................................... 1
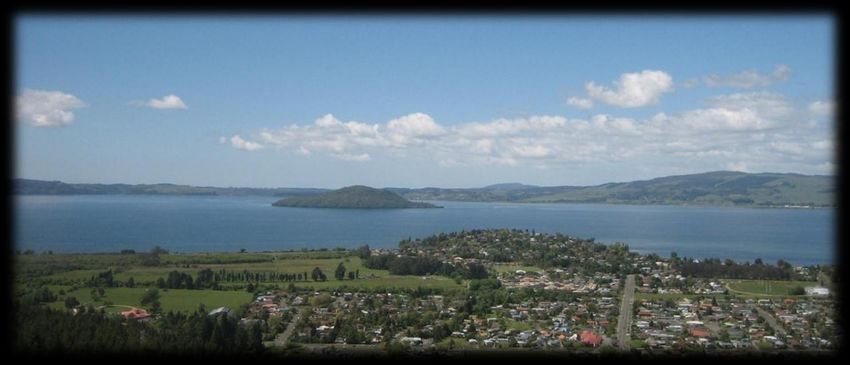
Figure 2: Map of the Lake Rotorua catchment with details of ROTAN sub-catchments
(from Rutherford et al. 2011), and showing the BoPRC sampling site, the high-
frequency monitoring buoy and the Rotorua airport weather station. Mokoia Island is
the closed circle in the centre of the lake, and unnamed subcatchments are those
without permanently flowing surface streams. Unnamed sub-catchments have no
permanently flowing surface stream. .............................................................................. 6
Figure 3: Conceptual model of the (A) phosphorus and (B) nitrogen cycles represented
in DYRESM-CAEDYM for the present study. POPL, PONL, DOPL and DONL represent
particulate labile organic phosphorus and nitrogen, and dissolved labile organic
phosphorus and nitrogen, respectively. ........................................................................... 8
Figure 4. Meteorological data used as input to the DYRESM model (July 2001 – June
2009), including short wave radiation (SW), cloud cover (CC), air temperature (T),
vapour pressure (VP), wind speed (U), and rainfall. Data were obtained from the
Rotorua Airport climate station (see text for details of transforming measured values
to daily input data for model input). .............................................................................. 10
Figure 5. Simulated Lake Rotorua water level, and observed BoPRC water level
recorder data. ................................................................................................................. 13
Figure 6. Simulated 15-day average Lake Rotorua outflow derived from the lake water
balance, and observed Ohau Channel flow. ................................................................... 13
Figure 7. Annual N load and 4-year average N load (t yr-1) to Lake Rotorua based on
ROTAN R0 (present land use scenario) output. ............................................................. 22
Figure 8. (A) Linear and exponential relationships between VHOD and 4-year average
of annual N load to Lake Rotorua. (B) Linear relationship between sediment N
concentrations and 4-year average N loads................................................................... 23
Figure 9. Time series of sediment N concentrations (modelled) and observed values
from Pearson (2007). ...................................................................................................... 24
Figure 10. Time series of derived (A) sediment oxygen demand (SOD), (B) volumetric
hypolimnetic oxygen demand (VHOD), (C) P release and (D) N release using empirical
relationships between measured values of VHOD, sediment N concentrations and 4-
average N load. Detailed descriptions of derivation methods are given in the text. ... 24
Figure 11. Simulation results for sediment capping efficacy decay rates based on three
different half lives. The “capacity exhausted” refers to a time scale on which the
retention efficiency for phosphorus of the treated sediments is largely exhausted. ... 27
Figure 12. Maximum potential sediment phosphate release rate following sediment
capping application on 01 July 2031 (solid line). The dashed line shows phosphate
release rate for the R350 scenario without sediment capping, for comparison. Changes
ixLake Rotorua modelling
in the dashed line reflect the effects of land use change in sediment phosphate release
rates. ............................................................................................................................... 28
Figure 13. Conceptual schematic of model coupling and scenario calculation methods.
........................................................................................................................................ 31
Figure 14. Comparison of model simulation results against field observations (black
circles) in the surface (0 m), 15m depth and bottom (20 m) waters of Lake Rotorua
during the calibration period (solid grey line) and validation period (dashed black lines)
for temperature, dissolved oxygen, total phosphorus and total nitrogen. ................... 37
Figure 15. Comparison of model simulation results against field observations (black
circles) in the surface (0 m), 15m depth and bottom (20 m) waters of Lake Rotorua
during the calibration period (solid grey line) and validation period (dashed black lines)
for phosphate, ammonium, nitrate and chlorophyll a. .................................................. 38
Figure 16. Comparison of model simulation (dashed line) results against high
frequency observations (solid line) in the surface (0 m) and bottom (20 m) waters of
Lake Rotorua for the period 2007 to 2009. .................................................................... 39
Figure 17. Time-elevation model output for (A) temperature, (B) dissolved oxygen
concentrations and (C) total chlorophyll a concentrations for the calibration and
validation period between 2001 and 2009. The vertical axes represent the water
height from the lake bottom as a function of time on the horizontal axes. The plot
colour represents the value of the model output as labelled to the right of the colour
bar. .................................................................................................................................. 40
Figure 18. Time-elevation model output data for concentrations of (A) phosphate, (B)
ammonium and (C) nitrate for the calibration and validation period between 2001 and
2009. The vertical axes represent the water height from the lake bottom as a function
of time on the horizontal axes. The plot colour represents the value of the model
output as labelled to the right of the colour bar. .......................................................... 41
Figure 19. Measured and simulated Trophic Level Index values (with intra-annual
variability represented by ± one standard deviation) compared with the base scenario
(July 2002 - June 2009). .................................................................................................. 42
Figure 20. Mean TLI over six 8-year periods spanning 1920 - 2100 for (A) R0 (business
as usual) with climate change, and R0 without climate change, (B) land use change
scenarios including R0, R250, R300 and R350 (numbers in scenario names indicate the
reduction in nitrogen load (t yr-1) relative to R0) and (C) land use change scenarios
including R0, R250, R300 and R350 with Hamurana springs diversion. The TLI target of
4.2 is shown as a dashed line. Bars represent inter-annual variation (range) of TLI for
the respective 8-year periods......................................................................................... 44
Figure 21. Simulated TLI values for R0, R350, R350 + sediment capping for the period
July 2031 until Jun 2039. Target TLI of 4.2 is indicated as horizontal dashed line........ 45
Figure 22. Probability distribution of cyanobacteria concentrations in Lake Rotorua for
the base scenario (R0), R0 without climate change (R0 no CC) and three other external
xLake Rotorua modelling
nutrient load scenarios for A) 2031-2039, B) 2061-2069 and C) 2091-2099. Extreme
concentrations (>80 mg m-3) are infrequent, and thus omitted from the graphs........ 47
Figure 23. Probability distribution of bottom-water (20 m) dissolved oxygen
concentrations in Lake Rotorua for the base scenario (R0), R0 without climate change
(R0 no CC) and three other external nutrient load scenarios for A) 2031-2039, B) 2061-
2069 and C) 2091-2099. ................................................................................................. 50
List of Tables
Table 1. Flow and nutrient loads for all inflows over the calibration/validation period,
2001 – 2009. Symbols represented by NH4, NO3 and PO4 are dissolved nutrient
concentrations represented by NH4-N, NO3-N and PO4-P, respectively. ....................... 16
Table 2. Summary of model input adjustments for the six simulation periods under the
baseline ‘R0’ model scenario. ......................................................................................... 21
Table 3. Annual mean nutrient loads and discharge for the period 2031 – 2039
(following land use change) for different land use scenarios (Ro, R250,R300 and R350;
see text). ......................................................................................................................... 26
Table 4. Phosphorus external loads for various scenarios, including additional P
mitigation (refer to text). Loads are given as both absolute (upper section) values as
well as relative to the R0 baseline case (lower section). 50-50-50 and 50-30-30
represents percentage P load mitigation for Dairy-Drystock-Lifestyle land uses
respectively..................................................................................................................... 29
Table 5. Phosphorus external loads and sediment nutrient release rates for the R0 and
R350 scenarios, and for two scenarios of additional on-land P mitigation that were
selected for analysis (refer to section 2.12.3). 50-50-50 and 50-30-30 represents
percentage P load mitigation for Dairy-Drystock-Lifestyle land uses respectively........ 29
Table 6. Model parameters used in CAEDYM for each simulated period. .................... 30
Table 7. Assigned values for parameters used in DYRESM. ........................................... 32
Table 8. Assigned values for parameters used in CAEDYM for Lake Rotorua; DOPL and
DONL are dissolved organic phosphorus and nitrogen, respectively. ........................... 33
Table 9. Statistical comparison between model simulations and field data (monthly
measurements) of surface (0 m), 15 m depth and bottom (20 m) waters in Lake
Rotorua using root-mean-square-error (RMSE), which has the same unit as the
variable estimated and Pearson correlation coefficient (R) for each variable. ............. 35
Table 10. Statistical comparison between model simulations and field data (buoy data)
of surface (0 m) and bottom (20 m) waters in Lake Rotorua using root-mean-square-
error (RMSE), which has the same unit as the variable estimated and Pearson
correlation coefficient (R) for each variable. ................................................................. 35
Table 12. Summary of simulated cyanobacteria concentrations during each 8-year
period for each scenario................................................................................................. 48
Table 13. Summary table of simulated bottom water dissolved oxygen concentrations
during each 8-year period for each scenario. ................................................................ 51
xiLake Rotorua modelling
1. Introduction
Lake Rotorua is a major asset to the city of Rotorua. It is a lake of great cultural
significance to Māori, is an important trout fishery and provides important
recreational and tourism opportunities. However, water quality of Lake Rotorua has
declined progressively over the past four decades (e.g. Fish 1969; Rutherford et al.
1996; Burger et al. 2008) to the extent that some of these activities have been
jeopardised and the mauri (life force) of the lake is threatened. As a result an Action
Plan has been developed by Bay of Plenty Regional Council (BoPRC) to improve water
quality of the lake as part of a restoration initiative with its partners the Te Arawa
Lakes Trust and the Rotorua District Council. Key parts of this Action Plan are
considerations of land use change and artificial nutrient controls on stream inflows
and lake bottom-sediments.
The primary tool used by BoPRC to assess and report on lake water quality is the
Trophic Level Index (TLI). This index combines individual trophic level values assigned
to concentrations of chlorophyll a, total phosphorus and total nitrogen, and
transparency assessed by Secchi disk depth (Burns et al. 1999). It is generally
acknowledged that water quality of Lake Rotorua began to show marked signs of
deterioration in the 1960s; a TLI target of 4.2, corresponding to the TLI value around
the 1960s, has been set as a goal by BoPRC to restore water quality of the lake (Figure
1). Therefore, the objective of undertaking the present modelling exercise was to
determine what combination of external nutrient load reductions, together with any
in-lake actions, may be used to reduce to the present TLI to a value of 4.2 or less on a
long-term basis.
5.5
Target TLI
TLI
5.0
Trophic Level Index
4.5
4.0
3.5
1990
1991
1992
1993
1994
1995
1996
1997
1998
1999
2000
2001
2002
2003
2004
2005
2006
2007
2008
2009
Figure 1. Estimated Trophic Level Index (Burns et al. 1999) of Lake Rotorua for calendar years
between 1990 and 2009. The Lake Rotorua target TLI (BoPRC 2009) is shown by the dashed grey
line.
1Lake Rotorua modelling
In 1991 discharge of treated effluent to Lake Rotorua ceased with the implementation
of land-based effluent polishing in an area of the Whakarewarewa forest in the
Puarenga sub-catchment of the lake. A resource consent for 'sewage-derived' loads to
Lake Rotorua permits an upper limit of 30 t y-1 for total nitrogen (N) and 3 t y-1 for total
phosphorus (P) from this source. The P limit has generally been met, while the recent
N load has been approximately 35 t y-1 even with modifications of treatment and
discharge practices by Rotorua District Council (Park and Holst 2009). The Puarenga
Stream is also showing a trend of increasing nitrate concentrations which were,
however, evident even before land-based effluent disposal in this sub-catchment
(Rutherford et al. 2008). The expected improvements in lake water quality as a result
of wastewater diversion from the lake were predicated upon catchment nutrient loads
of approximately 34 t P y-1 and 405 t N y-1 (excluding atmospheric deposition of N and
P), typical of those in the 1960s. Coupled with implementation of the Kaituna
Catchment Control Scheme in the 1980s, which appeared to have largely arrested
increases in particulate P loads from earlier pastoral conversions (Williamson et al.,
1996), water quality of Lake Rotorua was expected to stabilise and improve. There
were noticeable improvements in water clarity through the period 1993-1995,
following land-based effluent discharge in 1991 (Rutherford et al. 1996), but the TLI
increased dramatically in the early 2000s and although TLI has decreased slightly
between c. 2007 to 2009, for the past decade Lake Rotorua has been characterised by
frequent blooms of cyanobacteria (blue-green algae) through summer-autumn as well
as more prolonged bottom-water anoxia (loss of dissolved oxygen) during periods of
intermittent stratification of lake water in warmer months of the year (Burger et al.
2007a).
The expected improvements in lake water quality in response to removing wastewater
discharges to the lake have been offset by two main factors. First is that bottom
sediments of Lake Rotorua have been strongly enriched in nitrogen and phosphorus as
a result of many years of eutrophication (Trolle et al. 2010) and releases of these
nutrients are greatly enhanced as levels of dissolved oxygen decline when the water
column stratifies, which can occur for periods of up to one month (Vant 1987). On an
annual basis, loads contributed from this internal release mechanism are of similar
magnitude to those arising from the lake catchment (see Burger et al. 2008; Bay of
Plenty Regional Council 2009).
The second influence related to the ongoing eutrophication of Lake Rotorua has been
a trend of increasing nitrate concentrations observed in many of the stream inflows to
the lake (1968-2003; Rutherford et al. 2011). This trend has been attributed to
gradual nitrate enrichment of aquifers draining agricultural land in the catchment,
with changes in nitrate concentration reflecting a time history of agricultural
development and intensification. The duration over which nitrate is retained within
2Lake Rotorua modelling
the sub-catchment aquifer can be many decades for some of the largest aquifers, such
as those associated with the Hamurana and Awahou Streams.
The restoration of Lake Rotorua is a long-term goal of the Rotorua Te Arawa Lakes
Strategy Group, which is the overarching lake management group made up of
representatives from Bay of Plenty Regional Council, Te Arawa Trust Board and
Rotorua District Council. Restoration of the lake can be expected to have far-reaching
benefits that extend beyond the immediate lake and catchment areas. For example,
the construction of the $10 million Ohau Channel diversion wall was deemed
necessary to protect water quality in Lake Rotoiti from the effects of the nutrient-
enriched inflow arising from Lake Rotorua. The projected time-frame for the diversion
wall to be in place is approximately 50 years; a duration on which nitrogen loads to
Lake Rotorua and through the Ohau Channel might reasonably be expected to decline
in response to management actions in the Rotorua catchment. Furthermore,
problems with algal blooms in the Kaituna River would likely be alleviated as water
quality in Lake Rotorua is improved.
Because of the complexity of both spatial and temporal variations in catchment
nutrient loads, and the way in which Lake Rotorua responds to these loads, a
modelling approach is the best way to provide quantitative assessments of the water
quality effects of different land uses, climates and in-lake actions for the purposes of
managing lake water quality. For water managers, quantitative statistics are required
to be able to clearly demonstrate the effects of land use change on water quality.
These statistics must be rigorous and science-based, defensible from perspectives of
policy implementation, and open to challenge by affected groups. No single model is
capable of coupling climate, nutrient loads and lake water quality. For this reason,
different system-specific models have been linked together through their respective
model inputs and outputs, in order to simulate time-varying TLI responses to changes
in nutrient loads and climate. The models used in this study include:
SimCLIM: a model that downscales data from atmosphere-ocean general circulation
models to hindcast past climates and predict climate at some point in the future, up
to 2100 (Warrick et al. 2005). For the present case SimCLIM was used to generate
past and future air temperature and rainfall within the Rotorua catchment at a
spatial scale of 25 m. This model output was then used as rainfall input for ROTAN
(see below) and as the rainfall and air temperature input for DYRESM-CAEDYM (see
below).
ROTAN: the ROtorua TAupo Nitrogen model. ROTAN is a rainfall-runoff-groundwater
model that produces streamflows for sub-catchments of Lake Rotorua (Rutherford et
al. 2009, 2011). Nitrate is included as a solute transported between surface water
and groundwater compartments of ROTAN, with provision of non-conservative
processes due to biogeochemical fluxes of nitrate. Outputs of stream discharge and
3Lake Rotorua modelling
nitrate concentrations were then used as input data for DYRESM-CAEDYM
simulations in the present study.
CLUES: the Catchment Land Use for Environmental Sustainability (CLUES) model. This
model produces annual average total nitrogen, total phosphorus, E. coli and
sediment loads in streams at a variety of spatial scales from individual stream
reaches and subcatchments up to a whole-nation scale, based on land use, geology
and land morphology. It is a GIS-based modelling system and specifically targets
long-term land use change effects on catchment nutrient fields. For the purposes of
the present study CLUES was used to generate total phosphorus loads in individual
stream reaches of Lake Rotorua corresponding to those used in ROTAN. Annual
average P loads were adjusted to stream P concentrations using discharges
simulated with ROTAN, to provide input data suitable for DYRESM-CAEDYM.
DYRESM-CAEDYM is a coupled hydrodynamic-ecological model that has been applied
to lakes and reservoirs around the world to simulate the one-dimensional (vertical)
distribution of water temperature and chemical and biological constituents of water
that are relevant to lake trophic state (Hipsey and Hamilton 2008). In a review of
internationally-available lake water quality models it was considered to be the
leading model of its type for water quality predictions (Trolle et al. 2011b). Raw data
output from DYRESM-CAEDYM has also been transformed in this study to obtain
indices of direct relevance to the assessment of trophic state in the lake, such as TLI.
This report presents results from DYRESM-CAEDYM simulations and assesses these
results in relation to the goal of attaining a TLI value of ≤ 4.2 to meet the objectives for
water quality in Lake Rotorua defined in the Bay of Plenty Regional Council (BoPRC)
Regional Water and Land Plan. As background, a detailed description is given of the
derivation of input data for DYRESM-CAEDYM, calibration of the model and
comparison against measured data. Outcomes are presented for a series of simulated
scenarios designed to test for the effects of different external nutrient loadings
corresponding to changes in land use, management interventions related to artificially
modifying internal (bottom sediment-derived) nutrient loads or stream inflows, and
climate change to better understand the implications of a warming climate that is
predicted to occur in responses to increasing atmospheric carbon dioxide.
4Lake Rotorua modelling
2. Methods
2.1 Study site – Lake Rotorua
The Lake Rotorua catchment has an area of approximately 425 km2 (Figure 2). The
hydrogeology of the catchment is complex with permeable pumiceous tephra
overlying massive deep rhyolite and ignimbrite unconfined aquifers that retain
groundwater for long and variable periods. Rutherford et al. (2011) produced a series
of land use maps that indicate how land use of the Rotorua catchment has changed
between 1940 and 2010. In summary, the urban area has expanded substantially
during this time but with progressive reticulation of septic tanks into the centralised
wastewater treatment plant within this area. Relatively low-intensity pastoral land
cover comprising mostly sheep and beef farms covered a considerable area of the
lower catchment as early as 1940 but also expanded rapidly around the lake margin
and then progressively into the upper catchment. Dairy farming has more recently
replaced both forest and sheep and beef farming in the north-west of the catchment,
mostly in and around the Mamaku Plateau, particularly over the past 3-4 decades. In
general there has been a gradual loss of forest with the expansion of pasture in the
Rotorua catchment to the point where pasture now makes up about 50% of the total
catchment area.
Phytoplankton biomass and production in Lake Rotorua may be limited by nitrogen
and/or phosphorus, as well as other environmental factors depending on time of year
and the location within the lake (Burger et al. 2007b). Ratios of N:P are low by
comparison with many other lakes in New Zealand and particularly overseas, and,
based on Redfield ratios (see Abell et al. 2010) suggest that either nutrient could
potentially limit phytoplankton productivity. White et al. (1977) found using
laboratory based bioassays that N consistently limited algal biomass. Burger et al.
(2007b) ran similar but in situ bioassays and also used a model to show that in
different seasons co-limitation by N and P was the norm. Bioassays carried out in
large-scale mesocosms in Lake Rotorua in summer 2009-10 also indicated that co-
limitation was the most frequent case, as opposed to limitation by either N or P
(Hamilton, unpubl. data). For these reasons, the Technical Advisory Group for the
Rotorua lakes has consistently advocated (EBoP 2004) for maintaining controls on
loads of both N and P.
Reducing solely N or P would little constrain phytoplankton biomass during periods
when phytoplankton would otherwise be co-limited, or limited by the alternate
nutrient species. Furthermore, attempting to reduce phytoplankton production by P-
limitation via P load reduction may be difficult to achieve on a sustainable basis, given
the natural geological enrichment of phosphorus in aquifers within the Rotorua
catchment (Timperly 1986). Focus solely on N load reduction could potentially
5Lake Rotorua modelling
increase the risk of cyanobacterial blooms if there were periods of adequate P, and N-
limitation sufficient to induce proliferations of heterocystous species that could fix
atmospheric N to meet the shortfall in their nutritional requirements for N (Wood et
al. 2010).
Figure 2: Map of the Lake Rotorua catchment with details of ROTAN sub-catchments (from
Rutherford et al. 2011), and showing the BoPRC sampling site, the high-frequency monitoring
buoy and the Rotorua airport weather station. Mokoia Island is the closed circle in the centre
of the lake, and unnamed subcatchments are those without permanently flowing surface
streams. Unnamed sub-catchments have no permanently flowing surface stream.
6Lake Rotorua modelling
2.2 Lake model description
In this study, the one-dimensional (1D) hydrodynamic model DYRESM (version 3.1.0-
03) was coupled with the aquatic ecological model CAEDYM (version 3.1.0-06), both
developed at the Centre for Water Research, The University of Western Australia, to
simulate water quality in Lake Rotorua. DYRESM resolves the vertical distribution of
temperature, salinity, and density, and the vertical mixing processes in lakes and
reservoirs. CAEDYM simulates time-varying fluxes that regulate biogeochemical
variables (e.g., nutrient species, phytoplankton biomass). The model includes
comprehensive process representations for carbon (C), nitrogen (N), phosphorus (P),
and dissolved oxygen (DO) cycles, and several size classes of inorganic suspended
solids. Several applications have been made of DYRESM-CAEDYM to different lakes
(e.g., Bruce et al., 2006; Burger et al., 2007a; Trolle et al., 2008; Gal et al., 2009;
Özkundakci et al., 2011) and these publications have detailed descriptions of the
model equations.
The biogeochemical variables in CAEDYM may be configured according to the goals of
the model application and availability of data. In this study, three groups of
phytoplankton were included in CAEDYM, representing generically cyanophytes
(without N-fixation), diatoms, and a combined group termed chlorophytes. Particular
focus was placed on cyanobacteria because of their capability to form blooms, with
model output interpreted to provide a frequency distribution of different
cyanobacteria levels represented by their contribution to chlorophyll a. The
interactions between phytoplankton growth and losses, sediment mineralisation and
decomposition of particulate organic matter influence N and P cycling in the model as
shown in the conceptual model in Figure 3. Fluxes of dissolved inorganic and organic
nutrients from the bottom sediments are dependent on temperature and nitrate and
DO concentrations of the water layer immediately above the sediment surface.
Parameters are calibrated (i.e., specific) for each new application but with an
extensive parameter library now available from the large number of studies
undertaken with the model.
2.3 Model timesteps and baseline simulation period
In this study, DYRESM-CAEDYM was run at hourly time steps between July 2001 and
June 2009, with daily averaged input data and daily output data at 0900 h. The period
July 2005 to June 2009 was used for calibration of the model, and the validation
period was July 2001 to June 2005.
7Lake Rotorua modelling
(A) Atmosphere
Water column
Uptake
Internal phytoplankton-P PO43-
Excretion
Mortality
Inflow Outflow
Decomposition
Sedimentation/migration
POPL DOPL
Sedimentation
Sediment flux
Sediment flux
Sediment
(B) Atmosphere
Denitrification
Water column
Uptake
Internal phytoplankton-N NO3-
Excretion
Mortality
Uptake by sediment/denitrification
Inflow NH4+ Outflow
Mineralisation
Sedimentation/migration
Decomposition
PONL DONL
Sedimentation
Sediment flux
Sediment flux
Sediment
Figure 3: Conceptual model of the (A) phosphorus and (B) nitrogen cycles represented in
DYRESM-CAEDYM for the present study. POPL, PONL, DOPL and DONL represent particulate
labile organic phosphorus and nitrogen, and dissolved labile organic phosphorus and nitrogen,
respectively.
8Lake Rotorua modelling
2.4 Meteorology
Meteorological data required for the simulation period were obtained from the
National Climate Data Base for the Rotorua Airport climate station c. 50 m from the
Lake Rotorua shoreline. The data included air temperature (°C), shortwave radiation
(W m-2), cloud cover (fraction of whole sky), vapour pressure (hPa), wind speed (m s-1)
and rainfall (m) (Figure 4). Data are collected at Rotorua airport at various time
intervals from one hour to whole-day, and for the purposes of the model input were
standardised to daily average values except for rainfall, which was provided as a daily
total value.
2.5 Water balance
Surface inflow discharges to the lake were obtained from output of the ROtorua
TAupo Nitrogen model (ROTAN; Rutherford et al., 2011). Flows for nine streams of the
major Lake Rotorua sub-catchments were included, along with a tenth stream inflow
representing the sum of all minor surface flows from around the lake. Each of these
surface flows accounted for both stream and groundwater inputs from the respective
sub-catchments. Rainfall was removed from the meteorological input to the model,
and instead daily rainfall directly on the lake was represented as a surface inflow in
order to account for atmospheric deposition of N and P which would not otherwise be
accounted for in the rainfall input in the present model version.
Change in lake storage (ΔS) was calculated from water level recorder data provided by
BoPRC, multiplied by the water level-dependent lake area derived from hypsographic
curves provided by BoPRC.
9Lake Rotorua modelling
Figure 4. Meteorological data used as input to the DYRESM model (July 2001 – June 2009),
including short wave radiation (SW), cloud cover (CC), air temperature (T), vapour pressure
(VP), wind speed (U), and rainfall. Data were obtained from the Rotorua Airport climate
station (see text for details of transforming measured values to daily input data for model
input).
10Lake Rotorua modelling
Evaporation from the lake was calculated as a function of wind speed and air vapour
pressure from the daily average evaporative heat flux (Fischer et al., 1979 eqn 6.20)
using meteorological input data and water temperature:
( ( ( ) (1)
where:
Qlh is the evaporative heat flux in J m-2 s-1
P is atmospheric pressure in hPa
CL is the latent heat transfer coefficient for wind speed at a height of 10 m (1.3 x 10⁻³)
ρA is the density of air in kg m-3
LE is the latent heat evaporation of water (2.453 x 10⁶) in J kg-1
Ua is the wind speed in at 10 m height above ground level in m s-1
es(Ts) the saturation vapour pressure at the water surface temperature in hPa
ea is the vapour pressure of the air in hPa
The condition that Qlh 0 excludes condensation effects. For the purposes of
determination of water evaporated from the lake surface, a surface lake water
temperature was estimated from a fifth-order polynomial fit of surface water
temperature versus time of year using measured data from 2002-2009. The saturated
vapour pressure es(Ts) is calculated via the Magnus-Tetens formula (TVA 1972, eqn
4.1):
( ( ( )) (2)
where:
Ts is the water surface temperature in °C
The change in mass in the surface layer (layer N) due to latent heat flux is calculated as
(3)
where:
is the change in mass in kg s-1 (L s-1)
AN is the surface area of the lake in m²
LV is the latent heat of vaporisation for water (2.258 x 10 6) in J kg-1
The result of this calculation was multiplied by 86.4 to give daily evaporation (EL) in m3
d-1.
11Lake Rotorua modelling
Daily values for the outflow volume were calculated as a residual term of a water
balance for the simulation period:
∑( (4)
where:
is evaporation in m3 d-1
is change in storage in m3 d-1
The resulting flow was averaged over 15 days to remove any negative values. Derived
outflow was used for a DYRESM simulation over the period 2001–2009, and the lake
level output was compared to BoPRC water level recorder data. Due to a slight gradual
decrease in simulated versus observed water level, a small proportion of outflow (c.
3%) was removed for each day. This small discrepancy may be partly attributable to
differences between the estimated surface lake water temperature used to derive
evaporation for the water balance (Eqn 2), and the surface water temperature
simulated within DYRESM which was ultimately used to derive the water level. Multi-
day averaging of the outflow may have contributed additional uncertainty. Lake water
level recorded by the BoPRC water level gauge, and simulated in the final water
balance as water level output from DYRESM, were closely matched (Figure 54).
The estimated outflow to close the calculated water balance and the observed Ohau
Channel discharge were very similar (Figure 6). Given that derived outflow was based
on ROTAN-modelled inflows (as opposed to recorded stream flows), the match was
considered to be highly satisfactory. Differences between simulated and observed
outflow (e.g. 2004 – 2006) are likely due to minor differences between sub-catchment
surface flows as modelled by ROTAN, and real-world lake inflow volumes, as well as
minor differences in evaporation as described above.
12Lake Rotorua modelling
281.00 23.85
280.80 23.65
280.60 Lake level recorder 23.45
280.40 Model output 23.25
Lake height (m)
Lake level (MASL)
280.20 23.05
280.00 22.85
279.80 22.65
279.60 22.45
279.40 22.25
279.20 22.05
279.00 21.85
Jul-01 Jul-02 Jul-03 Jul-04 Jul-05 Jul-06 Jul-07 Jul-08
Figure 5. Simulated Lake Rotorua water level, and observed BoPRC water level recorder data.
3000000
15-day simulated ouflow
2500000 Observed Ohau Channel flow
2000000
Flow (m3)
1500000
1000000
500000
0
Jan-01 Jan-02 Jan-03 Jan-04 Jan-05 Jan-06 Jan-07 Jan-08 Jan-09
Figure 6. Simulated 15-day average Lake Rotorua outflow derived from the lake water balance,
and observed Ohau Channel flow.
13Lake Rotorua modelling
2.6 Surface inflow, groundwater and rainfall parameterisation
A total of 11 inflows to Lake Rotorua were simulated, including nine major streams, an
inflow representing the sum of all inflows from minor sub-catchments, and another
representing direct rainfall to the lake surface. All non-rain inflows were assumed to
represent both surface and groundwater inputs to the lake, in order to be consistent
with the modelling approach within ROTAN (Rutherford et al. 2011).
2.6.1 Temperature
Surface inflow temperatures for all major inflows other than Hamurana were
estimated using the method described in Mohseni et al. (1998):
( (5)
where:
Ts is the estimated stream temperature
Ta is the measured air temperature
α is the coefficient for the estimated maximum stream temperature
γ is a measure of the steepest slope of the function
β represents the air temperature at the inflection point
To estimate surface temperature of Hamurana Springs and minor cold inflows, a
cosine variation was applied to describe variations within each year:
Ts = Acos(ωt+σ +T0 (6)
where:
Ts is the derived water temperature in oC
A is the amplitude in m
ω is the angular frequency (2π/365)
σ is the phase angle
T0 is the mean water temperature in oC
t is time in days
For both temperature models, quality of fit was defined by the difference between
modelled water temperature and available in situ BoPRC measurements for each
stream. Model parameters were adjusted in order to minimise the root-mean-square
error (RMSE) and maximise the Pearson correlation co-efficient, using Microsoft Excel
Solver.
14Lake Rotorua modelling
Temperature of the rainfall inflow was set to be equal to the surface lake water
temperature defined in the water balance, so that rainfall was always inserted into the
uppermost water layer of the model.
2.6.2 Dissolved oxygen
Dissolved oxygen concentrations of all inflows were estimated as a function of water
temperature (Mortimer 1981) based on data from Benson and Krause (1980):
DO = exp(7.71 – 1.31ln(T + 45.93)) (7)
where:
DO is dissolved oxygen in mg L-1
T is water temperature in °C
2.6.3 Nutrients
Daily nitrate (NO3-N) concentrations for all major inflows were derived from
interpolation of weekly flow and nitrate load output from ROTAN. Ammonium (NH4-N)
and phosphate (PO4-P) concentrations were derived by linear interpolation between
monthly samples from BoPRC stream monitoring data to obtain daily values, as
outlined for other model applications to Te Arawa lakes (Burger et al., 2007; Trolle et
al., 2010; Özkundakci et al., 2011). As most streams monitoring is undertaken by Bay
of Plenty Regional Council under baseflow conditions, the interpolation method to fill
nutrient concentrations for days between monthly sampling may potentially
underestimate total nutrient loads; less so for nitrogen but particularly for particulate
forms of phosphorus (J. Abell, University of Waikato, unpubl. data). Labile organic
nitrogen and phosphorus concentrations (ONL and OPL, respectively) were calculated
from BoPRC monthly stream nutrient measurements and were evenly divided into
dissolved (D) and particulate (P) fractions using the equations:
DONL or PONL = (TN – NH4-N – NO3-N) / 2 (8)
DOPL or POPL = (TP – PO4-P) / 2 (9)
Labile dissolved and particulate organic carbon concentrations were calculated using
inflow labile organic nitrogen concentrations and a ‘Redfield’ molar ratio of 106:16 for
C:N, where:
DOCL or POCL = (DONL or PONL*106*M(C)) / (16*M(N)) (10)
where:
M(C) is the molar mass of carbon
15Lake Rotorua modelling
M(N) is the molar mass of nitrogen.
Nitrogen and phosphorus concentrations for the ‘cold minor’ inflow in the model were
calculated using similar methods to those for the major inflows, but using a volumetric
average for concentrations across all available minor inflow data.
Rainfall nitrate and phosphorus were set to constant concentrations of 0.285 and
0.013 g m-3, respectively, which with consideration of rainfall amount, equated to
concentrations typical of the Taupo Volcanic Zone (Hamilton 2005). No particulate or
dissolved organic nitrogen, phosphorus or carbon fractions were prescribed to the
rainfall inflow representing atmospheric deposition (Table 1).
Table 1. Flow and nutrient loads for all inflows over the calibration/validation period, 2001 –
2009. Symbols represented by NH4, NO3 and PO4 are dissolved nutrient concentrations
represented by NH4-N, NO3-N and PO4-P, respectively.
Inflow load for scenario NH4 NO3 Organic N PO4 Organic P Flow
-1
t yr m3 yr-1
Hamurana 0.8 56.3 5.1 6.2 0.2 7.494 x 10⁷
Waiteti 0.4 54.7 3.6 3.3 0.1 4.758 x 10⁷
Awahou 0.7 67.7 4.4 1.5 0.3 3.870 x 10⁷
Ngongotaha 1.0 66.3 10.2 2.2 0.9 6.049 x 10⁷
Waiowhiro 0.4 16.0 1.8 0.6 0.1 1.430 x 10⁷
Utuhina 2.6 61.2 10.2 2.7 1.4 6.630 x 10⁷
Puarenga 4.1 106.3 14.1 2.9 1.8 6.002 x 10⁷
Waingaehe 0.1 12.4 1.5 0.8 0.2 8.780 x 10⁶
Waiohewa 16.7 51.3 2.6 0.3 0.5 1.171 x 10⁷
Minor 54.8 143.4 0.4 2.9 1.5 4.881 x 10⁷
Rainfall 0.0 28.8 0.0 1.3 0.0 1.009 x 10⁸
Total 81.7 664.4 53.8 24.8 7.0 532562204
2.6.4 Phytoplankton
Those inflows not dominated by groundwater springs were prescribed a ‘seeding’
concentration of 0.1 μg L-1 chlorophyll a for the assigned cyanophyte and diatom
groups though the chlorophytes group was assigned zero concentration based on
mostly lower concentration in Lake Rotorua. The Hamurana, Awahou and rainfall
inflows were given a concentration of zero for each of the three phytoplankton
groups.
16Lake Rotorua modelling
2.7 Model calibration and validation
DYRESM-CAEDYM was calibrated against field data for a four-year period between July
2005 and June 2009 for variables of temperature, DO, PO4-P, TP, NH4-N, NO3-N and TN
at the water surface (0 m), at a depth of 15 m, and near the bottom (depth of 19 m) in
the lake, using monthly samples collected by BoPRC. Nutrient samples were analysed
by BoPRC using standard analytical methods (APHA, 2005). The three simulated
phytoplankton groups collectively contributed to a total simulated chlorophyll a
concentration, but with cyanophytes dominating during summer and
diatoms/chlorophytes during winter and early spring, in a sequence similar to what
has been observed previously in Lakes Rotorua (Paul et al. 2012) and Rotoiti (Von
Westernhagen et al. 2010). The sum of the chlorophyll concentrations for all three
groups was calibrated against surface chlorophyll a measured using an acetone
extraction procedure (Arar and Collins, 1997) carried out by NIWA (on contract to
BoPRC). Model parameters were adjusted manually using a trial and error approach
with values set to within literature ranges (e.g., Schladow and Hamilton, 1997; Trolle
et al., 2008). The model error, represented by the root-mean-square-error (RMSE) and
Pearson correlation coefficient (R) for each output variable, was quantified after each
simulation for which model parameter values were adjusted. Calibration continued
until there was negligible improvement in RMSE and R values with repeated model
simulations. Root-mean-square-error and R values were also compared to modelling
studies in the literature to assess an acceptable model error for prediction purposes.
A TLI value was calculated for each year of the simulation period. The relevant
equations for determination of the TLI are:
TLChla 2.22 2.54log Chla (11)
1 1
TLSD 5.1 2.27log (12)
SD 40
TLTP 0.218 2.92log TP (13)
TLTN 3.61 3.01log TN (14)
TLChla ,TLSD ,TLTP ,TLTN
1
TLI (15)
4
where:
17Lake Rotorua modelling
TLChla, TLSD, TLTP and TLTN represent the individual level trophic level indices for the
individual variables of chlorophyll a, Secchi depth, total phosphorus and total
nitrogen.
As Secchi depth is not explicitly included in the model, this variable was derived from a
model-predicted attenuation coefficient as:
α
z SD
Kd
(16)
where:
zSD is the Secchi depth (m)
Kd is the diffuse attenuation coefficient (m-1)
α is a constant (1.85 in this study) determined by comparing field measurements of
Secchi depth with corresponding values of Kd (RMSE = 0.859 m).
In CAEDYM, Kd is calculated as:
K d(CAEDYM) K w K a chla K POC POC K DOC DOC (17)
where:
Kw is the background extinction coefficient
Ka is the specific attenuation coefficient for chl a for each simulated phytoplankton
group (a)
KPOC and KDOC are the specific attenuation coefficients for particulate (POC) and
dissolved organic matter (DOC), respectively.
TLI output from the model was compared with observed data and calibration of
parameters was undertaken in DYRESM-CAEDYM until a satisfactory match was
achieved. We aimed to calibrate the model TLI within ± 0.1 TLI units of the measured
TLI. The final model parameters from the calibration were then fixed for model
validation over the period July 2001 – June 2005.
18You can also read