SWEEP-Water for Food Security, Women's Empowerment and Environmental Protection in East and West Belesa Project
←
→
Page content transcription
If your browser does not render page correctly, please read the page content below
Baseline Survey of SWEEP Project in East and West Belesa Woredas, North Gondar Zone, Amhara Region

                              BASELINE SURVEY REPORT On

SWEEP-Water for Food Security, Women’s Empowerment
 and Environmental Protection in East and West Belesa
                       Project

             Li’elena Research and Development Consultancy PLC (LRDC
                                 TEL: 0916-822882
                            E-mail: mojer93@yahoo.com

                                                                                          May 2018
                                                                                        Addis Ababa,
                                                                                            Ethiopia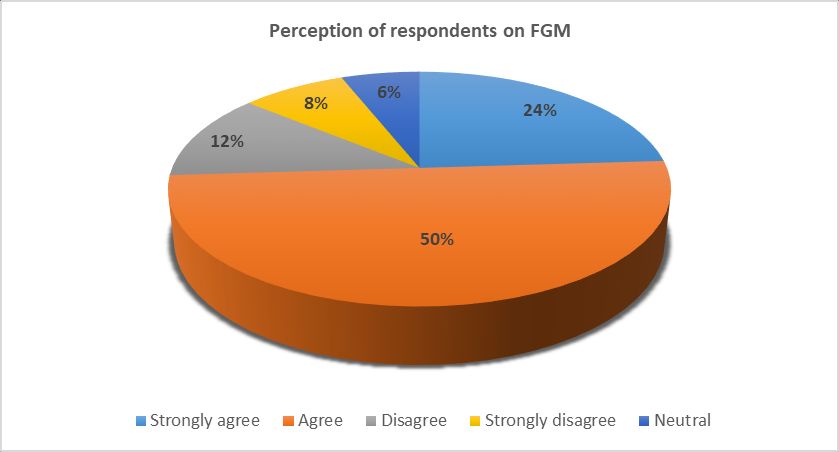
Baseline Survey of SWEEP Project in East and West Belesa Woredas, Central Gondar Zone

Acknowledgments

CARE Ethiopia has commissioned Li’elena Research and Development Consultancy PLC (LRDC) to carry out this
baseline survey for the project entitled ‘‘Water for Food Security, Women’s Empowerment and Environmental
Protection (SWEEP)’’ to be Implemented in East and West Belesa Woredas of Central Gonder Zone, Amhara
Regional State.

LRDC would like to thank CARE Ethiopia technical personnel at country office as well as at field office level for
investing their time and expertise throughout the entire process of this survey starting from inception, field
work planning, field data collection and giving feedback and comments on the draft report.

CARE Ethiopia and LRDC are grateful to Woreda level Partner Government offices which granted permission
for the study to be conducted in their community and provided information pertinent to the survey objectives.

Salient appreciation is extended to all the study participants, community representatives, mothers and fathers,
youth, persons with disabilities and others who participated in the discussion by providing all the necessary
information for the baseline survey.

Li’elena Research and Development Consultancy PLC (LRDC)

2|Page
Baseline Survey of SWEEP Project in East and West Belesa Woredas, Central Gondar Zone

                                                   List of Tables

Table 1: Demographic Characteristics of Respondents in West and East Belesa Woredas                     15

Table 2: Total Number of Months food needs met by Gender                                                17

Table 3: Total Number of Months food needs met by vulnerability status                                  18

Table 4: Environment changes/adaptation measures                                                        19

Table 5: Adaptation to Economic Shocks at household level                                               20

Table 6: Household Experience of Shocks from 2013/14 – 2016/17                                          20

Table 7: Household Coping Strategies in West and East Belesa Woredas                                    21

Table 8: Knowledge of Respondent Households on GBV                                                      22

Table 9: Experience of Respondents on Physical Violence and Sexual Harassment                           23

Table 109: Respondents View towards CM and FGM                                                          25

Table 11: Practice of FGM and CM among Respondent Households                                            25

Table 12: Access to Safe Water Supply among Surveyed Population                                         28

Table 13: Distance to Fetch Water among Surveyed Population in Wet Season                               29

Table 14: Distance to Fetch Water among Surveyed Population in Dry Season                               30

Table 15: Water Collection and Consumption of Water/day among Surveyed Population                       30

Table 16: Practice of Water Treatment at Household Level among Surveyed Populations                     32

Table 17: Irrigated land size, production and intensity of production in Last Harvesting Year           33

Table 18: Average labor-hours spent (% of activity) by men and women on household activities            35

Table 19: Average Hours Girls Spend in Household Chores                                                 35

Table 20: Average Hours Women Spend in Household Chores                                                 36

Table 21: Average Earning Amount in Birr among Surveyed Households in the Past Year                     37

Table 22: Involvement of Women in Political Leadership Positions                                        38

Table 23: Involvement of Women in Leadership Positions at Different Committees                          39

Table 24: The Role of Women in Expenditure and Income related Decision Making                           40

Table 25: Participation of Beneficiaries in Decision-Making Spaces                                      42

Table 26: Government Response of Local Communities Request                                              43

Table 27: Perception of respondents on the involvement of local community towards government planning   44

Table 28: Household Respondents Level of Satisfaction on Existing Government Services                   44

3|Page
Baseline Survey of SWEEP Project in East and West Belesa Woredas, Central Gondar Zone Acronyms and Abbreviations ADA Austrian Development Agency CM Child Marriage CGIAR Strategy and Result Framework, Global Hunger Index, Global Nutrition Report FAO Food and Agriculture Organization FDRE Federal Democratic Republic of Ethiopia FGD Focus Group Discussion FGM Female Genital Mutilation GBV Gender Based Violence GHI Global Hunger Index HTP Harmful Traditional Practice IFPRI International Food Price Measurement Index KII Key Informant Interview NRM Natural Resource Management PWD People with Disability RUSACO Rural Saving and Credit Cooperatives SDG Sustainable Development Goal SWEEP Water for Food Security, Women’s Empowerment and Environmental Protection WASH Water, Sanitation and Hygiene 4|Page
Baseline Survey of SWEEP Project in East and West Belesa Woredas, Central Gondar Zone

Operational Definitions

Adaptive measure: relates to any measure/s to be taken as a last resort for survival by each and every
household member during shocks and crisis.

Idir: is a social funeral institution whereby a group of people comes together on the basis of location,
occupation, friendship or family ties. Members contribute a certain amount of membership fee on a regular
basis and the money is deposited in banks or kept at one of the member’s house.

Female headed household: In this particular survey, a female headed household is defined as a female who
head the household for losing the male head from death, divorce or that the husband has left to find work
for long time or remains single, but becomes the sole bread winner of the household.

Food insecure household: a household having not enough food to feed all family members throughout the
year. In terms of frequency, a household which feeds family members less than three meals per day with
small amount.

Food sufficient household: a household having enough food to feed all family members throughout the
year. In terms of frequency, a household which feeds family members three meals per day with adequate
amount in each meal.

Major household expenditures relate to expenditure of relatively expensive items as household level. This
includes, but not limited to, buying clothes, furniture, equipment, electronic items, etc

Minor household expenditures relate to expenditure of relatively less expensive/cheap items at household
level. This includes buying food for daily consumption.

Person with disability: a person who has long term physical or sensory impairments which in interaction
with various barriers will hinder the full and effective participation in society in an equal basis with others.

Formal (government led) decision-making spaces: includes participation of women in Kebele and woreda
level participation

Informal (civil society led, private sector led) decision-making spaces: relates to participation in Idir, Iqub,
committee and others

Safe water supply: indicates a water supply where the source will be protected hand-dug well with fitted
pump

Marginalized beneficiary group: relates to the deprived segment of the community who are highly
vulnerable to social, economic and environmental shocks and disasters, but with little/no support from the
government or other stakeholders to cope with shocks.

5|Page
Baseline Survey of SWEEP Project in East and West Belesa Woredas, Central Gondar Zone

                                                                       Table of Contents
Acknowledgments ...................................................................................................................................................... 1
List of Tables............................................................................................................................................................... 3
Acronyms and Abbreviations...................................................................................................................................... 4
Operational Definitions .............................................................................................................................................. 5
Executive Summary .................................................................................................................................................... 7
I. Introduction ................................................................................................................................................. 10
II. Objectives of the Baseline Survey .......................................................................................................... 12
2.1. General Objective .................................................................................................................................................... 12
2.2. Specific Objectives ................................................................................................................................................... 12
III. Methodology and Approach .................................................................................................................... 13
3.1. General Approach.................................................................................................................................................... 13
3.2. Quantitative Survey ................................................................................................................................................. 13
      3.2.1 Study Coverage ................................................................................................................................................. 13
      3.2.2. Sample size determination .............................................................................................................................. 13
      3.2.3. Sampling procedure ......................................................................................................................................... 14
      3.2.4. Survey Questionnaire and Procedures ............................................................................................................ 14
      3.2.5. Selection of Enumerators and Training ........................................................................................................... 14
      3.2.6. Data verification and cleaning ......................................................................................................................... 14
3.3. Qualitative Data Collection ...................................................................................................................................... 15
3.4. Document Review ................................................................................................................................................... 15
3.5. Data management and analysis .............................................................................................................................. 15
3.6. Ethical Considerations ............................................................................................................................................. 16
IV. Results and Discussion ..................................................................................................................................... 17
4.1. Demographic Characteristics of Respondents .................................................................................................. 17
4.2. Impact: Chronically food insecure households in Belesa woredas have improved food security and resiliency 18
4.2.1.      Food Security of Surveyed Households .......................................................................................................... 18
4.2.2.      Capacity to Adapt to Environmental and Economic Shocks ........................................................................... 20
4.2.3.      Household Hunger Scale, Shocks and Coping Mechanisms ........................................................................... 23
4.2.4.      Gender based violence and HTPs ................................................................................................................... 24
4.3. Outcome 1: Improved access to water resources for domestic consumption and productive use .................... 32
4.3.1.      Access to Water Service ................................................................................................................................. 32
4.3.2.      Water Storage and Management ................................................................................................................... 35
4.3.3.      Water Treatment ............................................................................................................................................ 36
4.3.4.      Irrigated Land Size, Intensity and Productivity of the Study Woredas ........................................................... 37
4.3.5.      Women and Girls Workload at Household Level ............................................................................................ 39
4.4. Outcome 2: Marginalized groups empowered to contribute productively in the household and community .. 42
4.4.1.      Income of Marginalized Beneficiaries ............................................................................................................ 42
4.4.2.      Rural Women Involvement in Leadership Positions ....................................................................................... 43
4.4.3.      Attitude and Perception of Communities in Women’s Key Leadership Position ........................................... 44
4.4.4.      Women in Decision Making Practices ............................................................................................................ 45
4.5. Outcome 3: Local government capacitated and community empowered ......................................................... 47
4.5.1.      Participation of Beneficiaries in Decision-making Spaces .............................................................................. 47
4.5.2.      Government Response towards Community Request ................................................................................... 48
4.5.3.      Beneficiary Level of Satisfaction with Government Services ......................................................................... 49
V. Conclusions and Recommendations ................................................................................................................. 50
5.1. Conclusions .............................................................................................................................................................. 50
5.2. Recommendations................................................................................................................................................... 50
VI. Annexes .............................................................................................................................................................. i
6.1. Project Result Framework/Matrix .............................................................................................................................. i
6.2. Case Studies................................................................................................................................................................ i

6|Page
Baseline Survey of SWEEP Project in East and West Belesa Woredas, Central Gondar Zone
Executive Summary
Background: CARE Ethiopia, with the financial support from the Austrian Development Agency (ADA), will
implement a three years’ project entitled “Water for Food Security, Women’s Empowerment and
Environmental Protection (SWEEP)” Project in East and West Belesa Woredas of Central Gonder Zone, Amhara
Regional State. The SWEEP project will address the socio-economic and environmental problems causing food
insecurity in East and West Belesa, including poor access to water supply and environmental degradation;
social barriers and gender inequality; as well as limited livelihood opportunities and low productivity. As part of
the inception phase of the project, this particular baseline survey has been carried out with the ultimate aim of
gathering evidence from different sources and set benchmarks and baseline values for each project outcome
indicator.
Objective: This particular baseline study aimed to assess the existing situation of the study woredas - paying
emphasis on food security and resilience; water supply; and participation and income of marginalized rural
women and girls, people with disabilities and unemployed youth - to inform project planning and establish
bassline value of project outcome level indicator.
Methods: A community based cross sectional study design with quantitative and qualitative data collection
methods were employed. A multistage cluster sampling method was employed to select study subjects
where a total of 845 (with 99.9 % response rate) households were included in the study. Additionally, study
populations were reached through FGDs and KIIs qualitative research methods. The field study took place
for ten days commencing from 29 April to 08 May 2018. The quantitative data were analyzed using SPSS
Version 20 for windows, while content/thematic analysis for the qualitative data was used.
Results
The results indicate that neither of surveyed households met food needs of their households in all
the 12 months of the past production year. They reported that they were in shortage of food [food
insecure] for five months [June to October] of the past production year. It means that all surveyed
households had food gaps for five months in the last production year. However, the food gap span
for vulnerable households (female headed households and persons with disability) has been
extended to seven months (April to October) in the last production year.
Results of this survey showed that despite having perceived changes in environmental
changes/shocks, a large share of respondents in both woredas did not take any adaptive measures.
Overall, only 7% of households/respondents undertook any adaptation measures. The
overwhelming majority (93%) of respondents did not adapt to the perceived changes/shocks in
environment.
The results indicate that all surveyed households, 845 (100%) experienced multiple types of
economic shocks last year. The two most common ones as reflected by all household survey
respondents included increase in food prices (100%) in the local market and decreased amount of
cash (100%).
Results of the survey indicated that in all the past four years household respondents experienced
some shocks, but the year 2014/15 was the year that was most remembered by the overwhelming
majority of the respondents who experienced severe food and income related shocks. This is
especially true to 100% of households who reported shocks including crop loss (drought, rain failure,
flood etc), livestock disease or mortality as well as other unexpected shock (human illness, death
etc.). Both FGD participants and key informants identified women in general and female headed
7|PageBaseline Survey of SWEEP Project in East and West Belesa Woredas, Central Gondar Zone
households, landless and unemployed women and girls in particular, children, older persons and
people with disabilities as most vulnerable to disaster risks in both woredas.
The results of this survey indicate that there is a good knowledge and understanding of respondents
towards identifying the common types of GBV perpetuated in the areas. Close to 53 % of
respondents reported that abduction, sexual harassment, rape, polygamy, domestic violence
(insulting and beating) and widow inheritance are the common GBVs affecting girls and women in
the areas. Around 46% of respondents reported that rape and polygamy are common forms of GBV
practiced in their areas. As far as the practice of GBV in the study woredas is concerned, significant
proportion of respondents (72%) reported that there has been physical violence perpetrated on girls
and women in the areas.
The results of this particular baseline survey indicated that the overwhelming majority of study
households demonstrated knowledge and awareness on the pervasive effects of HTPs on the
wellbeing of young girls and women. Close to 77% and 62 % of household respondents respectively
reported that FGM and Child Marriage (CM) are harmful to young girls and women. In contrary to
this, a significant proportion of the respondents 23 % and 38 % respectively reported that FGM and
CM do hardly bring any harm to young girls’ and women’s wellbeing.
The results of this survey indicate that 24.9% of respondents reported that FGM had been
performed in their households in the past five years, while 19.9% reported of a daughter being given
away to marriage in the past years. In a similar vein, 37.6 % and 60.5% of respondents respectively
had come across their neighbors practicing FGM and child marriage neighbors in the previous years.
The results of the survey revealed that the main source of water supply for domestic use were
protected hand-dug well fitted with pump (48%), surface water (31%) and unprotected hand-dug
well (18%). Roof water harvesting became the main source of water for the remaining 4% of
respondents. None of the households’ had access to water within 1 Kilometer radius or less than 30
minutes, which is not at the standard set to rural communities. Systematic analysis of the data
suggested water consumption per household/day among the surveyed households is below 10 liters
which is below the minimum standard set to rural community of 25 liters/day.
A significant proportion of respondents (86%) reported that women and girls spent more than 8
hours a day for household chores while men and boys spent only 2-4 hours a day for similar
activities. Reflections of FGD and KII participants also give affirmation that women and girls shoulder
almost all of the household activities including time consuming chores, which were fetching water
and wood. In possible explanation, this survey concludes that women do close to 100% of the
household chores, but men and boys share some of these activities.
The results of this survey indicate selling crops, domestic animals, animal products and labor works
are the most common source of income by an overwhelming majority of respondents in the past
year. As far as earing amount in birr is concerned, a significant proportion of households (31%) had
an earning income of less than 4000 birr in the past year. Close to 29% and 22% of respondents
reported earning an amount of Birr 4000 and 5500 on average respectively in the past year. Only
17% of respondents had an earning amount of birr 6000 in the past year. Systematic data analysis
indicates that among those 31% of respondents having less than 4000 birr earning income in last
year, the overwhelming majority (96%) were female headed households.
This particular survey documented that women were grossly under represented at the woreda and
kebele level, with very low percentages of women in political positions across the board.
8|PageBaseline Survey of SWEEP Project in East and West Belesa Woredas, Central Gondar Zone
The results of this particular baseline survey indicate that the role of women in making decisions of
major household expenditures and income is very low. Only 12% and 9% of respondents
respectively reported that women participated in decision making of major expenditure and income
related issues. All major issues related to expenditure (88%) and income (91%) are entirely
dominated by men/husbands. The involvement of women in minor household expenditure and
income issues is rather high. The data indicates that close to 75% and 91% of respondents reported
that women equally/jointly decide on minor household expenditure and income related issues
respectively.
The results of this survey indicate that only 30% of household respondents did participate in
decision making in formal (government-led) and informal (civil society led, private sector-led)
sectors.
The results of the survey indicate that more than half (56%) of respondents agreed with the view
that women are able to hold and play leadership roles at community level if they are given
opportunities, while around 14% of the respondents did not agree with this view. The remaining
30% of respondents were neutral. Among those 14% of respondents who disagree with women’s
key leadership positions, the overwhelming majority (76%) did believe that women are not socially
accepted to assume key leadership positions. Around 58% of the respondents believed that the
culture and tradition do not allow women to assume key leadership positions.
Conclusions and Recommendations
The result of the survey documented the dire situation of the overwhelming majority of the study
populations who were unable to feed their households throughout the 12 months of the year. Household
respondents faced critical challenges of food shortage for 5-7 months in a year time. Respondent
households experienced frequent shocks and adopted their own positive and negative coping mechanisms.
The overwhelming majority of household respondents earned meager daily income of birr 2.33 per
person/day. The earning income of female headed households was worse by far, less than 2 birr a day.
The results of the survey, pertaining to the existing social norms and practices, documented a good progress
in demonstrating knowledge and awareness of respondents on pervasive effects of HTP and GBVs on the
wellbeing of women and girls in the study woredas, but the practice is still there. There is also a pervasive
practice of gender roles that favor men and boys to the productive sphere while women and girls shoulder
the burden of household chores that consume significant amount of their energy and time (more than 8
hours a day).
Access to safe water is far below the standard. The significant proportion of respondents used unprotected
water sources during rainy and dry seasons. Equally important, water consumption per household/day
among the surveyed households was far below the minimum standard set to rural communities.
The survey, so far as participation and decision making practices of women is concerned, documented that
the involvement of women in leadership positions were quite minimal. Equally important, women had no
decisive role in production and livelihood making as well as financial decision making activities- but are
substantially involved in decision making in areas of minor household expenditure and income.
To sum up – based on the critical findings and conclusions of the baseline survey, the following
recommendations are drawn.
In order to improve livelihoods and resilience usually caused by drought, expansion of irrigation
farming is advisable, enhance the financial support services-saving and credit and facilitate jobs
creation for unemployed and vulnerable community members mainly the poor women and girls;
9|PageBaseline Survey of SWEEP Project in East and West Belesa Woredas, Central Gondar Zone
Intervention to improve access to water for the local community- access to water reduces crises
especially during drought seasons, the critical shortage of water for human, livestock and farming
activities. Rehabilitation and maintenance of the dysfunctional existing water schemes are also
important;
The problems with the local people in regards to disability are lack of public understanding, lack of
information on number and status of disabilities, lack of access to basic needs such as vocational
training placement, health facilities, education. Thus addressing these challenges through creation
of access to safe water supply, since people with disabilities are the most affected and vulnerable to
the problem of accessing safe water supply and facilitation of inclusive intervention-both in WASH
services and livelihood interventions are required;
Women empowerment related interventions are highly required (promotion, advocacy and practice
of policies and laws that favor women).
With regards to improving decision of women; women empowerment interventions; familiarization
of policies and legislative issues allowing access and control of resources are required for
communities, religious leaders, elders; including capacity building activities for law enforcement
bodies;
Facilitate access to finance (loan and credit services) for poor women, unemployed youth and other
vulnerable community members to engage in IGAs.
Capacity building interventions for key and relevant local government offices to help fill gaps related
to knowledge, skills, understanding and practices on design and implementation of integrated
development initiatives particularly for the poor, vulnerable and marginalized groups.
Support and encourage vulnerable community groups to undertake appropriate and suitable
environmental and economic shock coping mechanisms.
I. Introduction: The SWEEP Project in a Nutshell
10 | P a g eBaseline Survey of SWEEP Project in East and West Belesa Woredas, Central Gondar Zone CARE Ethiopia, with the financial support from the Austrian Development Agency (ADA), will implement a three years’ project entitled “Water for Food Security, Women’s Empowerment and Environmental Protection (SWEEP)” Project in East and West Belesa Woredas of Central Gonder Zone, Amhara Regional State. The SWEEP project will address the socio-economic and environmental problems causing food insecurity in East and West Belesa, including poor access to water supply and environmental degradation; social barriers and gender inequality; as well as limited livelihood opportunities and low productivity. According to the intervention logic of the project, this will be possible through three interrelated and interconnected efforts: (1) improving access to water resources for domestic consumption and productive use and enhanced and sustainable productivity of land for varied uses; (2) empowering marginalized groups to contribute productively in the household and community; and (3) capacitating local government and communities to initiate and lead community development and adaptive measures. Within the anticipated three years’ timeframe, the project aims to address around 131,834 chronically food insecure and drought affected people including marginalized rural women and girls (14-17 years), people with disabilities and unemployed youth (15-29 years). The project will also attempt to benefit an additional 2,365 government political appointees and woreda experts through capacity building schemes. The project will be implemented in 20 selected kebeles of East and West Belesa woredas that will be selected on the basis of the given criteria and with active participation and involvement of local government structures including the two woreda steering committees. As part of the inception phase of the project, this particular baseline survey has been carried out with the ultimate aim of gathering evidence from different sources and set benchmarks and baseline values for each project outcome indicator. 11 | P a g e
Baseline Survey of SWEEP Project in East and West Belesa Woredas, Central Gondar Zone
II. Objectives of the Baseline Survey
2.1. General Objective
The main objective of the assignment was to assess the existing situation of the study woredas - paying
emphasis on food security and resilience; water supply; and participation and income of marginalized rural
women and girls (14-17), people with disabilities and unemployed youth (15-29) - to inform project planning
and establish bassline value of project outcome level indicator.
2.2. Specific Objectives
Most importantly this particular baseline study aimed to:
Assess food security (including livelihood bases) and resilience situations among food insecure
households;
Assess vulnerability and adapting capacity/coping mechanisms of households to environmental and
economic shocks/hazards;
Assess access and coverage of safe water supply for domestic and productive use at woreda and
kebele levels;
Assess the prevailing discriminatory gender based social norms, barriers and power relations
affecting the socio-economic, physical and psychological wellbeing of women and girls and
vulnerable people;
Assess access to and control (including decision making) of resources (including economic and
natural resources) at household and community levels in the surveyed communities;
Assess inclusiveness of persons with disabilities (PWDs) and other marginalized groups in socio-
economic interventions;
Assess the practice of social accountability ensuring mechanisms by duty bearers and holders in the
surveyed Woredas; and
Undertake synthesis of basic indicators in relation to CARE International and Country Office level
indicators
12 | P a g eBaseline Survey of SWEEP Project in East and West Belesa Woredas, Central Gondar Zone
III. Methodology and Approach
3.1. General Approach
The baseline study utilized a mixed-method, cross-sectional design that included quantitative (household
survey using representative sampling) and qualitative (using purposive sampling) data collection methods and
tools for the collection and analysis of primary data. Also, extensive review of documents was undertaken to
augment the quantitative and qualitative results. The field study took place for ten days commencing from 29
April to 08 May 2018.
3.2. Quantitative Survey
3.2.1 Study Coverage
This particular baseline study has been undertaken in 10 randomly selected Kebeles (five Kebeles for each
study Woreda) using the following inclusion criteria:
All sampled kebeles in the baseline study, but accessible to data collection;
Marginalized rural women and men in chronically food insecure and drought affected households;
Marginalized rural girls and boys (14-17 years) in chronically food insecure and drought affected
households;
Rural people with disabilities in chronically food insecure and drought affected households; and
Rural unemployed youth (15-29 years).
3.2.2. Sample size determination
Given that the estimated total population of the study woredas, which was 333,430 (195,750 for west Belesa
and 137,680 for East Belesa woreda) during the time of the survey, the sample size had been determined by
using the following formula:
Where:
D = design effect, which is 2
P1= the estimated proportion total population at the time of the baseline survey.
P2 = is the size of the magnitude of change desired to be able to detect or the percentage change
that the project envisaged, in this case population that the project wants to reach, perhaps some
years (end of the project) from now.
P = (P1 + P2)/2
2 = (P2-P1)2
Z1- = the z-score corresponding to the probability with which it is desired to be able to conclude
that an observed change of size (P2-P1) would not have occurred by chance; and
Z1- = the z-score corresponding to the degree of confidence with which it is desired to be certain
of detecting a change of size (P2-P1) if one actually occurred.
= 0.05 (Z1-a = 1.65) and = 0.20 (Z1-b = 0.84)
Δ2 = 0.05 2
13 | P a g eBaseline Survey of SWEEP Project in East and West Belesa Woredas, Central Gondar Zone Therefore, the total sample size has become 845 for both study Woredas of East and West Belesa. Sample size has been distributed based on Probability Proportional to Size (PPS) for each study Woreda so that around 499 households have been surveyed in West Belesa while 346 households have been consulted in East Belesa Woreda. 3.2.3. Sampling procedure A two-stage cluster random sampling method has been employed. The two intervention Woredas (East and West Belesa Woredas) have already been known where the intended project will be implemented. Kebele selection: Given the maximum sample size of 845 households to this particular baseline survey, we sampled 10 kebeles among the 20 project intervention kebeles – 5 kebeles from each study woreda have been drawn. The proposed 10 kebeles1 have been selected randomly based on Probability Proportional to Size (PPS) from West Belesa and East Belesa Woredas. Household selection: In the second stage, simple random sampling method has been applied to select households within the selected clusters/kebeles for interviews that fulfilled the inclusion criteria. Following the completion of the training, the survey team prepared lists of all households in the randomly selected kebeles/clusters in collaboration with the kebele administration/leaders and representative of CARE Ethiopia. Then, using a random number table, the team selected the required households for each selected cluster between 1 and the last number which corresponded to the listed households. Once the households were selected, the survey team has carried out collecting the required information through face to face interview from the nearest randomly selected household. 3.2.4. Survey Questionnaire and Procedures The quantitative data collection method and tools depended on household survey and a structured questionnaire was designed to facilitate data collection, electronic data entry and analysis with pre-coded responses. The questionnaire was administered to the household heads or representative household members in the sample kebeles. A multiple response questions were utilized to simplify field level data collection. A master copy of the questionnaire was prepared in two languages (English and a translated version of Amharic) to make communication between the data collectors and the respondents simple and clear. The questions were very direct and simple to be understood by enumerators and supervisors. 3.2.5. Selection of Enumerators and Training Ten data collectors were identified and selected based on their proficiency in communication, educational background and prior experience in similar works. The data collectors were from the study woredas so as to maximize the advantage of local knowledge and experience and to minimize communication gaps and other complications. CARE Ethiopia Project field office supported the evaluators in the identification and deployment of competent, responsible and experienced enumerators and supervisors. Data collectors were provided with training on the overall objective of the assessment, the contents of the questionnaire and some important interview procedures, skills and techniques of household survey. 3.2.6. Data verification and cleaning Rigorous data validity and consistency checks were made as part of the data cleaning exercises before starting the analytical work. For more in-depth cleaning, the SPSS data “EXPLORE procedure” was employed for data 1 Study Kebeles in East Belesa: Bursan, Chama-Korach, Tili, Tertawa and Achikan. Study Kebeles in West Belesa Woreda: Addisalem, Kalay, Talay,Shura and Diquana. 14 | P a g e
Baseline Survey of SWEEP Project in East and West Belesa Woredas, Central Gondar Zone
screening. Outlier identification and description and evaluation of differences among sub-populations (groups
of cases) and also check for an internal consistency of the data were done as part of the data cleaning exercise.

3.3.    Qualitative Data Collection
The required qualitative data have been gathered through focus group discussions (FGDs), key informant
Interviews (KIIs), case stories, and observations. Accordingly, 14 FGDs each discussion involving 8 to 12
discussants on average 12 KIIs and 2 case stories were conducted. Women and men groups, unemployed
youth, people with disabilities, sector offices and government officials (Woreda and Kebele Administrations,
Water Resource Development Office Micro and Small Enterprises Development Office, Social Affairs Office,
WASCHO Committee members etc) were engaged in the FGD, KII and case stories.
3.4.    Document Review
Internal documents related to the project were reviewed and analysed in detail. This included similar studies
and assessments conducted in the zone, the region and at national level, national, regional and local
development policy, strategy, guidelines, statistical reports, and other government directives, development
plans, technical guidelines, the GTP, MDG and other relevant documents. Furthermore, available documents of
both internal and external development experiences, lessons, practices, opportunities and challenges related
to specific objectives of the baseline study were reviewed and analysed.

3.5.    Data management and analysis
The consulting team has started checking, validating and correcting data at field level with strict supervision
and cross-checking the information generated by questionnaire. The evaluators played the supervisory role by
making day-to-day follow-up on data collectors, mentoring them and reviewing information generated on a
daily basis to identify corrections to be made. This has allowed correction of inconsistent information at field
level before departing from the project area and making of timely correction of data gaps. Qualified and
experienced data coding and editing statistician was employed to speed up the study design and data entry
processes and to maintain the required data quality. The quantitative data was processed using SPSS. The
quantitative information was presented in bi-variant tables, frequency distribution, rates and ratios as well as
cross-tabulation.
The document review results were grouped, categorized and analysed based on their similarities and
reinforcement of each other. Therefore, facts, figures and similar experience and lessons collected from
different source documents were grouped and assembled according to similarities and have become facts and
evidences for triangulation of the quantitative and qualitative information. The team has developed
appropriate note taking template for organizing and analysing the reviewed documents.
The qualitative information collected through the different discussion session were transcribed, coded,
reduced/expanded and summarized as deemed necessary. The qualitative data were analysed by drawing
inferences from the views expressed in each FGD and KIIs. To substantiate points, direct quotes were provided
whenever appropriate.
Synergy among the different methods and tools used to collect the information was maintained by cross-
checking information across all methods. More specifically, the interview facilitators were instructed to go
through the notes and recordings taken and summarize key points and identify quotations and compress long
narratives into summary points. Key points were identified and organized into topical areas and commonly
occurring topics and issues were systematically listed. These key points built up as part of the assessment
process. Codes describing separate categories of similar responses were developed with description (labels) for
each of them. The coding has helped the team in making comparisons between groups and individuals during
analysis. Figures, pictures and relevant opinions from different groups were labelled to help identify
associations with similar results from other narrative discussions.

15 | P a g e
Baseline Survey of SWEEP Project in East and West Belesa Woredas, Central Gondar Zone

3.6.    Ethical Considerations
As a general rule, and as this baseline survey involved people (especially children and women), the study team
approached the assignment in careful and responsible ways to avoid any forms of unethical contacts and
approaches. Approaches and practices that could possibly inflict any physical, emotional, psychological and
mental harm on the respondents were not used under any circumstances. While conducting the field works,
the evaluation team and data collectors were instructed to protect the study participants from any harm. The
qualitative discussions were moderated by qualified and experienced evaluation team members.
Accordingly, ethical principles and guidelines were well addressed by using informed consent, allowing the
participants to withdraw any time from the study and by approaching and treating the respondents in a
culturally appropriate manner. Hence, data collectors were provided with special guidance during the data
collection process. Moreover, they were informed about the need for confidentiality, personal safety and
dignity of respondents. As a result, there was no single incident of dissatisfaction or complaints from the study
respondents at all of the study sites resulting from unethical procedures or ill-treatment perpetrated by any of
the facilitators or data collectors.

16 | P a g e
Baseline Survey of SWEEP Project in East and West Belesa Woredas, Central Gondar Zone

                                       IV.    Results and Discussion
4.1.       Demographic Characteristics of Respondents
A total of 845 study subjects responded to the interview with a 100% response rate from both study Woredas
to assess the current situation of food security and resilience; water supply; participation and income of
marginalized rural women and other disadvantaged segments of the population. From the total respondents
499 (59%) were from West Belesa and the remaining 346 (41%) of the respondents were from East Belesa
Woreda. The median age of respondents was 33 years. The average family size was 5.6 persons per household.
The majority of the respondents (73%) were married while 19% and 8% of the households were
divorced/separated and widowed women respectively. With regards to the vulnerability status of respondent
households, 30% of the respondents were female headed households, while 1% of respondents were persons
with disability.
As far as the educational status of respondents is concerned, 25% of respondents were illiterate while 33% of
the respondents were able to read and write only. Around 31% and 11% of the respondents respectively
completed primary and secondary schooling. In conclusion, the educational status of the significant proportion
of the respondents (59%) was very low.
Table 1: Demographic Characteristics of Respondents in West and East Belesa Woredas (N=845), May
2018
                                                                        Woreda
Socio-demographic variables                               East                West B                Total
                                                         Belesa               elesa
                                                   #              %      #             %       #            %
Sex                       Male                     91             29    159            30     250           30
                          Female                   255            71    340            70     595           70
Age                       14-29 years               34            10     50            10      84           10
                          30-45 years              243            70    319            64     562           67
                          46-65 years              69             20    130            26     199           24
Religion                  Orthodox                 319            92    479            96     798           94
                          Muslim                   27             8      20            4      47            6
Educational status        Illiterate               83             24    130            26     213           25
                          Able to read and write   111            32    170            34     281           33
                          Grade 1-4                70             20     99            20     169           20
                          Grade 5-8                41             12     50            10     91            11
                          Grade 9 10               41             12     50            10     91            11
Marital status            Married                  242            70    379            76     621           73
                          Widowed                  77             22     80            16     157           19
                          Divorced                 27             8      40            8      67            8
Head of household         Male headed              272            70    351            76     623           70
                          Female headed            104            30    148            24     252           30
Persons with disability                            5              1      5             1      10            1
                     Total                         346            100   499            100    845           100

17 | P a g e
Baseline Survey of SWEEP Project in East and West Belesa Woredas, Central Gondar Zone
4.2. Impact: Chronically food insecure households in Belesa woredas, Central Gondar Zone of
Amhara regional state have improved food security and resiliency
4.2.1. Food Security of Surveyed Households
Food security is a difficult concept to measure and it is accordingly difficult to communicate food security
results2. One important reason for this will be the different approaches to measure food security by
international organizations such as the UN (SDGs), FAO (State of Food Security and Nutrition in the World)
and CGIAR (Strategy and Result Framework, Global Hunger Index, Global Nutrition Report)3. The FAO
operationalizes food security into food availability, physical and economic access, utilization and stability.
The SDGs demand new sets of food security indicators to measure results according to the targets defined
under SDG2 (no hunger). Another frequently used food security measure is the Global Hunger Index (GHI),
where IFPRI et al. combine the four indicators: undernourished people, child wasting, child stunting and
child mortality4.
For this baseline survey, the following definition of the FAO which defines food security as ‘’a situation that
exists when all people, at all times, have physical, social and economic access to sufficient, safe and
nutritious food that meets their dietary needs and food preferences for an active and healthy life’’ was used.
Accordingly, as indicated in table 2 below, the baseline survey finding shows that none of the households
were food secure irrespective of any socio-demographic variables and vulnerability status. In other words,
the finding reveals that all 845 (100%) surveyed households in both woredas were food insecure.
Despite using this broader definition, this particular baseline survey also used two categories [Not enough
food (households having meals below three times a day and with small amount of each meal) and enough
food (households having at least three meals a day with adequate food portion in each meal). The
assessment has been made using a calendar as visual aid for the respondents to tell the number of meals
that their household members were served per day in each of the 12 months of the past year. The result
indicates that all 845 [100%] households were unable to feed their household members enough food for 5
months (June – October) of last year. It means that all surveyed households had food gaps for five months in
the last production year. However, systematic analysis of the data indicates that the food gap span for
vulnerable households (female headed households and persons with disability) was even greater and
extended to seven months (April to October) in the last production year. The following table (table 2 and 3)
present the food security status of surveyed households by gender in the last year.
Table 2: Number of Months food needs in West and East Belesa Woredas (N=845), May 2018
Gender
Months Food security status Male Female Total
# % # % # %
September -August Enough food throughout the year 0 0 0 0 0 0
June-October Not enough food (5 months) 246 97 352 60 598 71
April-October Not enough food (7 months) 8 3 239 40 247 29
Total 254 30 591 70 845 100
2
Norwegian University of Life Sciences, Food security indicators: How to measure and communicate results, 2018.
ISSN: 1892-8102
3
CGIAR. 2017. Strategy and Result Framework.
https://cgspace.cgiar.org/bitstream/handle/10947/3866/2pager.pdf?sequence=6
4
WFP and WHO. 2017. The State of Food Security and Nutrition
www.fao.org/fileadmin/templates/cfs/Docs1314/rai/CFS_Principles_Oct_2014_EN.pdf.
18 | P a g eBaseline Survey of SWEEP Project in East and West Belesa Woredas, Central Gondar Zone
Table 3: Number of Months food needs met by vulnerability status (N=845), May 2018
Months Food security status Vulnerability status
Head of Persons Other Aggregate Total
Household with Respondents
Disability
M F M F M F M F T
# # # # # # # % # % # %
September- Enough food 0 0 0 0 0 0 0 0 0 0 0 0
August throughout the year
June- Not enough food (5 0 15 0 0 246 337 246 29 352 42 598 71
October months)
April- Not enough food (7 0 237 8 2 0 0 8 1 239 28 247 29
October months)
Reflections of FGD and KII participants give evidence for contributing factors that increase the food
insecurity of households in the study woredas. According to the reflections, low agricultural productivity
(very low crop yields), very small household arable landholdings (0.5 ha) for an average household size of 5.6
persons, as well as inadequate/unavailability of improved seeds, fertilizers and pesticides in the study
woredas were major contributing factors for low productivity, thereby increasing the vulnerability of a
number of households. The interviews with experts in the East Belesa Woreda Agriculture office show that
last year 23,081 (3,924 female-headed) households were registered as food insecure households with
critical food shortage. People with disability, landless communities, and households with no/limited assets
were highly affected by the crisis. Similarly, as explained by the woreda expert from West Belesa Agriculture
office, last year there were 29,501 (5,700 female) households registered as food insecure. About 500
persons with disabilities from both woredas were targeted and supported by aid agencies and government.
Information obtained from FGDs and key informants reveals that the situation of food security in the
different kebeles of the woreda (Chama Korach, Bursa, Achken, Tili and Tartarowa) is more or less similar. In
all these kebeles food security is a critical problem for the local people, especially for those with low income,
and for vulnerable people, including persons with disabilities. The problem is more prevalent during summer
seasons starting from the month of mid-June till mid-October every year. Informants confirm that some of
the relatively low income community and highly vulnerable households have experienced deaths because of
the severe hunger of the summer season.
Available secondary sources reviewed also documented similar results pertaining to factors contributing to
low agricultural production in a country/Ethiopia where 77% of the population make a living from farming.
Land issues lies at the centre of the multiple factors that contribute to low production in Ethiopia. With an
average size of 1.2 ha, or as low as 0.5 ha in more vulnerable areas, farm plots are too small and fragmented
to reap economies of scale or even to feed the average family of five5. Production is also reduced by several
other factors related to material and know-how. Inputs such as improved seeds, fertilizer and pesticides can
dramatically boost crop yields, but these are all in short supply on Ethiopian farms6. For most crops, national
supplies of improved seeds (drought or pest resistant, higher-yielding, nutrient-rich) cover less than 10% of
demand. Likewise, fertilizer use in Ethiopia is far below optimum levels and far behind average kilograms per
5
European Union: Assessing the root causes of recurring food insecurity in Ethiopia, 2018.
6
http://esa.un.org/unpd/wpp/Publications/
19 | P a g eBaseline Survey of SWEEP Project in East and West Belesa Woredas, Central Gondar Zone
hectare used in other fast-growing African countries. Chemical and biological pest controls are also
parsimoniously applied; pre-harvest cereal losses due to insects are estimated at 31% to 61%7.
4.2.2. Capacity to Adapt to Environmental and Economic Shocks
Adaptation to environmental changes/shocks
In order to adapt to environmental changes/shocks, the respondent households must first perceive that
changes/shocks are taking place on the environment. In relation to this, the survey data shows that in both
woredas, a large share of households perceived that the environment has been changing dramatically in
many ways. A total of 82% (85% in East and 80% in West Belesa; no significant difference between female
and male respondent) observed changes in the environment. Respondents responded that temperature has
increased, and households noted both a decrease in rainfall and seasonal changes in rainfall patterns (i.e.
changes in the timing of rainfall) (5%) and others reported both decreased rainfall and seasonal changes.
According to respondents, all these changes resulted in high soil erosion, high runoff, a decrease in
production and productivity of crops and animals, land degradation, deforestation, animal disease, crop
pests, diminishing of natural resources, among others.
The respondents who perceived environmental changes/shocks were asked about the adaptation measures
they practice at household level. The survey result shows a disconnect between the households’ perceptions
of environmental changes/shocks and the actual adaptation measures they practiced. The survey shows that
despite having perceived changes in environmental changes/shocks, a large share of respondents in both
woredas did not take any adaptive measures by their own initiative on their own resources. Overall, only 7%
(9% in East and 5% in West Belesa; 5% male and 7% female)) of households/respondents undertake some
adaptation measures.
A very insignificant proportion of households (1%) reported that they employed a positive range of
adaptation options/measures to the changes/shocks of environment in the surveyed woredas at an
individual level on their own plots of land. The most common adaptation strategies include soil conservation
in their farmlands, planting trees, use of different crops or crop varieties (short period growing crops),
changing farming type, changing crop planting dates, migrating to towns and large (state and private) farms
to engage in daily labours, and irrigation (household level). Other responses reported less frequently, such
as seeking off-farm activities, using new technologies (seedlings), and water conservation, are included in
the ‘‘other’’ category. The FGD participants also asserted that there is a high perception to environmental
changes/shocks, but households are not in the position to take adaptation measures, except for some/very
few community members. According to the discussants (FGD and KII participants), collective adaptation
measures such as soil and water conservation measures are taken, for instance once in a year as a campaign
in communal lands, instead of individual/private actions.
7
Ibid.
20 | P a g eYou can also read