Rapid appraisal of the rural water and sanitation sector in Orissa - Dipak Roy for
←
→
Page content transcription
If your browser does not render page correctly, please read the page content below
Final Draft

                                                            15 April 2012

Rapid appraisal of the rural water and sanitation sector in Orissa

                              Dipak Roy

                                  for

                Technical and Management Support Team

                       Orissa Health Sector Plan

               Department for International Development,

                    Government of United Kingdom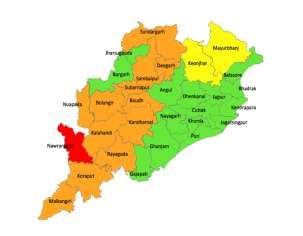
2

                                              Contents
                   Theme                                                         Page no.

Secton1     WASH sector context and objectives of appraisal                           3

Section 2   State context                                                             9

Section 3   Access to and use of water, sanitation & hygiene services                 18

Section 4   Financial resources and their utilization                                 23

Section 5   Institutional arrangements and their effectiveness                        26

Section 6   Capacity of institutions to deliver WASH services with quality            37

Section 7   Policies and procedures                                                   42

Section 8   Technologies used and supply chain                                        46

Section 9   Monitoring and evaluation                                                 51

Section 10 Conclusions                                                                53

Section 11 Recommendations for intervention                                           55

Annex1      Year-wise GP intervention plan to achieve total sanitation by 2012        45

Annex 2     List of persons contacted                                                 60

                                        Rapid appraisal of WASH sector                      Dipak Roy
3

       Section 1: Water Sanitation and Hygiene (WASH) sector context and
                             objectives of appraisal

The primary responsibility of providing drinking water and sanitation facilities in India lies with the
state governments. The central government supplements and provides guidance to states by
providing financial assistance mainly under two national flagship programs:

1. The National Rural Drinking Water Program (NRDWP, 2010) earlier called the Accelerated Rural
   water Supply Program (ARWSP implemented since 1972-73), and
2. The Total Sanitation Campaign (TSC) being implemented since 1999.

Water supply: national policy framework: The Accelerated Rural water Supply program was
launched in 1972 with the identification of the “problem villages”, using the criteria of distance of
water source and quality. If a village did not have a drinking water source within 1.6 km (or 100 mts
vertical distance) or the source of water had problems with the quality, it was categorised as a
“problem village”. In 1986 the National Drinking Water Mission was established with the objective
of providing universal coverage of all rural and urban areas with safe water supply and sanitation
facilities.

During the Seventh Five Year Plan period the norm of 40 litres of water per capita per day was
introduced in the ARWSP as the minimum supply norm for rural areas with one source provided for
every 250 population. In 1999, the government approved a package of reforms in the sector to
address major areas of concern namely, coverage of habitations, quality problems in drinking water
and sustainability of sources and systems. The Government had also stipulated that 20% of the
annual outlay under Accelerated Rural Water Supply Programme (ARWSP) be earmarked for
implementing reform projects. The reforms initiative was launched on a pilot basis as Sector
Reform Projects in 67 districts of 26 States by the Government of India. In Odisha three districts-
Balasore, Sundargarh and Ganjam were selected to pilot the reforms in the sector.

Later in 2002, the reforms initiative was scaled up. The coverage norms were scaled up at this point
to provide for 55 lpcd with a source within 500 mts in plains and 50 mts in the hills after coverage
had been achieved using the existing norm at the time (40 lts pcd and a source within 1.6 kms). The
status of water supply coverage was assessed in 2003 nationally and validated in 2006. This survey
classified all habitations into three categories: a) Not Covered or NC getting less than 10 lts per
capita per day (lpcd), b) Partially covered or PC getting 10-40 lpcd, and Fully Covered or FC getting
more than 40 lpcd. The 2003 survey showed that there were 33,534 NC habitations, 15,166 PC

                                      Rapid appraisal of WASH sector                            Dipak Roy
4
habitations and 84,997 FC habitations respectively out of a total of 133,697 habitations 1 as per
ARWSP norms.
Water quality, which was addressed for the first time in the national program by the Sub-Missions
of the National Drinking Water Mission was taken up systematically in the National Rural Drinking
Water Quality Monitoring and Surveillance Program. This program provided guidelines and funding
for testing water quality in all districts in the country.
In April 2009, the National Rural Drinking Water Program (NRDWP) guidelines was introduced to
address the issues of sustainability, water availability and supply, poor water quality, centralized
approach and financing of O&M cost while ensuring equity. The NRDWP essentially marks a shift
the focus from habitation level coverage to achieving household level drinking water coverage.
Household level drinking water security is to be achieved through formulation of water demand
plans and budgeting at the village level as per the new guidelines. The NRDWP also provides
support to the states for substantially augmenting the human resource necessary for implementing
and monitoring both the water and sanitation programs.
The national policy framework for drinking water is guided by the following principles:
• Water is a public good. Every person has the right to demand drinking water.
• It is the lifeline activity of the Govt. to ensure this basic need of people.
• Enhance access to safe and adequate drinking water to increase economic productivity and
improve public health.
• Focus for the most vulnerable and deprived groups in the society.
• More emphasis on public – public partnership (GP & RWSS).
• Drinking water supply should not be commercialized and denied to those who can not afford to
pay for such service.
Rural Sanitation: national policy framework: The national rural sanitation program had a much
later start than the rural drinking water program. The Centrally sponsored Rural Sanitation Program
(CRSP) was launched in 1986 with the objective of improving the quality of life of the rural people
and to provide privacy and dignity to the women. This was intended to supplement the efforts of
the States. The program provided for 100% subsidy for construction of sanitary latrines for
Scheduled Castes, Scheduled Tribes and landless labourers and subsidy as per the rate prevailing in
the States for the General public. The guidelines were circulated to the states in 1986. UNICEF
supported the implementation of CRSP as per the guidelines in 5 Blocks in Orissa and three Blocks
1
A ‘Habitation’ is a locality within a village where a cluster of families reside. The total population should be 100 or more
for consideration for coverage under the rural water supply norms (Section 2 of ARWSP guideline). It is generally assumed
that around 20 families reside in a habitation. Average number of persons in a family is taken as 5. In case of hilly areas, a
habitation may have a population, which is less than 100.
Rapid appraisal of WASH sector Dipak Roy5
in West Bengal in 1986. The program in Orissa was being implemented by the Community
Development and Rural Reconstruction Department (CD&RR) then.
After five years of implementation, the CRSP guidelines were revised in 1991 based on feedbacks
from UNICEF and other organizations to include families below poverty line among those eligible
for subsidies for latrines, besides SCs and STs. The program also provided for construction of village
complexes with bathing facilities, drainage facilities and washing platforms and for capacity
building- 5% for administrative costs and 10% for training of masons, awareness generation and
health education.
The guidelines were further revised in 1993 to introduce a more comprehensive approach in
sanitation which brought in the components of personal hygiene, home sanitation, safe water,
garbage disposal, excreta disposal and waste water disposal. The revision in 1993 also emphasised
the need for people’s participation in promoting sanitation and for generating a “felt need” for
sanitation among people through intensive awareness drives. The concept of Rural Sanitary Mart
(RSM) was also introduced in this revision for supply of material for construction of sanitary
latrines, based on the successful demonstration of RSMs by UNICEF.
In 1999, there was a major revision in the national program guidelines simultaneous with the
ushering in of reforms in the sector. The program, named as Total Sanitation Campaign (TSC) is
designed as a comprehensive program to ensure availability and use of sanitation facilities in all
homes and institutions (Schools and Anganwadis). TSC aims at effective and sustained change in
hygiene and sanitation behavior in the entire population. The program intends to make the entire
country free from open defecation (ODF) within an agreed time frame; initially March 2012 had
been agreed as the time frame, and some states have either achieved it (such as Sikkim, a small
state) or are well on the way like Himachal Pradesh, but it remains a challenge for states like Bihar,
Odisha, Jharkhand etc. The target date for achieving ODF status countrywide is now extended to
March 2017. Improved sanitation and hygiene practices in conjunction with improved access to
safe water are together expected to contribute to improved health and nutrition outcomes.
The proposed new policy initiatives in the water and sanitation sector for the 12 th Five Year Plan
lays stress on convergence of NRDWP and TSC. This is to be achieved by first creating demand
through contact and motivation for water supply schemes and undertaking toilet construction
simultaneous with the construction of water supply systems. While selecting locations for Piped
Water Supply (PWS) Schemes, priority is to be assigned to those villages which have achieved high
toilet coverage, such as those which have received the NGP. Similarly, areas where PWS schemes
have already been installed need to be taken up under TSC on a priority basis to achieve Open
Defecation Free (ODF) status. The strategy in TSC will be to achieve community level outcomes
Rapid appraisal of WASH sector Dipak Roy6
rather than individual toilet construction, as adopted at present. The new approach intends to
bridge the BPL-APL divide by providing incentives to APL households to achieve community-level
outcomes. It will be mandatory to constitute Village Water and Sanitation Committees (VWSC) as
Standing Committee of the Gram Panchayats, and VWCs would supervise the implementation of
TSC in their Panchayat. Independent assessment of use of toilets by the states would be made
mandatory linked to release of funds.
Need for the present appraisal: The Orissa Health Sector Support Plan (OHSP) of DFID is supporting
Government of Odisha since 2007 in implementing reforms in delivery of health and nutrition
services. The annual review of OHSP in October 20112 noted: ” One of the key contributors to the
under five mortality and poor nutrition is non availability of safe water and poor sanitation and
hygiene (WASH) practices among community.” In the second phase of OHSP (2012-2015)
interventions are being planned in the water and sanitation sector.
DFID’s approach is based on strengthening delivery of services by improving capacity of
Government of Odisha to frame better policies and to plan, manage and monitor the resources
available better. It also aims to support convergence between the GoO departments of Health and
Family Welfare, Women and Child Development and Rural Development as well as facilitate better
coordination between the development partners in the state for synergy in achievement of
program goals. The water sanitation and hygiene interventions will therefore reinforce the ongoing
DFID interventions in the state in health and nutrition sectors.
To identify key gaps in the operational service delivery issues and to explore opportunities to
support implementation of WASH actions in Orissa, a rapid appraisal of the status of rural drinking
water and sanitation sector in Odisha was carried out in two parts: i) one looked at the
effectiveness of water and sanitation services at the community level in 50 villages of four districts-
Balasore, Bolangir, Kandhamal and Rayagada, with a focus on sanitation; ii) the second study
looked at the overall situation in the sector in the state. The salient findings from these two studies
were shared with the Principal Secretary, Rural Development Department, GoO in February, 2012.
Objectives of the appraisal: This rapid appraisal is being carried out to consolidate the findings
from the two recent studies mentioned above and to recommend a “strategic process” and a set of
program interventions based on these findings drawing on some of the acknowledged best
practices from the sector. The specific objectives of the study are3:
to identify and analyze specific bottlenecks in accelerating TSC implementation and in
effective delivery and utilization of services at scale; and
2
Annual Review 113963(1) http://projects.dfid.gov.uk/project.aspx?Project=113963
3
Terms of Reference from TMST dated 17 February, 2012
Rapid appraisal of WASH sector Dipak Roy7
to recommend a strategic set of evidence-based interventions (including National and
international best practices for State government to deliver faster, more effective and
efficient progress over the next 3-4 years.
Scope and approach: This appraisal focuses primarily on the Sanitation and Hygiene component
(TSC) of the WASH program and to a lesser extent on Water Quality and Operation and
Maintenance. The report draws on the following data sources:
A rapid appraisal of the rural water and sanitation sector by a Consultant , Mr Subrat Dash
Rapid appraisal of rural water and sanitation sector in Odisha carried out in four districts by
Sutra Consulting
The online monitoring system of Ministry of Drinking water and Sanitation, GoI
Some unpublished reports provided by TMST, Odisha office
Discussions with selected program officials from GoO, TMST and UNICEF, Odisha. ( Annex 2
at the end of this report provides the list of persons contacted)
No additional field studies were considered necessary since primary data on status of WASH
facilities and practices were available from the Sutra study at the community level4.
The appraisal attempts to respond to the following questions:
1. Status of access to and use of WASH services: What is the current status of WASH services
in the state? What are the broad trends in access and use over the last decade? What are
the gaps?
2. Financial resources budgeted and utilized: What is the budget for the program, how is it
shared by three major stakeholders and what part of the budget has been utilised
3. Institutional arrangements: Which institutions are responsible for implementing WASH
program and how do they relate to each other? Are there adequate formal linkages
between these institutions and do they work effectively in the field level?
4. Capacity of institutions and functionaries to deliver: Do adequate capacities exist in the
state- in the institutions and in the individuals who man various positions in the hierarchy of
program management?
5. Policies and procedures: what is the existing policy framework for implementing the WASH
program in Odisha and what are the operational procedures being adopted.
6. Technologies and Supply chain: Is the supply chain for delivering the program hardware
efficient and to what extent is it functional
7. Monitoring and evaluation: How effective is the monitoring system and to what extent are
outcomes and results monitored? Are any knowledge products generated in the program
4
Rapid appraisal of rural water and sanitation sector in Odisha- A Community Report: Sutra Consulting (in association with
Sigma)
Rapid appraisal of WASH sector Dipak Roy8
and shared among stakeholders for improved program management? Is there any evidence
of knowledge sharing within the state and with other states
Rapid appraisal of WASH sector Dipak Roy9
Section 2 State context
State demographic profile: The state is administratively constituted of 30 districts, 58 Sub Divisions,
314 Community Development Blocks, 6234 Gram Panchayats and 50,972 villages. The total population5
of the state is 41.94 million. A majority of the population (85%) live in rural areas (2001 Census).
The overall literacy rate is 73.45 % which hides a large difference between male (82.4%) and female
(64.36%) literacy rates. Three demographic indicators suggest an improvement in social development
program delivery over the last decade:
> the sex ratio has improved from 972 in 2001 to 978 in 2011
> the decadal growth rate of 13.97% for 2001-2011 is lower than the figure of 16.25% for the
previous decade.
> Infant Mortality Rate (IMR) is estimated at 61 for every 1000 live births for the state as a whole
(SRS, 2010), which is a reduction of 29 points from the 2001 level of 90.
The population density is 269 persons per sq. km. as per 2011 Census- up from 236 in 2001. The
density ranges from 91 in Kandhamal district to 799 in Khordha district. Figure 1 shows the clear
Figure 1: Map of Odisha showing density of population in districts (source: Census of India, 2011)
5
Census of India, 2011, Provisional population Totals; Paper 1 of 2011; Orissa, Series 22
Rapid appraisal of WASH sector Dipak Roy10
variation in population density between the districts: the 10 coastal districts are far more densely
populated than the eight KBK districts6 of the south-western region , which constitute one of the
poorest regions in the country. Odisha has a high proportion of socially marginalized population: 22%
belong to Scheduled Tribes (ST) and 17% to Scheduled Castes (SC) as per 2001 Census. But the KBK
districts have a much higher proportion of tribal population- 38.7% are STs while 15.8% are SCs. The
region is characterized by “…chronic income poverty resulting in absolute hunger, persistent drought
conditions, and high levels of food insecurity, regular distress migration, and periodic allegations of
starvation deaths.”7 The KBK region is also highly vulnerable to diarrhea epidemics during monsoon. In
2010, for instance, five of the eight KBK districts were assessed by the Inter Agency Group (IAG) as
most vulnerable to diarrhea, with Rayagada being the most endemic area where 631 cases of cholera
were confirmed resulting in 37 deaths. The IAG assessment attributed the epidemic to poor sanitation
and hygiene: “…the spread of the disease is necessarily due to unhygienic living conditions, practices of
the communities and sanitation issues in their villages.
Of the 314 Blocks in the state, 47 Blocks in 8 districts have been identified as drought-prone where the
GoI has been supporting the implementation of Drought Prone Area Program. The number of districts
which are vulnerable to drought are however said to be 25 out of 30 and western Orissa is particularly
vulnerable in this respect. Ironically, the state is also frequently inundated and the six coastal districts
are affected by floods almost every year.
33 Blocks in the coastal districts are affected by high salinity level in ground water. In 1983 a drinking
water project to address the problem of salinity was initiated with support from Danish International
Development Agency (DANIDA). The project worked in 11 of the 33 affected Blocks in three districts
and brought in a number of innovations in water well drilling technology, iron removal technology as
well as maintenance systems for handpumps.
Fluoride in groundwater has been detected in one large pocket in Nuapada district, although anecdotal
data from unconfirmed sources suggest that fluoride contamination in ground water could be also
occurring in parts of Khurda and Nayagarh districts. No water quality map of the state is available at
the moment in the public domain. The Central Ground Water Board (CGWB), it is understood, has
prepared a groundwater atlas for Orissa which is available only for restricted use.
Information from the Concurrent Monitoring database of the TMST (2011) indicates the following
status as shown in table 2.1:
6
The 8 districts are: Koraput, Malkangiri, Rayagada, Nawrangpur, Bolangir, Sonepur, Kalahandi and Nuapada.the TMST
includes two more districts- Kandhamal and Boud as the most vulnerable districts (KBK+ districts).
7
Human Development Report 2004, GoO, P.24 (quoted in Nutrition Operation Plan DWCD, GoO).
Rapid appraisal of WASH sector Dipak Roy11
Table 2.1
Estimated access to water and sanitation facilities in Odisha
Indicator State-wide rural coverage (% HHs)
households using improved 83
source of drinking water
households with improved 17
sanitation facility
Source: Concurrent Monitoring of Health & Nutrition services in Odisha, TMST, 2011
Figures 2 and 3 show the coverage of safe water and sanitation in rural Odisha in the districts as per
the Concurrent Monitoring database.
Below 70 %
70 %-80 %
81 %-90%
90% Above
Figure 2: Access to safe water in rural Odisha (TMST, 2011)
Below 5 %
5 %-10 %
11 %-15%
15% Above
Figure 4: Access to sanitation facilities in rural Odisha ,(TMST, 2011)
Rapid appraisal of WASH sector Dipak Roy
Figure 3: Access to sanitation facilities in rural Odisha (TMST, 2011)12
State Water Policy: Orissa State Water Policy was prepared in March 2007 by the water Resources
Department. The Policy lays down principles for equitable and judicious use of water for survival of life,
welfare of the people and sustained and balanced growth of the state. The policy commits the state to
provide safe drinking water for human beings and livestock in urban and rural areas. Maintenance of
water quality through monitoring and surveillance and reduction of pollution load are integral
components of this strategy. The policy document states that overexploitation of groundwater will be
discouraged through appropriate legislation.
Rapid appraisal of WASH sector Dipak Roy13
Section 3 Appraisal of access to and use of
Water, Sanitation and Hygiene services
Drinking Water: The RD Department of GoO has listed a total of 141,928 habitations8 in the state of
which 26,923 (18.96%) are identified as SC habitations, 49,242 (34.7%) as ST habitations and the
remaining 65,763 (46.34%) habitations are reported to be inhabited by other (OBC and Upper) castes.
As per data available on 30th June 2011 from RD Department, GoO, a total of 68,923 habitations
(48.56% of total) were fully covered. The break-up of this coverage community-wise9 (Table 3.1) was:
Table 3.1
Coverage with water supply: Social category-wise in Odisha (April, 2011)
% Fully covered % Fully covered % Fully covered habitations
habitations- SC habitations –ST –Other castes
56% 49.4% 44.6%
Source: MDWS website (IMIS)
The same report from RDD, GoO indicates that 2,92,410 handpumps fitted on tubewells, 6,940 piped
water supply projects and 10,036 sanitary wells were functional as of June, 2011.
The Rural Water Supply and Sanitation Organisation (RWSSO) which is responsible for implementation
of the water supply program has identified 14,811 quality affected habitations. Of these 475
habitations have excess Fluoride (>1.5 ppm), 13,191 report excess Iron (>1 ppm), 1,117 report high
salinity (>250ppm Chloride) and 28 report high Nitrate level in ground water.
The most serious problem is posed by Fluoride which puts nearly 500,000 people including 248,500
persons belonging to SC/ST community in the 475 habitations in Nuapada at risk. However, as
mentioned earlier, Fluoride is also suspected to be occurring in groundwater in parts of Khuda and
Nayagarh districts also.
Although Iron in groundwater is not known to cause any direct health problems, it forces people to use
alternate surface sources, which are usually unsafe. Although some efforts have been made in the past
to address high salinity and iron content in ground water and technical solutions tried out, the problem
largely remains unsolved.
8
A ‘Habitation’ is a locality within a village where a cluster of families reside. The total population should be 100 or more
for consideration for coverage under the rural water supply norms (Section 2 of ARWSP guideline). It is generally assumed
that around 20 families reside in a habitation. Average number of persons in a family is taken as 5. In case of hilly areas, a
habitation may have a population, which is less than 100.
9
The data is extracted from two different sources: a) IMIS Reporting system of the MDWS, GoI and b) RD Dept GoO Report
of 30.06.2011
Rapid appraisal of WASH sector Dipak Roy14
In terms of population covered, the IMIS database of GoI indicates the following coverage (Table 3.2)
of the three social categories:
Table 3.2: Social category-wise population covered with water supply in Odisha
% SC population % ST population % Other Caste population
covered covered covered
74.9 73.1 74.8
Source: http://indiawater.gov.in/IMISReports/NRDWP Ref date: 1/4/2011
National Sample Survey estimates are available for a slightly earlier time point (July 2008 – June 2009)
which provides the following estimates for rural Odisha (table 3.3):
Table 3.3: Type of drinking water source used in Odisha (rural)
Source % HHs using10
Tubewell fitted with handpump 73.3
Tap water (piped water) 5.8
Sanitary well 4.2
Unprotected well 13.5
Other unprotected sources 3.2
(Tank/pond/river/canal/spring)
th
Source: NSSO 65 Round; 2010
The above table suggests that 83.3% households are consuming water from protected sources in rural
Odisha.
The NSS 65th Round has also estimated the access in terms of distance from dwelling unit and
continuity throughout the year. It is estimated that 83.9% of rural households got sufficient drinking
water from the major source used. In terms of distance, 13.7% had the water source within their
premises, while 61.5% had a source within 0.2 km and 22.2% had to travel a distance of 200-500 mts.
This means 2.6% HHs have to travel a distance of more than 500 mts to fetch drinking water. Since the
data on access does not specify what kind of source is available within the above distance intervals, it is
not possible to assess how the earlier figure of 83 % (who use safe water) is distributed.
Data on household water use in rural areas of Odisha is also available from the Concurrent Monitoring
of Health & Nutrition Services carried out from March 2010 to June 2011. This data base was
generated from a base of 23,750 HHs spread over all 314 Blocks in the state; one Block from each
10 th
National Sample Survey Report No. 535 (65 Round): Housing Condition and Amenities in India: July, 2008-June, 2009.
The NSS estimates have been provided for 1000 HHs. The percentages are worked out by us.
Rapid appraisal of WASH sector Dipak Roy15
district was covered during every month thus ensuring that the entire state was covered within 16
months (?). This database11 suggests the following status:
83% HHs reported using improved or potable water sources. Handpump fitted with tubewell is
a safe source used by most number of people (62% - 66%)
Across four social categories, use of safe water source does not vary greatly. While use of safe
sources is highest among Scheduled Castes (87% -88% of SC HHs), Scheduled Tribes report the
lowest level in the range (77%-79% ST HHs)
In terms of income levels, the variation shows a consistent pattern. While 79.7% of HHs in the
lowest wealth quintile reported using a safe source of water, the level goes up progressively
with each higher quintile: 86.4% of those in the highest quintile reporting use of safe drinking
water source. This indicates that, while access to/use of a safe water source is higher among
the wealthier households, the disparities are not very significant.
A study on knowledge, attitudes and practices in the eight KBK districts12 covering 5105 habitations
and 2328 households provides some interesting information. The study shows that water supply
coverage of smaller habitations is better; 97% of habitations with population less than 150 were fully
covered, while the proportion of fully covered habitations with population greater than 150 was less
(89%). This means there have been special efforts to reach out to smaller habitations which are also
likely to be more remote.
Definitional and methodological issues notwithstanding, there is a good deal of correspondence among
the various data sets available on access to/use of safe water. Close to 80% of households or more are
using safe drinking water in rural Odisha; estimates of the nodal government department appear to be
more on the conservative side.
Sanitation:
Home toilets: Unlike water supply, reliable data bases on access to - and more importantly use of –
sanitary toilets are less easily available. The Census of India provides the most robust data set in this
respect. The 2001 Census indicated a figure of 92.3% HHs in rural Odisha without access to any kind of
toilets, and 7.7% with access to some kind of toilet. Census, 2011 data on household amenities shows
that 14.1 % households in rural Odisha have access to some kind of toilet in their homes.
11
Concurrent monitoring of Health and Nutrition Village Level Services in Odisha: Submitted by ORG Centre for Social
Research to technical and Management Support Team for DWCD and DH&FW, GoO; 2011. Since “access” and “use” are
used interchangeably in the report, there can be some ambiguity in the interpretation of the data. There are some other
methodological issues, which need to be resolved for greater clarity. But in any case this provides a robust data set, which is
very useful.
12
An evaluation study on water and sanitation services in KBK region of Orissa; CYSD Bhubaneswar for Govt of Orissa
undated (2007 ?)
Rapid appraisal of WASH sector Dipak Roy16
Table 3.4 shows the status of access to home toilets in rural Odisha in 2011 and 2001:
Table 3.4: Access to toilets in rural Odisha (2011 / 2001)
Type of toilet % HHs with access
Census 2011 Census 2001
Pit latrine 3.4 3.1
Water closet 10.0 3.3
Other latrine 0.7 1.3
No latrine 85.9 92.3
Source: Census of India: Household amenities
The TSC program was launched in Odisha around the same time as the Census, 2001 data was
collected: in 2000-01 TSC activities started in three districts, and by 2004-05 all 30 districts were
implementing TSC. Since inception of TSC, till end of February 2012, a total of 3,781,943 additional
households are estimated to have gained access to a to a toilet in their own homes: 2,656,534
Individual Household Latrines (IHHL) have been built using TSC program incentives for those identified
as BPL, while 1,125,409 HHs labeled as APL are enumerated as having built toilets using their own
resources. Figure 4 shows the cumulative progress in construction of Individual Household Latrines
(IHHL) in TSC in Odisha since inception.
If we use the number of rural households from the Census, 2001 and 2011 as the base and factor in the
increase in access to home toilets attributable to TSC, the current level of access to home toilets in
rural Odisha is estimated to be 52.85 %13. This is more than three times the access figure as per Census
2011.
4000000 3781943
3472768
No. of IHHL built
3500000 2619465
3000000 2080388
2500000 1756586
2000000 1280682
1500000 592112
890880
1000000 278988
500000 13332 50920
0
Year
Figure 5: Cumulative progress of construction of IHHL in TSC Odisha (source: MDWS website)
13
A) No. of rural households as per Census 2001=6,782,879. B) HHs with toilet in rural areas in 2001= 7.7%. C) No. of rural
households as per Census 2011=8,144,012. D) No. of toilets installed under TSC in Odisha ( 2001- 2012) as per data available
in MDWS, GoI website = 3,781,943. [(AXB) + D] / C = 0.5285
Rapid appraisal of WASH sector Dipak Roy17
The data from independent surveys however indicates a very different picture of access to and use of
home toilets in rural Odisha.
The most recent study accessed by this appraisal was
60
commissioned by TMST (Sutra Consulting, 2011-12)14
50
% HHs which contacted a sample of 1502 households- 30
40
using households selected randomly from among TSC
30 improved
20 sanitation beneficiaries from each of 50 villages from 12 Blocks in
10 four districts. The districts, Blocks and villages were
0 selected purposively. Two high performing districts
(Bolangir and Balasore) and two low-performing
districts (Kandhamal and Rayagada) were included in
the sample. The three sample Blocks from each district
Figure 6: Variation in access to latrines across wealth
were also selected based on their performance report
quintiles (Source Concurrent monitoring of Health &
Nutrition services ; ORG-TMST, 2011)
from the online reporting system representing high,
medium and low levels of performance, while the
sample villages were selected from among those which had been “saturated” with TSC services, in
discussion with RWSS officials. The results indicate that 80% of the households (79% of BPL and 87% of
APL) reported having toilets and 20 % did not. However, when the reasons for non-usage are analysed,
131 HHS from among 1339 BPL reported that they had only received the material for construction, but
their toilets had actually not been built. This means, nearly 31% of BPL families listed as TSC
beneficiaries actually did not have toilets in their homes, and this includes 21% who had not even been
provided any material.
Within the group which had toilets, 38% reported using them. The usage rate was 36 % in the BPL
group, but much higher (91%) in the APL category. The use rate falls further when the regular users
are considered. The study analyses the reasons for non-usage. Most of the BPL toilets (86%) were not
being used because they were not functional because of collapsed pits, broken pans, damaged pits or
broken pans. Therefore poor construction appears to be the single most important reason for which
toilets do not function and hence people cannot use them. It also suggests that when people invest
their own funds to build toilets, they take care to see they are built well and they are also more likely
to use the toilets.
There is one other robust data set which also provides reliable estimates of access to water and
sanitation facilities. The NSSO’s 65th round survey on Housing Conditions and Amenities in India,
referred earlier (2008-09), adopted the definition of sanitary toilets as stated in the Global Water
14
Community Report- Rapid appraisal of rural water 7 sanitation sector in Odisha: Sutra Consulting undated (study
commissioned in TMST, OHSP in 2011). The study has adopted a purposive sampling to contact 1502 households in 50
villages from 4 districts. The household sample included consists of 90% BPL and 10% APL families.
Rapid appraisal of WASH sector Dipak Roy18
Supply and Sanitation Assessment Report (WHO-UNICEF, 2000) : “.. sanitation was defined to include
connection to a sewer or septic tank system, pour-flush latrine, simple pit or ventilated improved pit
latrine, with allowance for acceptable local technologies.”15 Using this definition, NSSO provides an
estimate of 11.8% use of home toilets in rural Odisha for the year 2008-09.
The difference in figures provided by Census or NSSO and the estimated coverage based on MDWS,
GoI database (IMIS) requires more detailed verification.
The Concurrent Monitoring database (ORG/TMST, 2011) referred earlier also provides data on
access/use of toilets. Again, there is some ambiguity in the data because the report uses “access” and
“use” interchangeably, and in case of toilets this poses a far more serious problem. The survey
indicates that 18% of households reported using toilets- which were either simple pit toilets or water-
flushed toilets. There was consistency in the data on use, across the four Quarters, the variation being
very low from 17.7% (Q1) to 16.9% (Q2). This figure corresponds closely with the recently released
data from Census, 2011 on toilet covergae. The report provides further analysis of use:
92.7% of the ST HHs did not have “access to toilets”, while the figure was 89.8% for SCs and
68.6% for Other (upper) Caste HHs. Thus, 31% of the upper caste families report using toilets as
against only 10.2% among SCs and 7.3% among STs.
All the six districts in which more than 15% HHs were using toilets are also the coastal / more
economically developed districts: Puri, Jagatsinghpur, Nayagarh, Khurda, Jajpur and Cuttack.
There was significant difference across the wealth quintiles: level of use of toilets goes up
exponentially as the economic background of the household improves (figure 3). Comparison
between the clusters of backward districts (10%) and “other districts” or developed districts
(21.1%) also shows a similar trend.
The CYSD evaluation (2007 ?) which worked on a sample size of 2328 HHs from 24 Blocks in the
eight KBK districts showed a much lower level of use of individual home toilets. As per this report
only 6.8 % households were using toilets. A more recent study by UNICEF (2011) on low utilization
of TSC services among tribal population in Koraput district shows that 12% households had toilets
but only 5% were actually using them. The CYSD study had reported a figure of 1.6% use four years
earlier.
The IMIS (MDWS, GoI website) report for Koraput district shows that 103,255 IHHLs have been
built in Koraput district in the last 7 years and 39% of the total target has been covered. If we take
this one district as a test case, for which data on access and use are available from several
independent sources, there is cause for serious concern. While toilets are being constructed (or
15 th
Housing Conditions and Amenities in India 2008-09: NSS 65 Round , Government of India, November 2010 page 25
Rapid appraisal of WASH sector Dipak Roy19
reported to be constructed) following TSC project targets, this is not necessarily translating to
increased access of families to sanitation facilities. But more important, rate of use of toilets is
abysmally low, especially in the tribal dominated south western Odisha.
School and Anganwadi Sanitation: Provision of toilets in all Schools- Primary, Middle, Secondary
and Higher Secondary Schools is an important component of TSC. In the initial years (till 2005-06) a
community contribution of 10% was being sought to complement the funds available under TSC,
but since then the guidelines have been revised and the entire cost of School toilets are made
available under TSC with a 70:30 share of central and state government. The unit cost of a school
toilet has been revised upwards to Rs 35,000 (Rs 38,000 in case of hilly and difficult areas).
Separate toilets are to be provided for girls and boys in co-educational schools, and each unit is
eligible for separate funding.
The IMIS report from the MDWS website indicates that a total of 68,300 School toilets have been
installed under TSC in Odisha by the end of February 2012. This means 96.6% of the 70,663 School
toilets planned have been installed. Figure 4 shows the cumulative increase in the number of
school toilets constructed since inception.
80000
70000 67200
68300
63782
60000
50000 49520
40000
32897
30000
20000 No. of toilets
17134
5526 7307 built
10000 9676
2 1423
(Cumulative)
0
Figure 7: Cumulative progress of school toilet construction in TSC Odisha (Source: IMIS, MDWS, GoI)
An independent study on school toilet availability and use from Koraput (IMACS-UNICEF, 2011)
however provides a picture which is disturbing: 38% schools did not have toilets, while 32% of the
Rapid appraisal of WASH sector Dipak Roy20
toilets were non-functional16. There is a need for detailed studies which look at the status of school
toilets, especially their functional status and the quality of construction and maintenance.
Data available from the DISE17 shows that by end of September 2009- by which time approximately
93% of the current construction figures had been achieved- 74.25 % of all schools in Odisha had
functional toilets for boys and 44% schools had functional toilets for girls. This means in about 25% of
schools boys’ toilets were not functional and in 56% schools girls’ toilets were not functional.
Construction of Anganwadi toilets started late from the year 2004-05. By the end of February 2012,
23,694 Anganwadi toilets have been built using TSC resources. In other words out of 59,203
functioning Anganwadi centres (Outcome Budget, DWCD, GoO 2011-12) in the state, about 40% have
been provided with toilets in the TSC. Figure 5 shows the cumulative progress of Anganwadi toilet
construction since inception.
25000 23694
Cumulative no. of AWS
20000 20657
19198
toilets built
15000 14332
10000 10564
5000 6085
25
0 0 878
Figure 8: Cumulative progress of construction of Anganwadi toilets (Feb 2012)
Hygiene promotion: Hygiene education is stated to be an integral component of TSC and the IEC
material used in TSC talks of the benefits of hygiene behavior and its impact on health. The TSC in
Odisha supports the School Sanitation and Hygiene Education (SSHE) component and since 2008, the
OSWSM has been leading the Handwashing Campaign in the state which has become a regular annual
event anchored to the Global Hnadwashing Day (15th of Ocober). OSSM works in collaboration with the
State SSA, UNICEF and other stakeholders to raise awareness regarding hygiene. The annual
handwashing campaign reinforces specific messages to school students on the ideal process of washing
hands with soap before eating and after defecation.
16
Study to assess gaps responsible for low utilization of TSC among tribal population of Orissa- Final report ; ICRA
Management Consulting Services Limited, April 2011 (page 37)
17
Elementary Education in India, Progress Towards UEE ; NUEPA 2011, New Delhi
Rapid appraisal of WASH sector Dipak Roy21
The child care practices promoted through the ICDS network also includes handwashing and home
hygiene messages. But there is no evidence to suggest that TSC works with the ICDS program
systematically on any focused intervention to promote hygiene behavior.
There are no systems for monitoring hygiene behavior in the TSC program. In the absence of any
reliable large data base, it is not possible to assess the reach of the hygiene promotion messages and
their effectiveness. Therefore this appraisal relies on the sample studies conducted by Sutra and two
other studies referred earlier to arrive at an understanding of knowledge, attitude and practices
relating to hygiene in the state.
The Sutra study provides the following data on handwashing practices in the 50 sample villages
(Table3.5):
Table 3.5: Hand washing Across BPL Households using toilet
Hand washing before eating food Hand Washing after defecation
Districts
with only water with Soap water and soap water mud soil only water
Balasore 172 13 98 68 18
Bolangir 82 5 37 46 1
Kandhamal 38 1 17 19 2
Rayagada 20 3 13 7
Grand Total 312 22 165 140 21
Source: Household Survey, Sutra 2011 Base: 334 (BPL Household using Toilet)
Thus only 6% BPL HHs use soap for washing hands before eating and just about half (49%) do so after
defecation. When all households in the study are considered, (Figure 2, page 33 of Sutra report) the
figures are 3.8% and 23.8% respectively. Since the sample itself is purposively drawn the findings
cannot be generalized for the state as a whole, but even with this limitation, the data indicates poor
hygiene practices.
Another study in Koraput (IMACS-UNICEF, 2011) says that 92% HHs consider washing hands to be
important, although only 36% linked this behavior to health reasons. But at the level of practice, in less
than one-third (29%) of the households, soap/ash was kept in the designated handwashing space,
100 which indicates that awareness did not
No. of NGPs won necessarily translate to practice. The CYSD
80
study (2007 ?) in 8 KBK districts showed that
60 only 6% HHs used soap for washing hands
after defecation.
40
Total Sanitation and Nirmal Gram Puraskar
20
(NGP): A system of incentive for achieving
0 Total Sanitation at the Gram Panchayat level
2005-06 2006-07 2007-08 2008-09 2009-10 2010-11
(and upwards) in the spirit of TSC was
Figure 9: Number of NGPs in Odisha- yearwise introduced in 2004 by GoI. Panchayts in
Rapid appraisal of WASH sector Dipak Roy22
which all households use sanitary latrines, all schools and Anganwadis have functional toilets and
where solid and liquid waste is disposed of in a safe manner at the community level receive the NGP
award. The Panchayat should therefore be free from open defecation (ODF) to qualify for NGP. In
Odisha 284 Panchayats have been awarded NGP thus far, which means only 4.5% of the total GPs in
the state have reached ODF status.
In 2010-11, applications had been sent by 273 GPs from Odisha, out of which 48 qualified to receive
the NGP, which works out to a success rate of only 17%. One district- Balasore claimed 52 NGPs in 2010
and 19 in 2011, and 104 overall since inception (37% of all NGPs in the state). Three coastal districts –
Balasore, Puri and Cuttack- together have a 59% share in the list of NGPs, which is probably because of
the high density of population and overall high aspiration level in these districts. The only other district
which has reached double digit is Mayurbhanj- a predominantly tribal district, which has qualified for
16 NGPs thus far.
Two districts- Sambalpur and Bolangir- have claimed their first NGP in 2011. Sambalpur is quite a
surprise because it is the original home of the “Barpali” toilet (single direct pit design) which goes back
to 1958, long before any sanitation program was launched in the country.
Summary of status of access to and use of WASH : The situation with regard to water supply in the
state is satisfactory, in terms of access. Water quality is emerging as a problem especially in the
fluoride-affected areas. Sanitation however, poses a significant challenge. Physical progress of
individual latrine construction is slow- just about half the target has been achieved in 12 years. But use
of toilets is a much greater concern; the program seems to be relapsing into a latrine-construction
mode. Quality of toilets constructed seems to need attention. There are no visible efforts for
systematic hygiene promotion except in schools. Monitoring of hygiene behavior poses a significant
challenge. Only one-tenth of the Gram Panchayats have become free from open defecation – most of
them in three coastal districts.
Rapid appraisal of WASH sector Dipak Roy23
Section 4: Financial resources and their utilization
The total program budget approved for
13853.78 implementing TSC in Odisha is Rs 15.6204 billion
(approximately equal to 192.1 million GBP18), in
which the share of central government is 67%,
Centre that of State government 24% and beneficiaries
37841.95 State of individual household latrines are expected to
104509.1 contribute 9%. Figure 10 shows the share of the
Beneficiary
three major stakeholders in the budget in money
terms.
Out of this budgeted amount, a little more than
half (55%) has been released and about a third
(31%) actually utilized (Figure 11). If the funds
Figure 10: Total TSC budget (in Rs lakhs) and share released are considered, then the expenditure
of stakeholders
works out to 57%. If the expenditure from
government budgets alone (excluding additional funding from international agencies like
UNICEF/WaterAid etc and beneficiary 180000 156204.8
contribution) is considered, the investment made 160000 3 Total approved
to achieve total sanitation in one NGP works out 140000 Total released
120000 Total spent
to Rs 154.92 lakhs (equivalent to 190,555 GBP 19)
100000 86211.72
based on current results. 80000
60000 49186.23
In figure 12 the relative share of centre (GoI), 40000
state and beneficiaries in the funds released and 20000
spent has been shown. The percentages of 0
central and state share released from the Total approved Total released Total spent
respective approved budgets are more or less same- 49% and 45% respectively. The level of
expenditure from the funds released by state government is a little higher (71%) compared to the
expenditure from the central share released (61%). However, if the total approved budget from the
two heads is considered, the level of expenditure is more or less the same- 30% from central budget
and 32% from the state budget.
18
Using an exchange rate of 1 GBP = Rs 81.30 Figure 11: Funds released and expenditure incurred
19
Same exchange rate as above (Rs / lakhs)
Rapid appraisal of WASH sector Dipak Roy24
120000
104509.1
100000
Approved
80000 Released
Spent
60000 51676.92
37841.95
40000
31728.66
17267.4 17267.4
20000 13853.78
12269.02
5188.55
0
Centre State Beneficiary
Figure 12: Funds released and spent from committed share of stakeholders (Rs / lakhs)
An attempt has been made
100 89
to examine if the program 90 % Exp
expenditure has any 80
% IHHL achieved
70
relation to the 60
46
achievement of target. The 50 37
40
achievement of Individual 32
30
Household Latrine (IHHL) 20
target has been considered 10
0
as a robust indicator of
SUNDARGARH
KENDRAPARA
GANJAM
SONEPUR
MAYURBHANJ
RAYAGADA
JHARSUGUDA
NAYAGARH
BARGARH
BOUDH
DHENKANAL
KHORDHA
BALESWAR
KALAHANDI
KANDHAMAL
KORAPUT
BHADRAK
KENDUJHAR
MALKANGIRI
DEBAGARH
GAJAPATI
JAGATSINGHAPUR
JAJAPUR
BALANGIR
NABARANGAPUR
NUAPADA
ANGUL
PURI
SAMBALPUR
CUTTACK
overall achievement, since
it requires inputs for
demand generation. The
results have been
presented in Figure 13. As
this figure shows, no Figure 13: Utilisation of approved budget and achievement of IHHL target in
consistent pattern districts. ( Expenditure vis-à-vis total approved budget / percentage of total
emerges. For instance, in IHHL target achieved)
Baleswar district, 89% of the IHHL target has been achieved with a good number of NGPs (104), using
46% of the approved budget. On the other hand, in Gajapti district, 32% of the budget has been
utilized with almost the same level of IHHL target achieved (37%).
Rapid appraisal of WASH sector Dipak Roy25
The relative expenditure on different 140 132.59
heads (Figure 14) reflects the manner Expenditure as % of
120
approved budget
in which different components have 100
been prioritized and points out the 79.75
80
gaps in financial monitoring.
60 44.22
Expenditure on start-up activities has 40 30.88 27.93
exceeded the budget head by 32%, 14.48
20
while administrative expenses are a 0
little less than one-third of the
approved budget. Nearly 80% of the
School toilet budget head has been
utilized, which is indicative of the
priority assigned to school toilet
construction, because of the Figure 14: Relative expenditure on hardware and software heads in
Supreme Court’s directive to provide TSC in Odisha (as percentage of approved budget)
all schools with toilets by March
2012. As discussed earlier, the school toilet target has been nearly achieved..
The expenditure on IEC is only 14% whereas the expenditure on administration head is nearly 31% and
the expenditure on start-up activities is 131%. This skewed pattern of expenditure suggests a
reluctance to undertake motivational activities to influence hygiene and sanitation behavior.
A finer analysis of budget planning and utilization is required at district level to assess the outlook
towards budget, constraints in utilization especially of the IEC component and also to assess how
budgets are strategically linked to results. The method used to compute beneficiary share and
expenditure on this head also needs an explanation.
Rapid appraisal of WASH sector Dipak Roy26
Section 5: Institutional arrangement and effectiveness
State level nodal agency: Drinking water and sanitation programmes in rural areas are planned, and
monitored by the Rural Development Department (RDD) of Government of Odisha, which was created
in 1990. The RDD is headed by the Principal Secretary. The Rural Water Supply and Sanitation
Organisation (RWSSO) implements the programs. Figure 9 shows the organogram of the Rural
Development Department.
Principal
Secretary
Special FA-cum-Addl.
Secretary Secretary
Deputy Secretary Deputy Secretary Under Secretary Under Secretary AFA-cum-
DWS RW Programmes Establishment Under Secretary
SO RWSS & SO Budget
WSSO
SO Sanitation SO Planning
Figure 15: Organogram of Rural Water Supply and Sanitation Organisation (RWSSO)
Note: SO- Section Officer/ FA- Financial Adviser/ AFA-Assistant Financial Adviser/ RW-Rural Works
The Rural Water Supply and Sanitation Organisation (RWSSO) is the implementing agency. The RWSSO
is headed by a Chief Engineer. The state is divided into 5 Circles which are headed by Superintendent
Engineers. Each Circle consists of RWSS Divisions, which are generally congruent with the districts.
Executive Engineers are in charge of the 31 RWSS Divisions in the state. The number of Divisions under
a Circle varies from 5 to 8. Each RWSS Division is divided into Sub Divisions under the charge of
Assistant Engineers. Sub Divisions consist of several Sections, which are generally coterminous with
Blocks. Junior Engineers (JE) look after each RWSS Section, which is the lowest level administrative unit
of the RWSSO. Till recently, one JE was appointed at the Section level. In 2011-12, the post of one more
JE has been created to strengthen the capacity of RWSSO at the field level to address the operation
and maintenance of water sources and to implement the TSC. The second JE will be reporting to the
Block development Officer (BDO), who is responsible for all development works at the Block level.
Rapid appraisal of WASH sector Dipak Roy27
The Orissa State Water and Sanitation Mission (OSWSM) was established in the state in 2002 as a
registered society under the Society Registration Act to function as the nodal agency for
implementation of TSC in the state. The State Mission has a Governing Body, which is the apex body
for policy-making in WASH sector in the state. Chief Secretary is the Chairperson of OSWSM Governing
Body and Development Commissioner (one of the two Additional Chief Secretaries) is the Vice
Chairman. The Secretary RDD is the Member Secretary of the state Mission and the two Chief
Engineers of RWSSO are Additional Member Secretaries of the Governing Body. Five Secretaries of
GoO – Health, DWCD, Panchayati Raj, Education and Finance are ex-officio members. Figure 8 shows
the organogram of the Governing Body of the State Mission.
ORGANOGRAM OF OSWSM
Governing Body
Chief Secretary
Chairman
Development
Commissioner
Vice / Working
Chairman
Principal Secretary
Member Secretary
Chief Engineer, Chief Engineer,
Rural Water Supply Rural Sanitation
Addl. Member Addl. Member
Secretary Secretary
24 Members: 4 GOI / 13 GoO Secretaries /
UNICEF & 3 INGOs / 3 State level NGOs Contd…
Figure 16: Organisation structure of OSWSM Governing Body
Source: Presentation by OSWSM, March 2012
The OSWSM also has an Executive Committee which is chaired by the principal Secretary, RDD and 8
members. Besides the two CEs of RWSS and Sanitation, the Director WSSO (now vacant) and five
Directors of GoO -Health, Social Welfare, Orissa Primary Education Program Authority (OPEPA), and
Rural Development- are the members.
The stated objectives of The State Mission are:
To promote community ownership of the projects with the responsibility for operation and
maintenance in order to ensure sustainability
Rapid appraisal of WASH sector Dipak Roy28
Overall policy guidance and coordination of programmes implemented by the District Water &
Sanitation Missions keeping in view the guidelines of Govt. of India & Govt. of Orissa for water
and sanitation programmes in order to make the water supply projects self-sustainable.
To ensure transfer of all existing and new Rural Piped Water Supply projects to the Users’
Association
To ensure coordination with different departments, agencies and convergence of different
activities related to water supply and sanitation in rural areas.
The State Mission reviews the progress of TSC on a quarterly basis; the last review was held on 17 th
February.
Technical support to the OSWSM for communication and School Sanitation and Hygiene Education was
provided by UNICEF in the initial years. After the concept of Communication and Capacity
Development Unit (CCDU) was introduced in 2005, this was constituted formally with the Chief
Engineer, OSWSM functioning as the Director, CCDU in 2006. Two Consultants were recruited from the
CCDU budget. Subsequently in 2010, following national guidelines the Water and Sanitation Support
Organisation (WSSO) was also constituted. The organogram of WSSO is shown below:
The GoI capacity building budget
Water & Sanitation Support Organisation
provides for the position of a
Director and six Consultants at Director
State level and District Chief
Executive
Officer
Coordinators and Block Resource
Centres in all Blocks. Consultant
Consultant
IEC
Consultant
HRD
Consultant
Water Quality
Consultant
ME cum MIS
Sanitation &
Hygiene
However, a separate Director for Office
Establishment
WSSO has not been recruited.
The Chief Engineer OSWSM (as
the Director, CCDU) has taken
over the additional role of
Director, WSSO although additional budget is available for this position. There is no dedicated position
of State Coordinator for TSC as in some other states like Himachal Pradesh or West Bengal which have
made considerable progress in TSC. A Coordinator at state level with the appropriate competence can
support the OSWSM in monitoring critical performance parameters and plan strategic action.
The OSWSM has recruited 4 Consultants for i) IEC, ii) Water Quality iii) Sanitation and Hygiene and iv)
MIS, against 6 approved positions. Two Consultants (Technical Advisers) – one for CCDU and one for
SSHE- are supported by UNICEF. The quality of technical support available to the State Mission needs
to be substantially augmented with good professionals for the state to achieve total sanitation. Thus
OSWSM has not utilized the resources available from GoI budget fully to procure technical support.
Rapid appraisal of WASH sector Dipak RoyYou can also read