BEACH REPORT CARD - Heal the Bay
←
→
Page content transcription
If your browser does not render page correctly, please read the page content below
BEACH REPORT CARD
BEACH
REPORT
CARD
Heal the Bay is an environmental non-profit dedicated to making the coastal waters and
watersheds of Greater Los Angeles safe, healthy and clean. To fulfill our mission, we use
science, education, community action and advocacy.
The Beach Report Card program is funded by grants from

©2019 Heal the Bay. All Rights Reserved. The fishbones logo is a trademark of Heal the Bay.
The Beach Report Card is a service mark of Heal the Bay.
We at Heal the Bay believe the public has the right to know the water quality at their beaches.
We are proud to provide West Coast residents and visitors with this information in an easy-to-understand format.
We hope beachgoers will use this information to make the decisions necessary to protect their health.

HEAL THE BAY                                      TABLE OF CONTENTS

         THE BEACH REPORT CARD

        SECTION I: INTRODUCTION

        EXECUTIVE SUMMARY....................................................................................4

        ABOUT THE BEACH REPORT CARD (BRC)..................................................6

        SECTION II: WEST COAST SUMMARY

        OVERVIEW OF CALIFORNIA BEACH WATER QUALITY..........................9

        BEACH REPORT CARD: HONOR ROLL........................................................12

        BEACH REPORT CARD: BEACH BUMMERS..............................................16

        TOP TEN BEACH BUMMERS.........................................................................17

        ANALYSIS BY BEACH TYPE.......................................................................... 22

        ANALYSIS BY BEACH TYPE: IMPACTS OF FIRE..................................... 25

        SECTION III: 2018-19 BEACH NEWS

        CLIMATE CHANGE........................................................................................... 27

        FUNDING SHORLINE MONITORING PROGRAMS.................................. 28

        NOWCAST UPDATE......................................................................................... 28

        RIVER REPORT CARD..................................................................................... 28

        NEW BACTERIAL UPDATES.......................................................................... 29

        PROP W................................................................................................................ 29

        SECTION IV: COUNTY SUMMARIES

        COASTAL COUNTIES: CALIFORNIA.............................................................31

        COASTAL COUNTIES: OREGON / WASHINGTON................................... 48

        SECTION V: APPENDICES

        A // HISTORY OF BEACH BUMMERS......................................................... 54

        B1 // GRADES BY COUNTY: CALIFORNIA..................................................55

        B2 // GRADES BY COUNTY: OREGON......................................................... 68

        B3 // GRADES BY COUNTY: WASHINGTON............................................. 69

        C // FREQUENTLY ASKED QUESTIONS..................................................... 74

        D // METHODOLOGY........................................................................................ 76

        E // BILLS............................................................................................................ 78

        G // ACKNOWLEDGEMENTS......................................................................... 79

HEAL THE BAY // 2018-2019 BEACH REPORT CARD                                                                                         3
I. INTRODUCTION                      WELCOME

           executive summary

        California beaches had excellent water
        quality during the summer months of 2018.
        Out of almost 500 beaches across the state,
        94% received A or B grades for the summer.
        This is great news for beachgoers.
        However, the winter months of 2018-2019
        saw an abnormally high amount of rainfall,
        which did not bode well for water quality.
        Rain washes pollutants and contaminants
        into the ocean thus lowering water quality.
        The inordinate amount of rain during the
        winter months led to lower than average
        Wet Weather Grades, and the lingering
        effects of the rain may account for the lower
        Winter Dry Grades. Increased rainfall is also
        why we saw a decrease in the total number
        of beaches receiving perfect scores on our
        Honor Roll list this year.

        ● San Clemente Pier holds the number one Beach
           Bummer spot this year and is one of two Orange
           County beaches to make the list; Monarch Beach at
           Salt Creek holds the number six spot.

        ● Clam Beach at Strawberry Creek in Humboldt
           County is number two on the list marking its sixth
           consecutive appearance as a Beach Bummer.

HEAL THE BAY // 2018-2019 BEACH REPORT CARD                     4
I. INTRODUCTION                         WELCOME

Executive Summary (continued)                 the weeks in a season. Beaches in          to keep the public safe in a changing
                                              only three counties were sampled           environment.
● San Mateo County has two                    only enough to receive grades. Sum-
                                                                                         In the face of climate change, pre-
  beaches on the Bummer list:                 mer Dry Grades in Oregon were
                                                                                         dicting   environmental    conditions
  Linda Mar at San Pedro Creek                good with 78% of the beaches re-
                                                                                         will become increasingly important
  (number three) and Aquatic                  ceiving A and B grades.
                                                                                         as initiatives are implemented that
  Park (number 10). This is an                All coastal counties in Washington         protect human health and the natural
  improvement from last year,                 had beaches sampled enough to              environment. Heal the Bay is lead-
  which saw four San Mateo                    be assigned grades. Summer Dry             ing innovation in predictive water
  County Beach Bummers.                       Grades in Washington were excel-           quality modeling with our NowCast
● The two Los Angeles County                  lent with 97% of the beaches receiv-       program. NowCast accurately pre-
  Beach Bummers came as no                    ing A and B grades. Oregon and             dicts daily water quality at over 20
  surprise as Marina Del Rey                  Washington rely heavily on the U.S.        beaches in California, and we will
  Mother’s Beach (number seven)               Environmental Protection Agency’s          continue to expand our program to
  and Cabrillo Beach Harborside               (U.S. EPA) Beaches Environmental           include more locations to help keep
  (number eight) have been                    Assessment and Coastal Health Act          more beachgoers safe.
  mainstays on the list over the              (BEACH Act) for ocean beach water
  years. Long Beach City Beach                quality monitoring funding. Unfor-
  at Coronado Avenue is making                tunately, the allocation of funds has
  its first appearance on the list at         not increased substantially since its
  number four.                                adoption in 2000.                          Luke Ginger
                                                                                         Heal the Bay
● Cowell Beach has been no                    As the effects of climate change con-
                                                                                         Water Quality Specialist
  stranger to the Beach Bummer                tinue to take hold, patterns in rainfall
  list taking the number five spot            and wildfires are expected to change,
  this year.                                  which can have immense impacts on
                                              water quality. California experienced
● Another newcomer to the
                                              a disproportionate amount of rain
  Bummer list is Keller Beach South
                                              and wildfires over the last year, which
  Beach in Contra Costa County,
                                              brought below average Wet Weather
  which is number nine on the list.
                                              Grades in 11 out of 17 Coastal Coun-
As in the past, many grades could             ties and far below average grades at
not be calculated for the state of Or-        Malibu beaches where the Woolsey
egon this year because the Oregon             Fire burned. It is crucial that govern-
Department of Environmental Quality           ment bodies work to improve their
did not meet our sampling frequen-            water quality monitoring programs
cy standards. To receive a grade a            and invest in projects and technol-
beach must be sampled for 75% of              ogy that will improve water quality

HEAL THE BAY // 2018-2019 BEACH REPORT CARD                                                                                 5
I. INTRODUCTION                     ABOUT THE BRC

THE 2018-19 BEACH REPORT CARD
Since its inception over 25 years ago, the Beach Report Card (BRC) has
provided beachgoers with reliable and easy-to-understand information about
water quality at the beach. The BRC collects shoreline monitoring data from
government agencies and issues grades for beaches across California, Oregon,
and Washington. The better the grade a beach receives,
the lower the risk of illness to beachgoers.

Millions of people flock to beaches every year to
enjoy the ocean, and fortunately, water quality at
West Coast beaches is good 94% of the time during
summer months when beaches are most visited. Good
water quality at the beach is achieved and maintained
through the efforts of nonprofit organizations,
federal and local governments, and concerned
communities. There are still big improvements to be
made. Approximately one million ocean beachgoers
contract illnesses each year in Los Angeles and
Orange Counties with total healthcare costs of $20 to

HEAL THE BAY // 2018-2019 BEACH REPORT CARD                                    6
I. INTRODUCTION ABOUT THE BRC
Introduction (continued) This report assigns three separate streets directly into the ocean through
grades for each beach: storm drains, rivers and streams, and
$50 million1. Nationwide, 90 million over impermeable surfaces such as
SUMMER DRY WEATHER
people contract illnesses from water concrete. This untreated stormwater
April – October 2018
recreation annually at a healthcare decreases water quality by increas-
This is the prime recreation
cost of $3 billion2. The public must ing the amount of pathogens in the
season in California when beaches
have accessible and easy-to- ocean to potentially unsafe levels.
are most active. County govern-
understand information about water Wet Weather Grades consist of sam-
ments are required to sample dur-
quality so they can make informed ples taken during or three days fol-
ing this period according to the Cali-
decisions about where and when to lowing a rain event greater than 0.10
fornia Beach Bathing Water Quality
get in the water. inches. These grades are separate
Standards, as defined in Assembly
from dry weather grades, so we can
The BRC uses an intuitive A-to-F let- Bill 411 (AB411). Samples taken during
analyze water quality impacts that
ter grading system to provide wa- wet weather were not used for these
are not attributed to rainfall.
ter quality information to the public. grades.
This annual report issues cumula- Beachgoers who recreate at beaches
WINTER DRY WEATHER
tive grades for beaches on the West after a rain event have an increased
Nov. 2018 – March 2019
Coast, and provides information risk of contracting ear infections,
AB411 does not mandate wa-
about other important water quality eye infections, upper respiratory
ter quality monitoring for recreational
events that occurred in the past year infections, skin rashes, and gastro-
purposes during winter months lead-
such as sewage spills, rainfall, and intestinal illness3,4,5. Swimmers are
ing many Counties in California to
wildfires. advised to stay out of the water for
halt water quality monitoring in the
Grades are based on routine wa- a minimum of three days following
winter season. Additionally, recre-
ter quality sampling conducted by a significant rain event (0.1 inches or
ation generally decreases at beach-
County health agencies, State agen- greater)6. Local governments across
es during the winter. Therefore, the
cies, sanitation departments, and the West Coast must continue to in-
winter season is graded separately.
dischargers on the West Coast. For vest in stormwater capture projects
Samples taken during wet weather
recreational health protection, water to prevent untreated stormwater
were not used for these grades.
samples are analyzed for three fecal from polluting the ocean while serv-
indicator bacteria (FIB): total coliform, WET WEATHER ing as a water source and alleviating
fecal coliform (E. coli), and Enterococ- CONDITIONS stressed water supplies in times of
cus species. These FIB, in significant April 2018 – March 2019 drought.
quantities, indicate the presence of Rain flushes contaminants and pol-
harmful pathogens in the water. lution, including bacteria from our
1 Given, S., L. H. Pendleton, A. B. Boehm. 2006. Regional public health cost estimates of contaminated coastal waters: a case study of gastroenteritis at Southern California beaches. Environmental Science & Technology 40: 4851-4858.
| 2 DeFlorio-Barker,S., C. Wing, R.M. Jones, S. Dorevitch. 2018. Estimate of incidence and cost of recreational waterborne illness on United States surface waters. Environmental Health 17:3 | 3 Haile, R.W., J.S. Witte, M. Gold, R. Cressey,
C. McGee, R.C. Millikan, A. Glasser, N. Harawa, C. Ervin, P. Harmon, J. Harper, J. Dermand, J. Alamillo, K. Barrett, M. Nides, G. Wang. The health effects of swimming in ocean water contaminated by storm drain runoff. 1999. Epidemiology
Vol. 10 No.4 355-363. | 4 Colford, J.M., T.J. Wade, K.C. Schiff, C.C. Wright, J.F. Griffith, S.K. Sandhu, S. Burns, M. Sobsey, G. Lovelace, S.B. Weisberg. 2007. Water quality indicators and the risk of illness at beaches with nonpoint sources
of fecal contamination. Epidemiology Vol. 10 No. 1 27-35. | 5 Arnold, B.F., K.C. Schiff, A. Ercumen, J. Benjamin-Chung, J.A. Steele, J.F. Griffith, S.J. Steinberg, P. Smith, C.D. McGee, R. Wilson, C. Nelsen, S.B. Weisberg, J.M. Colford.
2017. Acute illness among surfers after exposure to seawater in dry-and wet-weather conditions. American Journal of Epidemiology Vol. 186 No. 7 866-875. | 6 https://www.ioes.ucla.edu/wp-content/uploads/2013healthebayproject-1.pdf
HEAL THE BAY // 2018-2019 BEACH REPORT CARD 7
WEST COAST SUMMARY
II. WEST COAST SUMMARY OVERVIEW
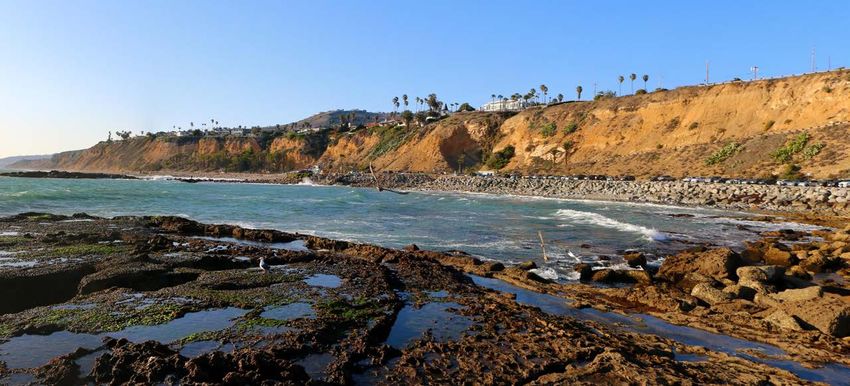
Abalone Cove, Rancho Palos Verdes
OVERVIEW OF CALIFORNIA
BEACH WATER QUALITY
Summer Dry Grades were excellent across the State this year but lower than average with 94% of
California beaches receiving A and B grades. Winter Dry Grades were good but below average with
87% of the beaches receiving A and B grades. Wet Weather Grades for the past year were far below
average with only 54% of the beaches receiving A and B grades.
Note: All averages below refer to the five-year-average unless otherwise indicated.
Coastal Counties in California re- ing bacteria, are being flushed into were excellent with 93% of its beach-
ceived abnormally high amounts of the ocean. es receiving A and B grades.
rain over the last year. All Counties
Wet Weather Grades were good
except Del Norte received above NORTHERN but below average with only 81% of
average rainfall, which is likely why CALIFORNIA OVERVIEW Northern California beaches receiv-
11 out of 17 Coastal Counties had
Northern California consists of all ing A and B grades.
lower than average Wet Weather
counties from Marin County to Del No Counties in Northern California
Grades this year. While rain can alle-
Norte County. monitored beach water quality fre-
viate drought conditions, more rain
means that more pollutants, includ- Summer Dry Grades in this region quently enough during the 2018-
HEAL THE BAY // 2018-2019 BEACH REPORT CARD 9
II. WEST COAST SUMMARY                             OVERVIEW

West Coast Overview (continued)               Winter Dry Grades were superb and         of the beaches receiving A and B
                                              higher than average with 100% of the      grades.
2019 winter months.                           beaches receiving A and B grades.         Winter Dry Grades were good but
The Northern California region re-            Wet Weather Grades were poor and          lower than average with only 85%
ceived 207 inches of rain, which was          considerably lower this year with         of the beaches receiving A and B
the highest compared to the rest of           only 53% receiving A and B grades         grades.
the State and 9% higher than the              compared to the five year average of      Wet Weather Grades were poor and
historical average of 191 inches. The         65%.                                      lower than average with only 50%
increased rainfall is likely why Wet
                                              A total of 167 inches of rain fell in     of the beaches receiving A and B
Weather Grades were below aver-
                                              Central California counties, which        grades.
age. However, most of the rain fell
                                              is 17% higher than the historical av-     Southern California received a total
during the winter months when the
                                              erage of 142 inches. The increased        of 76 inches of rain, which is 43%
beaches are not monitored. As a re-
                                              rainfall is most likely the reason be-    higher than the historical average
sult, the full impact of the increased
                                              hind the lower than average Wet           of 53 inches. The increased rainfall
rainfall is unknown.
                                              Weather Grades.                           most likely caused a decrease in
CENTRAL CALIFORNIA                            SOUTHERN CALIFORNIA
                                                                                        Wet Weather Grades and the linger-
OVERVIEW                                      OVERVIEW
                                                                                        ing effects of the rain may have had
                                                                                        a negative impact on the Winter Dry
Central California consists of all coun-
                                              Southern California consists of all       Grades since most rain fell during
ties from San Luis Obispo County to
                                              counties from San Diego County to         the winter months.
San Francisco County.
                                              Santa Barbara County.
Summer Dry Grades were excellent
                                              Summer Dry Grades were excellent
and slightly above average with 92% of
                                              but lower than average with 95%
its beaches receiving A and B grades.

FIGURE 2-1: CALIFORNIA GRADES (STATEWIDE)                                                                                   1%1%

 Summer Dry (April - October 2018) 461 locations                                                         88%        7% 3%

 Winter Dry (November 2018-March 2019) 326 locations                                          78%        9%         7% 2% 3%

 Wet Weather 444 locations                           44%         10%        8%    5%                                     33%
                                                                                                                         2% 1% 2%

 Summer Dry (Five year average 2013-2018)                                                                    90%    5%

 Winter Dry (Five year average 2013-2018)                                                         80%        9% 4% 2%     5%

 Wet Weather (Five year average 2013-2018)                   51%           11%         9%    6%                          23%

                                                                                                             Key:

HEAL THE BAY // 2018-2019 BEACH REPORT CARD                                                                                 10
II. WEST COAST SUMMARY OVERVIEW
FIGURE 2-2: NORTHERN CALIFORNIA GRADES Key:
Combined grades for Del Norte, Humboldt, Mendocino, Sonoma and Marin Counties
Summer Dry (April - October 2018) 42 locations 88% 5% 5% 2%
Winter Dry (November 2018-March 2019) NO WINTER MONITORING
Wet Weather 43 locations 72% 9% 5% 2% 12%
2% 1% 2%
Summer Dry (Five year average 2013-2018) 90% 4%
Winter Dry (Five year average 2013-2018) NO WINTER MONITORING
Wet Weather (Five year average 2013-2018) 80% 5% 5% 6% 5%
FIGURE 2-3: CENTRAL CALIFORNIA GRADES
Combined grades for San Francisco, San Mateo, Santa Cruz, Monterey and San Luis Obispo Counties
Summer Dry (April - October 2018) 83 locations 73% 18% 2% 4% 2%
Winter Dry (November 2018-March 2019) 42 locations 95% 5%
Wet Weather 97 locations 48% 5% 9% 4% 33%
Summer Dry (Five year average 2013-2018) 80% 9% 5% 2% 3%
Winter Dry (Five year average 2013-2018) 76% 8% 6% 2% 8%
Wet Weather (Five year average 2013-2018) 49% 16% 12% 7% 17%
FIGURE 2-4: SOUTHERN CALIFORNIA GRADES
Combined grades for Santa Barbara, Ventura, Los Angeles, Orange and San Diego Counties
1%1%
Summer Dry (April - October 2018) 336 locations 91% 4% 3%
Winter Dry (November 2018-March 2019) 284 locations 75% 10% 8% 4% 4%
Wet Weather 305 locations 39% 11% 8% 6% 36%
1%1% 1%
Summer Dry (Five year average 2013-2018) 93% 4%
1%
Winter Dry (Five year average 2013-2018) 82% 9% 4%
4%
Wet Weather (Five year average 2013-2018) 48% 10% 8% 6% 27%
HEAL THE BAY // 2018-2019 BEACH REPORT CARD 11II. WEST COAST SUMMARY HONOR ROLL
Cabrillo Beach (ocean side)
BEACH REPORT CARD: HONOR ROLL
To earn a spot on the Honor Roll, a beach must be monitored weekly all year, and the
beach must receive an A+ for all seasons and weather conditions (Summer Dry, Winter
Dry, Wet Weather). This year, 33 of the 500 monitored beaches made it on the Honor Roll,
which is lower than last year (37) likely due to the higher than average rainfall. The Honor
Roll is typically dominated by Southern California beaches because many Northern and
Central California Counties do not monitor beach water quality year-round.
San Diego County had the most Los Angeles County had two beach-
beaches on the Honor Roll with 12. es on the Honor Roll: Cabrillo Beach
Encinitas and Carlsbad beaches (oceanside) and Las Tunas Beach
have been a mainstay on the Honor at Pena Creek. Unfortunately, this
Roll for the past decade. is a decrease from last year when
eight L.A. County beaches made the
Orange County had 10 beaches on
Honor Roll. Three of the four Malibu
the Honor Roll. All four of the New-
beaches fell off the list, as well as all
port beaches from last year’s Honor
three Palos Verdes beaches from
Roll have fallen off the list as well as
last year’s list.
three Dana Point beaches.
HEAL THE BAY // 2018-2019 BEACH REPORT CARD 12II. WEST COAST SUMMARY HONOR ROLL
FIGURE 2-6
Honor Roll (continued)
Ventura County had three beaches
on the Honor Roll this year: Silver- CITY COUNTY MONITORING LOCATION
strand at Santa Paula Dr., Silverstrand
Santa Cruz Santa Cruz Natural Bridges State Beach
at Sawtelle Ave., and Oil Piers Beach.
Pismo Beach SLO Sewers at Silver Shoals Dr.
San Luis Obispo County added Cayucos SLO downcoast of the pier
Cayucos State Beach (downcoast of San Simeon SLO at Pico Avenue
the pier) and Sewers at Silver Shoals Morro Bay SLO City Beach, 75 ft N of parking lot
Dr. to the Honor Roll this year along Guadalupe Santa Barbara Guadalupe Dunes
with Morro Bay City Beach (north of Channel Is.Harbor Ventura At Santa Paula Dr. (south of drain)
parking lot) and San Simeon Beach Channel Is. Harbor Ventura at Sawtelle Ave. (south of drain)
at Pico Ave., which were on the list Ventura Ventura Oil Piers Beach - south of drain
last year. San Pedro Los Angeles Cabrillo Beach, ocean side
Malibu Los Angeles Las Tunas County Beach at Pena Creek
Natural Bridges State Beach in Santa
Dana Point Orange Harbor Youth Dock
Cruz County and Guadalupe Dunes
Huntington Harbor Orange Trinidad Lane Beach
in Santa Barbara County made the
Huntington Harbor Orange Coral Cay Beach
Honor Roll.
Corona del Mar Orange El Moro Beach
Three of the beaches on the Honor Laguna Beach Orange Victoria Beach
Roll are enclosed beaches, which is Dana Point Orange South Capistrano Bay Comm. Beach
an increase from last year when only Dana Point Orange Dana Strands Beach (AWMA)
one enclosed beach made the list. San Clemente Orange Linda Lane Beach
San Clemente Orange North beach at Avenida Pico
San Clemente Orange at Avenida Calafia
Oceanside San Diego projection of Cassidy Street
Carlsbad San Diego projection of Poinsettia Lane
Carlsbad San Diego projection of Ponto Drive
Carlsbad San Diego Encina Creek outlet
Carlsbad San Diego projection of Palomar Airport Rd.
Carlsbad San Diego projection of Cerezo Drive
Solana Beach San Diego Tide Beach Park (proj. Solana Vista Dr.)
Cardiff San Diego Seaside State Park
Cardiff San Diego Las Olas (100 yds. S of Charthouse )
Cardiff San Diego Charthouse parking ( S. of Kilkeny)
Encinitas San Diego San Elijo State Park (proj. Liverpool Dr.)
Encinitas San Diego San Elijo State Park, N. end of stairs
HEAL THE BAY // 2018-2019 BEACH REPORT CARD 13II. WEST COAST SUMMARY HONOR ROLL
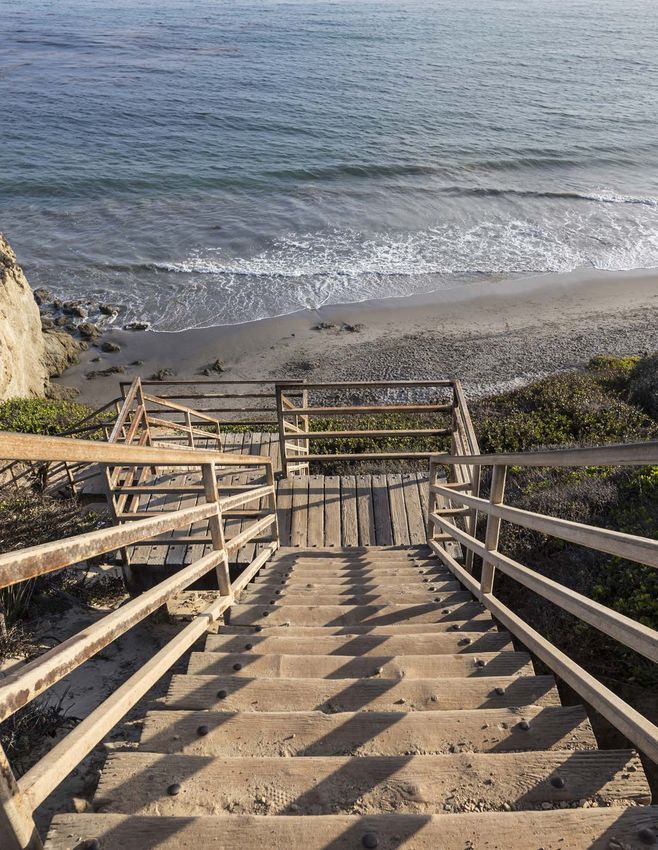
Honor Roll (continued) goon. Dry weather storm flows were Phase 2
diverted into the sewer system where This phase is ongoing and will con-
they can be treated. A trash separa- sist of increasing the connection
BEACH IMPROVEMENT tion device was installed in the storm between the lagoon and the ocean.
SPOTLIGHT: drain to catch trash before it could This will allow for more water circu-
COLORADO LAGOON enter the lagoon. Phase 1 also re- lation in the lagoon, which has been
NORTH, L.A. COUNTY moved thousands of cubic yards of shown to impact water quality (see
Every year, we shine a polluted sediment. Phase 1 was com- beach type analysis). This phase will
spotlight on one beach pleted in 2012, which coincides with also restore the wetland habitats
that has shown a large Colorado Lagoon’s last appearance throughout the lagoon and remove
improvement in water as a Beach Bummer in 2011. invasive species.
quality. We do this to highlight suc-
cessful water quality management
practices. Colorado Lagoon was a
chronic Beach Bummer prior to 2012.
Since then, its grades have greatly
improved. This year, Colorado La-
goon North received an A grade for
Summer Dry, C for Winter Dry, and an
F grade for Wet Weather.
Steps Taken to Improve the Beach:
Restoration projects have been on-
going for the past decade and con-
sist of two phases:
Phase 1
Bioswales were installed to catch
runoff from the neighboring golf Colorado Lagoon
course before it could enter the la-
TABLE 2-5: HISTORICAL GRADES OF COLORADO LAGOON
2018-19 2017-18 2016-17 2015-16 2014-15 2013-14
Summer Winter Wet Summer Winter Wet Summer Winter Wet Summer Winter Wet Summer Winter Wet Summer Winter Wet
Dry Dry Weather Dry Dry Weather Dry Dry Weather Dry Dry Weather Dry Dry Weather Dry Dry Weather
Colorado Lagoon - North A B C A B D n/a n/a n/a A A F A+ A+ F A A+ F
Colorado Lagoon - South A C F A B F n/a n/a n/a A A+ F A+ A+ F A A F
HEAL THE BAY // 2018-2019 BEACH REPORT CARD 14II. WEST COAST SUMMARY HONOR ROLL TABLE 2-6: 2018-19 HONOR ROLL BEACHES AND HISTORICAL GRADES u = Honor Roll = Year Round good or excellent grades = Inconsistent or poor grades n/a = Partial or unavailable grades County/Beach 2018-19 2017-18 2016-17 2015-16 2014-15 2013-14 2012-13 2011-12 Santa Cruz Santa Cruz, Natural Bridges State Beach u SLO Pismo Beach, Sewers at Silver Shoals Drive u SLO Cayucos, downcoast of the pier u u SLO San Simeon, at Pico Avenue u u u SLO Morro Bay, City Beach, 75 ft N of parking lot u u u u Santa Barbara Guadalupe, Guadalupe Dunes u n/a n/a u n/a Ventura Silverstran, Santa Paula Drive u u n/a n/a u Ventura Channel Islands Harbor, at Sawtelle Avenue (south of drain) u u n/a n/a Ventura Ventura, Oil Piers Beach, south of drain u n/a n/a u u Los Angeles San Pedro, Cabrillo Beach, ocean side u u u Los Angeles Malibu, Las Tunas County Beach, Pena Creek u u n/a n/a u u Orange Dana Point Harbor, Youth Dock u u u u n/a n/a n/a Orange Huntington Harbor, Trinidad Lane Beach u n/a n/a n/a Orange Huntington Harbor, Coral Cay Beach u n/a n/a n/a Orange Corona del Mar, El Moro Beach u u n/a u n/a Orange Laguna Beach, Victoria Beach u u u u Orange Dana Point, South Capistrano Bay Community Beach u u u Orange Dana Point, Dana Strands Beach (AWMA) u u Orange San Clemente, Linda Lane Beach u n/a n/a n/a n/a n/a Orange San Clemente, North beach at Avenida Pico u Orange San Clemente, Avenida Calafia u u u u San Diego Oceanside, projection of Cassidy Street u San Diego Carlsbad, projection of Cerezo Drive u u u u n/a u u u San Diego Carlsbad, projection of Palomar Airport Road u u u u n/a u u San Diego Carlsbad, Encina Creek outlet u u u u n/a u u San Diego Carlsbad, projection of Ponto Drive u u u u n/a u u San Diego Carlsbad, projection of Poinsettia Lane u u u u n/a u u San Diego Solana Beach, Tide Beach Park (projection Solana Vista Drive) u u San Diego Cardiff, Seaside State Park u u u San Diego Cardiff, Las Olas (100 yards S of Charthouse ) u u San Diego Cardiff, Charthouse parking ( South of Kilkeny) u u u u San Diego Encinitas, San Elijo State Park (projection of Liverpool Drive) u u u u San Diego Encinitas, San Elijo State Park, north end of stairs u u u u u u HEAL THE BAY // 2018-2019 BEACH REPORT CARD 15
II. WEST COAST SUMMARY                            BEACH BUMMERS

      San Clemente Pier

BEACH REPORT CARD:
BEACH BUMMERS
Unfortunately, every beach does not make the Honor Roll.
The beaches that received the ten poorest Summer Grades are called
Beach Bummers. Following are the Beach Bummers for 2018-19.

  1     SAN CLEMENTE PIER                     Tracking (MST) study, which will help
        ORANGE COUNTY                         identify the sources of bacteria in the
                                              ocean by examining genetic markers
San Clemente Pier was one of two
                                              specific to certain animal groups (e.g.
Orange County beaches to make
                                              humans, cows, dogs, horses, birds).
the Beach Bummer list this year.
                                              The City has also installed bird de-
San Clemente Pier last appeared on
                                              terrent netting under the pier to help
the Beach Bummer list in 2016. This
                                              prevent bacteria-containing bird ex-
beach is impacted by untreated dry
                                              crement from entering the water. In
weather runoff that flows into the
                                              April 2019, the City of San Clemente
ocean through a nearby storm drain.
                                              formed their Ocean Water Quality
The City of San Clemente is cur-              Subcommittee to address the poor
rently conducting a Microbial Source          water quality around the pier.

HEAL THE BAY // 2018-2019 BEACH REPORT CARD                                             16
II. WEST COAST SUMMARY BEACH BUMMERS
FIGURE 2-7
Beach Bummers (continued)
2 CLAM BEACH
HUMBOLDT COUNTY
San Clemente Pier Drain
CHRONIC BEACH BUMMER 1 SAN CLEMENTE // ORANGE COUNTY
This chronic Beach Bummer is on
the list for the sixth straight year. Clam Beach County Park near Strawberry Creek
Water quality at this beach is nega- 2 MCKINLEYVILLE // HUMBOLDT COUNTY
tively impacted by agricultural runoff
that flows into the ocean via Patrick
Linda Mar Beach at San Pedro Creek
Creek and Strawberry Creek. Hum-
boldt County officials are actively
3 PACIFICA // SAN MATEO COUNTY
working to identify the largest sourc-
es of bacterial pollution at this beach. Long Beach City Beach at Coronado Avenue
4 LONG BEACH // LOS ANGELES COUNTY
LINDA MAR BEACH
3 AT SAN PEDRO CREEK
Cowell Beach, west of the wharf
SAN MATEO COUNTY 5 SANTA CRUZ // SANTA CRUZ COUNTY
Linda Mar Beach has made a sec-
ond consecutive appearance on the
Monarch Beach North at Salt Creek
Beach Bummer list, and is one of
two San Mateo County beaches on
6 DANA POINT // ORANGE COUNTY
the list this year. This beach is im-
pacted by runoff during dry weather, Mother's Beach, between Tower and Boat Dock
which flows untreated into the ocean 7 MARINA DEL REY // LOS ANGELES COUNTY
through San Pedro Creek.
Cabrillo Beach, harborside at restrooms
LONG BEACH 8 SAN PEDRO // LOS ANGELES COUNTY
4 AT CORONADO AVENUE
LOS ANGELES COUNTY
Keller Beach, South Beach
Long Beach City Beach at Coronado 9 RICHMOND // CONTRA COSTA COUNTY
Ave. is making its first appearance
on the Beach Bummer list, and is
Aquatic Park
one of three L.A. County beaches
on the list this year. Water quality at
10 SAN MATEO // SAN MATEO COUNTY
HEAL THE BAY // 2018-2019 BEACH REPORT CARD 17II. WEST COAST SUMMARY BEACH BUMMERS
Beach Bummers (continued)
this beach is negatively impacted by
dry weather runoff, which flows into
the ocean through a storm drain on
the beach. Currently, the City of Long
Beach is implementing the Municipal
Urban Stormwater Treatment (MUST)
project. The MUST project will catch
stormwater and treat it before it
can enter the L.A. River and subse-
quently impact ocean beaches. The
treated water will ultimately be used 5th Street
to support wetland restorations. 10th Street
Molino Avenue
Coronado Avenue
Belmont Pier
Prospect Avenue
Granada Avenue
Long Beach
TABLE 2-8: HISTORICAL GRADES OF LONG BEACH CITY BEACH
Long Beach 2018-19 2017-18 2016-17 2015-16 2014-15 2013-14 2012-13
monitoring Summer Winter Wet Summer Winter Wet Summer Winter Wet Summer Winter Wet Summer Winter Wet Summer Winter Wet Summer Winter Wet
locations Dry Dry Weather Dry Dry Weather Dry Dry Weather Dry Dry Weather Dry Dry Weather Dry Dry Weather Dry Dry Weather
5th Street A C F A B F A C F A A F A B F B B F A A C
10th Street A B F A B F A C F A A F A A F B A F B A C
Molino Ave. C A F A B F A C F A C F A A F B A F A A C
Coronado
F B F A A F C B F A A F A A F B A F C A B
Avenue
Belmont Pier B A F A D F A B F A A+ F A B F B A F C A B
Prospect Ave. C A F A C F A B F A A F A+ A F B A F B A B
Granada Ave. C A F B B F B C F B C F A+ A F C A F B A A
HEAL THE BAY // 2018-2019 BEACH REPORT CARD 18II. WEST COAST SUMMARY BEACH BUMMERS
Beach Bummers (continued)
COWELL BEACH
5 WEST OF WHARF
SANTA CRUZ COUNTY
CHRONIC BEACH BUMMER
This chronic Beach Bummer is mak-
ing its tenth straight appearance on
the list this year. Water quality at this
beach is negatively impacted by un- Cowell Beach, Santa Cruz
treated dry weather runoff that flows
into the ocean through a storm drain
on the beach. The County of Santa years to improve the water quality at makes it a popular beach for fami-
Cruz, City of Santa Cruz along with this beach. A bird abatement project lies.
Nonprofit partners has formed the was implemented, which consisted
L.A. County has installed bird exclu-
Cowell’s Working Group (CWG), of deterring seagulls with a falcon.
sion devices and water circulators
which is dedicated to improving wa- The City also installed a facility that
to help remediate the problem. The
ter quality at this beach. The CWG treated water flowing from Salt Creek
restroom building underwent reno-
has conducted studies to determine before it could enter the ocean.
vations last year replaced pipes and
the sources and distributions of bac-
sewer lines. Bioswales designed to
teria at the beach. Another goal of MARINA DEL REY, catch runoff before it can enter the
CWG is to spread public awareness 7 MOTHERS BEACH
water were also installed.
about water quality at Cowell Beach. LOS ANGELES COUNTY
CHRONIC BEACH BUMMER
MONARCH BEACH CABRILLO BEACH
6 AT SALT CREEK
Marina Del Rey Mother’s Beach is 8 INNER/HARBOR SIDE
making its fifth appearance on the
ORANGE COUNTY LOS ANGELES COUNTY
list this year and is one of three L.A.
Monarch Beach last appeared on CHRONIC BEACH BUMMER
County Beach Bummers. This beach
the Beach Bummer list in 2015 and is This beach has appeared on the list
is considered enclosed because it
the second Orange County beach to eight times in the last 10 years and is
is located within the marina and the
make the list this year. Water quality one of three L.A. County Beach Bum-
only connection to the open ocean
at this beach is negatively impacted mers. Cabrillo Beach (harborside) is
is through the marina’s entry and
by untreated dry weather runoff that enclosed by a seawall that cuts the
exit channel. Because it is enclosed,
flows into the ocean through a storm beach off from the open ocean. The
there is little water circulation and
drain on the beach. seawall and lack of waves do not al-
bacteria and other pollution do not
The City of Dana Point has imple- get flushed away from the beach. low for sufficient water circulation;
mented several projects in recent The lack of waves at this beach as a result, bacteria and other pollut-
HEAL THE BAY // 2018-2019 BEACH REPORT CARD 19II. WEST COAST SUMMARY BEACH BUMMERS
Beach Bummers (continued) TABLE 2-90: SEWAGE SPILLS IN 2018-19 BY CALIFORNIA COUNTY
Number Volume of Spills Volume that reached # that reached
County
of Spills (in gallons) surface water surface water
ants can build up in the water. The
Del Norte County 5 30,575 30,460 5
absence of large waves and a strong
Humboldt County 15 251,910 134,902 15
current makes it a popular beach for Mendocino County 2 3,086 3,030 2
families with young children. Sonoma County 45 2,836,110 2,833,713 45
Marin County 41 361,657 247,861 41
In 2016, a study concluded that the
San Francisco County 4 19,780 19,780 4
elevated Enterococcus levels were
Contra Costa County 39 2,452,543 2,440,152 39
correlated with bird concentrations Alameda County 32 74,186 70,345 32
at the beach. However, this study San Mateo County 35 223,606 155,107 35
also detected a human source of Santa Cruz County 4 19,922 19,722 4
bacteria of unknown origin. Subse- Monterey County 4 4,960 4,269 4
quent studies have tried to identify SLO County 7 59,500 56,500 7
Santa Barbara County 4 2,057 742 4
where the bacteria are coming from,
Ventura County 4 7,990 5,130 4
but these studies were ultimately
Los Angeles County 96 1,545,819 1,308,852 96
inconclusive. In 2017, the sewage
Orange County 28 42,547 19,102 28
infrastructure at the beach was re- San Diego County 23 183,634 118,936 23
placed, but the human bacteria per- Total 388 8,119,882 7,468,603 388
sisted7.
KELLER BEACH beds themselves may also be a This beach is also surrounded on all
9 source of bacteria as aquatic plants sides by residential housing so it is
CONTRA COSTA COUNTY
have been shown to harbor FIB spe- heavily impacted by runoff.
Keller Beach South Beach is in Con-
cies . 8,9
tra Costa County and is making its The City of San Mateo has a goose
first appearance on the Beach Bum- control program in place to reduce
AQUATIC PARK the impact that goose excrement has
mer list. This beach is in the San 10
SAN MATEO COUNTY on the water quality. The City of San
Francisco Bay and is connected to
the open ocean via the Golden Gate Aquatic Park was on the Beach Bum- Mateo is also working on improving
Strait. There is little water circulation mer list in 2014 and is the second San its sewer infrastructure with their Ba-
at this beach due to its lack of waves Mateo County beach to make the list sin C Sanitary Sewer Rehabilitation
and the surrounding seagrass beds. this year. This beach sits in a channel Project, which started in 2019.
Bacteria and other pollution are not within the San Francisco Bay making
easily flushed away from the beach it even more cut off from the open
and can build up. The seagrass ocean than a typical enclosed beach.
7 http://ftp.sccwrp.org/pub/download/DOCUMENTS/TechnicalReports/1068_CabrilloQMRA.pdf
8 Odonkor, S. T., J. K. Ampofo. Escherichia coli as an indicator of bacteriological quality of water: an overview. 2013. Mibiology Research volume 4:e2.
9 yappanahalli, M. N., M. B. Nevers, A. Korajkic, Z. R. Staley, V. J. Harwood. Enterococci in the Environment. 2012. Microbiology and Molecular Biology Reviews volume 76: 685-706.
HEAL THE BAY // 2018-2019 BEACH REPORT CARD 20II. WEST COAST SUMMARY BEACH BUMMERS
TABLE 2-10: 2018-19 BEACH BUMMERS AND RECENT HISTORY
2018-19 2017-18 2016-17 2015-16
Summer Winter Wet Summer Winter Wet Summer Winter Wet Summer Winter Wet
2018-19 Beach Bummers County Dry Dry Weather Dry Dry Weather Dry Dry Weather Dry Dry Weather
1 San Clemente Pier, San Clemente Orange County F D A+ C F F F F C B A n/a
2 Clam Beach County Park, McKinleyville Humboldt County F n/a B F n/a C F n/a F F n/a F
3 Linda Mar Beach, Pacifica San Mateo County F n/a F F F F C A F A C F
4 Long Beach @ Coronado Avenue Los Angeles County F B F B A F C B F A A F
5 Cowell Beach, Santa Cruz Santa Cruz County F A C D B B F A F F A+ D
6 Monarch Beach, Dana Point Orange County F C D C F F D F F F F F
7 Mother's Beach, Marina del Rey Los Angeles County D F F A F B D F F F F F
8 Cabrillo Beach (@ restrooms), San Pedro Los Angeles County D F F D F F B B F A A D
9 Keller Beach South, Richmond Contra Costa County D n/a A B n/a A C n/a D B n/a A
10 Aquatic Park, San Mateo San Mateo County D n/a A B n/a F B B F C F F
TABLE 2-11: MOST BEACH BUMMER APPEARANCES DURING LAST DECADE
Number of 2018-19 17-18 16-17 15-16 14-15 13-14 12-13 11-12 10-11 09-10
Beach/County County appearances Rank Rank Rank Rank Rank Rank Rank Rank Rank Rank
Cowell Beach, Santa Cruz Santa Cruz County 10 5 8 3 1 1 1 2 2 1 2
Cabrillo Beach at restrooms Los Angeles County 8 8 9 9 4 4 6 3 3
Santa Monica Pier Los Angeles County 6 7 6 5 6 7 5
Clam Beach County Park Humboldt County 6 2 4 1 2 3 6
Poche Beach, San Clemente Orange County 5 1 3 8 5 4
Marina Lagoon, Lakeshore Park San Mateo County 5 2 4 4 2 6
Mother's Beach, Marina del Rey Los Angeles County 5 7 9 6 2 3
Capitola Beach, Capitola Santa Cruz County 4 7 9 10 8
Avalon Beach, Catalina Island Los Angeles County 4 1 1 2 1
Monarch Beach Orange County 3 6 10 4
FOR THE COMPLETE LIST OF BEACH BUMMERS DURING THE LAST DECADE, SEE PAGE 54.
HEAL THE BAY // 2018-2019 BEACH REPORT CARD 21II. WEST COAST SUMMARY ANALYSIS BY BEACH TYPE
Monarch Beach
2018-19 OPEN OCEAN VS.
STORM DRAIN VS.
Beaches
with Good
(A or B)
Grades Open Ocean
Beaches
Storm Drain
Impacted
Enclosed
Waterbodies ENCLOSED BEACHES
Not all beaches are the same when it comes to
99% 92% 94% water quality. We have categorized California’s
Summer Dry beaches into three groups for our analysis:
1) Open Ocean Beaches
2) Storm Drain-impacted Beaches
88% 84% 84% 3) Enclosed Beaches
Winter Dry
OPEN BEACHES
76% 48% 38% Open beaches do not have obstructions between the beach
Wet Weather and open water. They experience waves and greater wa-
ter circulation than a non-open or enclosed beach. These
beaches do not have nearby storm drains, streams, or rivers.
Open beaches have better water quality than enclosed or
storm drain, stream, or river beaches, making them great for
HEAL THE BAY // 2018-2019 BEACH REPORT CARD 22II. WEST COAST SUMMARY ANALYSIS BY BEACH TYPE
BeachTypes (continued) FIGURE 2-12: GRADES BY TIME PERIOD & BEACH TYPE
: A+B GRADES : C+D+F GRADES
recreation. We have classified 92 beaches as SUMMER DRY GRADES (APRIL - OCTOBER 2018)
open. Summer Dry Grades were excellent with
Open Ocean Storm Drain Enclosed
99% of the beaches receiving A and B grades. (93 locations) (237 locations) (93 locations)
2018 5-Year Avg. 2018 5-Year Avg. 2018 5-Year Avg.
Winter Dry Grades were good but below av-
erage with 88% of the beaches receiving A 99% 100% 92% 96% 94% 93%
and B grades.
Wet Weather Grades were good with 76% of
the beaches receiving A and B grades.
Open beaches have better water quality
than enclosed or storm drain, stream, or river 8% 4% 6% 7%
1%
beaches, making them great for recreation.
As indicated by the poor Wet Weather Grades, WINTER DRY GRADES (NOVEMBER 2018 - MARCH 2019)
open beaches are still impacted by stormwa- Open Ocean Storm Drain Enclosed
(66 locations) (157 locations) (64 locations)
ter. We advise people to avoid contact with
2018-19 5-Year Avg. 2018-19 5-Year Avg. 2018-19 5-Year Avg.
water for at least three days following a sig-
nificant rain event. 88% 96% 84% 88% 84% 85%
STORM DRAIN, STREAM,
AND RIVER BEACHES
Beaches with storm drains, streams, or rivers
12% 16% 12% 16% 15%
flowing into them receive high amounts of
4%
runoff. We recommend swimming at least 100
yards away from storm drains, streams, and WET WEATHER GRADES (APRIL 2018 - MARCH 2019)
rivers at the beach. Also, avoid contact with
Open Ocean Storm Drain Enclosed
the water for at least three days following a (88 locations) (222 locations) (92 locations)
rain event. We have classified 237 beaches as 2018-19 5-Year Avg. 2018-19 5-Year Avg. 2018-19 5-Year Avg.
impacted by storm drains, streams, or rivers. 76% 79% 48% 63% 38% 31%
Summer Dry Grades were good but below 69%
62%
average with 92% of the beaches receiving A 52%
and B grades.
37%
Winter Dry Grades were good but below aver- 24% 21%
age with 84% of the beaches receiving A and
B grades.
HEAL THE BAY // 2018-2019 BEACH REPORT CARD 23II. WEST COAST SUMMARY ANALYSIS BY BEACH TYPE
Beach Types (continued)
Wet Weather Grades were poor and
far below average with only 49%
of the beaches receiving A and B
grades. This is likely due to the large
increase in rainfall over the last year.
Avoid contact with the water for at
least three days following a rain event.
Mother's Beach, Marina del Rey
The top six beaches on this year’s
Beach Bummer list are impacted by
TABLE 2-13: SUMMER WATER QUALITY AT L.A. CO. ENCLOSED BEACHES
runoff through a storm drain, river, or
stream. Beach/County 2018-19 2017-18 2016-17 2015-16 2014-15 2013-14
Mother's Beach – Playground Area
A A A C F A
Marina del Rey
ENCLOSED BEACHES Mother's Beach – Lifeguard Tower
A A A B F B
Marina del Rey
Enclosed beaches have obstructions
Mother's Beach – bet. Tower /Dock
like a land mass or wall blocking the Marina del Rey
D A D F F F
beach from the open water. There- Cabrillo Beach –
D D B A D F
fore, these beaches do not receive harborside @ restrooms
waves and have poor water circula-
tion. Enclosed beaches are usually
found in lagoons, marinas, and har-
higher than average with 38% of the ity because fires damage sewage in-
bors. Due to their calm waters, en-
beaches receiving A and B grades. frastructure and increase the amount
closed beaches are popular areas
of runoff due to vegetation loss.
for small children and are frequently Four Beach Bummers this year are
We compared Winter Dry Grades
named “baby beach” or something enclosed beaches.
for Malibu beaches going back five
similar. We have classified 93 beach-
years to see if there was a noticeable
es as enclosed. IMPACT OF FIRE effect of the Woolsey Fire. We ana-
Summer Dry Grades for enclosed In early November 2018, the Woolsey lyzed Winter Dry Grades because
beaches were excellent with 94% re- Fire burned 96,949 acres of land and the fire happened in early November
ceiving A and B grades. destroyed 1,500 structures across and thus Summer Dry Grades would
Malibu, Calabasas, and Thousand not capture the effects of the fire. We
Winter Dry Grades were also good
Oaks . Major wildfires such as this
10
also wanted to eliminate differences
with 84% of the beaches receiving A
can have a big impact on water qual- in grades due to rainfall, therefore
and B grades.
Wet Weather Grades were poor but https://cdfdata.fire.ca.gov/incidents/incidents_details_info?incident_id=2282#main_content
HEAL THE BAY // 2018-2019 BEACH REPORT CARD 24II. WEST COAST SUMMARY ANALYSIS BY BEACH TYPE
Beach Types (continued)
Wet Weather Grades were not used
for comparison. However, we ac-
knowledge that the effects of heavy
rainfall may extend beyond the three
days post-rain that are classified as
wet weather.
Over the last five years, 87% of the
Woolsey Fire
Malibu beaches received A and
B Winter Dry Grades. Winter Dry
Grades this year were substantially TABLE 2-14: EFFECTS OF FIRE ON WATER QUALITY GRADES
lower with only 57% of the beach- Good Grades (A and B) Poor Grades (C-F)
es receiving A and B grades. This
Year/ No. of Grades # % # %
dropoff is particularly substantial
2013-2014 21 18 86% 3 14%
considering that 100% of the beach-
es in Malibu received A and B grades 2014-2015 22 15 68% 7 32%
in the year prior to the fire. Also, in 2015-2016 20 19 95% 1 5%
the five years before the fire, the
2016-2017 21 18 86% 3 14%
lowest grades for Malibu beaches
2017-2018 22 22 100% 0 –
occurred in 2014-2015 with 68% re-
ceiving A and B grades. This is 11 Pre Fire Grades 106 87% 13%
percentage points higher than the
2018-2019 21 12 57% 9 43%
57% A and B grades post fire. More
Post Fire Grades 21 57% 43%
research must be done to measure
how long the impacts of this fire will
last, but we will continue to monitor
the Malibu beaches and post grades
on beachreportcard.org.
HEAL THE BAY // 2018-2019 BEACH REPORT CARD 25BEACH NEWS
III. BEACH NEWS

      Santa Monica, north of Pier

BEACH NEWS: UPDATES
The Beach News section discusses some of the major issues that
impacted beach water quality over the past year.

CLIMATE CHANGE                                coastal areas on the West Coast                                                    made. Governments must continue
                                              will receive more rain11. Additionally,                                            to invest in projects that capture and
Unfortunately, climate change is in-
                                              changing patterns in rainfall coupled                                              reuse stormwater because the ben-
evitable with more and more of its            with changes in wind patterns are                                                  efits will be threefold. One, capture
impacts realized every day. At this           expected to increase the frequency                                                 and reuse prevents pollution from
point, we can only work toward limit-         and size of wildfires12.                                                           reaching the ocean, thus protecting
ing the negative impacts that climate         Governments, leaders, and the pub-                                                 public health and the natural environ-
change will have on our health and            lic must take immediate action to mit-                                             ment. Two, capture and reuse reduc-
environment. One potential impact             igate the effects of climate change                                                es the amount of water imported to
of climate change is poorer recre-            and pollution. Many local govern-                                                  Southern California and subsequent-
ational water quality along the West          ments have made enormous efforts                                                   ly reduces the fossil fuels used to
Coast. As we have shown, rain and             to identify and eliminate runoff enter-                                            transport the water. Three, the cap-
wildfire significantly decrease wa-           ing the ocean, but across the board                                                tured water could be used to restore
ter quality by increasing the amount          there are still improvements to be                                                 natural coastal habitat which can mit-
of pollution that reaches the ocean.          11 Neelin, J.D., B. Langenbrunner, J.E. Meyerson, A. Hall, N. Berg. 2013. California winter precipitation change under global warming in the coupled model
                                              intercomparison project phase 5 ensemble. Journal of Climate Vol. 26 6238-6256.
As the climate changes, most of the           12 http://www.climateassessment.ca.gov/techreports/docs/20180827-Projections_CCCA4-CEC-2018-014.pdf

HEAL THE BAY // 2018-2019 BEACH REPORT CARD                                                                                                                                                         27
III. BEACH NEWS
Beach News (continued) was secured for 2019, the funding Cast website and app. NowCast is
under the BEACH Act continues to able to predict concentrations of
igate against the effects of climate be threatened each year, and the bacteria in the water on a daily ba-
change such as sea level rise. In ad- amount has not increased signifi- sis thus providing additional infor-
dition, governments should consider cantly since it was adopted in 2000. mation to the public and filling in the
implementing policies and programs The Federal Government must in- time gaps of traditional bacteria sam-
that will reduce the impacts of fire, crease funding for the BEACH Act so pling. NowCast consists of computer
rain, and floods such as limits on the coastal states can keep their commu- models that examine correlations
amount of development allowed in nities and visitors safe and healthy. between environmental conditions
fire and flood prone areas. (such as temperature and tide) and
States will also likely need to take
historical bacteria concentrations.
local action to maintain a robust
Our models then predict how much
FUNDING SHORELINE recreational water quality program
bacteria are present in the water
MONITORING moving forward. California funds
given the current local conditions at
PROGRAMS statewide beach monitoring pro-
the beach. Visit beachreportcard.org
grams with BEACH Act resources
Going against President Donald to find daily predictions for beaches
as well as Senate Bill 482 (SB482),
Trump’s recommendations, the U.S. in California. The Beach Report Card
which funds two-thirds of the non-
Congress passed a 2019 budget that with NowCast app is available for
regulatory based shoreline moni-
did not make cuts to the U.S. EPA’s free on iOS and Android devices.
toring in the State. SB4482 Alloca-
Beaches Environmental Assessment
tion is overseen by the State Water
and Coastal Health Act (BEACH Act).
Resources Control Board (SWRCB). RIVER REPORT CARD
This program funds water quality
However, the funds provided are not This past May Heal the Bay released
monitoring in coastal U.S. areas with
sufficient as there are many beaches its first Annual River Report Card. The
some States, such as Oregon, rely-
that do not get monitored, and many River Report Card uses color-grades
ing solely on these grants to sustain
counties do not conduct monitor- of Red, Yellow, or Green for 27 fresh-
their monitoring program. Without
ing year round. We recommend that water recreation sites in Los Angeles
the BEACH Act funding, many states
the SWRCB provide additional water County. Grades are based on levels
would abandon their beach monitor-
quality funding, so counties can ex- of bacteria monitored in 2018 and
ing programs, which would be dev-
pand their monitoring programs year prior years.
astating to public health. Millions of
round. The SWRCB must also ensure
people could get sick by unknow- The River Report Card is the most
that every beach applicable under
ingly exposing themselves to poor comprehensive water quality report
AB411 is monitored.
water quality. The economic cost to date on bacterial pollution in popu-
would also be severe as coastal rec- lar freshwater recreation areas within
reation and tourism generates well NOWCAST UPDATE the Los Angeles River Watershed, the
over $100 billion annually13. For the fourth straight summer, Heal Malibu Creek Watershed, and the San
the Bay is providing daily water qual- Gabriel River Watershed. These val-
While funding for the BEACH Act
ity predictions for California Beaches ued public places are often used for
13 https://coast.noaa.gov/data/digitalcoast/pdf/econ-report.pdf at the Beach Report Card with Now- swimming, wading, fishing, kayaking,
HEAL THE BAY // 2018-2019 BEACH REPORT CARD 28III. BEACH NEWS
Beach News (continued) do not affect public water quality no- from Enterococcus exceedances
tifications at the beach, which are laid (according to Beach Report Card da-
and other activities, especially during out in AB411. Despite that, the newly tabase), and the World Health Orga-
summer months when communities passed objectives are concerning nization advises that at least two FIB
seek relief from hot SoCal days. because they are not as protective should be measured to properly pro-
to public health as they should be. tect public health16. Using the latest
Since we started monitoring freshwa- The SWRCB increased the allowable research and data, Heal the Bay sci-
ter recreation sites and making wa- amount of Enterococcus in the water entists with the help of other groups
ter quality data public, some positive from 104 cfu/100ml to 110 cfu/100ml. successfully convinced the SWRCB
changes have included increased In other words, a waterbody can to retain fecal coliform bacterial ob-
bacterial monitoring and public no- have more bacteria than before and jectives in August 2018.
tification signage in L.A. River rec- still be compliant. The SWRCB also
reation zones as well as increased changed the geometric mean objec-
dissemination of water quality infor-
MEASURE W
tive for Enterococcus from 35/100ml
mation to the public through emails, A recent success for L.A. County’s
(30-day geometric mean) to 30/100ml
websites, and other online means water quality was the passage of
(6-week geometric mean). Chang-
by government agencies collecting Measure W in November 2018. Heal
ing the 30-day geometric mean to a
water quality information. Our annual the Bay played an integral role in
6-week geometric mean has no sci-
River Report Card 2018 includes ad- the passing of Measure W, which
entific basis and does not incentivize
ditional recommendations for water will fund stormwater improvement
monitoring agencies to sample the
quality monitoring and public notifi- projects around the County. Heal
water weekly. Monitoring agencies
cation protocols to be the most pro- the Bay, along with partners in the
now have two extra weeks to collect
tective of public health. OurWaterLA Coalition, are currently
the same amount of samples, which
working to ensure that nongovern-
Before heading to a freshwater rec- is not in the best interest of pub-
mental stakeholders have decision
reation area in L.A. County check out lic health. Water quality information
making roles in the prioritization of
our River Report Card at healthebay. needs to be readily available in order
projects. We want to ensure that
org/riverreportcard, which is updated for it to be useful.
nature-based, equitable, and multi-
regularly during the summer months. The SWRCB also proposed to re- benefit projects are prioritized and
move fecal coliform bacteria from implemented. We support projects
NEW BACTERIAL the updated bacterial objectives. that improve watershed health and
OBJECTIVES This would have left Enterococcus water quality, such as projects that
(ADOPTED AUGUST 2018) as the sole bacteria used for TMDL address stormwater runoff and ex-
compliance and EPA 303(d) listing. pand and improve green space for
In August 2018, the SWRCB approved
Removing fecal coliform objectives is all.
new TMDL and 303(d) bacterial ob-
problematic because fecal coliform
jectives for recreational waterbodies
exceedances are often independent
to align the objectives with the U.S.
EPA’s 2012 Recreational Water Qual-
14 https://www.waterboards.ca.gov/bacterialobjectives
ity Criteria14,15. These new objectives 15 https://www.epa.gov/wqc/2012-recreational-water-quality-criteria-documents
16 https://www.who.int/water_sanitation_health/bathing/srwg1.pdf
HEAL THE BAY // 2018-2019 BEACH REPORT CARD 29COUNTY SUMMARIES
IV. CALIFORNIA COUNTY SUMMARIES

      Malaga Cove, Palos Verdes Estates

COASTAL COUNTIES: CALIFORNIA
Heal the Bay provides Beach Report Card grades for all coastal counties
in California from Del Norte to San Diego. Here is a brief summary of
each county’s monitoring program over the past year, water quality
grades, rainfall amounts, and a summary of sewage spills.

Note: All averages below refer to the five-year-average unless otherwise indicated.

Heal the Bay provides a summer                         Grades are categorized as wet weath-     to see differences in dry versus wet
(AB411) dry grade and a winter dry                     er for any sample taken throughout       weather water quality.
grade for a beach if the public agen-                  the whole year (April 1, 2018 to March   Sewage     spill   data   is   obtained
cy collected weekly samples for at                     31, 2019) during or within 72 hours of   through the State Water Resources
least 75% of the monitoring time-pe-                   a rain event of at least 0.10 inches.    Control Board’s SSO (Sanitary Sewer
riod. To receive a summer dry grade,                   The difference in frequency of rain      Overflow) online database. Only Cat-
there had to be at least 23 samples                    events between counties makes it         egory 1 sewage data is recorded for
collected between April 1 and Octo-                    impossible to determine a minimum        each county. Category 1 describes
ber 31. For a winter dry grade, there                  sampling threshold for a grade. Thus,    discharges of untreated or partially
had to be at least 16 samples collect-                 Heal the Bay generates a grade for       treated wastewater of any volume
ed between November 1, 2018 and                        wet weather regardless of the sam-       resulting from a sanitary sewage sys-
March 31, 2019.                                        ple size. This enables beachgoers        tem failure.

HEAL THE BAY // 2018-2019 BEACH REPORT CARD                                                                                          31
IV. CALIFORNIA COUNTY SUMMARIES SAN DIEGO
San Diego County San Diego County Grades
2018-2019 5-Year Avg. (2013-2018)
Summer Dry Grades were excellent and close to the five- Summer Dry* Winter Dry Wet Weather Summer Dry* Winter Dry Wet Weather
# % # % # % # % # % # %
year average with 97% of the beaches receiving A and B
A 72 95% 33 73% 27 60% 69 94% 34 88% 37 66%
grades.
B 2 3% 5 11% 4 9% 3 4% 1 4% 6 10%
Wet Weather Grades were poor and lower than average
C 2 3% 3 7% 1 2% 1 1% 0 1% 4 6%
with only 69% of the beaches receiving A and B grades.
D 0 0% 3 7% 2 4% 0 1% 1 2% 2 4%
Winter Dry Grades were good but lower than average with
F 0 0% 1 2% 11 24% 0 1% 2 6% 8 14%
only 84% of beaches receiving A and B grades.
Total 71 45 45 73 38 56
A total of 12 beaches made it on the Honor Roll comprising *State AB411 monitoring April thru October. Percentages may not add up to 100 due to rounding.
over a third of the beaches on the list.
Sewage Spill Summary
San Diego County received 12 inches of rain, which is 37%
higher than the historical average of nine inches. This may 118,936
GALLONS OF SEWAGE
account for the lower than average Wet Weather and Win- Total volume reported to have reached a waterbody in San Diego County
ter Dry Grades since most of the rainfall occurred in the
winter months.
Honor Roll
There were 23 sewage spills across the County amounting Summer Winter Wet
Dry Dry Weather
to 183,634 gallons. Oceanside and Del Mar beaches were
Oceanside, projection of Cassidy Street A+ A+ A+
impacted by spills.
Carlsbad, projection of Cerezo Drive A+ A+ A+
A complete list of grades for San Diego County’s beach monitoring locations can be
Carlsbad, projection of Palomar Airport Road A+ A+ A+
found in Appendix B-1.
Monitoring agencies in San Diego County: Carlsbad, Encina Creek outlet A+ A+ A+
• The City of Oceanside
• The City of San Diego Carlsbad, projection of Ponto Drive A+ A+ A+
• Encina Wastewater Authority
• San Elijo Joint Powers Authority Carlsbad, projection of Pointsettia Lane A+ A+ A+
• Port of San Diego
• The County of San Diego Department of Environmental Health (DEH)
Encinitas, San Elijo State Park, north end A+ A+ A+
For additional water quality information: Encinitas, San Elijo State Park, Liverpool Drive A+ A+ A+
County of San Diego Department of Environmental Health
www.sdbeachinfo.com Cardiff State Beach, Charthouse parking lot A+ A+ A+
Cardiff State Beach, Las Olas A+ A+ A+
Cardiff State Beach, Seaside State park A+ A+ A+
Solana Beach, Tide Beach Park A+ A+ A+
HEAL THE BAY // 2018-2019 BEACH REPORT CARD 32You can also read