Weather and Climate Informatics for the Electricity Sector - Subdaily Observations and the Predictability of Extreme Heat Events
←
→
Page content transcription
If your browser does not render page correctly, please read the page content below
Energy Research and Development Division
FINAL PROJECT REPORT

Weather and Climate
Informatics for the Electricity
Sector
Subdaily Observations and the Predictability of
Extreme Heat Events

Gavin Newsom, Governor
June 2020 | CEC-500-2020-039
PREPARED BY:
Primary Author:
Owen Doherty, Ph.D.

Eagle Rock Analytics
Sacramento, CA 95820
(916) 936-0199
Eaglerockanalytics.com

Contract Number: EPC-15-036

PREPARED FOR:
California Energy Commission

Susan Fischer Wilhelm, Ph.D.
Project Manager

Jonah Steinbuck, Ph.D.
Office Manager
ENERGY GENERATION RESEARCH OFFICEE

Laurie ten Hope
Deputy Director
ENERGY RESEARCH AND DEVELOPMENT DIVISION

Drew Bohan
Executive Director

                                                  DISCLAIMER
This report was prepared as the result of work sponsored by the California Energy Commission. It does not necessarily
represent the views of the Energy Commission, its employees, or the State of California. The Energy Commission, the
State of California, its employees, contractors, and subcontractors make no warranty, express or implied, and assume
no legal liability for the information in this report; nor does any party represent that the uses of this information
will not infringe upon privately owned rights. This report has not been approved or disapproved by the California
Energy Commission, nor has the California Energy Commission passed upon the accuracy or adequacy of the infor-
mation in this report.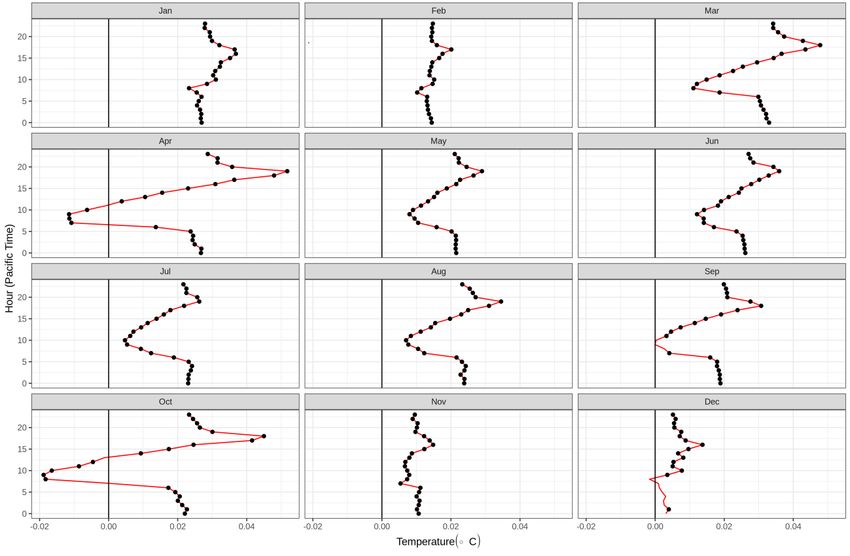
ACKNOWLEDGEMENTS
The authors thank and acknowledge the topical, administrative, and scientific guidance
provided to this work by the Commission Agreement Manager Dr. Susan Wilhelm. The authors
are grateful for the early leadership of Guido Franco, initial Commission Agreement Manager
on this project, and for guidance and feedback from Dr. David Stoms and Dr. Martine Schmidt-
Poolman of the Energy Commission. This work benefited from direct feedback and
commentary from the Sacramento Municipal Utility District, facilitated by Kathleen Ave. The
authors are grateful for comments and guidance from the technical advisory committee
members; in particular, comments from the Demand Forecast Office were critical to the
success of this work. The work benefited from the technical contributions of Chris Torsiello,
who built from scratch and at low cost a high-performance workstation to support the
computational efforts undertaken in this work. The authors are grateful for the assistance of
Ms. Eva Chavez in the preparation and formatting of this manuscript. The authors
acknowledge the editorial assistance of Dr. Anne Cooper Doherty.

                                              i
PREFACE
The California Energy Commission’s (CEC) Energy Research and Development Division
supports energy research and development programs to spur innovation in energy efficiency,
renewable energy and advanced clean generation, energy-related environmental protection,
energy transmission and distribution and transportation.
In 2012, the Electric Program Investment Charge (EPIC) was established by the California
Public Utilities Commission to fund public investments in research to create and advance new
energy solutions, foster regional innovation and bring ideas from the lab to the marketplace.
The CEC and the state’s three largest investor-owned utilities — Pacific Gas and Electric
Company, San Diego Gas & Electric Company and Southern California Edison Company —
were selected to administer the EPIC funds and advance novel technologies, tools, and
strategies that provide benefits to their electric ratepayers.
The CEC is committed to ensuring public participation in its research and development
programs that promote greater reliability, lower costs, and increase safety for the California
electric ratepayer and include:
   •   Providing societal benefits.
   •   Reducing greenhouse gas emission in the electricity sector at the lowest possible cost.
   •   Supporting California’s loading order to meet energy needs first with energy efficiency
       and demand response, next with renewable energy (distributed generation and utility
       scale), and finally with clean, conventional electricity supply.
   •   Supporting low-emission vehicles and transportation.
   •   Providing economic development.
   •   Using ratepayer funds efficiently.
Weather and Climate Informatics for the Electricity Sector is the final report for the
Probabilistic Seasonal and Decadal Forecasts Using Linear Inverse Modeling project (Contract
Number EPC-15-036) conducted by Eagle Rock Analytics. The information from this project
contributes to the Energy Research and Development Division’s EPIC Program.
For more information about the Energy Research and Development Division, please visit the
CEC’s research website (www.energy.ca.gov/research/) or contact the CEC at 916-327-1551.

                                                ii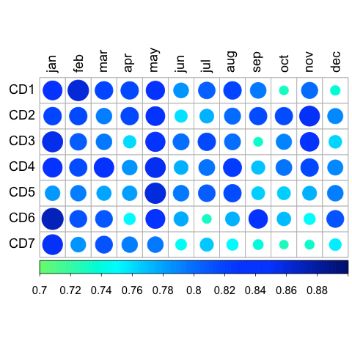
ABSTRACT
Weather conditions are an important driver of demand for electricity. Very warm days during
the summer season are associated with peak electricity consumption. As California has moved
toward a zero-carbon, high-renewables electricity system, the need for improved weather data
and information has increased. Hourly weather data are highly variable (“noisy”), with
frequent observational errors and instrumentation failures, making data use difficult. In this
project, the research team designed and implemented a series of tests to produce a stable
record of hourly weather data for use by the energy sector. After careful data quality review,
the team produced a curated repository of hourly weather observations at 39 locations across
California for 1973–2019. This report discusses the utility of this product and provides
recommendations for how best to use the data and supporting documentation. California’s
warming trend is asymmetrical — stronger in the late afternoon and weaker shortly after
sunrise. The report discusses regional and seasonal differences from the statewide trend, with
a focus on implications for California’s electricity supply and demand. Data products used in
this work form the basis for the development of a statewide, multilevel subdaily repository and
represent a clear pathway forward to providing energy sector stakeholders with regular ultra-
high-resolution data products that are critically needed to help California meet its renewable
energy and climate goals. Last, the report quantifies the value of Pacific Ocean surface
conditions in informing predictions of temperature in California and outlines an approach for
making such predictions operational. The data produced and analyses performed in this
project provide investor-owned utilities as well as public utilities and state agencies with
insights into the effects of subdaily weather on the electrical system.

Keywords: weather, hourly, subdaily, trends, temperature, seasonal predictions

Please use the following citation for this report:
Doherty, Owen and Amato Evan. 2020. Weather and Climate Informatics for the Electricity
    Sector. California Energy Commission. Publication Number: CEC-500-2020-039.

                                                 iii
TABLE OF CONTENTS
Page
ACKNOWLEDGEMENTS.........................................................................................................i
PREFACE ............................................................................................................................ ii
ABSTRACT ......................................................................................................................... iii
EXECUTIVE SUMMARY ....................................................................................................... 1
Introduction .................................................................................................................... 1
Project Purpose ............................................................................................................... 1
Project Approach ............................................................................................................. 2
Project Results ................................................................................................................ 3
Knowledge Transfer ........................................................................................................ 4
Recommendations and Future Directions .......................................................................... 4
Benefits to California ....................................................................................................... 5
CHAPTER 1: Introduction .................................................................................................. 7
Weather and Climate Information for California’s Energy Sector ......................................... 7
Emerging Needs for Subdaily Weather Data ................................................................... 7
Meeting the Need for Subdaily Weather Data ................................................................. 8
On the Predictability of Temperature at Seasonal Timescales in California ........................ 8
CHAPTER 2: Project Approach ........................................................................................... 11
Subdaily Weather Data for the Energy Sector ................................................................... 11
Seasonal Predictions of Climate for Energy Sector ............................................................ 14
CHAPTER 3: Project Results ............................................................................................... 15
A Stable, Curated, Long-Term Subdaily Weather Product for California’s Energy Sector ...... 16
Subdaily Weather Observations .................................................................................... 16
Ensuring a Stable, Quality Record ................................................................................. 16
Changes in the Daily Cycles of Temperature Across California in Response to Climate
Change ........................................................................................................................ 27
Statewide Trends by Season ........................................................................................ 28
Regional Trends .......................................................................................................... 29
Station-Based Trend Profiles ........................................................................................ 32
Seasonal Predictability for the Electrical Sector .............................................................. 34
CHAPTER 4: Technology/Knowledge/Market Transfer Activities ............................................ 37
Transference of Hourly Weather Data to Demand Forecast Office ..................................... 37
vOnline Repository for Data Access ................................................................................ 37
Hourly Weather Data ................................................................................................... 37
NetCDF Databases ....................................................................................................... 37
Typical Day Formulations ............................................................................................. 38
Linear Models for Hourly Trends ................................................................................... 38
Bringing Data Products to Cal-Adapt ................................................................................ 38
Digital Transfer Options ............................................................................................... 38
Conforming to Cal-Adapt Standards .............................................................................. 38
Knowledge Transfer at Cal-Adapt Users Needs Assessment Workshops ........................... 38
CHAPTER 5: Conclusions and Future Directions................................................................... 39
Improving Hourly Weather Data for California .................................................................. 40
Expanding the Coverage of Hourly Stations ................................................................... 40
Modernizing California’s Weather Data Collection and Access ............................................ 42
Multiple Data Processing Levels as a Service ................................................................. 43
Toward a High-Resolution Gridded Product (Level 3) ..................................................... 43
Subdaily Weather Data on Cal-Adapt ............................................................................ 47
Beyond Temperature: Additional Hourly Information for the Energy Sector ..................... 48
Incorporating Changes in Diurnal Characteristics into Energy Sector Planning ................. 48
Making Seasonal Predictions Operational for California Ratepayers .................................... 49
Combining LIMs with Other Forecasts ........................................................................... 49
Forecasts Beyond the Mean ......................................................................................... 49
Who Is the Forecast Written For? ................................................................................. 49
CHAPTER 6: Benefits to Ratepayers ................................................................................... 51
Project Benefits to California Ratepayers .......................................................................... 51
LIST OF ACRONYMS .......................................................................................................... 52
REFERENCES .................................................................................................................... 53
LIST OF FIGURES
Page
Figure 1: Temperature Profiles........................................................................................... 12
Figure 2: Typical Day Formulations .................................................................................... 13
Figure 3: Historical Observations ........................................................................................ 17
viFigure 4: Failed Temperature Observations......................................................................... 18
Figure 5: Missing Observations .......................................................................................... 19
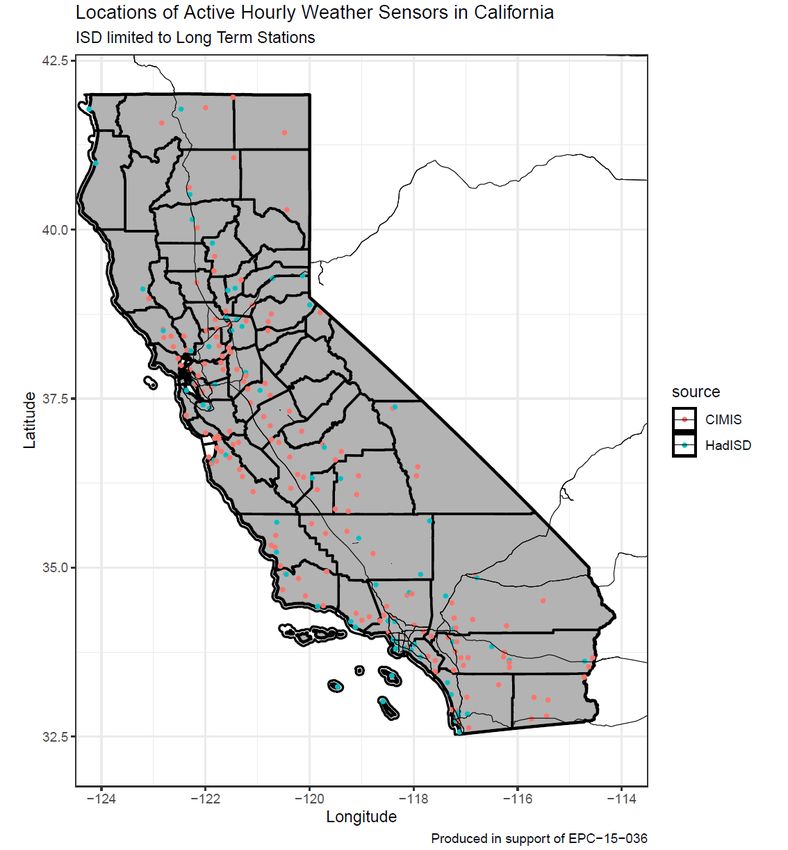
Figure 6: Map of Station Locations ..................................................................................... 23
Figure 7: Observations per Year ......................................................................................... 24
Figure 8: Observations by Hour at Truckee-Tahoe Airport.................................................... 25
Figure 9: Observations by Month at Palm Springs ............................................................... 26
Figure 10: Statewide Trend by Month ................................................................................. 28
Figure 11: Hour of Largest Warming Trend in January......................................................... 30
Figure 12: Hour of Largest Warming Trend in April ............................................................. 31
Figure 13: Hour of Greatest Temperature Trend ................................................................. 33
Figure 14: Fraction of Extreme Warm Months Predicted ...................................................... 35
Figure 15: Skill Score of Prediction of Extreme Warm Months .............................................. 35
Figure 16: Station Locations .............................................................................................. 41
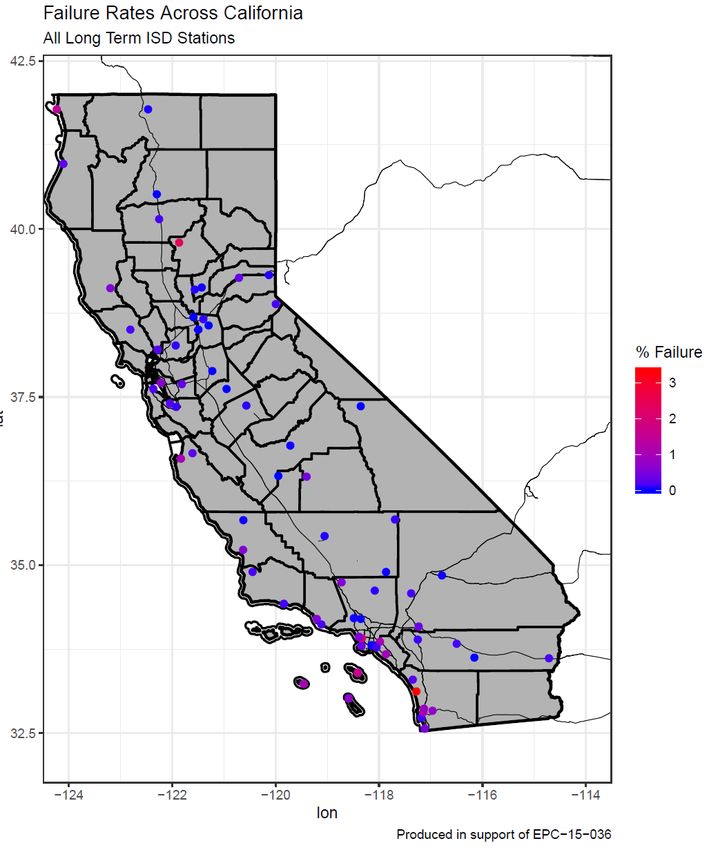
Figure 17: Failure Rates by Station ..................................................................................... 45
LIST OF TABLES
Page
Table 1: Stations by Climate Division .................................................................................. 20
Table 2: Recommendations for Hourly Stations ................................................................... 21
Table 3: Table of Stations .................................................................................................. 22
Table 4: Missing Observations by Station ............................................................................ 27
Table 5: Failure by Station ................................................................................................. 27
viiviii
EXECUTIVE SUMMARY
Introduction
Weather conditions are an important driver of demand for electricity, with very warm days
during the summer season associated with peak electricity consumption. As California moves
toward a diverse energy future focused on renewables, the need for improved weather data
and information has increased. Renewables largely rely critically on weather — solar
generation varies with cloud cover, and wind power generation varies with wind speed.
Additionally, hydroelectric resources — which have historically provided a rapid-response,
dispatchable, low-carbon resource for meeting peak demand — vary with changes in the type,
frequency, and intensity of precipitation. Thus, to make accurate predictions of energy
consumption, the California Energy Commission (CEC) needs accurate weather data.
The traditional approach to electricity sector planning relies on daily weather data, often
considering minimum and maximum temperatures as key indicators. Such daily snapshots
convey the gist of the weather conditions that occurred but are not sufficient in scope to
resolve changes in energy use as a function of the time of day.
Despite striving to position itself as a leader in climate science, California lags behind most
other states in collecting subdaily weather observations in a central location. This data void
hampers the ability of the energy sector to plan for and respond to ongoing climate change
and limits the CEC’s ability to meet the needs of investor-owned utilities and others for high
temporal resolution climate information. In this work, the authors outline a plan for the CEC to
lead efforts toward a statewide mesonet (a network of automated weather and environmental
monitoring stations), which can enhance the stability of the electrical system and also act as a
critical source of information for future climate modeling efforts.

Project Purpose
The aim of this work is to provide the CEC with a curated, stable, long-term weather record
with subdaily observations appropriate for typical electricity sector analysis. This record has
been carefully examined to ensure it is of sufficient length and quality for typical studies and
analyses. Stakeholders recognize the need for more frequent and finer resolution weather
observations. This work provides a pathway forward for the CEC to transition from daily to
hourly, and from regional to local scales, in support of California’s upcoming Fifth Climate
Change Assessment.
The data and analyses produced in this project are designed to support the activities of the
CEC’s Demand Forecast Office, science and engineering teams of publicly and investor-owned
utilities, and other energy sector stakeholders through dissemination via Cal-Adapt, a web-
based climate adaptation planning tool. This project provides California’s electricity sector with
the needed data to make the step from daily to hourly analyses. Beyond curating and
organizing a stable hourly weather record for the energy sector, the authors discuss how this
work supports ongoing CEC efforts and energy sector needs.
   •   This project seeks to improve understanding of how temperature is changing in
       California by analyzing the change on hourly rather than daily timescales. This
       information is critically important as utilities begin to shift demand toward off-peak

                                                1
hours and would not be possible without a stable long-term record of hourly weather
observations across California.
• Temperature data are needed in many forms by the energy sector. In this work, the
authors seek to provide a reliable standardized record of temperature, including typical
daily formulations for modeling work that require long-term average conditions by the
hour, and raw and transformed records that highlight various aspects of temperature,
including how temperature deviates from daily or hourly long-term climatological
average.
• As renewables become more prominent in California’s electricity market, highly
accurate, high temporal resolution weather data is required to ensure a stable power
supply during extreme weather conditions. This work addresses seasonal predictability
by assessing the capacity of the Pacific Ocean to explain and predict temperatures in
California and provides guidance on a pathway forward to making accurate predictions
on seasonal (and shorter) timescales.
Weather data are notoriously difficult to process for quality control. Weather stations can
move, instrumentation used to make observations can change and bias the record, stations
can abruptly shut down, and many stations operate only during daytime hours. Historical
weather datasets are full of errors — from incorrect recording of observations into logs, to
errors in the transmission of observations to central repositories, to errors in digitization of
weather archives. A major effort of this work is to identify through systematic testing weather
observations that are of sufficient quality to serve the sensitive needs of the energy system
and, moreover, to ensure that this record is representative of the complex meteorology in
California.
Stakeholders, including investor-owned utilities, have requested that the CEC produce records
of temperature at a resolution of approximately two kilometers, on hourly timescales,
extending back at least 30 years. Further, researchers responsible for downscaling global
climate model predictions to smaller, localized scales require a longer-term, high-resolution
temperature product to train their models. No such record exists presently to meet these
needs. Support for this effort by the CEC was necessary because no federal or private funding
source is available to provide the resources needed to produce these data.
Project Approach
This project was managed by Dr. Owen Doherty of Eagle Rock Analytics, with Dr. Amato Evan
of the University of California, San Diego providing scientific and technical leadership. Work
tasks associated with this project were primarily computer-driven data and statistical analysis
of atmospheric data; this work was performed on high-performance computing clusters and
workstations in San Diego and Sacramento, respectively. Approaches used varied from
statistical modeling via linear algebra to calculations of ratios of events, albeit repeated many
billion times. The specific approaches and the barriers they overcame are briefly described as
follows:
• The authors developed and applied a rigorous quality control protocol to ensure a stable
and reliable product for every weather station within California.
2• To ensure that the hourly temperature database is applicable to a wide range of
purposes and accessible in formats that are commonly used, raw and transformed data
are stored as NetCDFcdfs and R database files.
• The temperature record was smoothed through a low-pass filter to produce a clean
“typical day” profile. Each daily profile contains the long-term mean value for each hour
of the day, as a raw value and as an anomaly relative to the daily mean temperature.
• The authors applied a linear trend analysis for each hour in the day, using monthly
mean temperature for each station and year in the record. To account for the potential
influence of instrumentation changes, the authors repeated the analysis for the manual
and automated weather observer periods.
• The predictability of air temperature in California by the Pacific Ocean was assessed
through linear inverse modeling of ocean temperature and singular-value decomposition
analysis of air temperature/ocean temperature–coupled data. This is a computationally
light statistical approach that negates the need for expensive supercomputer modeling.
This approach was guided by, and greatly improved through feedback from, the project’s
technical advisory committee, comprised of representatives from investor-owned and publicly
owned utilities, the CEC Demand Forecast Office, and the California Independent System
Operator to ensure broad stakeholder input and support. Two meetings of the technical
advisory committee were held to refine and improve upon methods and products. The
technical advisory committee explicitly advised that subseasonal (including subdaily)
timescales were important, necessitating a deep and comprehensive examination of the
sources and quality of subdaily weather information. Further, input from the technical advisory
committee was critical in determining the need to quantify the rate of change in air
temperature in California on an hourly basis due to anthropogenic climate change.
Project Results
Stakeholders, including investor-owned utilities, public utilities, and CEC staff, clearly and
directly indicated that subseasonal, reliable, and stable weather information is critically needed
to achieve climate-related goals. Some highlights of this work related to the four main thrusts
of this project include:
1. The generation of a stable, long-term hourly weather database.
2. The creation of typical day formulations for temperature as a resource for energy-sector
modeling studies that use climatological mean conditions.
3. The careful assessment of the rate of change of temperature in response to
anthropogenic climate change on an hourly basis.
4. The assessment of the potential for generating seasonal predictions of temperature
across California.
While all these results are of interest to at least some stakeholders, it is the opinion of the
authors that the hourly trend analysis — specifically the results suggesting late afternoon as
the period of the day warming most rapidly — has the greatest effect on the energy sector
overall.
3Knowledge Transfer
This project has yielded two types of products: data and actionable, utility-relevant knowledge
that will be disseminated to key stakeholders and the public.
Data products will be made publicly available on Cal-Adapt. Data have been output for transfer
in stakeholder-requested or endorsed formats (that is, R databases and NetCDF). Data are
structured and annotated (via metadata) to meet the best practices of Cal-Adapt and more
broadly, industry standards. Included in this report are recommendations and suggestions of
how best to automate additional observations to keep the records current, as well as guidance
on how best to host, visualize, and transmit the data.
Knowledge will be transferred to stakeholders and investor-owned utilities at a forthcoming
Cal-Adapt User Needs Assessment, tentatively focused on sub-seasonal data. The results of
this work will be presented, along with next steps and recommended courses of action.
Additional outreach has occurred within the CEC, ensuring that the knowledge generated will
be shared with multiple divisions.
Recommendations and Future Directions
This report discusses the next steps to progress to a more granular, data-intensive approach
to weather data that meets energy-related needs (for example, demand forecasting), as
articulated by CEC Commissioner Andrew McAllister at the March 4, 2019, Integrated Energy
Policy Report Workshop on Data Inputs and Assumptions for Modeling and Forecasting
Activities. This report lists concrete steps, along with background information and context to
allow the CEC to improve the quality of and access to hourly weather data, leverage hourly
data to create additional products that utilities need, and make seasonal predictions
operational. The future directions include:
1. Expanding the current hourly weather database (greater than 46 years of hourly
observations at 39 locations in California) to cover regions of California presently
underrepresented.
2. Improving the scope (higher spatial resolution on subdaily timescales) and the quality
of the temperature record, as requested by utilities and energy sector stakeholders to
meet climate-related goals.
3. Leveraging California’s great opportunity to improve the understanding of temperature
variability across the state by merging observations that are presently disparate (across
various state and local agencies, as well as utilities) into a functional, uniform mesonet.
The CEC can continue its historical role of climate leadership at the state level through:
o Centrally collecting, quality controlling, and assimilating weather observations
across the state into a uniform data product, and disseminating this information
in near-real time on Cal-Adapt, providing hyperlocal weather information to
utilities to improve reliability in the face of extreme weather events.
o Using information from this collection to build a high-resolution gridded product
that would meet the spatial and temporal needs articulated by energy sector
stakeholders.
4o Merging these disparate networks into a single network, which would be of great
value to the electricity sector, via the protection of life and property from
extreme weather events and improved system reliability through better weather
forecasting.
4. Developing a seasonal prediction scheme for air temperature in California, using a
hybrid approach, including information from linear inverse models and seasonal climate
modeling efforts.
Benefits to California
California’s electricity system already relies on a substantial portion of renewable generation
and will continue to incorporate more electricity from renewable sources of energy, such as
solar and wind. Concurrently, California’s peak demand for electricity during extreme heat
events will increase as the state continues to warm. Historically, investor-owned utilities and
CEC Demand Forecast Office personnel have used daily climate information to assess and plan
for energy use in response to weather. With the growth in renewable energy sources, and the
rising availability of per-user subdaily consumption data, subdaily weather information is
increasingly necessary. This work provides a stable, quality-controlled record curated for
California’s energy sector. Providing this information to energy system stakeholders through
Cal-Adapt will enable a more stable energy system for California ratepayers, by allowing
utilities to better understand how diurnal weather variability and electricity use are related.
Improved weather data has the potential to allow for reduced electricity costs if utilities can
leverage the information provided to improve supply and electricity acquisition decisions.
Further, benefits to ratepayers are likely to emerge as subdaily data can significantly better
inform infrastructure developments compared to daily data. This work will provide a
centralized repository of subdaily weather data, which will reduce utilities’ expenses in
acquiring expert guidance to produce their own records, and ultimately lower ratepayers’
electricity costs.
California is warming asymmetrically, with different warming rates across the day as a function
of location and month in year. When during the day and how temperature is changing at a
location are becoming more important as utilities seek to implement peak demand shifting.
This information will help utilities anticipate and plan for near-term future changes in demand,
leading to a more stable electrical system at a lower cost, and is likely to be of greater benefit
to publicly-owned and smaller utilities, whose ability to add staff with expertise in climate and
weather is limited.
Improvements to energy use projections, through improved weather and climate forecasts,
will increase electricity stability and reduce rates by allowing utility companies to make
informed decisions about infrastructure and market purchases. Accurate predictions of
temperatures will ensure sufficient electricity is available to meet peak demands. As California
moves toward more diverse sources of energy in the future, including higher shares of
renewables, accurate weather forecasts are going to become increasingly necessary for the
CEC and energy suppliers to accurately predict energy generation and consumption. Through
more accurate seasonal and decadal predictions, utility companies can ensure adequate zero-
carbon electricity supplies are available to ratepayers.
56
CHAPTER 1:
Introduction

Weather and Climate Information for California’s Energy Sector
Weather conditions are an important driver of demand for electricity, with very warm days
during the summer season associated with peak electricity consumption. As California has
moved toward a diverse energy future, with a focus on renewables, the need for improved
weather data and information has increased. Renewables largely rely critically on weather —
solar generation varies with cloud cover and wind power generation varies with wind speed.
Additionally, hydroelectric resources — which have historically provided a rapid-response,
dispatchable, low-carbon resource for meeting peak demand — vary with changes in the type,
frequency, and intensity of precipitation. Thus, to make accurate predictions of energy
consumption, the CEC needs accurate weather data.
This report discusses potential sources of weather data, as well as methods for and results
from a careful assessment of suitability of the data and changes in the daily structure of
temperature at the monitoring sites, and provides robust recommendations for how these data
can be disseminated via Cal-Adapt and used as the basis for products that address the needs
of California’s electricity sector. Beyond this, the report presents an approach for producing
seasonal predictions of temperature for California, the limitations of this approach, how such
projections are likely to be used, and recommendations for making seasonal predictions
available to the energy sector and the public.

Emerging Needs for Subdaily Weather Data
Historic Uses of Weather Data by the Energy Sector
The traditional approach in electricity sector planning relies on daily weather data, often
considering daily maximum and minimum temperatures as key indicators. Such daily
snapshots convey the gist of the weather conditions that occurred but are not sufficient in
scope to resolve changes in energy use as a function of the time of day. As renewables
become more prominent in California’s electricity market, highly accurate, high temporal
resolution is required to ensure a stable power supply during extreme weather conditions.
Such high-resolution information is needed to support the CEC efforts to progress to a more
granular, more temporal, more data-intensive approach and meet the need for higher-
resolution weather data in support of SB 100 and SB 350 goals. 1

Stated Need for Subdaily Weather Data
The project’s initial focus was on assessing the ability of statistical models to predict mean
monthly temperatures on seasonal and decadal timescales. Through meetings facilitated by
the CEC, the TAC explicitly advised that sub-seasonal (including subdaily) timescales were

1Commissioner J. Andrew McAllister. March 4, 2019. IEPR Commissioner Workshop on Data Inputs and
Assumptions for 2019 IEPR Modeling and Forecasting Activities. Link to transcript: https://ww2.energy.
ca.gov/2019_energypolicy/documents/#03042019

                                                       7
important, necessitating a deep and comprehensive examination of the sources and quality of
subdaily weather information. This required refining the approach to data acquisition and
quality control because neither the state nor any stakeholders had a reliable repository of
subdaily weather data available. This stated need for higher-resolution weather and climate
information included a desire for sub-seasonal predictions beyond the monthly mean
temperature, which is often the predicted value produced by the weather and climate
community but not actionable for utilities.
Meeting the Need for Subdaily Weather Data
Weather data have been systematically recorded on a subdaily (hourly) basis in California
since 1933. For nearly 60 years, skilled weather observers took observations each hour,
encoded the observations, and either archived them manually or transmitted them to a central
repository for safekeeping. In the late 1990s, weather observations began to be taken by
automated machinery, and human weather observers were stationed only at the largest
airports in the state. While this record is long, there are many challenges to overcome in using
it, including accounting for the movement or closure of stations and changes in
instrumentation and observational practices. In this report, the methods for sourcing
observations are described, which yield a curated dataset of stable long-term observations
suitable for the energy sector.
Generation of a collection of weather stations that are representative of the diverse climatic
zones of California will enable new and transformative analyses to be performed in the
electricity sector. One such analysis requested by the TAC is an hour-by-hour, day-by-day
analysis of changes in temperature across the state. Utilities advised us that subdaily trends
are poorly understood and of great interest in the energy sector. Globally, it is well established
that nighttime temperatures are warming faster than daytime temperatures (IPCC 2014);
however, regionally some differences may occur, particularly in marine-influenced regions.
Asymmetric warming across the day has implications for electricity production and demand,
and must be quantified.
On the Predictability of Temperature at Seasonal Timescales in California
The grant-funding opportunity that was the funding mechanism for this work laid out the case
and need for seasonal predictions of temperature and how such work would benefit ratepayers
and the energy sector.2 Funding was predicated on a unique requirement — that the approach
must be computationally light — that is, capable of running on a standard desktop computer.
Thus, statistical means are sought to make predictions, rather than relying on computationally
heavy weather or climate models. The chosen statistical approach relies upon three key
factors: (1) a source of predictability of air temperatures in California, (2) a statistical
transform of the source of predictability of air temperature, and (3) a method of predicting
future conditions of the source of predictability. In this work, ocean conditions are relied upon
as the source of predictability; singular value decomposition (SVD) as the statistical transform;
2California Energy Commission, Reduce the Environmental and Public Health Impacts of Electrical Generation and
Make the Electricity System Less Vulnerable to Climate Impacts: Phase II, October 2015. Publication Number:
GFO-15-309.
8and linear inverse modeling as the source of predictability. Briefly, these concepts are
introduced below, and expanded upon in later sections.
Predictability and Sea Surface Temperature
The atmosphere has low or no memory — or statistically speaking, the autocorrelation of
atmospheric variables rapidly declines on daily to weekly scales. What this means for
forecasting is that the current state of the atmosphere tells us very little about its future state.
In contrast, the high heat capacity of the ocean results in significant oceanic memory and
potential predictability. The surface of the ocean drives atmospheric circulation through heat
fluxes. This makes ocean surface temperature (or SST), which affects the atmosphere and is
predictable, a strong choice for a predictor variable.
Generating Predictions via Singular Value Decomposition
In this work, SVD is used as the multivariate statistical analysis of covariance between SST and
the temperature. SVD analysis identifies the time series (principle components or PCs) and
corresponding spatial patterns (loading patterns) that describe the maximum covariance
between the datasets. In other words, SVD analysis can reduce noise in the data and find the
most energetically important coincident patterns of SST and predictor variable anomalies. SVD
analysis is analogous to what is sometimes referred to as maximum covariance analysis and is
similar to the commonly used empirical orthogonal function (EOF) analysis, in that it produces
time series (principle components) and spatial patterns (loading patterns). However, SVD
works through decomposition of a cross-covariance matrix, whereas EOF analysis decomposes
a covariance matrix comprised of one spatiotemporal field. Therefore, SVD is the
advantageous approach for predictive work because users can take advantage of its multiple
covariance matrices to sum the predictions across all spatial-temporal modes identified as
significant.
Linear Inverse Modeling
Linear inverse modeling (LIM) is the method of choice because it is considered the state-of-
the-science approach to time series modeling and allows us to efficiently reduce an otherwise
unwieldy number of degrees of freedom (time, space, and atmosphere-ocean physics) to a
quantity manageable on a desktop computer. LIM is currently used by the National Oceanic
and Atmospheric Administration’s (NOAA's) Climate Prediction Center in their seasonal and
annual predictions of the El Niño Southern Oscillation. Further, LIM represents an optimal way
to forecast a time series. Consider, as an example, the task of forecasting temperature
everywhere in California, on a regular 0.5 x 0.5–degree resolution grid, requiring
approximately 100 grid points. To model this directly it is necessary to train and run a forecast
model on each pixel independently. However, SVD analysis identifies the top 5 to 10 principle
component time series (sufficient to explain 85 to 90 percent of the variance of the predictor
variable). By focusing on forecasting these 5 to 10 time series, this approach can effectively
“solve” the forecast (through the LIM model) for all 5 to 10 time series simultaneously,
because each time series is associated with a known spatial pattern. In doing so, the
dimensionality of the problem can be reduced from 100 to 5. What is removed by this
reduction in dimensionality is atmospheric and oceanic data noise, which is by definition
unforecastable. As is evident by this example, LIM allows for computational time and efforts to
9focus on predicting the key 5 to 10 modes by which the atmosphere and ocean are actually
covarying.
It is noted that over the course of proposing and performing this work and ultimately writing
this final report, LIM has come to be used in many more applications and its utility in
predicting ocean state and responsive air temperature has become better known. Dias et al.
(2019) provide an excellent overview of the utility of this approach, and an open-source
programming package for Python, which is capable of generating predictions of Pacific Ocean
SSTs, has been made freely available (https://github.com/frodre/pyLIM). These and other
external efforts allowed us to redirect time and effort to providing subdaily weather
information, in support of needs stated by the project TAC and CAM.
10CHAPTER 2:
Project Approach
Subdaily Weather Data for the Energy Sector
On the Presentation of Temperature by Hour
Temperature can be represented in multiple formats through normalization or statistical
transformations, and such formats should be matched to the data’s intended end use purpose.
In this study, three formulations of temperature at each hour in the record for which data
exists are provided: raw temperature data, daily anomalies, and hourly anomalies. The
concept of raw data is straightforward — the temperature (in degrees Celsius) as recorded by
instrumentation. Daily anomalies consist of the temperature minus the long-term daily mean
value. Hourly anomalies are the temperature minus the long-term hourly mean value for that
day of the year. Hourly and daily anomalies are calculated relative to the 30-year period 1981
to 2010. All hours reported are converted to local Pacific time, with adjustments made for
daylight savings.
Energy sector uses for hourly weather data vary widely, and users should spend some time
considering the type of temperature information that most directly matches their end use.
Some engineering applications require raw temperature to understand climate impacts on
buildings and infrastructure. Demand forecasts might require information about the diurnal
cycle — that is, the daily shape of hourly weather data — to, for example, understand impacts
of compound heat events on load. More granular analyses might require hourly anomalies to
assess short-term impacts of extreme conditions that deviate from typical values found at a
given hour and day of the year. Figure 1 shows two methods of visualizing different
formulations of the same observations.
A large NetCDF database of hourly temperature data has been provided along with this final
report to the CEC. The data are provided for the period from 1973 to the present (July 2019).
In addition, R databases have been provided in recognition of the importance of this
programming language to the Demand Forecast Office (DFO). The NetCDF database was
created to meet Cal-Adapt standards and expectations for data formatting and metadata.
Chapter 4 outlines these data products and provides a plan for their immediate transfer to Cal-
Adapt. Chapter 5 provides recommendations for how this information can be distributed via
Cal-Adapt’s API and data-download tool, incorporated into existing products, and ideas for tool
support for this product. Further, this database can easily be amended when new data
become available. Chapter 5 discusses how this can be achieved.
11Figure 1: Temperature Profiles
Raw (left) and transformed (right) temperature data for July 7, 2017 in Sacramento.
Source: Eagle Rock Analytics
Formulation of Typical Day Profiles
At any given location in California, the rate of warming and cooling that a location typically
experiences changes day by day and hour by hour in response to solar forcing, regional
weather, and microclimatological factors. Characterizing the typical thermal profiles, and how
temperature changes hour by hour, is helpful in several planning and design applications and
is often a necessary input to many physical and mechanical models. For a subset of locations
(39) in California that possess a long-term, high-quality hourly temperature record, “typical
day” profiles are produced for each day in the year.
Weather data, even over long periods of time, often contains significant noise from natural (for
example, day-to-day weather variability) and manmade (for example, shifts in instrumentation
or changes to surrounding environment) factors. To ensure the profiles are representative of
the local climatology with low impacts from noise, a low-pass filter is applied to the hourly
data. This filter (locally estimated scatterplot smoothing, or LOESS) considers the surrounding
18 days (~5 percent) and gently smooths the diurnal curves to be representative of long-term
forcing. An example of such a profile is presented in Figure 2. Such profiles are appropriate for
studies seeking the most common conditions for a given day, but the raw data should be used
for studies needing variability associated with weather events.
12Figure 2: Typical Day Formulations
The long-term mean temperature by the hour in Sacramento (blue) and a smoothed long-term mean
temperature after LOESS filtering for Sacramento (red).
Source: Eagle Rock Analytics
A database containing typical day diurnal curves of temperature at locations across California
has been produced and will be submitted to CEC along with this final report. This record
contains the raw and daily temperature anomalies for 39 stations, 366 days and 24 hours.
Assessing Changes in the Diurnal Structure of Temperature in Response to Climate
Change
To determine how a change in climate is affecting the diurnal characteristics of temperature,
the linear trend in each hour of every day of the year is estimated. Trends are calculated on a
monthly basis, by averaging across all days in a month at a given hour and location. Regional
13and statewide assessments were performed by averaging all sites within the state/region, and
then performing a linear trend analysis. Linear analyses are calculated over the entire record
(1973–present) at each station. To understand if changes in instrumentation (that is,
installation of automated systems in the late 1990s) were important, the record is divided into
the “manual observation period” of 1973 to 1996 and the “automated observation period” of
1997 to 2019. Many, but not all, stations in the record have manual observations augmenting
automated data in the later period.
Linear models were constructed for each month-hour combination at each location. Summaries
of key results are presented in Chapter 3, with complete monthly analyses provided as
supplementary figures. Complete model repositories are saved as an R database for later use
at the DFO, as described in Chapter 4.
Seasonal Predictions of Climate for Energy Sector
Developing a Linear Inverse Model
A linear inverse model was developed in MATLAB and trained on monthly ERSST v3 sea
surface temperature data. These data were detrended in preprocessing before model training
occurred. The domain selected for predictions spanned the region from -10°S to 65°N, and
from the international dateline (at 180°E) to 150°W. A number of different forecast length
periods were tested, and ultimately the LIM was developed for zero to nine months out.
Propagation matrices were generated for each month. Subsequent to this work, previously
referenced open-source software packages performing this analysis were developed and
potential users are referred to this package (see Chapter 1).
Singular Value Decomposition
Code to perform the SVD analysis was developed in Python, in a domain centered over
California, with ocean points excluded from the analysis. Maximum daily temperature values in
a number of reanalysis products were assessed for covariation with SST over the LIM domain.
The top 10 modes explaining the most variance were determined for each month in the year.
Predictions of air temperature for future months were calculated for each month by applying
output from the LIM to each of the sets of monthly modes.
14CHAPTER 3:
Project Results
Stakeholders, including investor-owned utilities (IOUs), publicly owned utilities (POUs) and
CEC staff, clearly and directly indicated that sub-seasonal, reliable, and stable weather
information is critically needed to achieve climate-related goals. Some highlights of this work
related to the four main thrusts of this project are briefly outlined below: (1) producing a
stable, curated, long-term subdaily weather product, (2) formulation of typical day and hour
profiles, (3) an hourly trend analysis, and (4) assessment of the capacity for seasonal
temperature predictions.
1. A stable, long-term hourly weather database was generated:
• Extensive quality assurance and quality control was performed on the record.
• An hourly, 47-year record (1973 to present) was produced at 39 locations across
California.
• Representative hourly stations were identified to replace the 19 daily stations used
by the DFO.
• Across California, the quality of weather observations has declined since Reagan-
era federal cost-savings programs replaced trained weather observers with
automated equipment.
• The authors identified which quality assurance approaches that are applied to
global-observation datasets are inappropriate for use in California.
2. Typical day formulations for temperature were created as a resource for energy-sector
modeling studies that use climatological mean conditions:
• A long-term mean is generated at each of the 39 stations for each hour-of-day,
day-in-year combination.
• Smoothing across the year was applied at each hour to reduce high-frequency noise
and more faithfully reproduce long-term conditions.
• Temperature information is presented in multiple formats, including raw values and
anomalies relative to daily means, with guidance as to best usage practices.
3. The rate of change of temperature in response to anthropogenic climate change is
carefully assessed on an hourly basis:
• Statewide, the rate of warming is maximized in the hours just before sunset; this
increase in temperature will frustrate utilities’ efforts to shift peak demand away
from this part of the day.
• Across California, the minimum increase in temperature is occurring just after
sunrise; this is in contrast to many other locations in North America where
nighttime lows (which typically occur at or just before sunrise) are warming more
rapidly than daytime temperatures.
• Important differences in warming rates are noticed across regions of California, but
most stations fall into one of two categories: (1) stations where warming is
15occurring fastest in the late afternoon and (2) coastal stations where warming is
occurring rapidly in the morning and late afternoon.
• Utilities should consider multiple stations in a given region to capture the climate
signal and rate of warming and reduce the impacts of local non-climate signals.
4. The potential for generating seasonal predictions of temperature across California is
assessed:
• The Pacific Ocean has sufficient predictive capacity, so that if the future state of the
ocean can be accurately predicted, so too can temperature in California.
• LIM is able to make skillful predictions of the future state of the ocean under certain
conditions, but not others.
• A hybrid approach in which LIM is used when predictive skill is expected, and
seasonal climate models when it is not, could be used to improve overall skill.
• Utilities are interested in sub-monthly predictions because monthly mean
temperatures (currently predicted by atmospheric scientists) are not necessarily the
most useful variable for making energy sector predictions.
A Stable, Curated, Long-Term Subdaily Weather Product for
California’s Energy Sector
Subdaily Weather Observations
The Integrated Surface Database (ISD), maintained by NOAA, is the preeminent hourly
weather repository. The most commonly collected weather parameters are temperature,
dewpoint, wind (direction, speed, and gustiness), cloud cover, present weather, sea-level
pressure, precipitation, and snow depth. Daily summary variables (for example, maximum and
minimum temperatures) are also included in the record. The ISD has 54 QA/QC checks applied
to it (Smith et al., 2011); however, it is designed to be conservative and significant amounts of
spurious temperature results pass through unflagged. In this study, temperature data are from
HadISD, a quality-controlled version of the ISD record (Dunn et al., 2012; Dunn et al., 2016;
Dunn 2019). HadISD is maintained by the Hadley Centre in the United Kingdom. The ISD and
HadISD are peer reviewed, with significant technical documentation as well as in some cases
open-source code available.
Ensuring a Stable, Quality Record
Sources and History of Hourly Weather Data
Primarily, hourly weather observations are taken at airports due to a need for high-quality,
frequently updated conditions for aviation safety. Standardization of weather reporting dates
back to the late 19th century, when the National Weather Service was organized to centralize
and store weather observations disseminated by telegraph. In California, the hourly weather
observation record begins in 1933 (Figure 3) at a handful of airfields, primarily those operated
by the military. With the rise in civil aviation after World War II, the number of hourly records
increased in California, with data stored locally on paper and archived. In the 1960s, the
number of stations for which there is access to records declined as the transmission system
transitioned from analog to digital data, with some stations’ records being lost in the process.
16You can also read


