Progress on change in water-use efficiency - GLOBAL STATUS AND ACCELER ATION NEEDS FOR SDG INDICATOR 6.4.1 2021 - FAO
←
→
Page content transcription
If your browser does not render page correctly, please read the page content below

Progress
           on change
         in water-use
            efficiency
      G LO B A L S TAT U S A N D
    AC C E L E R AT I O N N E E D S
F O R S D G I N D I C ATO R 6.4.1

                            2021

Progress on change in
           water-use efficiency
                 Global status and
               acceleration needs for
                SDG indicator 6.4.1

                        2021

FOOD AND AGRICULTURE ORGANIZATION OF THE UNITED NATIONS
               AND UNITED NATIONS WATER,
                      ROME, 2021
Required citation: FAO and UN Water. 2021. Progress on change in water-use efficiency. Global status and acceleration needs for
SDG indicator 6.4.1, 2021. Rome. https://doi.org/10.4060/cb6413en.

The designations employed and the presentation of material in this information product do not imply the expression of any opinion
whatsoever on the part of the Food and Agriculture Organization of the United Nations (FAO) or UN Water concerning the legal
or development status of any country, territory, city or area or of its authorities, or concerning the delimitation of its frontiers or
boundaries. Dashed lines on maps represent approximate border lines for which there may not yet be full agreement. The mention
of specific companies or products of manufacturers, whether or not these have been patented, does not imply that these have
been endorsed or recommended by FAO or UN Water in preference to others of a similar nature that are not mentioned.

ISBN 978-92-5-134849-9 (FAO)

© FAO and UN Water, 2021

Some rights reserved. This work is made available under the Creative Commons Attribution-NonCommercial-ShareAlike 3.0 IGO
licence (CC BY-NC-SA 3.0 IGO; https://creativecommons.org/licenses/by-nc-sa/3.0/igo/legalcode).

Under the terms of this licence, this work may be copied, redistributed and adapted for non-commercial purposes, provided that
the work is appropriately cited. In any use of this work, there should be no suggestion that FAO endorses any specific organization,
products or services. The use of the FAO logo is not permitted. If the work is adapted, then it must be licensed under the same or
equivalent Creative Commons licence. If a translation of this work is created, it must include the following disclaimer along with
the required citation: “This translation was not created by the Food and Agriculture Organization of the United Nations (FAO). FAO
is not responsible for the content or accuracy of this translation. The original [Language] edition shall be the authoritative edition.”

Disputes arising under the licence that cannot be settled amicably will be resolved by mediation and arbitration as described
in Article 8 of the licence except as otherwise provided herein. The applicable mediation rules will be the mediation rules of the
World Intellectual Property Organization http://www.wipo.int/amc/en/mediation/rules and any arbitration will be conducted in
accordance with the Arbitration Rules of the United Nations Commission on International Trade Law (UNCITRAL).

Third-party materials. Users wishing to reuse material from this work that is attributed to a third party, such as tables, figures
or images, are responsible for determining whether permission is needed for that reuse and for obtaining permission from the
copyright holder. The risk of claims resulting from infringement of any third-party-owned component in the work rests solely with
the user.

Sales, rights and licensing. FAO information products are available on the FAO website (www.fao.org/publications) and can be
purchased through publications-sales@fao.org. Requests for commercial use should be submitted via: www.fao.org/contact-us/
licence-request. Queries regarding rights and licensing should be submitted to: copyright@fao.org.

Cover photograph: Acacia trees being planted in Yangambi - Democratic Republic of the Congo by Axel Fassio, 2019 ©CIFOR

MAPS:

Final boundary between the Sudan and South Sudan has not yet been determined.
Final status of the Abyei area is not yet determined.
Dotted line represents approximately the Line of Control in Jammu and Kashmir agreed upon by India and Pakistan. The final
status of Jammu and Kashmir has not yet been agreed upon by the parties.
Presenting the UN-Water
      Integrated Monitoring
      Initiative for SDG 6

      Through the UN-Water Integrated Monitoring Initiative for SDG 6 (IMI-SDG6), the United Nations seeks to
      support countries in monitoring water- and sanitation-related issues within the framework of the 2030
      Agenda for Sustainable Development, and in compiling country data to report on global progress towards
      SDG 6.

      IMI-SDG6 brings together the United Nations organizations that are formally mandated to compile
      country data on the SDG 6 global indicators, and builds on ongoing efforts such as the World Health
      Organization (WHO)/United Nations Children’s Fund (UNICEF) Joint Monitoring Programme for Water
      Supply, Sanitation and Hygiene (JMP), the Global Environment Monitoring System for Freshwater (GEMS/
      Water), the Food and Agriculture Organization of the United Nations (FAO) Global Information System on
      Water and Agriculture (AQUASTAT) and the UN-Water Global Analysis and Assessment of Sanitation and
      Drinking-Water (GLAAS).

      This joint effort enables synergies to be created across United Nations organizations and methodologies
      and requests for data to be harmonized, leading to more efficient outreach and a reduced reporting
      burden. At the national level, IMI-SDG6 also promotes intersectoral collaboration and consolidation of
      existing capacities and data across organizations.

      The overarching goal of IMI-SDG6 is to accelerate the achievement of SDG 6 by increasing the availability
      of high-quality data for evidence-based policymaking, regulations, planning and investments at all levels.
      More specifically, IMI-SDG6 aims to support countries to collect, analyse and report SDG 6 data, and to
      support policymakers and decision makers at all levels to use these data.

      > Learn more about SDG 6 monitoring and reporting and the support available: www.sdg6monitoring.org

      > Read the latest SDG 6 progress reports, for the whole goal and by indicator:
         https://www.unwater.org/publication_categories/sdg6-progress-reports/

      > Explore the latest SDG 6 data at the global, regional and national levels: www.sdg6data.org

III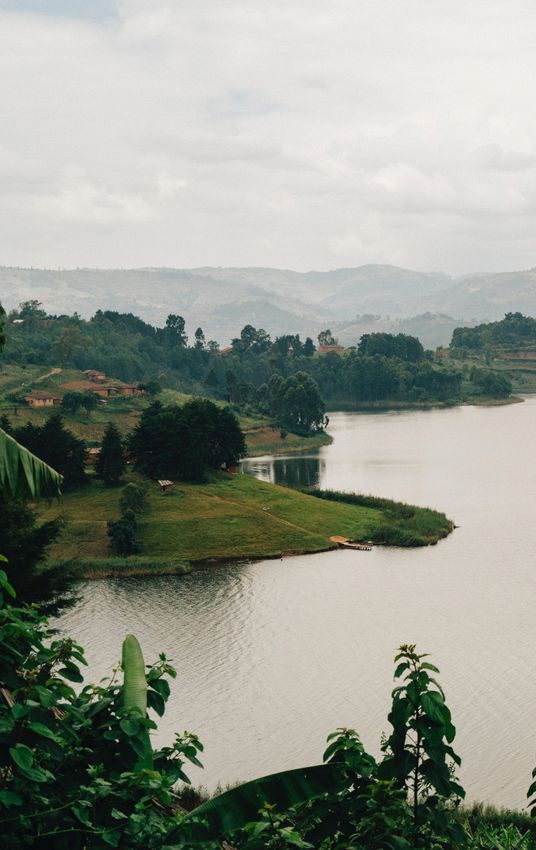
IV
Contents

    FAO foreword ...................................................................................................IX

    UN-Water Foreword..........................................................................................XI

    Acknowledgements.........................................................................................XIII

    List of acronyms and abbreviations...............................................................XV

    Executive summary........................................................................................XVII

    Key messages and recommendations..............................................................XIX

    1. Introduction and background.......................................................................1
        1.1. The 2030 Agenda for Sustainable Development............................................................................. 1

        1.2. What is the change in water-use efficiency over time and why is it important?.......................... 3

    		 1.2.1. Conceptual framework: setting a common understanding of the hydrological and
       economic components of indicator 6.4.1........................................................................................ 3

        1.3. Economic growth and water use...................................................................................................... 7

        1.4. Why decoupling water from economic growth is important.......................................................... 7

        1.5. Setting the scene: lessons learned for the new reporting period and capacity-building
             initiatives............................................................................................................................................ 8

    2.	Method and process: how to monitor and interpret indicator 6.4.1........... 11
        2.1. Country-led national data-collection and AQUASTAT database aggregation............................ 11

    		 2.1.1. Spatial and temporal coverage............................................................................................. 12

    		 2.1.2. Treatment of missing values at the country, regional and global levels........................... 13

    		 2.1.3. Regional aggregations.......................................................................................................... 13

V
2.2. Calculation methodology................................................................................................................ 13

    2.3. Case study: how are countries facing complex data collection?................................................ 17

3.	Results and analysis................................................................................... 19
    3.1. Challenges: dealing with data gaps in the computation of indicator 6.4.1................................. 19

    3.2. How is the change in water-use efficiency over time evolving globally and by sector?............21

		 3.2.1. Water data..............................................................................................................................25

		 3.2.2. Economic data...................................................................................................................... 28

    3.3. Are economies decoupling economic growth from water use?..................................................30

		 3.3.1. Change in water-use efficiency results from the selected countries................................ 31

		 3.3.2. Decoupling or dependency of economy and water use in the 86 countries....................32

4.	Conclusions and recommendations............................................................. 39
    4.1. Interpreting the results.................................................................................................................... 39

    4.2. Ongoing challenges for the development of the change in the water-use efficiency
         indicator...........................................................................................................................................40

    4.3. Recommendations at the global level to accelerate water-use efficiency improvements........ 41

		 4.3.1. Addressing data gaps........................................................................................................... 42

		 4.3.2. Mobilizing funding................................................................................................................43

		 4.3.3. Innovating and scaling up best practices and technologies.............................................43

		 4.3.4. Governance: roles of institutions and norms......................................................................44

		 4.3.5. Capacity-building and awareness-raising to enhance water-use efficiency....................44

5. references................................................................................................... 47

Annexes........................................................................................................... 49
    Annex 1. AQUASTAT questionnaire.......................................................................................................49

    Annex 2. Water-use efficiency country values, 2015–2018................................................................53

    Annex 3. Country data values, 2006–2018...........................................................................................58

    Annex 4. Basic documents and information resources...................................................................... 61

Learn more about progress towards SDG 6.....................................................63

                                                                                                                                                                  VI
List of boxes and figures

      Box 1. SDG 6: Ensure availability and sustainable management of water and sanitation for all............2

      Box 2. Economic sectors included in the water-use efficiency computation as per the International
      Standard Industrial Classification of All Economic Activities (ISIC) codes..............................................4

      Box 3. Clarifying the concepts of water-use efficiency and water productivity.......................................5

      Box 4. Concepts and variables related to the computation of indicator 6.4.1..........................................5

      Box 5. Capacity-building resources to support indicator 6.4.1 monitoring by FAO................................10

      Box 6. How to remove the effect of price changes over time..................................................................12

      Box 7. FAO’s estimations of the ratio between rainfed and irrigated yields............................................15

      Figure 1. Percentage of questionnaires received by subregion in 2020................................................ 20

      Figure 2. Change in water-use efficiency during 2015–2018 for 166 countries ................................... 22

      Figure 3. Trend in water-use efficiency in the different regions and globally during 2015–2018 for 166
      countries...................................................................................................................................................... 23

      Figure 4. Water-use efficiency changes from 2015 to 2018 in major economic sectors and globally
      for 166 countries......................................................................................................................................... 24

      Figure 5. Change in water-use efficiency between 2015 and 2018.........................................................25

      Figure 6. Dominant sectors for freshwater withdrawals in 2006 and in 2018........................................26

      Figure 7. Proportion of withdrawals in each of the sectors in 2006 (left) and 2018 (right).................. 27

      Figure 8. Global and regional gross value added for water-related activities included in the three main
      economic sectors in 2018.......................................................................................................................... 29

      Figure 9. Geographical distribution of the 86 countries with available long time series data............. 30

VII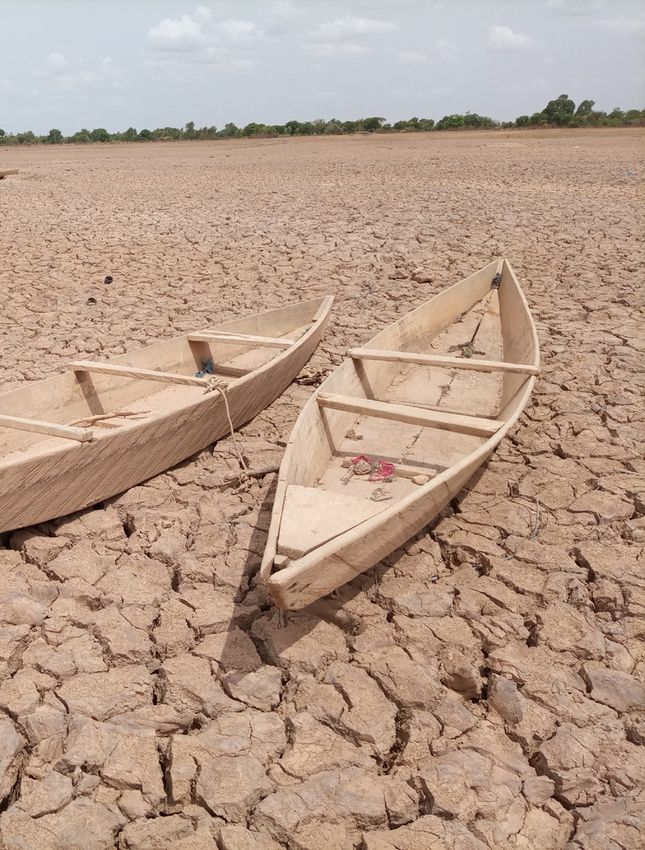
Figure 10. Water-use efficiency values from 2006 to 2018 for the total withdrawals and sectoral
withdrawals in the 86 selected countries................................................................................................. 32

Figure 11. Water withdrawals by sector in the 86 selected countries from 2006 to 2018.................... 33

Figure 12. Gross value added for the three main sectors (irrigated agriculture, industry and services)
in the 86 selected countries from 2006 to 2018...................................................................................... 34

Figure 13. Volume of water used to generate gross value added in three major sectors of the 86
selected countries...................................................................................................................................... 34

Figure 14a. Volume of water used to generate gross value added in the agricultural sector of the 86
selected countries from 2006 to 2018.......................................................................................................35

Figure 14b. Volume of water used to generate gross value added in the industrial sector of the 86
selected countries from 2006 to 2018.......................................................................................................35

Figure 14c. Volume of water used to generate gross value added in the service sector of the 86
selected countries from 2006 to 2018...................................................................................................... 36

Figure 15. Yearly change in gross value added and water-use efficiency values from 2006 to 2018 for
the 86 countries.......................................................................................................................................... 37

Figure 16. Trend in gross value added and water-use efficiency values from 2006 to 2018 for the 86
countries (reference year = 2006)............................................................................................................. 37

Figure 17. Key accelerators of the SDG 6 Global Acceleration Framework ...........................................42

                                                                                                                                                                VIII
Foreword
The 2030 Agenda for Sustainable Development stresses the importance of “leaving no one behind”.
This can only be achieved if the interlinkages between its 17 SDGs are adequately articulated and
appropriate actions are undertaken to bring them together for the benefit of all.
The Food and Agriculture Organization of the United Nations (FAO) is supporting the 2030 Agenda
through the transformation to MORE efficient, inclusive, resilient and sustainable agri-food systems for
better production, better nutrition, a better environment, and a better life - leaving no one behind.
The transformation of agri-food systems is at the heart of FAO’s mandate and at the core of FAO’s
Strategic Framework 2022-2031.
Water is the essence of life and at the core of the agri-food systems. The path to water efficiency
passes through sustainable agri-food systems. This report shows the progress in the monitoring of
indicator 6.4.1 ”Change in water-use efficiency over time” for which FAO is custodian, in the context of
the Sustainable Development Goals (SDGs) global report. It reveals that there is opportunity to further
increase water-use efficiency in all sectors, including agriculture, the world largest water user. It also
identifies recommendations for acceleration towards the achievement of the SDG target of sustainable
water use.
Water productivity gains, good governance and a coordinated holistic policy framework are major entry
points for actions needed to address water challenges in agri-food systems. Better knowledge of water
resources and their use and management, innovation and capacity building are fundamental in order to
develop instruments for defining and implementing appropriate policies.
FAO joined the Integrated Monitoring Initiative for SDG6 (“Clean Water and Sanitation”) in 2015,
coordinated by UN-Water, which has gathered experiences and resources aimed at ensuring a coherent
monitoring framework for water and sanitation by 2030. Such a framework will help countries achieve
progress through well-informed decision-making on water, based on harmonized, comprehensive,
timely and accurate information.
IXFAO, predominantly through its AQUASTAT database, remains committed to improving the quality and
quantity of data produced and analysed, in close partnership with the relevant national authorities of
our Members. In coordination and collaboration with other stakeholders, FAO will continue supporting
Members to achieve this target by providing scientific and technical assistance.
Qu Dongyu
FAO Director-General
©FAO
XForeword
The COVID-19 crisis has caused enormous disruption to sustainable development. However, even before
the pandemic, the world was seriously off track to meet Sustainable Development Goal 6 (SDG 6) – to
ensure water and sanitation for all by 2030.
No matter how significant the challenges we face, achieving SDG 6 is critical to the overarching aim of
the 2030 Agenda, which is to eradicate extreme poverty and create a better and more sustainable world.
Making sure that there is water and sanitation for all people, for all purposes, by 2030 will help protect
global society against many and varied looming threats.
Our immediate, shared task is to establish safe water and sanitation services in all homes, schools,
workplaces and health care facilities. We must increase investment in water use efficiency, wastewater
treatment and reuse, while protecting water-related ecosystems. And we must integrate our approaches,
with improved governance and coordination across sectors and geographical borders.
In short, we need to do much more, and do it much more quickly. In the SDG 6 Summary Progress Update
2021 that preceded this series of reports, UN-Water showed that the current rate of progress needs to
double - and in some cases quadruple - to reach many of the targets under SDG 6.
At the March 2021 high-level meeting on the “Implementation of the Water-related Goals and Targets
of the 2030 Agenda”, UN Member States noted that to achieve SDG 6 by 2030 will require mobilizing
an additional USD$ 1.7 trillion, three times more than the current level of investment in water-related
infrastructure. To make this happen, Member States are calling for new partnerships between
governments and a diverse group of stakeholders, including the private sector and philanthropic
organizations, as well as the wide dissemination of innovative technology and methods.
We know where we need to go, and data will help light the way. As we ramp up our efforts and target them
at areas of greatest need, information and evidence will be of critical importance.
Published by the UN-Water Integrated Monitoring Initiative for SDG 6 (IMI-SDG6), this series of indicator
reports is based on the latest available country data, compiled and verified by the custodian United
Nations agencies, and sometimes complemented by data from other sources.
XIThe data were collected in 2020, a year in which the pandemic forced country focal points and UN
agencies to collaborate in new ways. Together we learned valuable lessons on how to build monitoring
capacity and how to involve more people, in more countries, in these activities.
The output
a year in which of IMI-SDG6
the pandemic makes
forced anfocal
country important
pointscontribution to improving
and UN agencies data and
to collaborate information,
in new ways. one of the
five
Together we accelerators
learned valuableinlessons
the SDG
on 6how
Global Acceleration
to build monitoringFramework
capacity andlaunched last year.
how to involve more people,
in more countries, in these activities.
With these reports, our intention is to provide decision-makers with reliable and up-to-date evidence on
The output of IMI-SDG6 makes an important contribution to improving data and information, one of the five
where acceleration is most needed, so as to ensure the greatest possible gains. This evidence is also
accelerators in the SDG 6 Global Acceleration Framework launched last year.
vital to ensure accountability and build public, political and private sector support for investment.
With these reports, our intention is to provide decision-makers with reliable and up-to-date evidence on
a year in which the pandemic
Thank you forced
for readingcountry
this focal points and UN agencies
this to collaborate in new ways.
where acceleration is most needed, so document
as to ensureand
thefor joining
greatest critical
possible gains.effort. Everyone
This evidence is has
alsoavital
role to play. When
Together we learned valuable lessons on how to build monitoring capacity and how to involve more people,
governments, civil society, business, academia and development aid agencies pull
to ensure accountability and build public, political and private sector support for investment. together dramatic
in more countries, in these activities.
gains are possible in water and sanitation. To deliver them, it will be essential to scale up this cooperation
Thank youacross
for reading this document
countries and for joining this critical effort. Everyone has a role to play. When
and regions.
The output of IMI-SDG6 makes an important contribution to improving data and information, one of the five
governments, civil society, business, academia and development aid agencies pull together dramatic gains
accelerators in the SDG 6 Global Acceleration Framework launched last year.
are possible in water and sanitation. To deliver them, will be essential to scale up this cooperation across
The COVID-19 pandemic reminds us of our shared vulnerability and common destiny. Let us “build back
countries and regions.
With these reports, our intention
better” is to water
by ensuring provide decision-makers
and with
sanitation for all byreliable
2030. and up-to-date evidence on
where acceleration is most needed, so as to ensure the greatest possible gains. This evidence is also vital
The COVID-19 pandemic reminds us of our shared vulnerability and common destiny. Let us “build back
to ensure accountability and build public, political and private sector support for investment.
better” by ensuring water and sanitation for all by 2030.
Thank you for reading this document and for joining this critical effort. Everyone has a role to play. When
governments, civil society, business, academia and development aid agencies pull together dramatic gains
are possible in water and sanitation. To deliver them, will Gilbert F. Houngbo
be essential to scale up this cooperation across
countries and regions.
UN-Water Chair and President
The COVID-19 pandemic reminds us of our shared vulnerability and commonFund
of the International destiny.
for Let us “build back
better” by ensuring water and sanitation for all by 2030.
Agricultural Development
©UN-Water
XII
PROGRESS ON FRESHWATER ECOSYSTEMS 2Acknowledgements This report was prepared by Marta Rica, FAO consultant, with the close supervision of Riccardo Biancalani and the collaboration of Michela Marinelli, Ghaieth Ben Hamouda and Lucie Chocholata of the FAO Land and Water Division. The authors are grateful for the valuable oversight, guidance and inputs to this report provided by other FAO staff, including Sasha Koo-Oshima, Jippe Hoogeveen, Virginie Gillet and Patricia Mejías Moreno. The authors wish to acknowledge Maria Schade (UN-Water), Robert Argent (Bureau of Meteorology, Australian Government), Gérard Payen (IMI Scientific Advisory Group), colleagues from the World Bank Water Global Practice on SDG 6 and Paul Glennie (UNEP-DHI Centre on Water and Environment) for their valuable comments on the draft report, and the overall support provided by UN-Water’s Senior Programme Managers. The authors are also thankful for the comments received by an external reviewer, Angela Ortigara (water and sustainable development specialist). Financial support was provided by the Swiss Agency for Development and Corporation (SDC), the Dutch Directorate-General for International Cooperation (DGIS), the Ministry of Foreign Affairs of The Netherlands and the German Federal Ministry for Economic Cooperation and Development (BMZ) through the Integrated Monitoring Initiative for SDG 6 (IMI-SDG6). Further support has been supplied by the Government of Belgium and the Swedish International Development Agency (SIDA) through the Multiparner Programme Support Mechanism of FAO. This report was produced as part of a series of reports on SDG indicators 6.3.1, 6.3.2, 6.4.1, 6.4.2, 6.5.1, 6.5.2 and 6.6.1, coordinated by UN-Water through the Integrated Monitoring Initiative for SDG 6. XIII
XIV
List of acronyms and abbreviations

     Awe        Irrigated agriculture water-use efficiency [USD/m3]

     Cr         Proportion of agricultural gross value added produced by rainfed agriculture

     CWUE       Change in water-use efficiency

     GDP        Gross domestic product

     GVA        Gross value added (for all sectors)

     GVAa       Gross value added by agriculture (excluding river and marine fisheries and forestry) [USD]

     GVAaa      Gross value added of the freshwater aquaculture subsector [USD]

     GVAai      Gross value added of the irrigated cultivations subsector [USD]

     GVAal      Gross value added of the livestock subsector [USD]

     GVAa-rev   Gross value added by agriculture without the rainfed subsector

     GVAm       Gross value added by MIMEC (including energy) [USD]

     GVAs       Gross value added by services from ISIC sectors E and G to T [USD]

     IFAD       International Fund for Agricultural Development

     ISIC       International Standard Industrial Classification of All Economic Activities

     IWMI       International Water Management Institute

     IWRM       Integrated water resources management

     JMP        Joint Monitoring Programme for Water Supply and Sanitation

     LEAP       Livestock Environmental Assessment and Performance

     MDG        Millennium Development Goal

     Mwe        MIMEC water-use efficiency [USD/m3]

XV
MIMEC Mining and quarrying, manufacturing, constructions and energy
OECD Organisation for Economic Co-operation and Development
PA Proportion of water used by the agricultural sector over the total use
PM Proportion of water used by the MIMEC sector over the total use
PS Proportion of water used by the service sector over the total use
SDG Sustainable Development Goal
SEEA- System of Environmental-Economic Accounting for Water
Water
SNA System of National Accounts
Swe Services water-use efficiency [USD/m3]
SWOT Strengths, weaknesses, opportunities and threats
UNICEF United Nations Children’s Fund
UNSD United Nations Statistics Division
Va Volume of water used by the agricultural sector
Vm Volume of water used by MIMEC (including energy)
Vs Volume of water used by the service sector
WFP World Food Programme
WHO World Health Organization
WUE Water-use efficiency [USD/m3]
XVIExecutive summary
Water-use efficiency rose from 17.3 USD/m3 of the dependency of economic growth on water
in 2015 to 18.9 USD/m3 in 2018 worldwide, use. These 86 countries represent approximately
representing a 9 percent efficiency increase. 56 percent of the 2018 world population.
The proportion of countries generating water-
use efficiency results over the global value for The three major sectors of these 86 countries
each year varied from 45 percent in 2015 to increased their water-use efficiency over time,
46 percent in 2018. All economic sectors have with agriculture increasing from 0.5 USD/m3
seen an increase in their water-use efficiency to 0.8 USD/m3, industry from 18.5 USD/m3 to
since 2015. In 2018, the industrial sector had a 31 USD/m3 and services from 104 USD/m3 to
water-use efficiency equivalent to 32 USD/m , 3
135.9 USD/m3. This means that the industrial
the services sector 112 USD/m3 and the sector has experienced the largest net efficiency
agriculture sector 0.60 USD/m3. Compared gains from 2006 to 2018, likely due to the
with 2015, this represents an increase of transformation of thermal cooling for energy
15 percent in the industrial sector, 8 percent production, industrial processes and heating
in the services sector and 8 percent in the systems. This reflects the important reduction
agriculture sector. These results were produced in water withdrawals within these countries’
using data available from 166 countries for industrial sectors, which has also occurred at
2015–2018 and can provide an overall picture the global level (though the level of withdrawal
of the change in water-use efficiency globally. is more significant in the selected 86 countries
due to their type of economy, with industry
To analyse whether economic growth is contributing more to overall gross value added
decoupled from water use requires complete (GVA) than in other countries).
data sets. Although global information was
available from 2015, only long time series Dependency between water use and GVA in the
without imputed data can provide an overview agriculture and services sectors appears to be
of changes in economic dynamics in relation to a continuing trend. Within the industrial sector,
the water used, meaning the 2015–2018 period however, water use has been reduced drastically
falls short. Overall, 86 countries had regularly for the generation of value added, meaning
reported water-use data since 2006, which were increased water-use efficiency. An analysis of
used to obtain a reliable longer-term perspective how total withdrawals relate to GVA over the
years reveals a potential decoupling of economic
growth from water use since 2016. Nonetheless,
XVIIthese results are preliminary, and it is therefore
too early for a solid conclusion to be made.
The fact that there are only three data points,
which show a new trend, is not conclusive. In
addition, the industrial weight in these countries
influences the overall calculation. This issue will
be further analysed in the next reporting periods
when more data are available.
Data availability and accuracy are crucial for
the computation of indicator 6.4.1. More data
need to be collected, ideally on an annual basis,
to compute the indicator at the global level and
for the various economic sectors, and also to
observe any regional differences.
The main challenge for this
indicator is therefore obtaining
enough information to demonstrate
increases in value added per unit
of water withdrawn, especially
in the poorest regions.
This indicator does not aim to provide an
exhaustive picture of a country’s water
utilization. To provide adequate follow-up
of target 6.4, the indicator needs to be
combined with indicator 6.4.2 on water stress.
Furthermore, the use of supplementary
indicators at the country level, including the
monitoring of irrigation, water distribution
networks and industrial and energy cooling
efficiencies, would enhance the interpretation of
this indicator.
Rhodope Mountains, Bulgaria by Gery Pav ©Unsplash
XVIIIKey messages and
recommendations
• The two indicators included in the monitoring impact food security or sanitation, which are
process of target 6.4 are complementary. likely to be signalled by other Sustainable
Indicator 6.4.1 is an economic indicator, Development Goals (SDG) indicators.
assessing the extent to which a country’s
economic growth is dependent on the use • Water-use efficiency should be pursued
of water resources, while indicator 6.4.2 in all sectors. Decoupling economic
is an environmental indicator, tracking growth and water use means that a given
the physical availability of freshwater marginal increase of national income does
resources and the impact of water use. not correspond to an equivalent or higher
marginal increase in water use, i.e. economic
• Promoting water-use efficiency is important, growth does not imply using more water.
particularly in water-scarce areas.
• Increasing water-use efficiency is a complex
• Trade can play a role in increasing a exercise that involves coordination and
country’s water-use efficiency by supporting collaboration among several institutions
higher value water uses. Virtual water and stakeholders in a country. The
exchanges should be considered to account process of implementing integrated water
properly for the country’s water needs. resources management (IWRM; assessed
by SDG indicator 6.5.1) supports this
• Water scarcity should not become a coordination and stakeholder participation,
constraint to economic growth. For countries which can benefit from the information
with medium to high water stress, increasing provided by target 6.4 indicators.
water-use efficiency is needed to ensure that
water scarcity does not limit their capacity • The improvement of human skills,
to grow, both economically and socially. technological advancements and the ongoing
maintenance of equipment and systems are
• However, in most cases, devising policies just some of the issues that must be taken
that aim to move water from one economic into account to reduce the dependency
sector to another to increase the value of of a country’s economic and social life
water-use efficiency would be ineffective, as from a growing use of water resources.
it could create distortions and trade-offs that
XIX• Agriculture is the largest water user, as
well as the sector with the lowest GVA
aggregate. Reducing the amount of water
needed for irrigation can play an important
role in increasing countries’ overall water-
use efficiency. Increased water-use
efficiency in agriculture would release
water resources for use elsewhere, such as
for environmental needs or in other more
profitable sectors. A balance between
food security, sustainable water use, and
economic growth must be sought.
• Although the social value of water is not
quantified, it must not be underestimated.
Conflicts should be avoided between
domestic and economic use of water
resources, particularly in relation to
agriculture, by developing tools and
mechanisms that enable the equitable
Dried up lake in Sabba, Burkina Faso by Yoda Adaman
allocation of water resources.
©Unsplash
Pogradec, Albania by Endri Killo ©Unsplash
XX1. Introduction and background
1.1. The 2030 Agenda for Within the SDG monitoring framework, data
Sustainable Development collection and reporting are based on country
data, with national representatives included in
In September 2015, Heads of State from the process to ensure that progress is achieved
around the world adopted the 2030 Agenda and to strengthen accountability.
for Sustainable Development, comprising
17 Sustainable Development Goals (SDGs)
with 169 targets. All SDGs are interlinked,
since transitioning towards more sustainable
and resilient societies requires an integrated
approach. The 2030 Agenda includes a goal on
water and sanitation (SDG 6), which sets out to
“ensure availability and sustainable management
of water and sanitation for all” (United Nations
General Assembly [UNGA], 2015). As a goal
concerning the lifeblood of society and the
planet, progress towards the eight SDG 6 targets
(Box 1) has catalytic effects across the entire
2030 Agenda.
Safe drinking water and sanitation are human
rights. Access to these services, including water
and soap for handwashing, is fundamental to
human health and well-being. SDG 6, however,
goes far beyond water and sanitation services to
cover the entire water cycle. Besides domestic
purposes, water is needed across all sectors
of society, to produce food, energy, goods and
services, and to maintain healthy ecosystems
that in turn protect life on Earth, all of which form
the basis of the SDG 6 targets (Box 1). Lake Bunyonyi, Kabale, Uganda by Random Institute
©Unsplash
1 PROGRESS ON CHANGE IN WATER-USE EFFICIENCY - 2021Box 1. SDG 6: Ensure availability and sustainable management of water and
sanitation for all
6.1 By 2030, achieve universal and equitable access to safe and affordable drinking water for all.
6.2 By 2030, achieve access to adequate and equitable sanitation and hygiene for all and end open def-
ecation, paying special attention to the needs of women and girls and those in vulnerable situations.
6.3 By 2030, improve water quality by reducing pollution, eliminating dumping and minimizing release
of hazardous chemicals and materials, halving the proportion of untreated wastewater and substan-
tially increasing recycling and safe reuse globally.
6.4 By 2030, substantially increase water-use efficiency across all sectors and ensure sustainable
withdrawals and supply of freshwater to address water scarcity and substantially reduce the number
of people suffering from water scarcity.
6.5 By 2030, implement integrated water resources management at all levels, including through trans-
boundary cooperation as appropriate.
6.6 By 2020, protect and restore water-related ecosystems, including mountains, forests, wetlands,
rivers, aquifers and lakes.
6.a By 2030, expand international cooperation and capacity-building support to developing countries
in water- and sanitation-related activities and programmes, including water harvesting, desalination,
water efficiency, wastewater treatment, recycling and reuse technologies.
6.b Support and strengthen the participation of local communities in improving water and sanitation
management.
Vijayawada, Andhra Pradesh, India by Sai Kiran Anagani ©Unsplash
PROGRESS ON CHANGE IN WATER-USE EFFICIENCY - 2021 21.2. What is the change in water- measurements over time reveals the change
use efficiency over time in countries’ water-use efficiency, providing a
complete picture of their situations.
and why is it important?
Increasing water-use efficiency over time is
Indicator 6.4.1 is an economic indicator, strongly linked to the achievement of other SDGs
assessing the extent to which a country’s related to the efficient and sustainable use of
economic growth is dependent on the use of resources, such as sustainable food production
water resources. It therefore addresses the (SDG 2), economic growth (SDG 8), infrastructure
impact of economic growth on the use of water and industrialization (SDG 9), cities and human
resources, with its estimations considering settlements (SDG 11), as well as sustainable
two different dimensions – hydrological and consumption and production (SDG 12).
economic – based on two sets of data:
• volumes of water used by the 1.2.1. Conceptual framework:
different sectors included in the setting a common understanding
indicator’s computation of the hydrological and economic
components of indicator 6.4.1
• gross value added (GVA) of these sectors.
Indicator 6.4.1 estimates the reliance of a
Indicator 6.4.1 was newly introduced by the SDG country’s economic growth on the exploitation
process in 2015, and had previously not been of its water resources. When the growth of the
monitored globally as part of the Millennium indicator is slower than that of the economy, it
Development Goals (MDGs). The introduction of indicates a potential problem with the medium
this new indicator presented challenges, such as and long-term sustainability of the economic
the need to develop an entirely new methodology growth itself, which could be constrained by an
to monitor the indicator, and to generate and increasing shortage of water. In such cases it is
interpret new data computations due to the essential to integrate information provided by
indicator’s lack of previous data. indicator 6.4.2 on water stress.
The indicator shows the change in the ratio of The volume of water used by each sector was
the value added to the volume of water use defined based on the definitions set in the
over time. In this way, water-use efficiency is System of Environmental-Economic Accounting
defined as the value added of a given major for Water (SEEA-Water),1 which defines water
sector divided by the volume of water used use as the water abstracted by a given economic
by that sector, expressed as value/volume sector or received from another sector. This
(commonly USD/m ). Comparing the indicator’s
3
definition allows for the use of data collected
by AQUASTAT under “total water withdrawal
(TWW)”.
1 See https://seea.un.org/content/seea-water.
3 PROGRESS ON CHANGE IN WATER-USE EFFICIENCY - 2021As this indicator focuses on economy, it is major economic sector, revealing the trend in
calculated by computing individual indicators water-use efficiency. Economic sectors are
for each of the main economic sectors, before designated following the International Standard
aggregating them into a single figure. The Industrial Classification of All Economic
indicator is defined as the value added per water Activities (ISIC) Revision 4 codes (Box 2).
used (expressed in USD/m3) over time of a given
Box 2. Economic sectors included in the water-use efficiency computation as per
the International Standard Industrial Classification of All Economic Activities (ISIC)
codes
Water-use efficiency is computed by collecting data about three main economic sectors: agriculture
(the production of food, fibres, wood and related products, grouped under agriculture); industrial pro-
duction (of goods, energy, mining and constructions, grouped under the acronym MIMEC); and ser-
vices (including households). These sectors are defined more precisely according to the ISIC Revision
4 codes:
1. agriculture; forestry; fishing (ISIC A) (agriculture)
2. mining and quarrying; manufacturing; electricity, gas, steam and air conditioning supply; con-
structions (ISIC B, C, D and F) (MIMEC)
3. all the service sectors (ISIC E and ISIC G–T) (services).
Sources: United Nations, Department of Economic and Social Affairs, Statistics Division (2008); Food
and Agriculture Organization of the United Nations (FAO) (2019a).
During the methodological development of However, the concepts of water-use efficiency
this indicator, consideration was given to the and water productivity are often used
possibility of using water consumption as a interchangeably, which might create confusion.
metric for identifying each economic sector’s Box 3 explains how these concepts differ when
used water volumes. While this would have computing the indicator, while Box 4 provides
better aligned the indicator to water productivity some definitions that help identify the different
(another common agricultural concept), water variables considered during the indicator’s
withdrawal was instead selected, which better development.
aligns the indicator with the SEEA-Water
definitions.
PROGRESS ON CHANGE IN WATER-USE EFFICIENCY - 2021 4Box 3. Clarifying the concepts of water-use efficiency and water productivity
Water productivity is usually computed as the ratio of the economic or biological output per volume of
water consumed in a given production process, mostly in agriculture. Water-use efficiency is computed
as the ratio between the volumes of water used by the different sectors and gross value added of these
sectors.
The concept of water-use efficiency under indicator 6.4.1 differs from the concept of water productivity
because it does not consider the water used in a given activity as an input to production. For example,
in this sense, water used for irrigation would not differ from water used to cool down the radiator of a
motor car or to flush a toilet in an office space.
Indicator 6.4.1 estimates the reliance of economic growth on the exploitation of water resources,
showing the level of decoupling of economic growth from water use, i.e. how much the economy can
grow using the same or a lesser volume of water.
Source: FAO (2018).
Box 4. Concepts and variables related to the computation of indicator 6.4.1
• Water use: Water that is received by an industry or households from another industry or that is
directly abstracted (SEEA-Water (ST/ESA/STAT/SER.F/100), para. 2.21).
• Water abstraction: Water that is removed from the environment by the economy (SEEA-Water
(ST/ESA/STAT/SER.F/100), para. 2.9).
• Water use for irrigation (km³/year): Annual quantity of water used for irrigation purposes. It
includes water from renewable freshwater resources, as well as water from over-abstraction
of renewable groundwater or abstraction of fossil groundwater, the direct use of agricultural
drainage water, (treated) wastewater and desalinated water (AQUASTAT Glossary).
• Water use for livestock (watering and cleaning) (km³/year): Annual quantity of water used for
livestock purposes. It includes water from renewable freshwater resources, as well as water
from over-abstraction of renewable groundwater or abstraction of fossil groundwater, the direct
use of agricultural drainage water, (treated) wastewater and desalinated water for livestock
watering, sanitation, cleaning of stables, etc. If connected to the public water supply network,
water used for livestock is included in services water use (AQUASTAT Glossary).
• Water use for aquaculture (km³/year): Annual quantity of water used for aquaculture. It
includes water from renewable freshwater resources, as well as water from over-abstraction
5 PROGRESS ON CHANGE IN WATER-USE EFFICIENCY - 2021of renewable groundwater or abstraction of fossil groundwater, the direct use of agricultural
drainage water, (treated) wastewater and desalinated water. Aquaculture is the farming of
aquatic organisms in inland and coastal areas, involving intervention in the rearing process to
enhance production and the individual or corporate ownership of the stock being cultivated
(AQUASTAT Glossary).
• Water use for the MIMEC sector (km³/year): Annual quantity of water used for the MIMEC
sector. It includes water from renewable freshwater resources, as well as water from over-
abstraction of renewable groundwater or abstraction of fossil groundwater and the use of
desalinated water or direct use of (treated) wastewater. This sector refers to self-supplied
industries not connected to the public distribution network (AQUASTAT Glossary; AQUASTAT
refers to MIMEC sectors as ‘industry’).
• Water use for services sectors (km³/year): Annual quantity of water used primarily for direct
use by the population. It includes water from renewable freshwater resources, as well as water
from over-abstraction of renewable groundwater or abstraction of fossil groundwater and the
use of desalinated water or direct use of treated wastewater. It is usually computed as the total
water used by the public distribution network and can include the part of industries connected
to the municipal network (AQUASTAT Glossary; AQUASTAT refers to services sectors as
‘municipal’).
• Value added (gross): Value added is the net output of a sector after adding up all outputs and
subtracting intermediate inputs. It is calculated without making deductions for the depreciation
of fabricated assets or the depletion and degradation of natural resources. The industrial
origin of value added is determined by the International Standard Industrial Classification of All
Economic Activities (ISIC) Revision 4 (World Bank Databank, Metadata Glossary, modified).
Source: FAO (2019a).
Nepal by Dipesh Shrestha ©Unsplash
PROGRESS ON CHANGE IN WATER-USE EFFICIENCY - 2021 6If water-use efficiency grows faster than the value added of an economy, then efforts to increase water-
use efficiency are on the right path. In this case, the increase in the indicator’s results is due to the
relative stability or decrease in the volume of water used by the economy as it grows, thus indicating a
lower risk of water becoming a limiting factor for economic growth.
If the indicator follows the same trend as economic growth, then the risk of water becoming a limiting
factor for economic growth is linked to the overall amount of a country’s available water resources.
If water-use efficiency grows slower than the value added of an economy, then there is a high risk of
water becoming a limiting factor for economic growth in the medium and long term. This has the
potential to jeopardize the overall sustainability of the economic growth itself.
1.3. Economic growth water policies to reduce the risk of countries
and water use overstretching their available resources,
particularly countries with a medium to high
In addition to providing information on the level of water stress (see indicator 6.4.2).
efficiency of the economic and social use of
water resources, indicator 6.4.1 shows the level The rationale behind this indicator involves
of decoupling of economic growth from water providing information on the efficiency of the
use. economic and social use of water resources,
i.e. the value added from the use of water in the
In other words, indicator 6.4.1 shows how much economy’s main sectors, including distribution
water use increases if the value added of the network losses.
economy increases. It estimates the extent to
which a country’s economic growth relies on The efficiency of the water distribution systems
the exploitation of its water resources. The is implicit within the calculations and could
indicator’s results increase if the value added of be made explicit if needed and where data are
a sector or the whole economy grows more than available.
the relevant water use, thus indicating that water
is not a limiting factor for economic growth. Water-use efficiency is strongly influenced by
a country’s economic structure, proportion
of water-intensive sectors and any ‘real’
1.4. Why decoupling water improvements or deteriorations. The indicator
from economic growth can therefore help formulate water policy by
focusing attention on sectors or regions with a
is important
small water-use efficiency change or with a high
water demand but low water-use efficiency. This
In terms of policy, the indicator aims to identify will guide countries in their efforts to improve
the point at which increases in water use – if water-use efficiency and help them to apply
any – become decoupled from the increase in successful actions from sectors or regions with
the value added of the economy (i.e. the tipping higher water-use efficiency levels to those with
point). While this may not be something that lower efficiency levels. Cross-sector planning
developing countries experience for some years, can be supported by implementing integrated
anticipating this point should be the focus of
7 PROGRESS ON CHANGE IN WATER-USE EFFICIENCY - 2021water resources management (IWRM), as environmental degradation; infrastructure and
measured by indicator 6.5.1 (United Nations industrialization (SDG 9), as GVA should increase
Environment Programme [UNEP], 2021). with sustainable industries; cities and human
settlements (SDG 11), as improved accessibility
However, it should be noted that in most cases, to domestic water supply and ecosystem health
devising policies that aim to move water from should help prevent water-related disasters; and
one economic sector to another to increase consumption and production (SDG 12), which
the value of water-use efficiency would be should become more efficient.
ineffective. If a country’s general development
becomes unbalanced due to its use of water Increasing values in a time series indicate that
resources, other SDG indicators will signal economic growth is decoupling from water use.
problems and changes needed, since such It does not necessarily indicate a decline in total
unbalancing would likely jeopardize food water use or a reduction of the impact of water
security and livelihoods in developing countries, use (though it must be compared with indicator
particularly those with an agricultural matrix 6.4.2 results to confirm this).
heavily focused on subsistence (which is not
visible in this indicator, but would be captured by
other related indicators). 1.5. Setting the scene: lessons
learned for the new reporting
Indicator 6.4.1 specifically addresses the target
period and capacity-
component “substantially increase water-use
building initiatives
efficiency across all sectors”, comparing the
value added of an economy with the volumes
of water used by the same economy, including Indicator 6.4.1 had not previously been
losses in distribution networks. Increasing monitored worldwide as part of the MDGs
water-use efficiency over time means decoupling and was introduced in the SDG process. As
economic growth from water use across the such, an entirely new methodology had to
main water-using sectors, which are agriculture, be built to monitor the indicator. Despite not
industry, energy and services. being monitored previously, statistical data
were generally available and updated from
This is strongly interlinked with sustainable governmental sources for the variables included
food production (SDG 2), as incomes should in the methodology.
increase with improvements in efficiency and
value addition to food production; gender The first phase of the UN-Water Integrated
equality and natural resources (SDG 5), as Monitoring Initiative for SDG 62 (2015–
reforms to increase water-use efficiency should 2018) focused on developing monitoring
also complement efforts to secure women’s methodologies and other support tools for the
rights and access to markets; economic growth indicators of the aforementioned targets.
(SDG 8), as resource efficiency should result
in economic growth being decoupled from
2 The UN-Water Integrated Monitoring Initiative for SDG 6 brings together the United Nations organizations that are formally mandated to
compile country data on the SDG 6 global indicators, and builds on ongoing efforts such as the World Health Organization (WHO)/United
Nations Children’s Fund (UNICEF) Joint Monitoring Programme for Water Supply, Sanitation and Hygiene (JMP), the Global Environment
Monitoring System for Freshwater (GEMS/Water), FAO’s global information system on water and agriculture (AQUASTAT) and the
UN-Water Global Analysis and Assessment of Sanitation and Drinking-Water (GLAAS).
PROGRESS ON CHANGE IN WATER-USE EFFICIENCY - 2021 8You can also read