Regional Global Navigation Satellite System Networks for Crustal Deformation Monitoring
←
→
Page content transcription
If your browser does not render page correctly, please read the page content below
Focus Section: Regional Seismic Networks in North America

                  Regional Global Navigation Satellite
                  System Networks for Crustal Deformation
                  Monitoring
                  Jessica R. Murray*1, Noel Bartlow2, Yehuda Bock3, Benjamin A. Brooks1, James Foster4, Jeffrey
                  Freymueller5, William C. Hammond6, Kathleen Hodgkinson7, Ingrid Johanson8, Alberto López-
                  Venegas9, Dörte Mann7, Glen S. Mattioli7, Timothy Melbourne10, David Mencin7, Emily Montgomery-
                  Brown1, Mark H. Murray1, Robert Smalley11, and Valerie Thomas12

                      Abstract
                      Regional networks of Global Navigation Satellite System (GNSS) stations cover seismically
                      and volcanically active areas throughout the United States. Data from these networks have
                      been used to produce high-precision, three-component velocity fields covering broad geo-
                      graphic regions as well as position time series that track time-varying crustal deformation.
                      This information has contributed to assessing interseismic strain accumulation and related
                      seismic hazard, revealed previously unknown occurrences of aseismic fault slip, constrained
                      coseismic slip estimates, and enabled monitoring of volcanic unrest and postseismic defor-
                      mation. In addition, real-time GNSS data are now widely available. Such observations
                      proved invaluable for tracking the rapidly evolving eruption of Kīlauea in 2018. Real-time
                      earthquake source modeling using GNSS data is being incorporated into tsunami warning
                      systems, and a vigorous research effort is focused on quantifying the contribution that real-
                      time GNSS can make to improve earthquake early warnings as part of the Advanced
                      National Seismic System ShakeAlert system. Real-time GNSS data can also aid in the
                      tracking of ionospheric disturbances and precipitable water vapor for weather forecasting.
                      Although regional GNSS and seismic networks generally have been established independ-
                      ently, their spatial footprints often overlap, and in some cases the same institution operates
                      both types of networks. Further integration of GNSS and seismic networks would promote
                      joint use of the two data types to better characterize earthquake sources and ground
                      motion as well as offer opportunities for more efficient network operations. Looking
                                                                                                                                                         Cite this article as Murray, J. R.,
                      ahead, upgrading network stations to leverage new GNSS technology could enable more                                                N. Bartlow, Y. Bock, B. A. Brooks, J. Foster,
                      precise positioning and robust real-time operations. New computational approaches such                                             J. Freymueller, W. C. Hammond,
                                                                                                                                                         K. Hodgkinson, I. Johanson, A. López-
                      as machine learning have the potential to enable full utilization of the large amounts of                                          Venegas, et al. (2019). Regional Global
                      data generated by continuous GNSS networks. Development of seafloor Global Positioning                                             Navigation Satellite System Networks for
                                                                                                                                                         Crustal Deformation Monitoring, Seismol.
                      System-acoustic networks would provide unique information for fundamental and applied                                              Res. Lett. 91, 552–572, doi: 10.1785/
                      research on subduction zone seismic hazard and, potentially, monitoring.                                                           0220190113.

                  Introduction                                                                              1. U.S. Geological Survey, Menlo Park, California, U.S.A.; 2. Seismological Laboratory,
                  Global Navigation Satellite Systems (GNSSs), of which the                                 University of California, Berkeley, Berkeley, California, U.S.A.; 3. Scripps Institution of
                                                                                                            Oceanography, Institute of Geophysics and Planetary Physics, University of California
                  Global Positioning System (GPS) is an example, are a major                                San Diego, La Jolla, California, U.S.A.; 4. Hawai‘i Institute of Geophysics and
                  source of data for geophysical applications. The precise 3D coor-                         Planetology, University of Hawai‘i at Mānoa, Honolulu, Hawaii, U.S.A.; 5. Department
                                                                                                            of Earth and Environmental Sciences, Michigan State University, East Lansing,
                  dinates calculated from data collected during repeated GNSS
                                                                                                            Michigan, U.S.A.; 6. Nevada Geodetic Laboratory, Nevada Bureau of Mines and
                  measurements record the motion of geodetic benchmarks on                                  Geology, University of Nevada, Reno, Reno, Nevada, U.S.A.; 7. UNAVCO, Inc.,
                  the Earth’s surface. These data directly measure arbitrarily large                        Boulder, Colorado, U.S.A.; 8. Hawaiian Volcano Observatory, U.S. Geological Survey,
                                                                                                            Hilo, Hawai‘i, U.S.A.; 9. Department of Geology, University of Puerto Rico, Mayagüez,
                  displacements as might occur during earthquakes or volcanic                               Puerto Rico, U.S.A.; 10. Department of Geological Sciences, Central Washington
                  eruptions, but they also resolve crustal motion at the milli-                             University, Ellensburg, Washington, U.S.A.; 11. Center for Earthquake Research and
                                                                                                            Information, The University of Memphis, Memphis, Tennessee, U.S.A.; 12. U.S.
                  meter-per-year level over continental scales. Furthermore, GNSS                           Geological Survey, Pasadena, California, U.S.A.
                  enables observation of deformation processes that do not release                          *Corresponding author: jrmurray@usgs.gov
                  significant seismic energy and thus, for which seismic data                               © Seismological Society of America

                  552         Seismological Research Letters                                               www.srl-online.org         •   Volume 91         •   Number 2A          •   March 2019

Downloaded from https://pubs.geoscienceworld.org/ssa/srl/article-pdf/91/2A/552/4956205/srl-2019113.1.pdf
by Central Washington University, Timothy Melbourne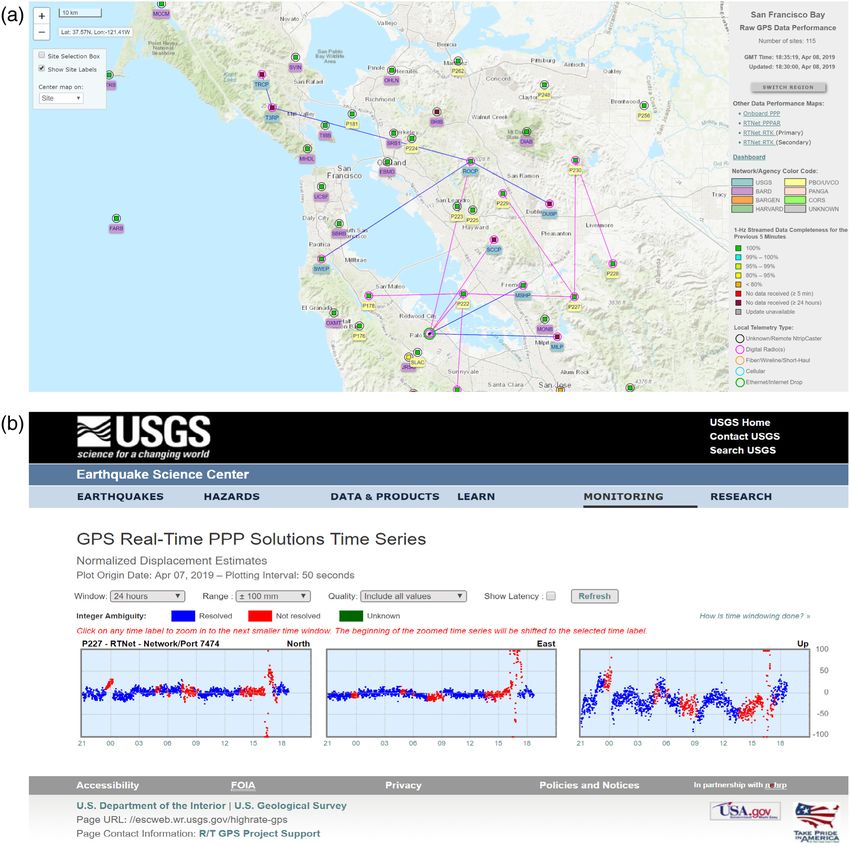
provide limited information. Examples include interseismic                                      In this article, we discuss the ways in which these networks
              strain, magma migration, earthquake afterslip, postseismic relax-                            are leveraging modern GNSS technology, real-time data
              ation, glacial isostatic adjustment, and slow fault-slip events.                             processing strategies, and integration with regional seismic net-
                  In the mid-1980s, GPS began to replace older geodetic                                    works to provide robust and timely observations for research
              methods, such as trilateration and leveling, for measuring                                   and natural hazard applications. We also consider innovations
              crustal deformation (e.g., Dixon, 1991). Two trends shaped the                               such as seafloor geodetic methods and the application of
              development of GNSS networks since then: the transition to                                   machine learning (ML) to geoscience problems that inspire
              continuous operation and the expansion from locally focused                                  future directions for regional GNSS networks and the activities
              station arrays to large-areal spatial coverage.                                              they support.
                  Initially, GPS surveys followed the approach of data collec-
              tion via temporary, campaign-style field deployments, some-                                  Background on GNSS
              times at the same benchmark networks previously observed                                     GNSS satellites transmit signals at multiple frequencies in the
              with older methods. Repeat surveys of a given network were                                   L-band (1–2 GHz) that are recorded by ground-based receivers
              often separated by several years. Although the average velocities                            paired with GNSS antennas. The signal travel times between at
              of measurement sites over years to decades can be estimated                                  least four satellites and a ground station are used to determine
              from GNSS data collected during infrequent campaign surveys,                                 the precise, 3D (i.e., east, north, and vertical) location of the
              many deformation processes exhibit temporal variations that                                  antenna phase center via processing methods that employ mod-
              can only be observed with continuously recorded data (Segall                                 els for satellite orbits, atmospheric signal delay, solid Earth tides,
              and Davis, 1997; Bürgmann and Thatcher, 2013; Bock and                                       antenna phase center variations, and other factors. Position
              Melgar, 2016). For example, detecting strain transients was one                              bias due to satellite clock drift is addressed by jointly processing
              objective of the Southern California Integrated GPS Network                                  data from a regional network of stations (Herring et al., 2015)
              (SCIGN, established in 1994; Hudnut et al., 2002), one of the                                or by applying clock corrections determined independently
              early United States (U.S.) continuously recording, permanently                               using regional or global networks (Zumberge et al., 1997).
              installed GPS (continuous GPS [cGPS]) networks. Events such                                  See Bock and Melgar (2016), Herring et al. (2016), and referen-
              as the 1994 M w 6.7 Northridge earthquake and ongoing unrest                                 ces therein for additional background. Although single-
              at several North American volcanoes further motivated the push                               frequency signals are useful for some geophysical applications,
              to establish cGPS networks throughout the western U.S. This                                  use of dual-frequency signals enables the removal of first-order
              effort accelerated in the mid-1990s, capitalizing on the increas-                            ionospheric delay and is the standard approach for high-
              ing affordability of GPS instrumentation. Installation of the                                precision positioning. The GPS constellation has been the pri-
              Plate Boundary Observatory (PBO) between 2003 and 2008                                       mary source of data for U.S. networks. However, analyzing
              expanded the scope of these networks significantly. In parallel,                             observations from multiple satellite systems (e.g., the European
              a vast network of semicontinuous GPS (scGPS) sites was built in                              Union’s Galileo, Russia’s Global Navigation Satellite System
              the Basin and Range (Blewitt et al., 2009).                                                  (GLONASS), and China’s BeiDou) can improve position accu-
                  In most cases, U.S. cGPS networks were established inde-                                 racy, particularly for real-time high-rate (defined here as ≥1 Hz
              pendently of regional seismic networks with spatial distribu-                                sampling) applications (Geng et al., 2018). In this article, we use
              tions driven by the geodetic detectability of deformation                                    the more general term GNSS to indicate GPS and/or multicon-
              processes. However, the two types of networks often cover sim-                               stellation GNSS; we use GPS to indicate that only GPS signals
              ilar geographic areas and in some regions are operated by the                                are recorded or used.
              same institutions. Opportunities for joint use of seismic and                                    The majority of the networks discussed here (Table 1) consist
              geodetic data (e.g., Bock et al., 2011), along with efficiencies                             of permanently installed, continuously operating GNSS stations
              possible through shared infrastructure, motivate the greater                                 (cGNSS). A station includes a GNSS receiver and antenna along
              integration of geodetic and seismic network operations and                                   with power and data transmission systems (Fig. 1). Although
              collocation of instrumentation. The Advanced National                                        these networks use a diverse collection of receiver and antenna
              Seismic System (ANSS) strategic plan (U.S. Geological                                        models, all provide, at minimum, dual-frequency GPS signal
              Survey [USGS], 2017) cites the incorporation of real-time                                    tracking to allow for precise positioning with millimeter-level
              geodetic data into ANSS products and inclusion of geodetic                                   horizontal repeatability. Antennas are designed to minimize
              networks as full ANSS participants as an opportunity for                                     multipath (when the GNSS signal bounces off surrounding
              improving earthquake early warning (EEW) and rapid impact                                    surfaces before reaching the antenna). Modern GNSS instru-
              assessment following natural disasters. Indeed, several GNSS                                 mentation supports multiple satellite constellations; because
              networks already receive partial ANSS support through                                        networks gradually upgrade their equipment, the availability of
              the build-out of the west coast EEW system, ShakeAlert,                                      multi-GNSS data is expanding. In parallel, processing software is
              and through cooperative agreements for geodetic network                                      being extended to enable simultaneous analysis of multi-GNSS
              operations.                                                                                  observables (Herring et al., 2016).

              Volume 91        •   Number 2A          •   March 2019         •    www.srl-online.org                                     Seismological Research Letters      553

Downloaded from https://pubs.geoscienceworld.org/ssa/srl/article-pdf/91/2A/552/4956205/srl-2019113.1.pdf
by Central Washington University, Timothy Melbourne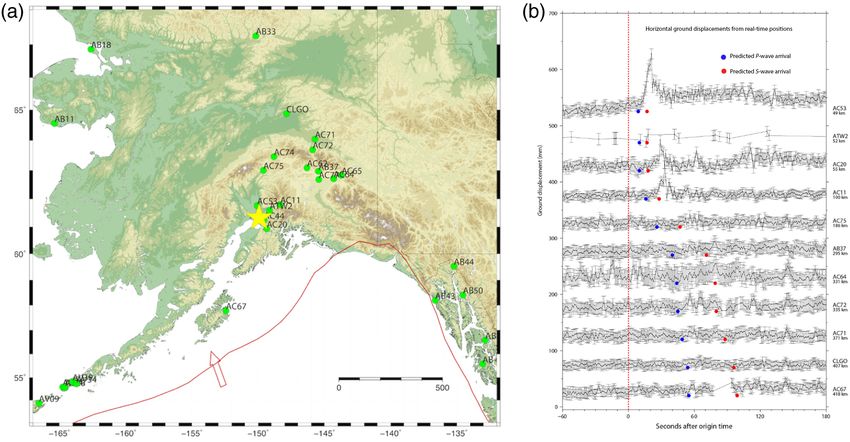
554
TABLE 1
Description of Regional GNSS* Networks Discussed in this Article (See Data and Resources for Network and Archive Websites URLs)
Number of
Current Stations Primary Institution
Year Number of within 1.5 km of for Operations and Data
by Central Washington University, Timothy Melbourne
Name Acronym Geographic Region Established Stations Seismic Station Maintenance Archive Notes
Alaska Deformation Array AKDA Alaska 1996 13 4 University of Alaska UNAVCO
Fairbanks
Seismological Research Letters
Alaska Volcano Observatory AVO Alaska 2002 20 20 USGS VHP†, University of UNAVCO
Alaska Fairbanks
Bay Area Regional BARD Northern California 1992 33 24 University of California, NCEDC‡
Deformation network Berkeley
California Volcano CalVO Volcanically active areas of 1994 16 9 USGS VHP UNAVCO
Observatory Long Valley California
Network
Downloaded from https://pubs.geoscienceworld.org/ssa/srl/article-pdf/91/2A/552/4956205/srl-2019113.1.pdf
Cascades Volcano CVO Cascades volcanoes 1997 31 18 USGS VHP UNAVCO
Observatory
GPS Array for Mid-America GAMA New Madrid seismic zone 1997 16 4 University of Memphis UNAVCO
Hawaiian Volcano HVO Island of Hawai‘i 1995 49 22 USGS VHP UNAVCO Additional nine stations are
Observatory collocated with only tilt, gas,
or gravity instruments
Mobile Array of GPS for MAGNET Basin and Range 2004 414 3 University of Nevada, UNAVCO
www.srl-online.org
Nevada Transtension Reno
•
Northern California GNSS NCGN Northern and central 2010 9 3 USGS EHP§ NCEDC
Network California
Volume 91
COCONet, Continuously Operating Caribbean GPS Observational Network; GNSS, Global Navigation Satellite System; GPS, Global Positioning System; PBO, Plate Boundary Observatory; TLALOCnet, Trans-boundary, Land and Atmosphere
Long-term Observational and Collaborative Network; USGS, U.S. Geological Survey.
•
*Individual networks may include stations without fully GNSS-compatible equipment and/or may not include all GNSS signals in routine processing.
†
UNAVCO data archive, see Data and Resources. See Data and Resources for more information regarding how to access data archived at UNAVCO.
‡VHP, Volcano Hazards Program.
§
Northern California Earthquake Data Center (NCEDC, see Data and Resources).
||
SOPAC, Scripps Orbit and Permanent Array Center; CVSRN, Central Valley Spatial Reference Network (Caltrans District 6).
Number 2A
(Continued next page.)
•
March 2019TABLE 1 (continued)
Description of Regional GNSS* Networks Discussed in this Article (See Data and Resources for Network and Archive Websites URLs)
Volume 91
•
Number of
Current Stations Primary Institution
Year Number of within 1.5 km of for Operations and Data
Name Acronym Geographic Region Established Stations Seismic Station Maintenance Archive Notes
Number 2A
by Central Washington University, Timothy Melbourne
Network of the Americas NOTA Continental western U.S., 2003 1259 58 (see note) UNAVCO Inc. UNAVCO This is a federation of the
•
Alaska and the Caribbean PBO, COCONet and
TLALOCnet networks. 23
sites have UCSD geodetic
modules and 35 have
March 2019
borehole seismometers
•
within 1.5 km.
Pacific Northwest Geodetic PANGA Pacific Northwest 1991 182 15 Central Washington PANGA
Array University
Pacific GPS Facility PGF Hawaiian Islands 1996 31 9 University of Hawai‘i at UNAVCO, Two sites collocated with
Mānoa; USGS VHP PGF National Weather Service
radiosonde network
Downloaded from https://pubs.geoscienceworld.org/ssa/srl/article-pdf/91/2A/552/4956205/srl-2019113.1.pdf
www.srl-online.org
Puerto Rico Seismic Network PRSN Puerto Rico 1997 16 12 Universidad de Puerto UNAVCO
Rico – Mayagüez
Southern California GNSS SCGN Southern California 1994 141 59 USGS EHP UNAVCO
Network
Scripps Orbit and Permanent SOPAC Southern California and 1992 42 6 SOPAC, CVSRN|| SOPAC SOPAC also archives RINEX
Array Center California Central Valley data for about 3000 regional
and global network stations
COCONet, Continuously Operating Caribbean GPS Observational Network; GNSS, Global Navigation Satellite System; GPS, Global Positioning System; PBO, Plate Boundary Observatory; TLALOCnet, Trans-boundary, Land and Atmosphere
Long-term Observational and Collaborative Network; USGS, U.S. Geological Survey.
*Individual networks may include stations without fully GNSS-compatible equipment and/or may not include all GNSS signals in routine processing.
†
UNAVCO data archive, see Data and Resources. See Data and Resources for more information regarding how to access data archived at UNAVCO.
‡VHP, Volcano Hazards Program.
§
Northern California Earthquake Data Center (NCEDC, see Data and Resources).
||
SOPAC, Scripps Orbit and Permanent Array Center; CVSRN, Central Valley Spatial Reference Network (Caltrans District 6).
Seismological Research Letters
555fixed to rooftops, steel beams
driven into sediment, and steel
masts or pins cemented into
bedrock. The southern
California Permanent GPS
Geodetic Array (Bock et al.,
1997), which evolved into the
SCIGN, introduced the use of
drilled and braced monuments,
a design later adopted by
UNAVCO for the PBO (Fig. 1).
Although more costly, this
design offers improved stability
(Mattioli et al., 2007; Mattioli
and Jansma, 2007; Langbein,
2008; Hill et al., 2009; Blume
et al., 2017; Langbein and
Svarc, 2019).
Data transmission methods
include cellular modem, radio
and microwave, satellite, wire-
less telemetry, and direct con-
nection to the internet from a
host institution. Choice of
method depends on desired
data volume and transmission
rate, allowable latency, avail-
able infrastructure, cost, and
site-specific conditions (e.g.,
line-of-sight to repeater sites,
radio frequency interference).
Typical sampling rates include
one sample per 30 or 15 s, 1, 5,
and 10 Hz. Receivers can be
configured to simultaneously
record and transmit data at
multiple rates. Raw data may
be stored on-receiver in ring
buffers and downloaded peri-
odically (e.g., hourly or daily);
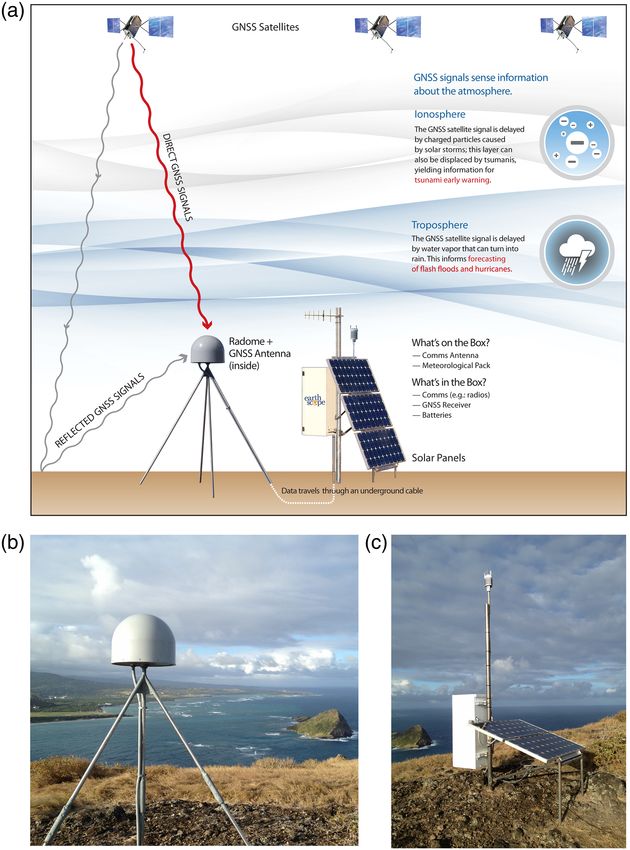
Figure 1. (a) Diagram of typical Network of the Americas (NOTA) permanent Global Navigation observations may also be
Satellite System (GNSS) site configuration. (b) Drilled and braced antenna monument with GNSS streamed to data centers in real
antenna. (c) Additional components of this installation include an enclosure for GNSS receiver and time. Available telemetry band-
communications and power devices, solar panels, and a meteorological instrumentation package.
Image credit: UNAVCO Inc. The color version of this figure is available only in the electronic edition.
width, along with anticipated
applications for the data, are
factors that determine sampling
Because the GNSS signal’s travel time is measured at the rate and data transmission schedule.
antenna, the antenna must be mounted stably with respect to Traditionally, data centers carried out centralized processing
the underlying crust. Within and among networks, various types of downloaded data to estimate a single, three-component posi-
of GNSS antenna monuments are used depending on site char- tion for each station day and analyzed the accumulated position
acteristics (e.g., geology, weather conditions, available space, and time series to estimate station velocities and other derived prod-
permitting), cost, feasibility of installation methods, and the sta- ucts (Bock et al., 2016; Herring et al., 2016; Murray and Svarc,
tion’s intended purpose. Examples include concrete pillars, pins 2017; Blewitt et al., 2018). As high-bandwidth telemetry has
556 Seismological Research Letters www.srl-online.org • Volume 91 • Number 2A • March 2019
Downloaded from https://pubs.geoscienceworld.org/ssa/srl/article-pdf/91/2A/552/4956205/srl-2019113.1.pdf
by Central Washington University, Timothy Melbourneand North American–
Caribbean subduction zones
and associated volcanoes; the
Island of Hawai‘i; and
Yellowstone (Figs. 2–8, Table 1).
The station distributions reflect
45˚ these networks’ initial purpose
to monitor ongoing deformation
at local to regional scales and
to observe distributed crustal
strain, fault creep and locking,
magma transport, earthquakes,
40˚ and volcanic eruptions.
Initially U.S. cGNSS net-
works each covered relatively
limited geographic areas, for
BARD example, southern California
CalVO or the Pacific Northwest. In
CRTN
35˚ 2003, UNAVCO Inc. began
CVO
MAGNET construction of the PBO as
NCGN part of the National Science
NOTA Foundation (NSF)-funded
PANGA EarthScope initiative (Williams
SCGN et al., 2010), which was designed
30˚ to observe the 3D, spatiotempo-
−125˚ −120˚ −115˚ −110˚ −105˚ −100˚
ral patterns of crustal strain
across the North American-
Figure 2. GNSS networks listed in Table 1, the western continental United States (as of May 2019).
Network acronyms defined in Table 1. Additional permanent GNSS stations belonging to networks Pacific plate boundary. The
not discussed in this article (e.g., NASA’s Global Geodetic Network or the Coast Guard) may be project resulted in 875 new
used for research and monitoring but are not depicted on this and the following maps. In areas of cGPS stations throughout the
dense station coverage, some markers may overlap. The color version of this figure is available only continental U.S. and Alaska in
in the electronic edition. locations chosen to complement
existing cGPS networks. In a
parallel effort, ∼225 existing sta-
grown more available and affordable, real-time streaming of raw tions were upgraded and folded into PBO, resulting in the largest
1 Hz observables has become widespread, providing data for U.S. cGPS network designed for scientific purposes. Although a
natural hazards monitoring and response, kinematic positioning subset of 100 PBO sites provided real-time high-rate data, the
of a wide variety of platforms, and land surveying. Download of standard protocol was 15 s sampling with data downloaded daily.
higher sample-rate data (e.g., 5 Hz) is typically done in triggered Around the same time, the University of Nevada, Reno, dem-
mode, for example, in the event of an earthquake. In recent onstrated the utility of a scGPS data collection approach. In this
years, some receiver manufacturers implemented on-receiver mode, monitoring sites are installed by fixing monument pins
precise positioning and real-time streaming of positions (usually to bedrock outcrops, which allows GPS instrumentation to be
at 1 Hz) using satellite clock corrections delivered directly to the rotated among locations with antenna position repeatability
receiver, allowing for stand-alone functionality with potential within 1 mm. Instruments can be left onsite for days to years
applications for real-time response to natural disasters. Several and then moved to another location to enhance spatial coverage.
regional networks are in the process of upgrading their stations This observation mode offers the flexibility and affordability of
to enable real-time data streaming, use of multiple GNSS con- temporary deployments with individual daily solution accura-
stellations, and, in some cases, onboard positioning. cies equivalent to those at continuous stations and velocity pre-
cision that is nearly comparable (Blewitt et al., 2009). It works
Regional GNSS Networks well where resources for construction of cGNSS stations are lim-
U.S. regional GNSS networks cover seismically and volcanically ited, large geographic areas need to be covered, site accessibility
active areas including the San Andreas fault system; Basin and is seasonally limited, and/or low-latency data are not required.
Range province; New Madrid seismic zone; Aleutian, Cascade, The Mobile Array of GPS for Nevada Transtension (MAGNET)
Volume 91 • Number 2A • March 2019 • www.srl-online.org Seismological Research Letters 557
Downloaded from https://pubs.geoscienceworld.org/ssa/srl/article-pdf/91/2A/552/4956205/srl-2019113.1.pdf
by Central Washington University, Timothy Melbourneapplications, including survey-
ing, precision agriculture,
airborne light detection and
ranging, and other activities
requiring real-time dynamic
45˚
positioning, as well as for scien-
tific research and natural disas-
ter early warning.
Recognizing that deforma-
tion sources like the Cascadia
40˚
38˚
subduction zone traverse inter-
national borders, PANGA
incorporated stations in both
the U.S. and Canada, becoming
37˚
35˚ an early example of interna-
tional collaboration in regional
cGNSS network development.
36˚ UNAVCO has long supported
geodetic network implementa-
30˚
tion and data collection efforts
35˚ throughout the globe. In
−92˚ −91˚ −90˚ −89˚ −88˚
GAMA October 2018, PBO became fed-
NOTA erated with the Trans-boun-
25˚ dary, Land and Atmosphere
−100˚ −95˚ −90˚ −85˚ −80˚ −75˚ −70˚
Long-term Observational and
Figure 3. As in Figure 2, central and eastern continental United States. Inset shows stations in the New Collaborative Network
Madrid Seismic Zone. Location of inset map marked by black box. (TLALOCNet, Cabral-Cano
et al., 2018) in Mexico and the
Continuously Operating
network was established in 2004 and now consists of 414 sta- Caribbean GPS Observational Network (COCONet, Braun et al.,
tions that touch five western U.S. states (Nevada, California, 2012) to form a unified Network of the Americas (NOTA). The
Utah, Arizona, and Oregon). majority of NOTA sites provide real-time data, with many
GNSS network funding sources have included: NSF, U.S. already enhanced to be fully GNSS capable.
Geological Survey (USGS), National Aeronautics and Space
Administration (NASA), other federal, state and local agencies, Regional GNSS Networks’ Impact on
partner universities, and matching funds provided by institutions Crustal Deformation Research and
such as universities that have the primary responsibility for Monitoring
operation and maintenance of some networks. The Pacific Data from the regional GNSS networks in Table 1 underlie a
Northwest Geodetic Array (PANGA) is an example of a multi- wide range of research and have led to unexpected discoveries
agency cooperative network designed to provide data for both in the fields of crustal deformation and beyond. These accom-
crustal deformation research and professional land surveyors plishments would not have been possible without the commit-
(PLSs). The costs of most stations comprise not only the elec- ment of network operators to freely sharing data, both raw and
tronic hardware but also permitting, installation, power, telem- processed, with the scientific community. Although this practice
etry, and routine maintenance. Thus, a data-sharing synergy existed to varying degrees early on, the PBO adopted a systematic
naturally arose between the surveying and research communities protocol for providing raw data and derived products without
in the Pacific Northwest, subject to the criteria that data be tele- delay and free of charge. This philosophy served as a model
metered in real time (for PLS applications) and that station for other network operators. UNAVCO also promoted the
monuments be very stable (for tectonics research). The engage- use of digital object identifiers as part of its open data policy
ment of the PLS community has enabled expansion and densi- (Pritchard et al., 2012). Beyond contributing raw data to online
fication of the PANGA footprint and upgrading of all stations to archives (Table 1), most networks offer position time series at
real-time data transmission. The California Real Time Network various sample rates and derived products such as station veloc-
(CRTN), with more than 1300 registered users, distributes real- ities, seasonal motion, coseismic offsets, and postseismic decay
time data from several networks for a broad range of (e.g., Bock et al., 2016; Herring et al., 2016; Murray and
558 Seismological Research Letters www.srl-online.org • Volume 91 • Number 2A • March 2019
Downloaded from https://pubs.geoscienceworld.org/ssa/srl/article-pdf/91/2A/552/4956205/srl-2019113.1.pdf
by Central Washington University, Timothy MelbourneBeginning with the 1992
M w 7.2 Landers earthquake
20˚ (Blewitt et al., 1993; Bock et al.,
70˚
1993), the regional cGNSS net-
works recorded coseismic dis-
placements associated with
HVO several significant earthquakes
PGF in the western U.S. and
19˚ Alaska. As demonstrated by
65˚
−156˚ −155˚ Langbein et al. (2006) for the
2004 M w 6 Parkfield earth-
quake, continuously recorded
data, especially with subdaily
60˚ or 1 Hz positioning, enable
separating coseismic from
immediate postseismic signals,
which otherwise would be
aliased. In its routine GNSS data
55˚ AKDA analysis, UNAVCO’s Geodesy
AVO Advancing Geosciences facility
NOTA recognizes 41 earthquakes since
−185˚ −180˚ −175˚ −170˚ −165˚ −160˚ −155˚ −150˚ −145˚ −140˚ −135˚ −130˚ 1999 that potentially cause off-
sets in GNSS time series and
provides estimated displace-
Figure 4. As in Figure 2, Alaska and Big Island of Hawai‘i. Inset shows the GNSS networks on the Big
Island of Hawai‘i. ments (Herring et al., 2016).
The installation of regional
cGNSS networks worldwide
Svarc, 2017; Blewitt et al., 2018). Increasingly sophisticated data was central to discovering a variety of slow-slip behavior ranging
access interfaces enabled easier data discovery and visualization, from days to years in duration. Indeed, although it would not be
in turn empowering a broader range of scientists and educators recognized for another decade, the first station of the PANGA
to use these observations in innovative ways (Zietlow et al., 2016; array was installed by the Natural Resources Canada Pacific
Blewitt et al., 2018). Here, we highlight some contributions of Geoscience Center along the southern coast of Vancouver
U.S. regional GNSS networks to crustal deformation research Island during a 1992 slow-slip event (SSE; Dragert and
with a focus on seismotectonic and volcanic processes; Bock Hyndman, 1995; Miller et al., 2002). Eventually, daily position
and Melgar (2016) provide a global overview of GNSS-based time series from cGPS sites in southern British Columbia and
research. northern Washington permitted the discovery of repeated SSEs
As the footprint of GNSS networks has grown, and particu- in the northern portion of the Cascadia subduction zone
larly with the establishment of the PBO, it has become possible (Dragert et al., 2001), and the signature of SSEs was found in
to develop broadscale kinematic and dynamic models of the data from cGPS sites along the entire Cascadia margin
spatial and temporal patterns of deformation (e.g., Flesch et al., (Szeliga et al., 2008). Where cGNSS and seismic networks over-
2007; Kreemer and Hammond, 2007; Pollitz et al., 2008; Bird, lap, some SSEs have been found to be accompanied by tectonic
2009; Parsons and Thatcher, 2011; Kreemer et al., 2012; tremor in combined episodic tremor and slip events (e.g., Rogers
Petersen et al., 2014). The frequent (i.e., daily) sampling of and Dragert, 2003; Schwartz and Rokosky, 2007; Peng and
position time series enabled better characterization of tempo- Gomberg, 2010; Bürgmann, 2018). The availability of daily
rally correlated noise processes (Langbein, 2008; Davis et al., cGPS position estimates with millimeter-level accuracy enabled
2012), in turn resulting in more realistic characterization of detailed studies of the spatial distribution and temporal evolu-
velocity uncertainties. The resulting horizontal and vertical tion of episodic SSEs across the Cascadia subduction zone (e.g.,
velocity fields provided a new source of data to constrain Bartlow et al., 2011), which is important for clarifying the role of
deformation models for hazard assessment. For example, the SSEs in earthquake hazard assessment.
Uniform California Earthquake Rupture Forecast, v.3 was the Similarly, the availability of cGPS data allowed for the discov-
first to incorporate geodetically constrained fault-slip rates and ery of SSEs on the south flank of Kīlauea that were previously
strain rates that leveraged the expanded spatial coverage of unknown from campaign GPS observations (Cervelli et al.,
GNSS sites in California (Parsons et al., 2013). 2002). Kīlauea’s SSEs occur on a subhorizontal decollement
Volume 91 • Number 2A • March 2019 • www.srl-online.org Seismological Research Letters 559
Downloaded from https://pubs.geoscienceworld.org/ssa/srl/article-pdf/91/2A/552/4956205/srl-2019113.1.pdf
by Central Washington University, Timothy Melbourne49˚
48˚
40˚
47˚
46˚
45˚
CVO
44˚
MAGNET
NOTA
43˚ PANGA
35˚
BARD
−125˚ −120˚
CalVO
CRTN
MAGNET Figure 6. As in Figure 2, close-up of Oregon and Washington.
NCGN
NOTA
SCGN deformation events at Yellowstone attributed to magmatic
−125˚ −120˚ −115˚
intrusions (Chang et al., 2010; Farrell et al., 2010).
Although beyond the scope of this article, data from the
cGNSS networks discussed here also revealed deformation sig-
Figure 5. As in Figure 2, close-up of California and Nevada. The
color version of this figure is available only in the electronic edition. nals arising from a variety of hydrologic loading processes
(Bawden et al., 2001; King et al., 2007; Amos et al., 2014; Argus
et al., 2014; Borsa et al., 2014; Fu, Argus, and Landerer, 2015;
Argus et al., 2017), some of which may influence seismicity pat-
∼8 km beneath the southern flank of the volcano, last about two terns through the crustal stresses they impart (e.g., Johnson et al.,
days, and produce slip events equivalent to an M w 5.4–6.0 earth- 2017; Kraner et al., 2018; Kreemer and Zaliapin, 2018). cGNSS
quake (Brooks et al., 2006). Unlike many subduction zone SSEs, stations can augment tide-gauge networks for tracking global
however, Kīlauea’s SSEs occur without detectable seismic signals sea-level change by providing measures of vertical land motion
(Montgomery-Brown et al., 2009). Thus, cGNSS observations are that can be used to obtain absolute sea-level measurements in a
the primary means of observing these SSEs. cGPS data also terrestrial reference frame (Foster, 2015) and through analysis of
revealed repeated, propagating SSEs in the Alaska–Aleutian sub- cGNSS signal-to-noise ratio to directly estimate local sea level
duction zone downdip of the coseismic rupture area of the 1964 (Larson et al., 2013). cGNSS data also provided a unique set
M w 9.2 earthquake. With durations of 2–9 yr, these events may of observations for estimating snow depth, soil moisture, perma-
release most of the interseismically accumulated slip deficit on a frost, and other near-surface characteristics that affect GNSS sig-
portion of the megathrust (Ohta et al., 2006; Fu, Liu, and nal reflection (Larson, 2016).
Freymueller, 2015; Li et al., 2016).
cGNSS data, especially in combination with other data types Real-Time GNSS
including Interferometric Synthetic Aperture Radar, gravity, An early demonstration of the value of rapidly estimated earth-
tilt, and leveling, have become an indispensable tool for vol- quake ground displacement from GPS followed the 1992 M w 7.2
cano monitoring (Poland et al., 2017). For example, GPS Landers (Shen et al., 1994) and 1994 M w 6.7 Northridge
observations enabled tracking the spatiotemporal evolution (Hudnut et al., 1996) earthquakes. In the Northridge case,
of unrest during the 2004 eruption of Mount St. Helens although only a few cGPS stations were operating in the vicinity
(Lisowski et al., 2008), and illuminated ongoing deformation of the epicenter, their observations, combined with postearth-
at a time of seismic quiescence during the 2006 eruption of quake campaign GPS data from nearby benchmarks, provided
Augustine volcano (Cervelli et al., 2006). cGPS data recorded coseismic displacements that were used to infer a finite-fault slip
multiple periods of uplift at Long Valley caldera, interpreted as model within eight days of the event (K. Hudnut and M.
arising from magma intrusion at depth (Battaglia et al., 1999; Murray, personal comm., IGSMail-466, 1994, see Data and
Montgomery-Brown et al., 2015), as well as capturing multiple Resources). Initial seismological observations and diffuse
560 Seismological Research Letters www.srl-online.org • Volume 91 • Number 2A • March 2019
Downloaded from https://pubs.geoscienceworld.org/ssa/srl/article-pdf/91/2A/552/4956205/srl-2019113.1.pdf
by Central Washington University, Timothy Melbourne30˚
25˚
20˚
NOTA
CRTN
15˚ MAGNET
SCGN
−120˚ −115˚ −110˚ −105˚ −100˚ −95˚ −90˚ −85˚ −80˚
aftershock locations poorly resolved the orientation of the blind- Figure 7. As in Figure 2, Mexico.
thrust fault, but the geodetic displacements clearly favored a
south-southwest-dipping fault, suggesting the advantages of
combined seismological and geodetic observations for rapid ground-motion calculations for EEW purposes (e.g., Crowell
earthquake source characterization. Today similar results can et al., 2013; Grapenthin et al., 2014; Minson et al., 2014; Ruhl
be obtained in minutes to seconds from real-time data. et al., 2017). Blewitt et al. (2006) demonstrated that near-real-
Observations recorded during the Hector Mine (Nikolaidis time GPS positions from data collected at a 30 s sampling interval
et al., 2001), Denali (Larson et al., 2003; Bock et al., 2004), and would have enabled more accurate and timely warnings of the
Parkfield (Langbein and Bock, 2004) earthquakes further dem- impending tsunami resulting from the 2004 M w 9.1 Sumatra
onstrated the potential value and capabilities of high-rate (e.g., earthquake. Allen and Ziv (2011), using real-time GPS from
1-Hz-or-higher sampling rates) and real-time positioning for the 2010 M w 7.2 El Mayor–Cucapah earthquake, showed that
earthquake response. Rhie et al. (2009) envisioned the use of long-period information lost in accelerometer data was retained
real-time GNSS data to rapidly characterize earthquake sources in the 1 Hz geodetic time series at a site with collocated GPS and
to provide information on source finiteness and rupture direc- seismic instrumentation. The findings of Grapenthin et al. (2017)
tivity that would improve ShakeMap estimates of peak ground and Ruhl et al. (2017) suggest that cGNSS networks could be a
velocity (PGV). Despite using simplistic rupture model valuable augmentation to EEW systems in regions with sparse
assumptions to enable rapid computation, the method was able seismic network coverage. Some studies conclude it is possible
to match Northridge earthquake PGV observations sufficiently to obtain nonsaturating magnitude estimates for large earth-
well to demonstrate the potential contribution of GNSS- quakes using high-rate GNSS data while rupture is ongoing
derived models for use in emergency response. (e.g., Melgar et al., 2015; Melgar and Hayes, 2017; Goldberg et al.,
In 2006, development began on the U.S. EEW system, 2018). The existence of rupture determinism remains a topic of
ShakeAlert (Given et al., 2018), employing algorithms to rapidly active debate with important implications for EEW. Ongoing
characterize the earthquake source using the first few seconds of ShakeAlert development includes assessing the contribution that
the P wave. However, as observed during the 2011 M w 9.0 GNSS data can make to EEW, optimizing processing strategies to
Tohoku-Oki earthquake and other large events globally, real-time reduce latency and increase robustness, and further developing
earthquake magnitude estimates derived from seismic data alone algorithms that utilize these observations to improve real-time
are known to saturate above ∼M w 7 (Hoshiba and Ozaki, 2014). ground-motion prediction (Murray et al., 2018).
GNSS displacements enable nonsaturating magnitude estimates Motivated by the aforementioned research findings and
for large events and provide information on source finiteness, operational demands, cGNSS networks are transitioning to
both of which have the potential to improve the accuracy of real-time 1 Hz data collection and streaming. The 2009
Volume 91 • Number 2A • March 2019 • www.srl-online.org Seismological Research Letters 561
Downloaded from https://pubs.geoscienceworld.org/ssa/srl/article-pdf/91/2A/552/4956205/srl-2019113.1.pdf
by Central Washington University, Timothy Melbourne19˚
NOTA
PRSN
25˚ 18˚
−68˚ −67˚ −66˚ −65˚ −64˚
20˚
15˚
10˚
NOTA
PRSN
5˚
−90˚ −85˚ −80˚ −75˚ −70˚ −65˚ −60˚
American Recovery and Reinvestment Act (ARRA) provided Figure 8. As in Figure 2, the Caribbean region. Inset shows sta-
a significant source of funding for this effort, supporting the tions in Puerto Rico. Location of inset map marked by black box.
establishment of the USGS Northern California GNSS Network,
conversion of 230 PBO sites to real time under the Cascadia
Initiative, and upgrade of PBO stations for monitoring at data from multiple networks, for example, to provide redun-
Yellowstone caldera (in collaboration with USGS). ARRA- dant data sources for real-time monitoring and response. Some
funded projects also expanded the number and improved the networks also provide web portals for viewing real-time
robustness of real-time GNSS stations in the USGS Southern processed positions via dynamically updated plots (Fig. 9).
California GNSS Network (SCGN), Bay Area Regional UNAVCO presents data and interpretation on its website’s
Deformation (BARD), CRTN, and PANGA networks. In paral- geophysical event response pages (see Data and Resources),
lel, the National Ocean and Atmospheric Administration including displacement waveforms from real-time processing,
(NOAA) funded the real-time upgrade of some PBO sites earthquake source information estimated from these data, and
for weather forecasting. Through an Urban Area Security updated models incorporating observations from nonreal-time
Initiative grant, 41 real-time stations were added to the SCGN stations (Fig. 10).
in 2016. As it became evident that real-time streaming was an GNSS data are increasingly important for volcano monitor-
efficient method of data retrieval and network operations, NSF ing (e.g., Cervelli et al., 2006, 2010; Fournier et al., 2009). The
funded additional PBO upgrades between 2008 and 2018. As of variety of processes that can be active during an eruptive crisis,
2019, over 800 stations in NOTA provide real-time high-rate and the speed at which a sequence of events can unfold, make it
data. Further improvements to real-time GNSS infrastructure challenging yet critically important to quickly develop interpre-
in USGS and partner networks (PANGA, BARD, and NOTA) tive models for public safety partners. During the 2018 eruption
are in progress as part of the ShakeAlert project. and earthquake sequence at Kīlauea volcano, real-time GPS data
Table 2 summarizes real-time data generated by the were central to monitoring and generating short-term hazard
regional GNSS networks discussed in this article. Several net- forecasts (Neal et al., 2019). This period of unrest involved both
works provide the raw data streams through Ntrip casters a flank eruption in Kīlauea’s lower east rift zone and collapse of
(Weber et al., 2005), and data centers often process real-time the summit caldera ∼40 km to the west. The Hawaiian Volcano
562 Seismological Research Letters www.srl-online.org • Volume 91 • Number 2A • March 2019
Downloaded from https://pubs.geoscienceworld.org/ssa/srl/article-pdf/91/2A/552/4956205/srl-2019113.1.pdf
by Central Washington University, Timothy MelbourneTABLE 2
Real-Time GNSS Availability
Number of Subset of Real-
Stations Time Stations that
Providing Provide
Real-Time Multiconstellation Data Real-Time Raw
Name Acronym GNSS Data* GNSS Data Formats Data Access Notes
Bay Area Regional BARD 33 5 BINEX, see Data and Resources Remaining sites to be
Deformation network RTCM3 upgraded to GPS
+GLONASS by August
2020
California Volcano CalVO 16 16 RTCM3 Internal use
Observatory Long
Valley Network
California Real Time CRTN 42 (see note) 42 RTCM3 IP = 132.239.154.80:2103 RTCM3 data rebroadcast
Network (southern California), IP = from multiple NTRIP
132.239.152.175:2103 servers, for a total of 600
(northern California) stations, ~200 of which
provide multi-GNSS data
Cascades Volcano CVO 28 Variable BINEX or Internal use
Observatory RTCM3
GPS Array for Mid- GAMA 9 3 RTCM3 Real-time streams for
America stations HCES, MCTY,
STLE, CVMS, NWCC,
PTGV, NMKM, and RLAP
available from Tennessee
Department of
Transportation broadcast
server IP: 170.143.44.6,
requires authentication
Hawaiian Volcano HVO 42 0 BINEX Internal use Sampling rate for real-time
Observatory data is 1 Hz or 5 samples
per second, depending on
station
Northern California NCGN 8 0 BINEX see Data and Resources
GNSS Network
Network of the NOTA 891 370 PPP, BINEX, see Data and Resources
Americas RTCM3
Pacific Northwest PANGA 163 149 RTCM3 see Data and Resources
Geodetic Array
Pacific GPS Facility PGF 4 1 RTCM3 Internal use Public access to real-time
streams from 10 sites
planned by January 2020
Puerto Rico Seismic PRSN 16 3 BINEX, see Data and Resources
Network RTCM2,
RTCM3
Southern California SCGN 120 44 BINEX see Data and Resources
GNSS Network
GLONASS, Global Navigation Satellite System.
*Sampling rate is 1 Hz for all networks unless otherwise indicated.
Observatory (HVO) supplemented its backbone GPS monitor- real-time GPS data, along with migrating seismicity, were
ing network with semicontinuous stations, and these stations among the first indications of subsurface dike propagation down
were rapidly integrated into the processing framework. The the rift zone. The GPS data were used to monitor the growth of
Volume 91 • Number 2A • March 2019 • www.srl-online.org Seismological Research Letters 563
Downloaded from https://pubs.geoscienceworld.org/ssa/srl/article-pdf/91/2A/552/4956205/srl-2019113.1.pdf
by Central Washington University, Timothy Melbournethe intrusion and infer continued dike opening over a few days Figure 9. Example web interface for real-time GNSS. This website
following the initial fracture. At the summit, the GPS data pro- (see Data and Resources) includes information regarding the
vided unique information on the almost daily collapse events GNSS stations for which the USGS Earthquake Hazards Program
processes real-time data. (a) Map interface for real-time stations
that included up to 8 m of subsidence and repeated displace-
in the San Francisco Bay Area. Clicking station markers provides
ments of stations just beyond the collapsing blocks within additional information regarding data completeness and receiver
the caldera. This was the first use of real-time GPS data by diagnostics. Menu on the right provides access to position time
HVO for eruption response and provided proof of concept series from real-time processing. (b) Example time series. The
for the utility of this information during a volcanic crisis. color version of this figure is available only in the electronic
edition.
The natural hazard applications of real-time GNSS data
reach beyond EEW and volcano monitoring. For example,
Melgar and Bock (2015) demonstrated that tsunami propaga-
tion predicted from kinematic earthquake rupture models
564 Seismological Research Letters www.srl-online.org • Volume 91 • Number 2A • March 2019
Downloaded from https://pubs.geoscienceworld.org/ssa/srl/article-pdf/91/2A/552/4956205/srl-2019113.1.pdf
by Central Washington University, Timothy Melbourneconstrained by real-time GPS, strong-motion, seafloor pres- Figure 10. Example of real-time ground displacement time series
sure, and GPS buoy data could provide accurate local runup recorded during the 30 November 2018 Mw 7.1 earthquake,
estimates within minutes of rupture nucleation. Melgar et al. northwest of Anchorage, Alaska. Plots depicting data and inter-
pretation are included in UNAVCO’s geophysical event response
(2016) subsequently showed that even with simpler source
web pages (https://www.unavco.org/projects/project-support/
models, useful local tsunami warning could be possible using geophysical-event-response/geophysical-event-response.html, last
data from land-based GNSS and seismic stations. The NASA- accessed May 3, 2019). (a) Sites providing real-time data. (b) 1 Hz
funded Real-Time Earthquake Analysis for Disaster Mitigation horizontal displacement time series calculated from real-time
(READI) project, in collaboration with NOAA, is building a GNSS data. Vertical dashed line: earthquake origin time. The color
version of this figure is available only in the electronic edition.
system to be used by NOAA’s tsunami warning centers that
combines real-time GNSS and seismic data to rapidly locate
and characterize earthquakes (Stough and Green, 2016). The
earthquake source information provides input to tsunami ini- NOAA’s Space Weather Prediction Center uses UNAVCO’s
tiation and propagation models from which evacuation warn- real-time GNSS streams to generate maps of TEC, which
ings could be generated for coastal communities. are analyzed for anomalies to issue alerts and storm watches.
Measuring ionospheric disturbances using GNSS potentially Real-time GNSS data can also contribute to weather forecast-
provides another method to track tsunami propagation ing. Water vapor in the atmosphere delays the GNSS signals
(Occhipinti et al., 2013; Komjathy et al., 2016). Tsunamis gen- (Bevis et al., 1994; Radhakrishna et al., 2015), and this delay
erate atmospheric gravity waves that, in turn, trigger ionospheric can be used to infer the precipitable water vapor (PWV).
disturbances that travel outward from the earthquake source Knowledge of PWV is critical for accurate, operational weather
region. The ionosphere is dispersive, causing frequency-depen- forecasting, and data from GPS sites have proven to be valuable
dent travel-time delays in GNSS signals. These delays can be during extreme weather events (Smith et al., 2007). California
used to estimate the total electron content (TEC), a measure GNSS networks have been used to track summer monsoons
of the electron density between a receiver and satellite. (Moore et al., 2015) and atmospheric rivers (Wang et al., 2019),
Savastano et al. (2017) demonstrated that real-time GNSS providing input to successful forecasts of flash flooding. The
tracking of TEC perturbations can provide information on tsu- study of atmospheric processes was one motivation in designing
nami propagation that is consistent with that generated by TLALOCNet and COCONet (Braun et al., 2012; Cabral-Cano
NOAA’s current real-time forecast system. et al., 2018), as well as the University of Hawai‘i GNSS network
Knowledge of TEC perturbations is also important for mon- on the Big Island of Hawai‘i (e.g., Foster and Bevis, 2003; Foster
itoring space weather, such as solar flares and geomagnetic et al., 2003). Currently UNAVCO’s raw data streams are being
storms, that can affect power grids, satellite communication, processed in real time to extract the zenith total delay, a measure
cell phone networks, aviation, and GNSS positioning systems. of signal delay used to estimate the PWV. PWV estimates are
Volume 91 • Number 2A • March 2019 • www.srl-online.org Seismological Research Letters 565
Downloaded from https://pubs.geoscienceworld.org/ssa/srl/article-pdf/91/2A/552/4956205/srl-2019113.1.pdf
by Central Washington University, Timothy Melbournethen assimilated into NOAA’s numerical weather prediction and power requirements for collecting and transmitting the two
models. As is true for EEW and tsunami warning systems, such data types in real time also differ. Power and communications
models depend on dense, accurate, and low-latency GNSS infrastructure must be designed to meet the needs of both while
observations. minimizing system complexity to facilitate maintenance and
promote network robustness. Even stations separated by
Integration with Seismic Networks 1–2 km can still be considered collocated for some applications
As stated in the ANSS strategic plan (USGS, 2017), further (Bock et al., 2011; Crowell et al., 2013) and could offer some
integration of GNSS and seismic networks would support of the installation, operation, and maintenance efficiencies
stated ANSS goals by promoting joint use of the two data types achieved by fully collocated instrumentation.
to better characterize earthquake sources and ground motion The spatial footprints of regional GNSS and seismic networks
and by providing opportunities to leverage resources for build- overlap. In some cases, the same institution operates both types
ing and maintaining network infrastructure. of networks, and infrastructure for power supply, radios, and
Unlike seismic data, GNSS positions directly record both the data transmission are shared. Several of the regional GNSS
dynamic displacement and static offsets during an earthquake networks discussed here include stations that are collocated
but at low-temporal resolution with centimeter-level precision. with broadband and/or strong-motion seismometers (Table 1).
Bock et al. (2011) developed a Kalman-filter-based approach to Further integration of seismic and geodetic networks is under-
combine strong-motion records and GNSS positions from col- way to support anticipated applications for co-located seismic
located instruments, producing a so-called seismogeodetic posi- and GNSS observations. In the past two years, USGS has funded
tion stream. In this technique, GNSS displacements, with their the upgrade of ∼54 NOTA stations distributed between central
longer period stability and accuracy, constrain the integration of California and Seattle to include seismic instrumentation oper-
higher sample rate, lower noise threshold seismic data. The ated by ShakeAlert partner institutions. Upgrades to power and
resulting displacement waveforms retain both the P-wave arrival communication systems at these sites will enable direct real-time
and static offsets. Seismogeodetic positions generated in real high-rate GNSS data flow to ShakeAlert data centers, concurrent
time would provide input for magnitude scaling relationships with seismic data streams. The data will continue to flow to
or rapid finite-fault modeling, both of which could produce sub- UNAVCO’s data operations center through an independent
stantially more accurate earthquake source parameter estimates data path, providing system redundancy.
for calculating ground motion in an EEW context (e.g., Crowell Over the past decade individual network operators developed
et al., 2016) and for tsunami warning (Melgar and Bock, 2015). methods to bring real-time high-rate GNSS data from field sta-
Incorporation of algorithms that use GNSS data, alone or tions to their respective data centers and to integrate these data
jointly with seismic data, is an area of active research and devel- into their existing systems as needed for follow-on applications.
opment within ShakeAlert. Some of the geodetic EEW algo- The increased focus on joint use of real-time seismic and geodetic
rithms currently under development exclusively use GNSS data, along with expansion of co-located stations, has prompted
position time series to characterize the earthquake source in real the evolution of data management software and formats from
time, only using seismic data indirectly to trigger initiation of network-specific solutions to standardized approaches that sup-
geodetic modeling. Approaches that make joint use of seismic port monitoring and event response activities shared by multiple
and geodetic data are also under development, such as the inte- regional networks. For example, real-time GNSS position
grated use of the Finite-Fault Rupture Detector (FinDer; Böse streams from ShakeAlert partner networks are transmitted with
et al., 2017) and Bayesian Evidence-based Fault Orientation a standardized format and messaging protocol. These data are
and Real-time Earthquake Slip (BEFORES; Minson et al., 2014) stored and accessed using the EarthWorm software and associ-
algorithms or magnitude estimation via scaling laws that use ated data storage architecture that was already in use for seismic
seismogeodetic positions (Crowell et al., 2013). data (Hernández and Martínez, 2018; López et al., 2018).
In addition to the scientific and earthquake response benefits,
collocating seismic and GNSS stations can support more effi- Looking Ahead
cient network construction, operation, and maintenance Recent and ongoing developments in GNSS receiver technol-
through shared power and telemetry systems, dual-use site ogy, data analysis methods, and the underlying observational
permits, and consolidated visits to field sites. Fully achieving and computational infrastructure enable and inspire a variety
these efficiencies is most successful with careful planning and of future directions for regional GNSS networks. Here we high-
coordination among network operators and data users. For light a few examples.
example, the physical requirements for seismic and geodetic sta-
tions, though similar, are not identical. Minimizing anthropo- Instrumentation
genic and natural noise sources is a priority for seismic sites, Current real-time network operations primarily utilize data-
whereas unobstructed sky visibility and low multipath are criti- center-based processing systems; raw data from field stations
cal for optimal GNSS data collection. The telemetry bandwidth stream to a centralized location where they are processed in real
566 Seismological Research Letters www.srl-online.org • Volume 91 • Number 2A • March 2019
Downloaded from https://pubs.geoscienceworld.org/ssa/srl/article-pdf/91/2A/552/4956205/srl-2019113.1.pdf
by Central Washington University, Timothy MelbourneYou can also read