FFA Study: Assessing the contribution of landings from locally based commercial tuna fishing vessels to food security - Authors: Sari Tolvanen ...
←
→
Page content transcription
If your browser does not render page correctly, please read the page content below
FFA Study:
Assessing the contribution of landings
from locally based commercial tuna
fishing vessels to food security

Authors: Sari Tolvanen, Karli Thomas, Tony Lewis and Mike McCoy
May 2019

www.marinechange.com
MARINE CHANGE | MAY 2019

Abbreviations                                                             RMI     The Republic of the Marshall Islands
                                                                          SPC     Secretariat of the Pacific Community
BMR        Bureau of Marine Resources (Palau)                             SSL     Southern Seas Logistics Ltd (Solomon Islands)
CFC        Caroline Fishing Company                                       TR      Trolling
CFD        Coastal Fisheries Division Kiribati                            T/S     Transshipment
CNFC       China National Fisheries Corporation                           VDS     Vessel day scheme
CPPL       Central Pacific Producers Limited (Kiribati)                   WCPFC   Western and Central Pacific Fisheries Commission
CSR        Corporate social responsibility                                WCPO    Western and Central Pacific Ocean
ENSO       The El Niño-Southern Oscillation                               WRF     Whole round fish
EEZ        Exclusive economic zone
FAD        Fish aggregating device
FFA        The Pacific Islands Forum Fisheries Agency
FSM        Federated States of Micronesia
GRT        Gross registered tonnage
HIES       Household income and expenditure survey
JV         Joint Venture
KFL        Kiribati Fisheries Limited
LB         Locally based
LBF        Locally based foreign
LF         Local flag (but not locally based)
LL         Longline
MFAT       New Zealand Ministry of Foreign Affairs and Trade
MFMRD      Ministry of Fisheries and Marine Resources Development
MSG        Melanesian spearhead group
MT         Metric tonnes
NFC        National Fisheries Corporation (FSM)
NFD        National Fisheries Developments Ltd, the Solomon Islands
OFA        Office of fisheries and aquaculture (FSM)
PICs       Pacific Island Countries
PNA        Parties to the Nauru Agreement
PNG        Papua New Guinea
PS         Purse seine
PL         Pole-and-line

                                                                      2                                                      www.marinechange.com
MARINE CHANGE | MAY 2019

Executive Summary                                                                                  The contribution from processing facilities and foreign transshipments as well as
                                                                                                   from artisanal fisheries was also included in the baseline for 2016 where data or
                                                                                                   existing studies were available to make estimations.
Fish is vital to the food security of Pacific Island Countries (PICs), where it has
traditionally formed a cornerstone of a healthy and balanced diet. More                            The study found that in 2016 only 0.8 % of the total catch of locally based fleets
recently the consumption of processed imported foods has increased in the                          in the region was entering local markets, with 99.2% being exported to foreign
region, while the consumption of locally produced plants and animals, including                    markets. The longline fleet average contribution (excluding Fiji) was 8.6% and for
fresh fish, has decreased 1. This is contributing to the health crisis of non-                     purse fleets only 0.4% of the total catch in 2016.
communicable diseases prevalent in many countries. Hence, there is an urgent
need to increase the contribution from the region’s abundant offshore tuna                         The reasons behind the low contribution within the longline sector were
fisheries (including tuna and tuna-like species as well as bycatch) to food                        identified as poor economic performance of the fleets and low local price for high
security.                                                                                          quality frozen fish. For the purse seine sector main obstacles were local
                                                                                                   (prohibiting) policies, lack of demand for species and lack of sales infrastructure
To address this, the Pacific Island Forum Fisheries Ministers developed a                          and support.
‘Regional Roadmap for Sustainable Pacific Fisheries,’ which sets ambitious goals
for a 10-year period and includes a goal of increasing the supply of tuna for                      The countries where landings from locally based commercial fleets contribute
domestic consumption by 40,000 tonnes across the region by 2024. To assess                         most to food security in 2016, based on our best estimates, are the Cook Islands
progress towards this goal, a baseline measurement for the year 2016 is                            (95%), Samoa (33%), Tonga (25%), and Palau (8%). The lowest contribution to
required.                                                                                          food security was found in the high volume primarily purse seine-fishing
                                                                                                   countries, with, for example only 0.02% of the locally based fleet’s catch going to
This study assessed the contribution of tuna, tuna-like species and associated                     the local market in FSM.
bycatch from locally based commercial fleets of all gear types to local markets in
Pacific Island Countries in 2016. In-country research was conducted in the high                    The best examples of existing efforts to increase local landings were found in
volume countries; the Federated States of Micronesia (FSM), Kiribati, the                          Tonga, where the there is a policy in place to require retention of fish in the local
Republic of the Marshall Islands (RMI), Papua New Guinea (PNG), the Solomon                        market from the locally based foreign fleet. Also in Solomon Islands, the private
Islands as well as Palau. All other countries, with the exception of Fiji, which has               sector has organized the distribution and sales of small tuna and by-catch with
been covered by another similar study, were researched through interviews at                       great success. Other similar initiatives are either on the way, or opportunities
the WCPFC 15 in Honolulu, December 2018, and follow up correspondence with                         exist in many PICs, which can lead to further increases if implemented fully.
government officials.                                                                              These include specific efforts to increase the pelagic catches of the small-scale
                                                                                                   artisanal fleets. The current efforts, specific obstacles and opportunities for each
                                                                                                   country are discussed in detail in Section 4.1.

1 Charlton, KE, et al. (2016) Fish, food security and health in Pacific Island countries and
territories: a systematic literature review. BMC Public Health. 2016; 16: 285

                                                                                               3                                                                     www.marinechange.com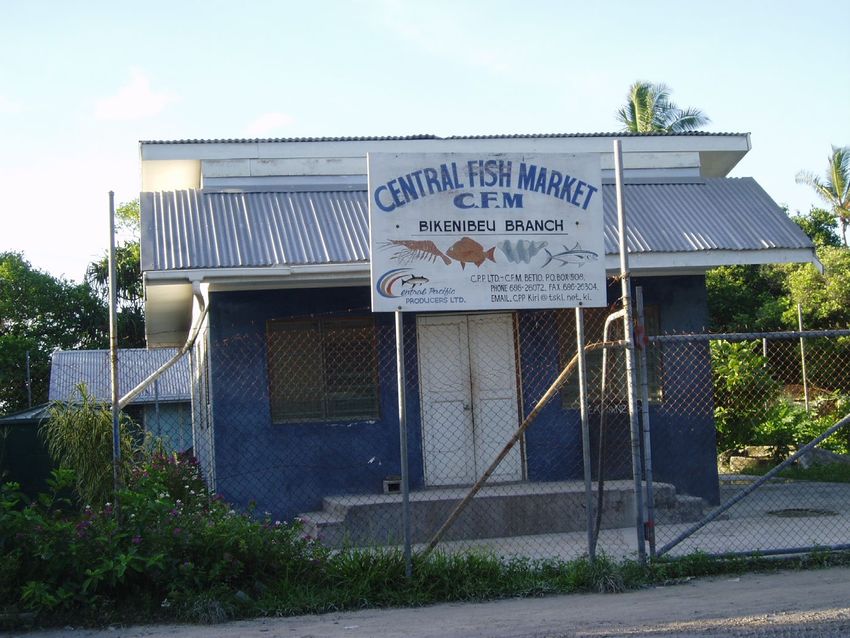
MARINE CHANGE | MAY 2019

In addition, the availability of accurate data on landings, formal and informal, of
locally based vessels in the region is of concern. Whilst the authors believe that
most sources of locally available tuna from local fleets were accounted for in this
study, there are huge gaps in the reliability of data available. Most importantly,
data are lacking on the contribution of the region’s mixed-species artisanal
pelagic fisheries to food security, but also on aspects of commercial fishery
operations such as landings and leakage from transshipments, both by foreign
and locally based vessels.

Currently the purse seine fleets that land their catch in PNG and the Solomon
Islands are making the largest contribution to food security by volume. In
addition, the processing industry in both countries contributes significantly
through canned dark meat products. This was identified as one of the major
growth areas in the study. However overall supplies of fresh and frozen tuna by
local fleets are likely to remain steady, or even decline unless a strong policy
stand is taken by Pacific Island Governments to require suitable amounts of tuna
to be landed in local markets where demand exists and in consultation with
industry.                                                                                 Packing tunas and bycatch from NFD vessels for dispatch by ferry to Honiara, the
                                                                                          Solomon Islands © Tony Lewis
At the request of FFA and in light of the challenges in obtaining reliable data to
make this baseline assessment, we make the following recommendations for
data collection. These should assist the FFA in fully assessing the 2016 baseline
(given that the primary purpose of this study was to assess the contribution from
locally based commercial fleets only) and monitoring future changes in this
contribution to food security in Pacific Island countries.

                                                                                      4                                                                        www.marinechange.com
MARINE CHANGE | MAY 2019

Recommendations for data collection                                                            5.   Monitoring programmes for transhipment leakage and/or formal discard
                                                                                                    landings need to be put in place in order to determine the
It is recommended that this study is repeated in 2021 to provide estimates for                      socioeconomic benefits or impacts of this fish and guide its best
2020 and a half way measurement of the region’s progress towards the 2024                           utilisation.
target. Depending on the trends, efforts and achievements by that date the study
could be repeated also in 2023 for 2022 to allow for closer evaluation of the              Artisanal tuna fisheries
progress made. This should be possible as a desk study utilizing contacts and data
sources identified during this study.                                                          6.   There is an urgent need for PIC fisheries departments to make good
                                                                                                    overall catch estimates of artisanal tuna catches. These will need to
Locally based fleets                                                                                include the monitoring of FAD-associated catch, central and municipal
                                                                                                    market surveys and extrapolation of creel survey and Tails data. Given
    1.   Given the wide spectrum of “locally based fleets” FFA should consider                      the different sources of information available to the departments,
         the range of PIC fleet examples and clarify what arrangements                              combined with a good local understanding of the patterns and
         contribute, or have the potential to contribute, the most to local food                    seasonality of fishing effort and the assistance of SPC Coastal Fisheries
         security and prioritise these for support in achieving the objective of the                programme, relatively accurate estimates should be possible.
         Roadmap.                                                                              7.   Only some PICs report artisanal catch data for tuna, tuna-like and
    2.   National data collection and reporting (including to WCPFC) should be                      associated pelagic species in their Part 1 Annual Reports to the WCPFC.
         adjusted so that catches of locally based vessels are distinguished from                   If possible, all countries should be encouraged to do so in a standardised
         those of flagged vessels landing to other countries for direct export, and                 format to aid national fishery management as well as monitoring
         reporting follows a standardised format.                                                   towards the roadmap goal.
    3.   Species-level volume data for all fish sold locally should be kept by the
         government and/or private sector, included by fishery officers in their
         regular data collection, and regularly reported to the FFA. FFA already
         supports a network of economic data collectors, and summarizing this
         work could possibly be added to their responsibilities.

Processing and distant water fleets

    4.   The processing sector should make available quarterly data on sales and
         other contributions to the local market including species, volume,
         product form and price.

                                                                                       5                                                                   www.marinechange.com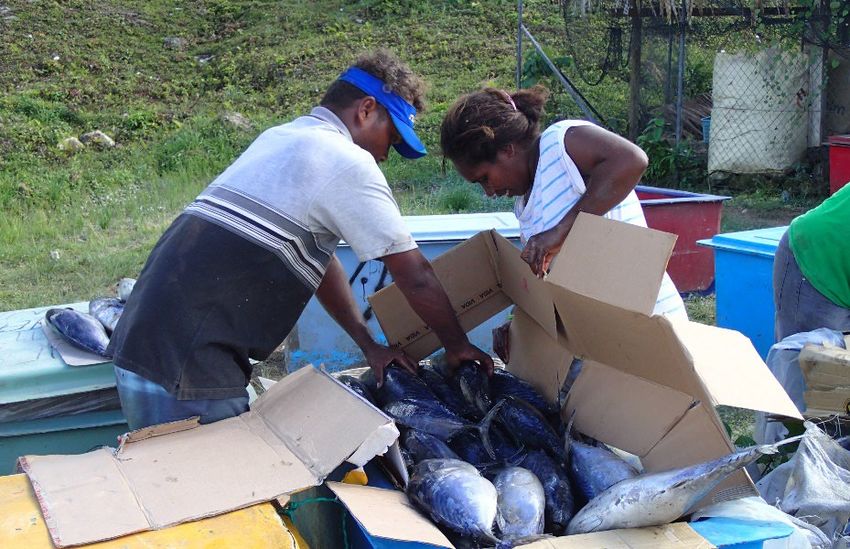
MARINE CHANGE | MAY 2019

Contents
Background .................................................................................................................7
Methodology ............................................................................................................... 8
  2.1 Objective.................................................................................................... 8
  2.2. Methodology ............................................................................................ 8
  2.3 Definitions ................................................................................................. 8
  2.4 Additional sources of tuna to the local market ............................................ 9
  2.5 Weather and climate considerations for the baseline year .......................... 9
Results........................................................................................................................ 10
  3.1 Landings from locally based tuna fishing vessels ........................................10
  3.2 Tuna available to the local market from canning .......................................21
  3.3 Foreign vessel transshipments and leakage ...............................................23
  3.4 Artisanal fisheries......................................................................................29
Conclusions and recommendations ..................................................................... 41
  4.1 Opportunities and obstacles to increasing local supply...............................46
  4.2 Recommendations for data collection........................................................49
References ............................................................................................................... 52
Appendices ............................................................................................................... 54
  Appendix 1 - Artisanal tuna and FAD fishing monitoring summary ...................54
  Appendix 2 - Full list of meetings held in-country .............................................55
  Appendix 3: Papua New Guinea Processor production details, 2016 and 2018 .58
  Appendix 4: Solomon Islands current and proposed processing ........................59
  Appendix 5: PNG and Solomon Islands processing output 2016 and 2018 ........60

                                                                                                                                     6   www.marinechange.com
MARINE CHANGE | MAY 2019

01.
Background                                                                                           process includes annual report cards 5 which track progress through a number of
                                                                                                     key indicators. Whilst data are being collected already in existing programmes to
Fish is vital to the food security of Pacific Island Countries, where it traditionally               monitor progress annually, there is a gap with respect to the Roadmap’s Tuna
formed a cornerstone of a healthy and balanced diet. More recently the                               Fisheries Goal 4: Food Security, a goal of increasing the supply of tuna for
consumption of processed imported foods has increased in the region, while                           domestic consumption by 40,000 tonnes across the region by 2024. To be able to
the consumption of locally produced plants and animals, including fresh fish,                        assess progress towards this goal, a baseline measurement for the year 2016 is
has decreased 2. This is contributing to the health crisis of non-communicable                       required.
diseases prevalent in many countries. In response, the Public Health Division of
the Secretariat of the Pacific Community (SPC) recommended that Pacific Island
                                                                                                     There have been recent studies and ongoing data collection efforts to determine
Countries (PICs) and territories should plan to provide access to at least 35 kg of
fish per person per year as populations continue to grow, based on the                               the availability of tuna to the local market from the processing (canning) industry
requirement of 34 - 37 kg per person 3.                                                              active in the region as well as predictions made for the increased need for tuna
                                                                                                     and tuna-like species to meet the region’s food security needs 6. Data collection
Until recently, much of the fish consumed in the Pacific Island region came from                     of artisanal catches is also improving in many countries with the use of SPC Tails
coastal fisheries, which are based mainly on lagoons and coral reefs. However,                       electronic data collection system, though in most cases only since 2017 and often
rapid population growth is creating a gap between how much fish can be                               not yet giving full national coverage of all artisanal fisheries.
harvested sustainably from coastal fisheries and the quantity of fish
recommended for good nutrition. With extensive and productive offshore tuna                          The objective of this study was to determine the availability of tuna for the local
fisheries in most EEZs, there is an urgent need to increase the availability of good                 market from locally based commercial tuna vessels (of all gear types, purse seine,
quality and affordable tuna to Pacific Island populations. The existing foreign                      longline, pole-and-line and troll) in the baseline year of 2016, and to identify
export-focussed fisheries, whilst increasingly economically beneficial to the                        trends, opportunities and obstacles to increasing that contribution towards the
region, do not currently contribute sufficiently to local food security.                             target increase of 40,000 tonnes by 2024. The Pacific Islands Forum Fisheries
                                                                                                     Agency (FFA) also requested that the report include, where obtainable, data from
In light of this, the Pacific Island Forum Fisheries Ministers developed a ‘Regional                 existing studies that contribute to the estimation of tuna and tuna-like species,
Roadmap for Sustainable Pacific Fisheries,’ which was endorsed by Forum                              and common bycatch of tuna fisheries, available to local markets for the baseline
Leaders 4. The Roadmap sets ambitious goals for a 10-year period, and the                            year, 2016.

2 Charlton, KE, et al. (2016) Fish, food security and health in Pacific Island countries and         5
                                                                                                      Fisheries Roadmap Report Cards: https://www.ffa.int/node/1569
                                                                                                     6
territories: a systematic literature review. BMC Public Health. 2016; 16: 285                         Bell JD, et all (2015). Diversifying the use of tuna to improve food security and public
3 Bell JD, et al. (2008) Planning the use of fish for food security in the Pacific. World Fish       health in Pacific Island countries and territories. Marine Policy, Volume 51, January 2015,
Centre Policy Brief 1865.                                                                            Pages 584-591
4
  FFA (2015) Regional Roadmap for Sustainable Pacific Fisheries

                                                                                                 7                                                                          www.marinechange.com
MARINE CHANGE | MAY 2019
02.
the Solomon Islands, Papua New Guinea (PNG), and Kiribati. The full list of people
interviewed in those countries is in Appendix 1.
Methodology For other countries, government representatives interviewed at WCPFC-15, FFA
economic enumerators based in-country, and additional recommended contacts
2.1 Objective were approached by e-mail with country-specific questionnaires designed to
obtain further data on the total catches, volumes of tuna going to the local
The study objective was determined as follows: Collect and compile data from market and any trends, recommendations or challenges.
fishing companies operating in FFA Pacific Island member countries on the
volume of tuna and tuna-like species7 that is landed for local consumption for a Given the serious data gaps routinely encountered, the study results include a
baseline year, preferably 2016. As far as possible, the study should indicate any considerable number of estimates based on the best available information. As far
recent changes and trends, note the views of industry on any obstacles to as possible in the timeframe available, the authors have also researched any
increasing the supply and how these could be addressed, and provide available previous surveys that may include indications towards the baseline
recommendations for ongoing monitoring and data collection. needed.
2.2. Methodology 2.3 Definitions
This study employed a variety of methods for obtaining information. A a. Tuna and tuna-like species
preliminary literature search was done, primarily using 2016 and 2017 data for The study focused on four tuna species: Skipjack tuna (Katsuwonus pelamis),
each country from their Part 1 Annual Reports to the Western and Central Pacific yellowfin tuna (Thunnus albacares), bigeye tuna (Thunnus obesus) and albacore
Fisheries Commission (WCPFC) Scientific Committee. In addition, recent country- tuna (Thunnus alalunga). Data were included, where available, for secondary
focussed or regional literature was reviewed for additional estimates of tuna tuna and tuna-like species such as swordfish (Xiphias gladius), marlin and sailfish
from the different sectors, particularly for locally based commercial fleets, the (family Istiophoridae), bullet tuna (Auxis rochei), frigate tuna (Auxis thazard) and
main focus of this study. mackerel tuna (Euthynnus affinis).
The team then conducted face-to-face interviews with government b. Bycatch
representatives of the study countries during WCPFC-15 in Hawaii. Due to the The study did not specifically assess the amount of bycatch landed, whereas
limited available budget, additional in-country research was prioritised for the some previous studies have addressed this (at least for purse seine). However,
Federated States of Micronesia (FSM), the Republic of the Marshall Islands (RMI), where available, data on the contribution of bycatch species to food security is
included. The main bycatch species considered were mahi mahi (Coryphaena
hippurus), rainbow runner (Elagatis bipinnulata), mackerel scad (Decapterus
7
Tuna fisheries by-catch also added as admissible for the local landings in this study.
8 www.marinechange.comMARINE CHANGE | MAY 2019
macarellus), wahoo (Acanthocybium solandri), and trigger fish species as well as information, such as anecdotal information, data or estimates from previous
any edible sharks retained. studies or estimates made with input from officials and experts in FFA countries.
c. Fleets covered c. Artisanal landings
The primary focus of the study is to establish a 2016 baseline for the landing of Data on artisanal landings has been drawn from national data sources, WCPFC
tuna and tuna-like species for local consumption from pole-and-line, longline and reports and the SPC data series, where available. The most complete and reliable
purse seine vessels operating from port(s) in FFA countries. Fleets covered are available source has been used, based on feedback from SPC and governments
those that land tuna in any FFA country for local consumption and are either (1) on accuracy and data gaps.
flagged to an FFA country, or (2) chartered to a domestic FFA country entity but
operating under a foreign flag. It was also agreed to include small/damaged tunas 2.5 Weather and climate considerations for the baseline year
and bycatch landed during transhipment in FFA country ports by foreign vessels
not locally based, where this contributes to domestic food security (see 2.4(b) Pacific tuna catches are known to fluctuate according to large-scale weather
below). phenomena, mainly the El Niño – Southern Oscillation (ENSO). The start of 2016
was the end of a strong El Nino during 2015, and the conditions then switched to
2.4 Additional sources of tuna to the local market La Nina, with cooler than usual tropical waters towards the end of the year. This
could have meant lower than usual catches of tuna in the eastern parts of the
This report summarises the 2016 baseline including other sources of tuna to the WCPO, and higher in the central parts around the 140 degree west meridian.
local market data where such data were available. This was done in order to Thus the baseline for 2016 could be lower than usual for some of the countries
provide a more complete 2016 estimate of the total volume. These are: and higher for others. These effects are mentioned in the individual country
accounts where such information was available. Conditions since 2016 have
a. Tuna from national processing plants entering the local market mostly been in El Nino or neutral modality.
The existing study by Bell et al. 8 (mostly based on 2014 data) has been used for
this study, as well as 2016 baseline or other newer data where available. Climate change is also known to increasingly impact both coastal and oceanic fish
catches and some recent projections have been made in regard to future tuna
availability (declines and increases) in the WCPO area9. This study and the 2016
b. Tuna entering the local market from transshipments baseline did not consider climate impacts although it is recommended that any
FFA is planning to investigate this issue in another study, so it has not been a follow up strategies are closely aligned with available projections and climate
focus of this report. However, we have included any readily available mitigation and adaptation strategies for the region.
8 9
Bell, JD et al. (2018) Realising the food security benefits of canned fish for Pacific Island Bell, JD et al, (2017). Adaptations to maintain the contributions of small-scale fisheries to
countries Marine Policy December 2018. food security in the Pacific Islands, Marine Policy 88 (2018) 303–314
9 www.marinechange.comMARINE CHANGE | MAY 2019
03.
Results
3.1 Landings from locally based tuna fishing vessels
Total landings from locally based vessels to the local market were found to be
only 4,192 tonnes. This is just 0.8% of the total catch volume of locally based
fleets in the region, which was 548,139 tonnes in 2016. This demonstrates that
currently only a very small amount of the catch is entering local supply chains
and most fish is either exported fresh or frozen, or else processed locally, e.g.
cooked loins and canned products, again mainly for export.
The countries where landings from locally based commercial fleets contribute
most to food security by retaining fish for the local market, based on our best
estimates, are the Cook Islands (95%), Samoa (33%), Tonga (25%), and Palau
(8%). For countries with the highest tuna landings overall, particularly those with
large locally based purse seine fleets, the volumes going to the local market are
very low, mostly under 0.5%. Vanuatu, Niue, Tuvalu, Tokelau and Nauru currently
do not have locally based commercial fleets landing there.
The findings for each country in 2016 are summarised in Table 1 below. Country-
specific descriptions of the sources of fish and relevant trends, opportunities and
challenges for this sector are included where available. Central Pacific Producers Limited (CPPL) fish shop, Bikenibeu, Kiribati
© Tony Lewis
10 www.marinechange.comMARINE CHANGE | MAY 2019
Table 1. Total catch and landings of tuna, tuna-like and bycatch species by locally based fleets in 2016
Unit: MT Total catch Local market vol Vessel numbers Trend Notes
MT MT and (%)
Cook Islands 202 LB LL 192 (95%) 3 LB LL LB LL down to 2 in 2018, back to 3 LB LL: Estimated 95% of all catch stays on
in 2019 local market
Federated 71,131 20 (MARINE CHANGE | MAY 2019
Unit: MT Total catch Local market vol Vessel numbers Trend Notes
MT MT and (%)
Samoa 2,372 780 (33%) 57 LB TR Alia (troll) fleet down to 49 Alia catch 100% locally landed – no
279 LB TR 279 LB TR 11 LB LL vessels, LB LL up to 12, catch to exports in 2016. LB LL 100% locally
1,325 LB LL 330 LB LL 14 LBF LL 3,110 MT, LBF LL up to 15 but landed but 75% exported, LBF LL
768 LBF LL 171 LBF LL catch down to 629 in 2017 most locally landed, 76% exported.
Solomon 52,371 774 (1%) 91 LB LL Volume sold via NFD has No data for longline, just a best
Islands 8,123 LB LL 50 LB LL 8 local PS increased steadily from 680 MT estimate
43,695 LB PS 724 LB PS & PL 2 local PL in 2014 (when established) to
553 LB PL combined over 1,000 MT in 2017 and 2018
Tokelau 0 0 0 There are no immediate plans to
establish locally based fleets
Tonga 2,763 694 (25%) 7 LBF LL Number of locally based foreign Local landing requirement as part
2,219 LBF LL 4 LB LL LL vessels down to four in 2018 of licensing conditions. Local mini
544 LB LL LL vessel being trialled in 2019
Tuvalu 0 0 0 No immediate plans for locally TV flagged LL & PS are not locally
based fleets based, occasional PS T/S in TV is not
to local market
Vanuatu 0 0 0 Possibly up to 5,000 MT to be All historical local LL fleets ceased
landed from October 2019 operations in 2014
TOTAL 556,229 4,192 (0.8%) 555
Figures are for tuna and tuna-like species and bycatch combined unless otherwise stated
* Palau National Marine Sanctuary (Palau NMS)
12 www.marinechange.comMARINE CHANGE | MAY 2019
Cook Islands Table 1.1: Cook Islands longline fleets WCPO catches in 2016
Unit: MT Locally based Other local flag Total Cook Is.
The Cook Islands commercial fleet consisted of 14 locally flagged longline vessels longline (3) longline (11) Longline (14)
in 2016, including 3 fishing and landing locally and 11 fishing mainly within the Albacore tuna 76 1,189 1,265
Cook Islands EEZ but landing in neighbouring countries. In total 77% of the
Yellowfin tuna 34 280 314
longline catch (including locally based vessels and Cook Island flagged vessels
landing in other countries) was taken in the Cook Islands’ EEZ. 10 Bigeye tuna 21 162 183
Marlin species 27 51 78
In 2016, three small (under 80 GRT) locally based and flagged longliners were Swordfish 10 13 23
being operated by one company, providing fresh filleted fish for the local market
Mahi mahi 15 3 18
with a small amount (MARINE CHANGE | MAY 2019
There are no locally based or flagged purse seine vessels in the Cook Islands, and in the galley freezer until the vessel tranships. It is against NFC company policy to
a limit of 1,250 purse seine fishing days. Prior to 2015, only the US purse seine give gifts to the boarding party, harbour pilot or other government officials. The
fleet fished there under the US Tuna Treaty. In addition to the US purse seine amounts that are given to crew are thus much less at NFC than CFC.
fleet, two Korean purse seiners were authorised to fish in 2016. The number of
fishing days remained the same in 2017, however the estimated purse seine A third FSM company, Diving Seagull, owned by the state of Yap has two purse
catch tripled, from 6,898 MT (2016) to 19,635 tonnes (2017). None of these seiners that occasionally call in Pohnpei for transshipping. Local Pohnpei
vessels land locally or transship in Cook Islands EEZ, so there is no contribution to residents who are from Yap (most of whom work for the government) said that
the local market or food security from purse seine fishing. whenever this company’s vessels come to Pohnpei the local Yapese crew give
away quantities of fish to their relatives or friends who live in Pohnpei. There is
no hard estimate of how much fish this might involve.
Federated States of Micronesia
Based on the above information it is estimated that the tuna and bycatch that is
The Federated States of Micronesia (FSM)’s locally based fleet comprised of 16
consumed locally from the locally based fleet was around 20 MT in 2016
purse seine and 25 longline vessels in 2016. Longline vessels currently do not land
consisting of an estimated 14 MT from CFC and the remainder from NFC and
any catch in FSM, while purse seine vessels are prohibited from landing their
Diving Seagull.
catch in FSM. However, gifting and crew shares of catch take place at scale and
provide the 2016 baseline for the local market contribution from locally based
fleets. Kiribati
The Caroline Fishing Company (CFC) now operates six purse seiners, five during Kiribati’s locally based longline fleet consisted of 20 Chinese and Fijian flagged
the baseline year, 2016. According to the General Manager, local crew is allowed joint venture vessels in 2016, while one Kiribati-flagged vessel operated out of
to take bycatch and damaged fish home after each trip, when available. These Fiji. Three locally flagged and based longline vessels will be added to the fleet in
volumes can be considerable, up to one MT per offloading when the vessels 2019. Longline landings occur directly to Kiribati Fish Limited (KFL) facilities in
transship in Pohnpei, though no records are kept by the company of fish given to Betio, Tarawa, where KFL primarily processes for export, however also sells lower
crew in this manner. To obtain a realistic estimate of fish given to crew, it is (C and D) grade tuna, processing offcuts (e.g. tuna heads and jaws) and longline
estimated that 20% of the company vessels’ trips unloaded elsewhere and the bycatch on the local market according to demand in various product forms. The
average amount taken by local crew is 500 kg per trip. majority of KFL’s tuna landings (around 95%) is exported and the rest goes to the
local market, while most bycatch goes to the local market. Total landing figures
FSM National Fisheries Corporation (NFC) operates locally based purse seiners were not released, however the volume of fish going to the local market, 173
and is engaged in two joint ventures (JV): Taiyo Micronesia Corporation, five tonnes in 2016, was provided. This was lower than the local market volume in
vessels, and Kasar (with Koo’s), four vessels. There were 57 FSM citizens 2015 (240 tonnes) and 2017 (204 tonnes).
employed on the nine JV vessels during the last quarter of 2018. According to the
NFC operations manager, the only fish that goes to local crew is from the last set
of a trip if the hold becomes full and local crew may get permission to store fish
14 www.marinechange.comMARINE CHANGE | MAY 2019
Table 1.2: Local supply from commercial longline vessels in Tarawa, Kiribati (MT) some bycatch, and is landed to CPPL11F12 for local sale through two retail shops.
Species 2015 2016 2017 This fish is sought-after due to its low price (90 cents per kilo) and normally sells
Tuna species 206.0 142.9 176.3 out in a matter of hours. When there is more discard tuna than the market can
Tuna-like (billfish) 28.1 17.1 18.6 absorb (for example after transshipments by the large Korean vessels) the excess
Bycatch species 5.6 12.5 9.4 is sold for animal feed13 (around 3 tonnes in 2016), as CPPL has very limited cold
TOTAL 239.7 172.5 204.2 storage capacity. Data obtained on discard and bycatch landings from purse seine
transshipments was not detailed enough to separate landings from locally based
Local market volumes may increase (though they are already demand-driven) and foreign purse seiners, so total volume of formal landings is included here.
when three new Kiribati flagged longliners owned by the Kiribati Government via Some informal ‘leakage’ from transshipments is estimated and included in
Central Pacific Producers Limited (CPPL) start fishing and landing their catch to section 3.3.
KFL. One vessel is expected to start fishing March 2019, the other two shortly
after. Table 1.3: Formal landings from transshipping vessels to CPPL in Tarawa, Kiribati
Unit: MT 2016 2017 2018
Until 2017 a number of foreign longline vessels were licensed to fish in Kiribati Discard tuna 277 155 170
waters and some landed or transshipped in Tarawa providing catch and bycatch Bycatch 118 67 73
to KFL, however in 2016 this made no contribution to food security. A longline TOTAL 395 222 243
quota system was introduced by the Government of Kiribati in 2016 and no
foreign longliners were licensed to fish in Kiribati after 2017. Legislation is being Marshall Islands
finalized in 2019 to temporarily replace the quota system with the PNA longline
Vessel Day Scheme (VDS) however as yet this is not in force and it remains to be The main source of verifiable landings for local use is the Luen Thai 14 longline
seen whether foreign longliners will return to Kiribati waters under the PNA base that handles unloading, processing and export from 34 locally based
longline VDS. longliners owned by the company. In 2017 the total unloaded tuna catch for Luen
Thai’s longline vessels was 4,067 MT, of which 53% was bigeye and 37%
Purse seine fishing licenses require local landings from transshipments occurring yellowfin. Tuna is landed fresh, graded and processed for export into fresh or
in Tarawa, however this is negotiable and managed on a case-by-case basis. frozen loins. Tuna-like species and bycatch is usually frozen whole and exported
Locally landed tuna includes damaged and undersized fish, mainly skipjack, and in freezer containers15.
12 CPPL is a fully government-owned fish trading company through the Ministry of “Local”. However, the text clarifies that "Frozen fish (rejects and bycatch), designated as
Fisheries and Marine Resources Development (MFMRD) Local, are shipped to Asia via transport containers and/or sold locally." Luen Thai indicated
13 that very little, if any, of these fish (consisting primarily of marlin and cannery-grade
The volume going to animal feed has been included as it is also contributing to local
food security yellowfin) are sold locally. The table shows a total of 657 tons in 2017, 41% was blue
14
Doing business as Marshall Islands Fishing Venture (MIFV) marlin, 31% yellowfin, with the remainder various species commonly caught and retained
15 The Marshall Islands Annual Report-Part 1 to WCPFC for 2018 contains a table 9, Total by longline.
unloaded catch (mt) for domestically based longline vessels in 2017 with a column for
15 www.marinechange.comMARINE CHANGE | MAY 2019
There are two components of supply from Luen Thai for local consumption: (1) plans to allow these vessels to transship in Nauru once the current GEF/Green
local sales, donations, and gifts, primarily consisting of loins and “naka” (loin end Climate Fund port and bunkering development project is finished in 2020/2021,
cuts) and (2) small pieces (“small meat”) extracted primarily from fish heads by with a view to making bycatch and low grade fish available for local sale. There
employees and given to them free for local sale or personal use. The company are concerns that such local sales from transshipment could impact the market
has records for local sales but not for small meat, which must be estimated. for fish from the artisanal fleet, and a policy is being developed to carefully
monitor this for any negative impacts and regulate, if necessary.
The local sales figures provided combine all forms, including whole fish, fresh and
frozen loins, and “naka” (end cuts of loins). Local sales go to restaurants and Niue
individuals. Donations are made to various government or private functions, and
gifts are sometimes given to government officials and others on special Niue does not currently have any locally based commercial fleets and it is not
occasions. clear if it is economically feasible to start these operations given the declining
catch rates of foreign licensed long liners in the Niue EEZ in recent years 16. There
Luen Thai also allows its employees to extract small pieces of meat from tuna were 13 local longline fleets operational in Niue between 2005 and 2007, with a
heads after processing and packing is concluded. Plastic bags containing about 4- local processing plant operated by Niue Fish Processors Ltd 17. It appears that the
5 kg of this small meat are taken to a roadside tent outside the Luen Thai facility operations were never profitable and were closed down as government funding
where it is sold to the general public at $5 per bag. If there is any left unsold at ceased. The fleet also suffered from bad weather due to the exposed nature of
the end of the day it is placed in the Luen Thai freezer and sold on the next the country’s only port leading to several vessels sinking and further economic
processing day. issues.
Luen Thai keeps no records on the volume of small meat sold. Employees
estimated that around 50, sometimes up to 100, bags per unloading are Palau
processed on the days that catch is unloaded. According to Luen Thai unloading
and processing takes place on an average of 10 days per month. A realistic In 2016, the locally based fleet consisted of 37 foreign owned but locally based
estimate is that around 24 MT per year of this product is sold or otherwise longliners. In 2017, this became 35 foreign owned and three locally owned
utilised locally. longline (formerly Vanuatu flag) vessels.
The landing, sorting and export of fresh fish by locally based foreign longline
Nauru vessels is regarded as transhipment by the Bureau of Marine Resources
(BMR). 1,661 tonnes of locally based fleet’s catch was otherwise exported in
There were no locally based commercial fishing vessels in Nauru in 2016. Two 2016, and 2,050 tonnes in 2017, mostly frozen to Japan. The portion of locally
locally based joint venture purse seine vessels have been active in Nauru since based fleet landings retained for local consumption has been approximately 100
July 2018, however they have not yet landed or transshipped locally. There are tonnes in recent years.
16 WCPFC (2018) Annual Report Part 1 – Niue 17 FAO Country report. http://www.fao.org/tempref/FI/DOCUMENT/fcp/en/FI_CP_NU.pdf
16 www.marinechange.comMARINE CHANGE | MAY 2019
Although not part of the 2016 baseline, the three local vessels landed an If this percentage (1.1%) was applied to the estimated 78,00 tonnes and 94,000
estimated 67 tonnes of tuna and tuna-like species in 2017. These vessels are tonnes unloaded for processing in 2016 and 2018, then around 860 tonnes and
given a discounted licence with a requirement to land locally, however most of 1,030 tonnes respectively would have been available for local consumption, as
this is believed to have been exported but with some retained for domestic well as bycatch removed during sorting of transhipments of PNG fleet fish prior
consumption. to export or returning to base for processing.
Papua New Guinea Samoa
In 2016, 36 locally based foreign (chartered) and 31 PNG purse seiners made up Samoa’s local commercial fleet includes longline and Alia catamaran vessels,
the PNG fleet of 67 vessels. The PNG local longline fishery continues to decline, which fish offshore but are considered artisanal. Alia vessels fish by trolling, but
with 15 vessels active in 2016, down from 50+ in the past. This decline in vessel may switch gears to bottom fishing or longline. For the purpose of this
numbers partly results from the closure of the shark longline fishery in 2014 and assessment, Alia catches have been included under local commercial fisheries.
more generally due to declining catch rates and deteriorating economic Coastal artisanal fishing is in lagoons or outer reefs, for subsistence and local
conditions. There was however a slight increase in vessel numbers to 22 in 2017. trade. As a result of Samoa’s significant offshore fleets, 32 kg of the 48.5 kg per
person of fish consumed annually in Samoa is pelagic species. 18
PNG’s commercial fleets primarily land their catches for export and processing,
and there are no formal marketing arrangements for the disposal of bycatch and Samoa’s Alia fleet consisted of 57 vessels in 2016. These are undecked vessels of
small/damaged tunas in PNG. The major processing plants utilise small tunas in 8 to 11m utilising mixed gear and fishing 6 to 9 nautical miles (nm) from the
their canteens as food for workers, and small amounts of other informal and coast. Their main fishing method is troll fishing (accounting for 89% of landings to
formal trade takes place. domestic markets in the 2016/17 fiscal year) with some use of longline or bottom
fishing methods. Alia vessels sometimes fish around FADs. 19 The bulk of their
Disposal of the longline catch of 1,000 - 1,400 tonnes is not well understood or catch is skipjack tuna, followed by yellowfin and mahi mahi. Catch usually goes
documented. It is assumed that most is exported but some bycatch will be straight to the local market or hotels and restaurants without processing, and
retained and sold and some discarded at sea. The amount entering local supply fishers generally have their own selling arrangements and fish to order, some
chains is estimated at 50 tonnes for the purpose of this study. also trade with other fishers. Exports of Alia catch are rare, and none occurred in
2016. Alia catch data is based on local market landings, surveyed and reported by
Less bycatch has been available from PNG’s purse seine fleet since a major shift the Samoa Ministry of Agriculture and Fisheries (MAF).
to fishing free schools in recent years. The amounts are still quite considerable
with 308 tonnes of bycatch and 184 tonnes of “bonito” from the 43,650 tonnes
exported as whole round fish (WRF) by Frabelle in 2018, or 1.1% of the total
retained catch.
18 FAO (2017) Fishery and Aquaculture Country Profiles – The Independent State of Samoa. 19 Samoa MAF (2018) b
17 www.marinechange.comMARINE CHANGE | MAY 2019
Table 1.4: Alia troll landings to Samoa’s domestic market (MT) Additionally, since 2015 foreign longliners have been authorised to fish in
Unit: MT 2016 Samoa’s EEZ. In 2016, 14 foreign longliners operated out of Samoa, taking a catch
of 768 tonnes which is landed to the Apia Deep Sea Fishing Company in Apia,
Skipjack tuna 214 where there are two loining plants operating. Albacore, the main species caught,
Yellowfin tuna 53 is exported frozen to American Samoa along with bigeye and yellowfin from the
Other pelagic species 12 last 8 sets (around half of the total). Frozen bigeye and yellowfin from earlier
sets, as well as tuna-like species (mainly marlins) and bycatch (mainly wahoo and
Total volume 279
mahi mahi) remain on the local market. In 2016, 171 MT of catch from locally
Samoa’s flagged longline fleet consisted of 11 locally based vessels in 2016, based foreign longliners went to the local market.
fishing and landing in Samoa. In 2016, the local longline fleet took 1,307 tonnes
of catch, including 1,282 tonnes of tuna and tuna-like species (mostly albacore) Table 1.6: Locally based foreign longline landings to Samoa’s local market in 2016
and 25 tonnes of bycatch (note, bycatch data is unraised). Albacore is Unit: MT Total catch Local market % Local
predominantly exported to canneries in American Samoa, while some bigeye and Albacore tuna 501MARINE CHANGE | MAY 2019
The current catch level of Samoa’s locally based fleets (alia and longliners) is In addition there is a large fleet of locally based foreign longliners that fish
substantially lower than past catch levels. Gillett (2016) compared estimates primarily for export of high-quality fish. There is no information about the sales
from the SPC’s Benefish studies in 1999, 2007 and 2014 and found locally based of their tuna and bycatch to the local market in 2016, but it is likely to be in the
offshore catches had dropped from 5,156 tonnes in 1999 to 3,755 tonnes in 2007 range of 50 tonnes annually based on the volumes fished. The practice of crew
and 1,254 tonnes in 2014. From 2014 to 2016 the number of Alia increased from clandestinely selling bycatch and small tunas from local purse seine vessels
20 to 57 while longliners declined from 13 to 11 longliners. landing in Noro for processing, was regularised in 2014, with NFD agreeing to
handle and sell the bycatch on behalf of the crew, and subsequently forming a
The 2016 locally based offshore catch (Alias and local longliners) of 1,604 MT was credit union for the purpose. Regularised sales have continued to grow since
a slight increase from 2014, but remains low compared to previous decades. Over 2016, due to increased sourcing efficiency and addition of vessels to the fleet,
the same period, the estimated increase in artisanal coastal landings from 7,379 though 2018 bycatch sales may have been slightly down because of increased
MT in 1999 to an estimated 10,000 MT in 2014 21 and the additional landing of free school fishing. The scheme seems well accepted by crew members and their
small volumes from foreign fleets is not enough to compensate for the decline in families, the main beneficiaries. Some illegal sales do still occur, in response to
locally based off-shore catch declines. the need for ready cash, but are believed to be relatively well controlled.
The Samoa Government has supported the Alia fleet with the deployment of Catches by the local purse seine fleet have been on a steady upwards trajectory
FADs in 2014 (6 deployed offshore, of which one remained in 2016), further with the addition of new larger vessels to the fleet, as may also be the case with
deployment of 20 offshore and 15 near shore FADs in the 2017/2018 fiscal year the two recent additions to the pole-and-line fleet in 2019. Apart from landings
along with the introduction of tablet-based catch monitoring from the FADs, and to SolTuna, little of the tuna catch is landed for local consumption, with the
current plans to further increase the number of FADs deployed. This represents exception of some undersize tuna. It is not expected that this will change. The
the main strategy to increase local landings from Samoa’s locally based fishing quantity of bycatch and undersize tuna sold through the formal marketing NFD
fleets. Although the quantity of local landings is good, there are issues that still structure shows steady increase from 680 tonnes when established in 2014, to
need to be addressed surrounding quality, in particular cold chain maintenance. over 1,000 tonnes in 2017 and 2018.
Table 1.7: Sales of bycatch and undersize tuna by the Solomon Islands NFD, 2016-
Solomon Islands 2018
Unit: MT 2016 2017 2018
The Solomon Islands local fleet consisted of eight purse seine vessels and two Tuna species 277 1,148 855
pole-and-line vessels in 2016, all operated by NFD with the exception of 3 Bycatch 441 316 164
Southern Seas Logistics Ltd (SSL) purse seiners. The NFD vessels provide landings Total 718 1,464 1,019
for local processing and sales that are included in detail in table 1.4. whereas the
Note: Figures are compiled from several sources and may not be totally accurate
SSL vessels are nominally required to land in the Solomon Islands, but currently
with respect to sales of undersize tunas, in which the cannery has first call at
do not do so.
short notice
21 Gillett (2016)
19 www.marinechange.comMARINE CHANGE | MAY 2019
Tokelau improved nutrition. There has been a sharp decline in the amount foreign locally
based vessels from 13 in 2013 to 7 in 2016 and it is not clear if the Tongan
There are no locally based commercial fleets or current plans to set up JVs. Any government’s ambitions to increase the fleet numbers to 10 foreign and 10 local
future commercial inshore fisheries developments need to be authorised by the is achievable.
Taupulega (Village Council) of each respective atoll and is subject to a cost-
benefit and market analysis, and an environmental impact assessment to
Tuvalu
demonstrate it will not jeopardise local food security and will result in creating
net economic gain. None of Tuvalu’s commercial tuna fishing vessels are locally based. Two
longliners fish out of Suva, Fiji and two purse seiners (one of which is currently
Tonga inactive) transship their catches in the Marshall Islands, FSM and Kiribati.
Occasional transshipment by Tuvalu-flagged vessels in Funafuti, as for
Tonga’s commercial longline fishery is currently limited by a cap on the number transshipment by foreign vessels, has little or no contribution to the local market.
of longline vessels authorised to fish within the EEZ at only 15. In 2016 the There are no foreign fleets based locally in Tuvalu and, with the exception of
licenced vessels were seven foreign flagged locally based vessels and four locally transshipment, local operations would likely be uneconomic and face problems
flagged vessels landing in Nuku'alofa. Four licences were assumed unutilised. The exporting catches.
total catch of the seven locally based foreign vessels in 2016 was 2,219 tonnes
and that of the four local vessels 544 tonnes. Both fleets exported fresh sashimi Vanuatu
grade tuna for export to Japan and the US and smaller volumes to New Zealand
and Australia. The volume sold at the local market in 2016, was 329 tonnes Despite locally flagged vessels being active in Vanuatu’s EEZ, in 2016 there were
(foreign vessels) and 366 tonnes (local), mainly mahi mahi, skipjack, small no locally based charter or national vessels landing in Vanuatu. However there
albacore and other tuna or damaged fish. The foreign fleet landed 15% of their are plans for 13 vessels to start landing at a China National Fishing Corporation
catch locally and the local vessels 67% of their total catch. (CNFC) facility on the outskirts of Port Vila in October 2019. This might increase
to 16-20 vessels within a year, with total landed amounts expected to be in the
Since 2016, a government scheme (for Nukualofa only) has made it a condition of vicinity of 5,000 tonnes. This is part of the government's policy on locally based
foreign longline licenses to supply a minimum of 3 tonnes per vessel landing vessels that pay lower access fees to obtain more fish for the local market and
(once per 1-2 months) to the government to be sold at discounted rates. The increase onshore economic activity 22. There will be an additional 5% levy on
money (gross return) goes back to the foreign company. Discount prices range exports. There is also a government plan to set up a local market outlet at the
from 2.5 pa’anga for skipjack up to 8 pa’anga for larger tunas and 9 pa’anga for facility to sell low grade tuna and bycatch locally. At the time of research it was
swordfish. Normal market prices are higher, 12-18 pa’anga. Local vessel owners not clear if the plant operator would do this directly or if it would be a
support the scheme, as it doesn’t impact their sales or pricing due to only government facility (tax free).
occasional availability. The objective of the policy is for food security and
22Daily Post Vanuatu, 8 March 2019, http://dailypost.vu/news/fish-processing-plant-
operating-in-october/article_e5d8402e-06f1-5b4e-9019-c26e33afaa95.html
20 www.marinechange.comMARINE CHANGE | MAY 2019
3.2 Tuna available to the local market from canning Table 2: 2016 baseline for local sales of canned tuna
A recent study by Bell et al (2016) 23 provided an estimate for 2014 for the Country Local sales Trend Gaps/ notes
availability of canned tuna and especially “dark meat”, which is a lower value by- (MT)
product of the process of cleaning cooked tuna loins for canning, popular in the PNG 3,086 Volume increased to 3,130 MT in 2018. Almost all dark
Approximately 78,000 MT of tuna was meat
Melanesian region. The canned tuna annual consumption in 2014 was estimated
processed in PNG plants in 2016 but (recovery
to range from 2,600 tonnes (Fiji), through 3,000 tonnes (Solomon Islands) to
landings are increasing (94,000 MT in approximately
3,300 tonnes (PNG) – which would be equivalent to 24,000 tonnes of whole tuna 2018 and expected to increase 6%)
in total 24 at a recovery rate to 40%, were all portions of the fish were processed further).
for local sale. However, as most of the light meat is processed as cooked loins or Bell et al (2016) estimated this as 3,300
canned for export, and mostly just the dark meat retained for canning for local tonnes in 2014, which would suggest a
sales which is recovered at approximately 6%, these figures are not accurate as slight decrease but studies are not
an estimate of the amount of fish processed to generate the local sales, but directly comparable.
rather provide an estimate of the minimum amount needed to generate the local Solomon 2,334 SolTuna dark meat domestic sales have ⅔ dark meat
sales of mostly dark meat. Islands increased by nearly 8% and exports to (6% recovery)
neighboring MSG countries increased
As this is a high-demand product in the region and the volume of production is by 42% from 2016 to 2018. ⅓ light flakes
Bell et al (2016) estimated this as 3,000 (40%
steadily increasing, this study also attempted to determine a more recent 2016
MT in 2014, which indicates a decrease recovery)
baseline volume of canned tuna on the local market. The summary results of this
but studies are not directly
2016 baseline 25 and more specific country descriptions for PNG and the Solomon
comparable.
Islands are included below (Fiji was addressed in a separate FFA study). Total 5,420
It is noted that the industry reports its production as net weights or cases, which
are poorly convertible to whole round equivalents of weight and leaves room for
uncertainty, due to commercial sensitivity, in different studies trying to interpret
this data. For the purposes of assessing the contribution to food security, it may
be more sensible for FFA to monitor the processed volume available for
consumption, which would simplify data collection.
23
Bell, JD et al. (2018) Realising the food security benefits of canned fish for Pacific Island 25 The following conversion is used to obtain the total volume of product from the
countries Marine Policy December 2018. canning information. Number of cases = nett weight (cans) x 110 [nett weight = meat in
24
FFA scorecard can plus water/oil/additives but excluding container and packaging]
shttps://www.ffa.int/system/files/Tuna%20Fishery%20Report%20Card%202018%20FINAL To get weight of meat in cans (red or light) multiply net weight by 0.40 (rounded)
_2.pdf
21 www.marinechange.comMARINE CHANGE | MAY 2019
Papua New Guinea figure of 8,250 tonnes if all of the fish is processed for local sales. Given this, dark
meat is possibly the most likely source of potential domestic consumption
There are six tuna canneries currently operating in PNG. They mainly contribute increase in PNG. This will require increased landings and continued strong local
to the availability of tuna locally through sales of their (mostly) dark meat demand to eventuate, but will have been helped by the recent increase in duty
products. Canning of dark meat flakes by PNG processors has been an important on competing imported products.
output of processing operations since their inception, given the strong local
demand for cheaper strong flavoured packs in oil. Solomon Islands
Local fish supply has not always been able to meet demand, and there is strong Whilst there are other proposed and notional processing facility plans in the
competition from dutiable imported products, in the case of tuna mostly from Solomon Islands, the SolTuna plant in Noro is the only one currently operating.
Thailand (Ocean Blue). Canned mackerel supplies a very large complementary The production details of SolTuna are included in table 2.1 below and more
market and has also been facing competition from Chinese imports but a recent details in Appendix 3. Southern Seas Logistics Limited (SSL) continues to fish but a
increase in import duty (see below) may turn this around. proposed small cannery has not eventuated and the fish is not locally landed
despite a nominal requirement to do so.
Dark meat may also be imported by processors to meet the domestic demand, as
well as finished product from the Philippines in earlier years. A recent Details of SolTuna overall production for 2016-2018 are given below, with all
government decision has seen the import duty on canned imports (tuna and figures showing steady increase. The local sales were equivalent to
mackerel HS 1604/05) rise from 12.5% to 25%, which should assist local sales approximately 2,300 tonnes, of which ⅓ was light meat and ⅔ dark meat.
once inventories have been run down.
Table 2.1: Domestic sales and exports of SolTuna 2016-218
Five of the six processors intend to increase production of dark meat flake packs
whilst the sixth (South Seas Tuna Corporation in Wewak) is now a loin-only Unit: cases Domestic sales Export sales Total sales
operation but it supplies a large amount of dark meat to other processors. Import 2016 642,140 87,693 729,832
duties on dark meat remain unchanged but supplies of local dark meat may be 2017 646,882 138,916 785,798
increasing as the pack mix shifts more towards cooked loins in most canneries.
2018 691,391 159,959 851,349
The total production and local consumption data for recent years is given by The long-standing domestic market for mostly dark meat flake oil packs
processor, where available, in Appendix 2. Based on these figures, approximately continues and comprises around two thirds of the domestic canned tuna market
3,000 tonnes of dark meat is now being packed and this is expected to increase, supplied by SolTuna, with light meat flakes and chunks in oil making up the
with increased import tax on previously strongly competitive products, and remainder. SolTuna’s dark meat domestic sales have increased by nearly 8%
strong local demand. This may be equivalent to around 50,000 tonnes of whole between 2016 and 2018. Exports to neighbouring mostly MSG countries (PNG,
fish maximum, based on a 6% recovery of dark meat from whole fish, which Vanuatu, Fiji) are expanding at an even faster rate, 42%. As long as the Solomon
could be regarded as wholly or partially processed and consumed, or the lower Islands domestic catches are on trajectory to increase it is likely this trend will
continue.
22 www.marinechange.comYou can also read


