The BikeNet Mobile Sensing System for Cyclist Experience Mapping
←
→
Page content transcription
If your browser does not render page correctly, please read the page content below
The BikeNet Mobile Sensing System
                                            for Cyclist Experience Mapping
          S. B. Eisenman,† E. Miluzzo,∗ N. D. Lane,∗ R. A. Peterson,∗ G-S. Ahn,† A. T. Campbell∗
                      ∗ Computer        Science, Dartmouth College, {campbell,miluzzo,niclane,rapjr}@cs.dartmouth.edu
                               † Electrical  Engineering, Columbia University, {ahngang,shane}@ee.columbia.edu

Abstract                                                                                    provide simple inferences such as distance traveled and
    We describe our experiences deploying BikeNet, an ex-                                   calories burned. These systems have become increasingly
tensible mobile sensing system for cyclist experience map-                                  more sophisticated and miniaturized. This trend is contin-
ping leveraging opportunistic sensor networking principles                                  uing and bicycles in the future will be sold with embedded
and techniques. BikeNet represents a multifaceted sensing                                   fitness/performance-related sensing systems. However, the
system and explores personal, bicycle, and environmental                                    data collected by current systems fails to capture a more
sensing using dynamically role-assigned bike area network-                                  comprehensive picture of the cyclist experience. Among
ing based on customized Moteiv Tmote Invent motes and                                       recreational cyclists there is a spread in the level of inter-
sensor-enabled Nokia N80 mobile phones. We investigate                                      est about various characteristics of a ride. Some are com-
real-time and delay-tolerant uploading of data via a num-                                   petitive with their friends for the sake of bragging rights,
ber of sensor access points (SAPs) to a networked reposi-                                   and may want to initiate challenges to set up virtual com-
tory. Among bicycles that rendezvous en route we explore                                    petitions among geographically separated cyclists; some fo-
inter-bicycle networking via data muling. The repository                                    cus on health-related aspects such as personal fitness; many
provides a cyclist with data archival, retrieval, and visual-                               view bicycling as a time to relax while getting some moder-
ization services. BikeNet promotes the social networking of                                 ate exercise and are most interested in finding routes that are
the cycling community through the provision of a web por-                                   safe and quiet; others want to simply archive statistics about
tal that facilitates back end sharing of real-time and archived                             their rides for later analysis [5]. In this paper, we design
cycling-related data from the repository. We present: a de-                                 and implement the prototype of a system not only to give
scription and prototype implementation of the system archi-                                 context to the cyclist performance as part of a user-targeted
tecture, an evaluation of sensing and inference that quantifies                             application (e.g., health and safety), but also to collect envi-
cyclist performance and the cyclist environment; a report on                                ronmental data as part of communal projects (e.g., pollution
networking performance in an environment characterized by                                   monitoring/mapping). We quantify aspects of cycling per-
bicycle mobility and human unpredictability; and a descrip-                                 formance and environmental conditions that the mainstream
tion of BikeNet system user interfaces. Visit [4] to see how                                recreational cyclist can appreciate and afford, akin to the
the BikeNet system visualizes a user’s rides.                                               Nike+iPod kit, a system [6] for recreational runners that logs
                                                                                            exercise history.
Categories and Subject Descriptors: C.2.1 [Network Ar-                                          BikeNet represents the first working mobile networked
chitecture and Design]: Wireless Communications; J.3 [Life                                  sensing system for bikes. Contributions of our work include:
and Medical Sciences]: Health.
                                                                                            • Disconnected Operation. BikeNet utilizes an opportunis-
General Terms: Design, Experimentation, Performance.
                                                                                            tic networking paradigm, whereby mobile sensing platforms
Keywords: Applications, Bicycling, Recreation, Systems.                                     are tasked and data is muled or uploaded according to the
                                                                                            opportunities that arise as a result of the uncontrolled mo-
1 Introduction                                                                              bility of the cyclists. The BikeNet system operates in a de-
   There is substantial interest in the mainstream recre-                                   lay tolerant sensing mode by default, where cyclists go on
ational cycling community in collecting data quantifying                                    trips, collect sensed data, and upload their data when they
various aspects of the cycling experience, mirroring the                                    return to home, possibly using the assistance of data mules
broader interest in fitness metrics among exercise enthusiasts                              (as discussed in Section 2.2.3). This default mode is akin to
and other health conscious individuals. Existing commer-                                    the Nike+iPod [6] sensing system for runners. In this case,
cial bike-sensing systems targeting this demographic mea-                                   BikeNet represents a pure delay tolerant mote-based solu-
sure and display simple data such as wheel speed, and                                       tion. However, if the cyclist carries a cell phone (such as the
                                                                                            Nokia N80 in our implementation) BikeNet automatically in-
                                                                                            tegrates the cell phone into the system as a mobile sensor
                                                                                            gateway (i.e., a mobile sensor access point (SAP)) and offers
                                                                                            real-time interaction between the back end and the cyclist in
Permission to make digital or hard copies of all or part of this work for personal or       support of real-time sensing.
classroom use is granted without fee provided that copies are not made or distributed
for profit or commercial advantage and that copies bear this notice and the full citation   • Cyclist Performance/Fitness Measurement. The system
on the first page. To copy otherwise, to republish, to post on servers or to redistribute   collects and stores data about the following baseline cycling
to lists, requires prior specific permission and/or a fee.
SenSys’07, November 6–9, 2007, Sydney, Australia.                                           performance metrics: current speed, average speed, distance
Copyright 2007 ACM 1-59593-763-6/07/0011 ...$5.00                                           traveled, calories burned. In addition, the system collects and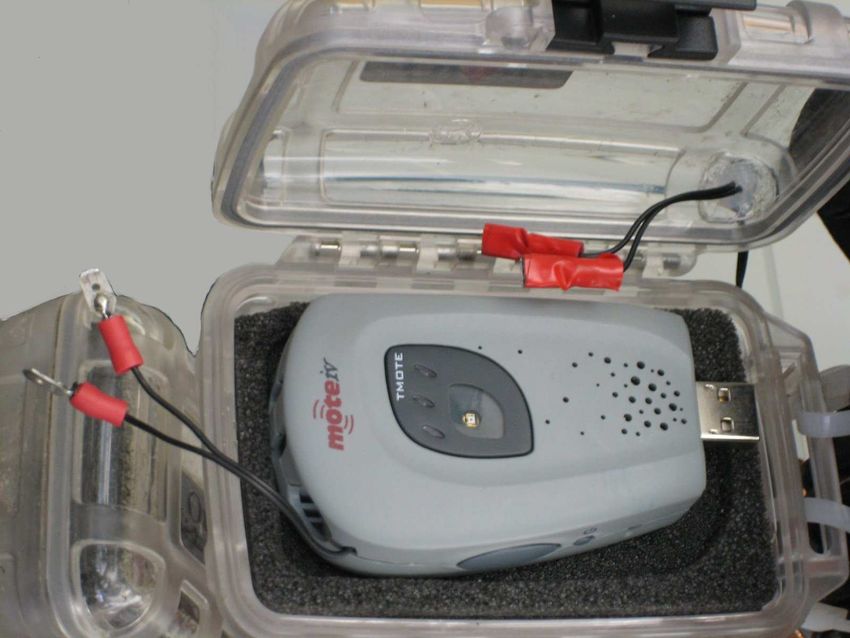
stores the following advanced metrics: path incline, heart                                              Static
                                                                                                         SAP               Static
                                                                                                                                     Static
                                                                                                                                      SAP
rate, galvanic skin response (a simple indicator of emotional                                                               SAP
                                                                    Client BikeNet Portal         (tasking)
excitement or stress level). All data sensed by the system is                                                                                 (uploading)
at least stamped with time and location metadata.
                                                                                       Internet                                      Sensors
• Environment/Experience Mapping. The system pro-
vides quantitative guidance to cyclists about the healthiness
of a given route in terms of pollution levels, allergen levels,     Back End Servers                  GSM/GPRS   Mobile    Sensors
                                                                                                                 SAP                 (muling)
noise levels, and roughness of the terrain. These measure-                                                         (uploading)
ments, together with data from cyclist performance measure-
ments, are correlated to create a holistic picture of the cycling   Figure 1: BikeNet System Overview. Sensors collect cyclist and
experience. This environmental data is also provided to the         environmental data along the route. Application tasking and sensed
larger community.                                                   data uploading occurs when the sensors come within radio range
                                                                    of a static sensor access point (SAP) or via a mobile SAP along the
• Long Term Performance Trend Analysis. Collected data              route. Sensed data muling can occur when cyclists come within mu-
persists beyond the ride on which it is collected. The system       tual radio range. We collect data about the cyclist (heart rate, gal-
enables the upload of data traces into a personal repository        vanic skin response), about the cyclist’s performance (wheel speed,
that can be selectively shared with other individuals, or into      pedaling cadence, frame tilt, frame lateral tilt, magnetic heading),
a public database. The data is archived in such a way as to         and about the cyclist’s surroundings (sound level, carbon dioxide
facilitate spatio-temporal trend analysis.                          level, cars).

• Data Collection and Local Presentation. BikeNet allows
the cyclist to customize, via a profile of preferences, what        tions and provides coordination between people-centric mo-
data is collected by the system, when it is collected, where        bile sensors, static sensors (e.g., [27]) and edge wireless ac-
it is collected, and under what correlated conditions sensor        cess nodes (i.e., SAPs) in support of sensing, tasking, and
data capture occurs (e.g., increase the sampling rate of the        data collection. Figure 1 shows a pictorial overview of the
heart rate when the path incline is above a threshold). The         BikeNet system. Details of a prototype implementation are
profile also indicates how data is to be presented, both lo-        included to make the architecture and design descriptions
cally (e.g., on a handle bar-mounted cell phone LCD) on the         more concrete.
bicycle when en route and through access and presentation
methods once the data has been delivered to the back end            2.1 Hardware
repository.                                                             The BikeNet system hardware is organized into three
                                                                    tiers, the back end server tier, the sensor access point (SAP)
• Data Query and Remote Presentation. The system pro-               tier and the mobile sensor tier. In the following, we discuss
vides a web-based portal [4] on the back end as a means to          the design and implementation of each tier, along with infor-
inject queries into the system to request particular bicycling-     mation on ruggedizing and calibration of the hardware.
related data of interest to the back end system user. Also,
                                                                    2.1.1 Mobile Sensor Tier
the portal can be used as a place to publish/share data with
friends/competitors about themselves and the paths they tra-            The mobile sensor tier incorporates a number of bicycle-
                                                                    mounted and human-mounted Moteiv Tmote Invent [8] mo-
verse for real-time or delayed display. In so doing, we pro-
vide a useful tool to network members of the cycling com-           bile sensing platforms. Together these sensors gather data
munity through data of mutual interest.                             concerning cycling performance, cyclist health and fitness,
                                                                    and the environment surrounding the cyclists’ routes. The
    In the following sections, we describe our experiences de-
                                                                    Tmote Invents mounted to a particular bicycle, along with
ploying a sensing system for cyclist experience mapping,
                                                                    those mounted to the human riding the particular bicycle,
leveraging opportunistic sensor networking principles and
                                                                    constitute a BAN. Intra-BAN communication occurs via
techniques [22]. We discuss the system architecture, de-
                                                                    short range IEEE 802.15.4 radio. The BAN architecture is
sign, and implementation in Section 2. Section 3 describes
                                                                    designed in a modular way such that sensing components can
our cyclist experience mapping application, including sens-
                                                                    be added or subtracted simply according to user preferences
ing accuracy and inference techniques, communication pro-
                                                                    (dynamically) set in software. Figure 2 shows a logical rep-
tocol performance, and feasibility results. Related work is
                                                                    resentation of the bicycle area network (BAN), and Figure 3
discussed in Section 4 before concluding with a summary
                                                                    shows a prototype sensor-enabled bicycle.
and a discussion of possible extensions in Section 5.
                                                                        We use the native sensors provided by the Tmote Invent: a
2 System Architecture and Design                                    two axis accelerometer, a thermistor, a photodiode, and a mi-
   BikeNet is a network characterized by mobile sensing             crophone. We also interface a number of additional sensors
and sparse radio network connectivity. Given these char-            to the Invent. We process the accelerometer data to measure
acteristics, and the application requirements for the sys-          the angle of incline, and lateral tilt of the bicycle. To measure
tem, we design the BikeNet system as an instantiation of            the angular velocity of the wheel and pedal, forward speed,
the architecture presented in [22]. The architecture offers         and distance traveled, we attach a magnet-triggered reed re-
a people-centric paradigm for large-scale sensing at the edge       lay mounted across the Invent’s user button. Every time the
of the Internet using an opportunistic sensor networking ap-        relay closes (every pedal/wheel rotation) a TinyOS [11] in-
proach. This approach leverages mobility-enabled interac-           terrupt event is generated. To measure direction and devia-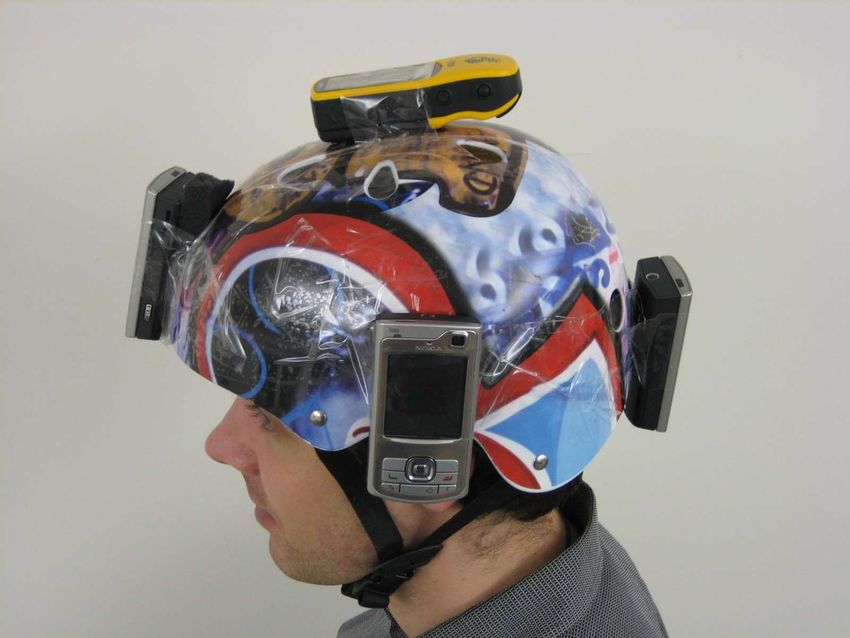
(03) Pedal Speed

    (02) Magnetometer                 (04) Inclinometer

                                                                                   GSM/GPRS
(01) Microphone                               (05) 802.15.4/Bluetooth

                                                                    Bluetooth       IEEE 802.11
                           BAN
                        (IEEE 802.15.4)        (06) Lateral Tilt
  (11) GPS
                                                                           (08) Mobile Phone
                                                                             − Camera
                                                                             − Display
                                          (07) GSR Stress Monitor            − Speaker
     (10) CO 2meter
                                                                             − Microphone

                  (09) Speedometer/Odometer

Figure 2: Logical representation of bicycle area networking. Sen-
sors share a common IEEE 802.15.4 channel. A mobile phone plays
a dual architectural role depending on whether its cellular radio is
active/connected. If connected to the cellular back end the mobile
phone acts as a mobile sensor access point (SAP) facilitating real-                               Figure 3: Physical implementation of the BikeNet system. Num-
time sensing; else it acts as a local member of a BAN engaged in                                  bered sensors installed on the bicycle map to the sensor types la-
delay tolerant sensing.                                                                           beled in the logical BAN representation in Figure 2.

tion with respect to the Earth’s magnetic field, we add a dual                                    and use a data service over a wide area radio access network
axis magneto-inductive sensor (Honeywell HMC1052L) by                                             to provide connectivity to the back end (e.g., mobile phone
connecting the sensor output to two ADC channels on the In-                                       with GSM/GPRS). We study both tasking and uploading via
vent and connecting a free I/O pin from the Invent’s MSP430                                       both static and mobile SAPs in our implementation. SAPs
microcontroller configured as output to act as a digital con-                                     are also equipped with sensors to provide context and vali-
trol line. We further process the magnetometer data for use                                       dation for uploaded data.
as a metal detector, and in particular for automobile detec-
tion. To provide a common notion of absolute time and lo-                                            The static SAP is implemented using an unmodified
                                                                                                  Tmote Invent plugged into the USB port of an Aruba AP-
cation within a BAN, we connect a Garmin Etrex 12 channel
                                                                                                  70 IEEE 802.11a/b/g access point. The Aruba is running a
GPS unit (Figure 4(b)) via the UART0 port of the Tmote
Invent’s MSP430. The Garmin Etrex provides time and lo-                                           customized version of OpenWRT, an embedded Linux vari-
                                                                                                  ant. The BikeNet SAP is implemented as an overlay of tools
cation data at the fixed rate of once per two seconds via its
                                                                                                  requiring only user privileges. Certain kernel module sup-
RS232 interface. To measure the carbon dioxide levels in the
environment surrounding the cyclist, we interface the stan-                                       port is needed; modules are loaded at run time if necessary.
                                                                                                  The tools distribution is cleanly encapsulated in a single tar-
dard Tmote Invent with the Telaire 7001 CO2 /Temperature
                                                                                                  ball making symbiotic deployment of a BikeNet SAP on to
Monitor, via an ADC port of the Tmote Invent’s MSP430.
To measure the galvanic skin response of the cyclist, we use                                      a standard WiFi access point easy to manage. The mobile
                                                                                                  SAP is implemented using a Nokia N80 paired to a cus-
an ArcherKit Biofeedback Monitor connected to a Tmote In-
                                                                                                  tom built Bluetooth/802.15.4 gateway via its Bluetooth ra-
vent. Wires connected to the fingers of the cyclist measure
epidermal microcurrents.                                                                          dio. The N80 SymbianOS uses a serial device emulation of
                                                                                                  the Bluetooth SPP profile to read and write from the Blue-
   The Tmote Invents and external sensors are powered us-                                         tooth/802.15.4 gateway. The back end interface of the SAP
ing rechargeable batteries in our prototype. A commercial
                                                                                                  uses GSM/GPRS to the BikeNet repository and back end ser-
implementation could leverage ongoing work in energy har-                                         vices. This is done with a combination of SMS messages
vesting (particularly from pedaling and frame vibration) to                                       from the back end pushed to the phone, and TCP connec-
reduce the need for external recharging. This is outside the
                                                                                                  tions initiated by the N80 to transmit responses to a back
scope of the current work.                                                                        end server that translates data uploads to SQL commands to
2.1.2 SAP Tier                                                                                    insert data into the repository.
   The SAP tier offers high performance, high reliability,                                           The use of a personal device like a cell phone as a mo-
and secure gateway access from the sensor tier to the back                                        bile SAP gives rise to an interesting dual role for the N80
end servers. This access allows sensed data to flow to the                                        in our system. Architecturally, there is a clean separation
system repositories, and provides a point of command for the                                      between SAP and sensor tiers, but in the case of a mobile
architecture to task available sensors with user application                                      phone owned by the cyclist the BAN to which the cyclist
requests/queries. When possible, these gateways are sym-                                          belongs may have continuous access to the SAP services
biotically implemented on the back of existing network in-                                        and resources whenever GPRS service is available. A mo-
frastructure by plugging a short range radio module into the                                      bile phone thus plays a dual architectural role depending on
existing network element (e.g., IEEE 802.11 access point),                                        whether its cellular radio is active/connected. If connected to
allowing it to communicate with the sensor tier. SAPs can                                         the cellular back end the mobile phone acts as a mobile SAP
be static and wired directly to the Internet, or can be mobile                                    facilitating real-time sensing; else it acts as a local member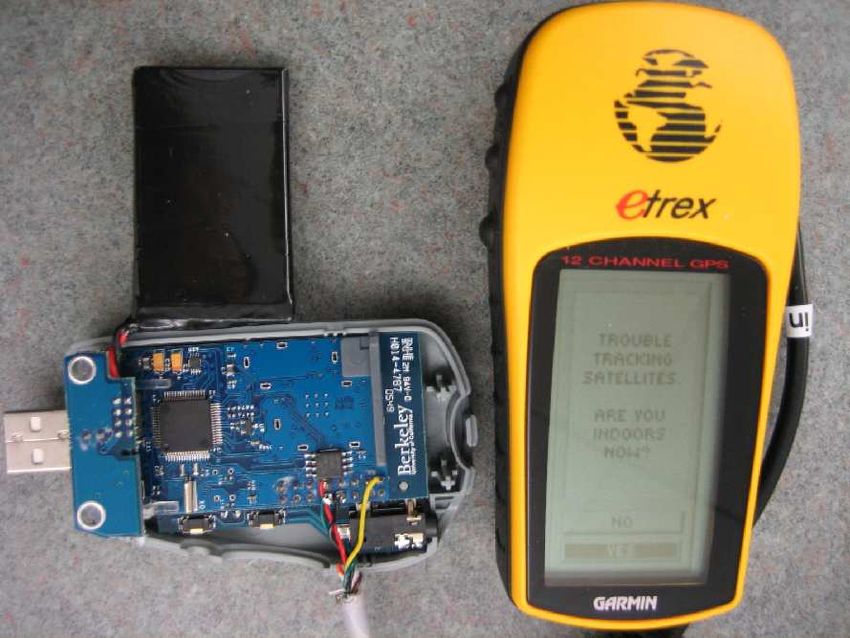
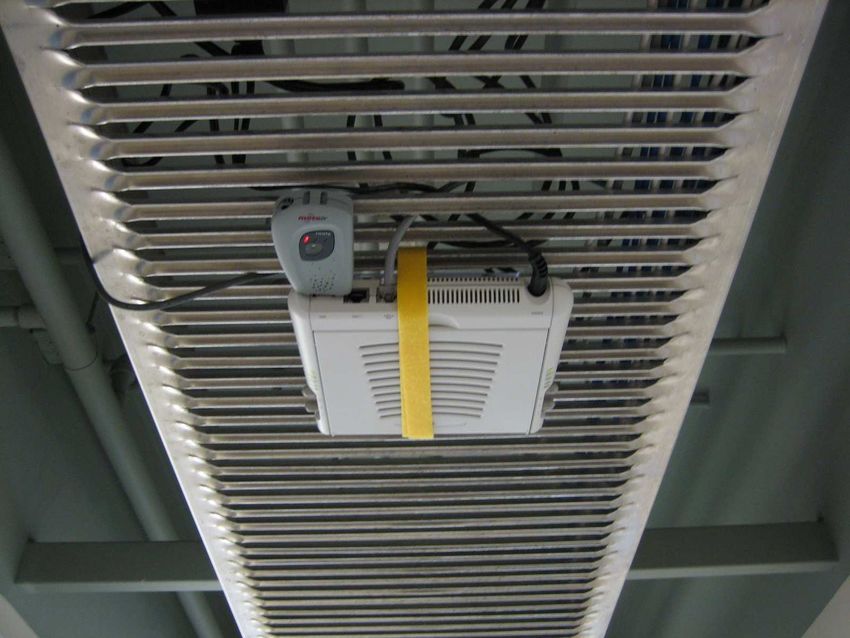
(a) A two-axis magnetometer is attached to (b) An external GPS unit is attached to a (c) A BikeNet static SAP is a WiFi AP with
   a Tmote Invent via its ADC.                Tmote Invent via its UART0 port.          an Invent inserted in the USB port.

   (d) Waterproof OtterBox. Wires are fed (e) Ground truth video/sound/photo helmet (f) BikeNet mobile SAP implementation.
   through drilled holes that are then filled with with four N80s and GPS receiver, only for The Nokia N80 Bluetooth radio associates
   silicone sealant. Wires have crimped con- use in debugging our system and validating with a custom-built Bluetooth/802.15.4
   nectors for easy disconnect.                    our inference techniques.                 gateway.
                                                                     Figure 4

of a BAN engaged in delay tolerant sensing. GPRS pric-                 the bicycle frame, using a system of steel mounting bars and
ing and performance also comes into play when using the                steel hose clamps, since bicycling implies often severe vibra-
cell phone as a SAP, but we set aside this problem for future          tion and jolting. The OtterBoxes are screwed to these mount-
work.                                                                  ing bars and the screw holes are sealed with silicone gel.
2.1.3 Server Tier                                                      In determining the geometry and placement of the mounting
   Members of the back end are Ethernet-connected servers              bars we have attempted to minimize vibration and unwanted
equipped with practically unbounded storage and computa-               degrees of freedom for the sensors (a picture of a sensor-
tional power. These provide a number of services to the ar-            enabled bicycle appears in Figure 3).
chitecture, some of which are described in Section 2.2.6. In           2.1.5 Calibration/Validation
particular, it is to the back end servers that system users con-          Despite efforts to mount the accelerometers at perfect
nect to submit application requests/queries for execution in           right angles (in two dimensions) with the ground, we find
the sensor tier, and to retrieve and visualize sensed data.            that calibration is required for each bicycle in order to cor-
2.1.4 Ruggedizing the Hardware                                         rectly understand the measured values. Even if the error an-
   Because of the outdoor nature of the BikeNet testbed we             gle of the mounting bracket is small it can lead to a large
take steps to protect the Tmote Invents from the weather               skew in the calculated slope, because of the non-linear na-
(e.g., rain, snow) by enclosing each in an OtterBox 1600               ture of the inverse tangent function used to calculate the
Case. The OtterBox comes with adhesive foam that is cus-               slope. Stationary calibration is done in the lab by matching
tomizable to a degree that allows us to secure the Tmote In-           the bicycle-mounted accelerometer outputs against a set of
vents inside the cases without any slipping. A number of               known inclines to derive a calibration curve for each device.
sensors require running wires from the Tmote Invent out of             To validate this static calibration in the field, we manual mea-
the OtterBox to other places on bicycle or cyclist (e.g., the          sure a 0.75km section of the road containing slopes from 0 to
WheelSensor’s reed relay is wired to the front fork of the bi-         7 degrees using a laser level (model TUV EPT-97A, 650nm)
cycle). For these we drill holes through the OtterBox 1600             at 30m intervals. We receive excellent correlation between
and fill the holes with silicone gel after passing through the         manual measurements and those made using the accelerom-
wires to maintain waterproofing. We cut the wires inside               eter (the TiltSensor role).
the box and crimp/solder on connectors (see Figure 4(d)) to               We find that calibration is also necessary for the magneto-
allow a quick disconnect of the Tmote Invents for recharg-             inductive sensors due to the steel frame of the bicycle, and
ing. Additionally, the Otterbox cases are securely fastened to         the steel mounting bars. This is done by executing a hard/soft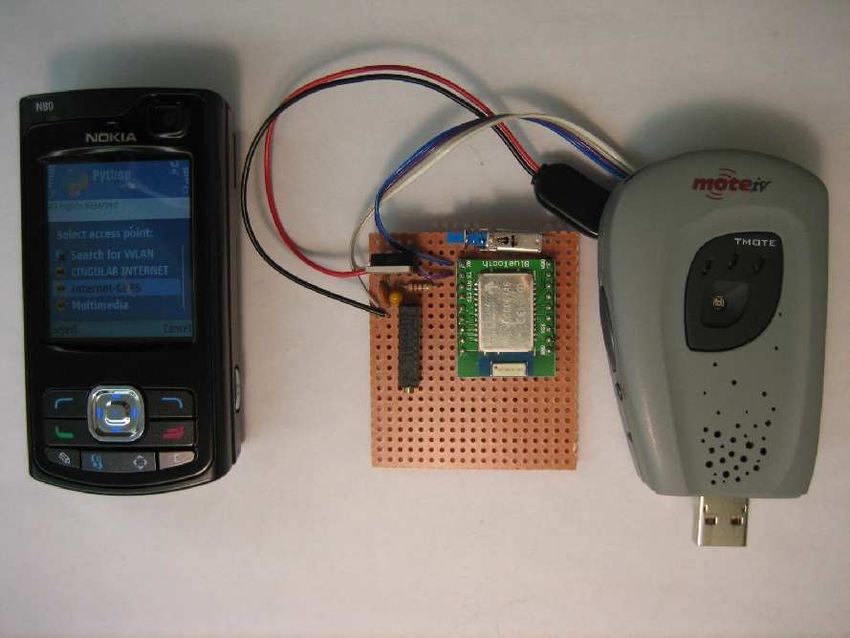
iron calibration [28] for each bicycle, and adding the correc-                     BAN Hardware                        BAN Roles
tion for the magnetic declination of Hanover, NH, USA.             Invent                                             PersonalNode
                                                                   Invent using its accelerometer                      TiltSensor
   We infer cyclist fitness level using a combination of the       Invent using its accelerometer                    LateralTiltSensor
lateral tilt, slope, and pedal speed to wheel speed ratio. To      Invent using its microphone                        SoundSensor
check our inference technique against a more direct physio-        Invent + magnetometer                       MetalDetector, CompassSensor
logical measure of cyclist fitness, we use the Garmin Fore-        Invent + reed relay mounted on pedal                PedalSensor
runner 301 Heart Rate Monitor/GPS. A positive correlation          Invent + reed relay mounted on wheel               WheelSensor
                                                                   Invent + GPS                                       SyncSprinkler
between our inferred cyclist fitness level, and that indicated
                                                                   Invent + 802.15.4/BlueTooth Gateway + N80    CameraSensor, LocalDisplay
by the actual cyclist heart rate validates our technique.          Invent + CO 2 meter                                 CO 2Sensor
   To provide richer context for the sensor measurements
and inference we do in BikeNet, we attach four Nokia N80
                                                                     Figure 6: Mapping between BAN hardware and logical roles.
phones on a bicycle helmet, i.e., facing front, back, left and
right (see Figure 4(e)). Using continuous video capture (both
visual and audio) throughout the ride we are able to validate
that events sensed/inferred by BAN sensors are at least rea-      the carbon dioxide content in the atmosphere surrounding
sonable/probable and depending on the measurement type            the bicycle, allowing the system to infer whether the cyclist
we can definitively validate the data (e.g., car passing the      is passing through an urban area (more CO2 from auto ex-
bike or not).                                                     haust) or a rural area (less CO2 due to plant respiration). The
   To validate detection-based inferences, we use a standard      SoundSensor role measures the volume of noise in the envi-
Tmote Invent programmed to write the (time, location) 2-          ronment surrounding the cyclist, and is used for voice trig-
tuple to the Flash every time the user button on the Tmote        gered sensing and audio annotation of a cyclist’s ride. The
Invent is clicked. We term this the ButtonMote for ease of        CameraSensor role provides triggered capture of an image,
reference. For example, in testing the MetalDetector (Sec-        or a video clip of specified duration. The PersonalNode role
tion 3.1.1) we manually click the ButtonMote user button          provides control via short range radio over the other sensing
every time we pass a parked or moving automobile or an au-        roles, including executing user preferences within the BAN
tomobile passes us, and compare the time/location-aligned         (e.g., required sensors, sampling parametrization), and sig-
MetalDetector trace with the ButtonMote trace to determine        naling the start and stop of a cycling trip. Each cyclist nec-
detection accuracy.                                               essarily possesses a PersonalNode, but all other roles are op-
                                                                  tional, depending on the sensing preferences of the cyclist.
2.2 Software                                                      Figure 6 shows the mapping between BikeNet roles and the
   Figures 5(a), 5(b) and 5(c) show how the BikeNet soft-         sensing hardware, where each row represents a different (set
ware system maps to the three tier hardware architecture,         of) devices on a fully equipped prototype bicycle.
respectively defining the mobile sensor, SAP and back end
                                                                      We assume that each cyclist possesses a mobile personal
software sub-architectures. In our implementation, commu-
                                                                  computing device (e.g., Tmote Invent, Nokia N80, radio-
nication between the SAP and back end sub-architectures is
                                                                  equipped Apple iPod) at all times that can be tasked by
via either a TCP/IP stack (for static SAPs) or a GPRS/GSM
                                                                  the SAP to take on the PersonalNode role. In our proto-
stack (for mobile SAPs). Primary software elements are dis-
                                                                  type system, each cyclist carries a Tmote Invent preconfig-
cussed in the following.
                                                                  ured with the PersonalNode role. The PersonalNode role
2.2.1 BikeNet Role Assignment                                     includes a list of user preferences that dictate what addi-
    For purposes of modularity the functional requirements        tional sensing roles are desired to quantify the cyclist fit-
within a BAN are divided into logical roles. The PedalSen-        ness/performance/environment. These sensing roles are split
sor and WheelSensor roles measure the angular velocity of         into two lists, required and preferred, that are included into
the pedal and front wheel, respectively. From these the cur-      a hello beacon periodically broadcast by the PersonalNode.
rent and average speed, distance traveled, pedaling cadence       The hello beacon also includes the required sensing parame-
and gear ratio is measured or inferred. The TiltSensor role       terization (e.g., sample rate). Each available mobile sensing
measures the angle of incline of the bicycle frame with re-       platform (i.e., Tmote Invent) that receives the beacon replies
spect to the gravitational force vector, allowing for real time   with a hello reply if its sensing capabilities match either a
slope calculation and a mapping of the terrain along a cy-        required or preferred role requested in the hello beacon. The
clist’s route. The LateralTiltSensor role measures the lateral    hello reply indicates which role(s) the respondent is offer-
angle of incline of the bicycle frame. The CompassSensor          ing to fill. However, a recipient of the hello that is already
role measures the instantaneous angle of the bike frame with      associated with another PersonalNode will not reply. Upon
respect to the Earth’s magnetic field. The MetalDetector role     receiving a hello reply, the PersonalNode first registers the
measures distortions in the the Earth’s magnetic field caused     respondent and the role(s) it is offering to fill, and then sends
by nearby ferromagnetic metals, allowing inference of the         a hello reply ack to complete the association. The hello reply
amount of passing automobile traffic. The SyncSprinkler           ack contains a list of identifiers reflecting the current BAN
role provides a common absolute notion of time and location       membership. Subsequent hello beacons sent by the Person-
to all members of the bike area network via periodic short        alNode do not request sensing roles that are already being
range broadcasts. The LocalDisplay role provides a means          filled by associated mobile sensing platforms. If a hello re-
to locally display sensed data. The CO2 Sensor role measures      ply ack is not received in response to a hello reply, the reply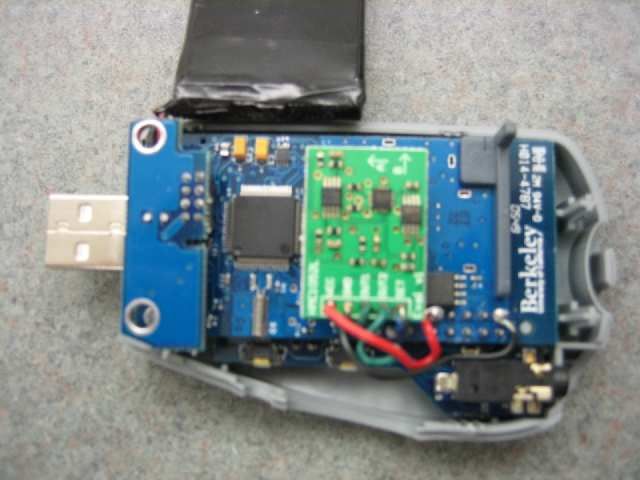
BikeNet Roles   Data Exchange Services     Data Exchange Services    Query Management

                                                                                                                                                                                                      Sensor Data Visualization
                                                                                                      Query Submission Portal

                                                                                                                                                        Sensor Data Repository
                         Tasking Exchange           Tasking Exchange

                                                                                                                                System State Database

                                                                                                                                                                                 Sensor Data Mining
                ...                                                         Sensing Resource
                        Uploading Exchange         Uploading Exchange          Discovery
        BikeNet Role
                         Muling Exchange               Ground Truth
        Assignment                                                          Sensing Resource
                                                           Sensing             Selection
              Intra− and Inter−BAN
             Management and Control                      TinyOS             Back End Comm.
             TinyOS Networking Stack                 Networking Stack       Networking Stack         Back End Comm. Networking Stack

        (a) Mobile sensor architecture.          (b) Sensor access point (SAP) architecture.                 (c) Back end architecture.
                                                                   Figure 5

is retransmitted up to N times. If after N times the ack is not             PersonalNode at that time. A subsequent PersonalNode but-
received, then it is assumed that mobility has carried the Per-             ton click while the PersonalNode is in the “Started” state
sonalNode and potential sensor out of range and the partial                 sends a stop message broadcast, signaling the end of the ride.
association state is purged.                                                The stop message causes mobile sensors associated with that
    Though generally a mobile sensing platform may, de-                     PersonalNode and are in the “Started” state to cease sensing.
pending on sensing capabilities, be able to take on more than                   Event-triggered Sensing vs. Continuous Sensing.
one BikeNet role, for our current prototype implementation                  Sensing is set up to occur either continuously or only when
we allow only one role per sensing platform to work within                  triggered by other events. In the continuous case, the user
hardware limitations of the Tmote Invent. For example, there                preferences executed by the PersonalNode parametrize the
are a limited number of free configurable I/O pins and ADC                  sensing capture (e.g., sampling rate, duration, local process-
channels available for external sensors on the Tmote Invent,                ing functions) that takes effect immediately upon receiving
and a shortage of Flash/RAM. In the future with more capa-                  the start message of the sensing control protocol. Continu-
ble hardware, we will be able to condense our current imple-                ous sensing in BikeNet is appropriate for roles such as the
mentation, assigning multiple roles to a single sensing plat-               TiltSensor where terrain mapping should be continuous. On
form and greatly reducing BAN complexity and costs (i.e.,                   the other hand, some sensing operations may be too energy
monetary, radio congestion, energy consumption). In the                     expensive for a mobile sensing platform to do continuously,
rest of the paper, unless stated we treat the logical sensing               or may not have meaning except under certain contexts (e.g.,
role and the mobile sensing platform to which the role is as-               certain locations of interest, or under certain sensed circum-
signed as synonymous.                                                       stances). Triggers are defined by dynamically updatable user
2.2.2 Intra-BAN and Inter-BAN Management                                    profiles executed by the PersonalNode that specify the con-
                                                                            ditions under which sensing should occur.
    Localization and Synchronization. The SyncSprinkler
role provides, via a periodic broadcast within the BAN, peri-                   The BikeNet implementation support of triggered sensing
odic samples of the instantaneous absolute time and location.               includes methods to define and submit sensing triggers and
In our implementation these are obtained from a GPS unit.                   actions to the PersonalNode for execution within the BAN.
The SyncSprinkler controls its transmission power to limit                  Upon receiving the triggered sensing definition, the Person-
the scope of its beacons, thereby maintaining a higher lo-                  alNode breaks apart the conditions that must be met for the
cation accuracy for all broadcast recipients. All BAN mem-                  action to take place, and reliably transmits each condition
bers’ time estimate is updated externally with the values con-              (e.g., “slope > 5 degrees”) to the BAN member suited to
tained in the SyncSprinkler broadcasts, and internally via a                evaluate the condition (e.g., the TiltSensor). When a condi-
local clock set to provide higher time resolution between re-               tion evaluates to true, the BAN member signals the Person-
ceived SyncSprinkler broadcasts.                                            alNode. The PersonalNode initiates the action when all con-
    Sensing Control. When the PersonalNode has estab-                       ditions for a given triggered action are met. We are currently
lished associations with sensing platforms (i.e., Tmote In-                 focusing on triggered photography, video and audio capture
vents) sufficient to meet all the roles specified by the                    using the camera and microphone on the N80, when certain
user preferences, an LED on the PersonalNode indicates a                    conditions in the BAN are met, but we also implement sup-
“Ready” state. A button click on the PersonalNode when                      port for a number of other actions such as sending data to be
in this “Ready” state sends a start message broadcast from                  displayed on the LocalDisplay, sensing something at a dif-
the PersonalNode indicating that the ride is beginning and                  ferent parametrization than the current one, playing a sound
sensors should start collecting data with their prescribed                  on the N80 or Tmote Invent speaker, transferring sensed data
parametrization. This message is acted on by mobile sensing                 from one Tmote Invent to another, and blinking LEDs.
platforms that are associated with that PersonalNode, mov-                      Real-time Feedback/Display. The local display proto-
ing both the PersonalNode and the associated mobile sensors                 col is used by the LocalDisplay to query other BAN mem-
into the “Started” state. If associated sensors do not receive a            bers for values to display. The LocalDisplay is provided
start message within a timeout period, the association times                by a handlebar-mounted N80 mobile phone, via the Blue-
out and the mobile sensors are free to associate with another               tooth/802.15.4 gateway shown in Figure 4(f). The Tmote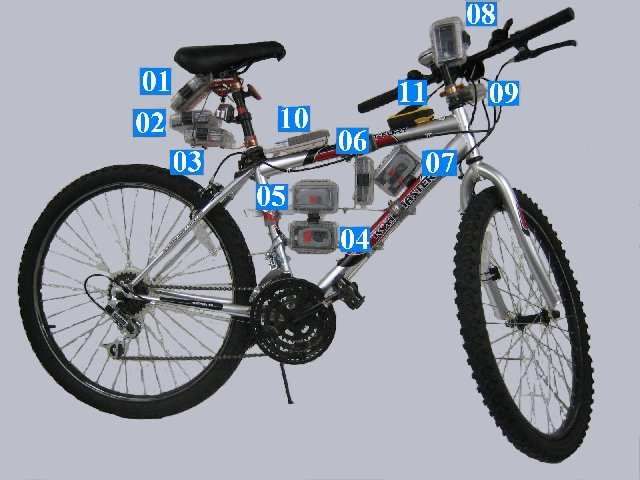
Invent’s hardware design shares the SPI bus between radio         ment after three resends of the same packet it will assume
and flash, and the same physical microcontroller pins are         the session is over and begins advertising anew. Our im-
used for UART0. Since the Bluetooth-to-Serial converter           plementation includes support for replication of sensed data
is connected to the Tmote Invent UART0 port, this pre-            (i.e., via the muling exchange) but the replication of muled
cludes simultaneous radio communication and display up-           data is not allowed. Restricting the right to replicate to the
dating. Hence, BikeNet uses a simple TDMA-like time slot          data origin allows it to maintain control over the number of
assignment on top of the TinyOS CSMA MAC to improve               copies of its data that are circulating and also to vet (in terms
communication between the roles generating sensor data and        of trustworthiness) all candidate mules.
the LocalDisplay. The LocalDisplay periodically broadcasts            In the uploading exchange, when a BAN comes within
a query for data and the sensor roles register the first Local-   the radio range of a mobile or static SAP, the Tmote Invents
Display they hear a query from as the only LocalDisplay they      composing the BAN attempt to upload sensed data to the
will reply to thereafter. This association times out after a      back end data repository. The upload protocol message ex-
period if no queries are heard from the LocalDisplay. The         change is identical to that of the muling protocol. When a
data that a given sensor role returns to the LocalDisplay is a    SAP receives data packets, they are forwarded (in both the
matter of user policy, but a typical display includes speed,      mobile SAP and static SAP cases) to the back end reposi-
distance traveled, bike frame tilt angle, pedal RPMs, and         tory. The decision to accept new upload sessions is made
time of day. To support flexibility in the user configura-        based on channel congestion around the SAP.
tion of the display, data is represented in the packet with       2.2.4 Ground Truth Sensing
(type,length,value) format for flexibility.                          In the BikeNet sensing system, SAPs are equipped with
2.2.3 Data Exchange Services                                      certain sensors and can provide ground truth measurements.
    Three types of data exchange occur in the BikeNet sys-        Ground truth1 sensing refers to a trusted, high fidelity, al-
tem: tasking exchange, uploading exchange, and muling             ways accessible stream of data. One use of ground truth data
exchange. The tasking and uploading data exchanges take           is as a filter applied to data uploaded from a sensor before
place between mobile sensing platforms and SAPs. The              the data is passed by the SAP to the back end repository.
muling data exchange takes place only between members of          The ground truth filter can be applied to validate or invalidate
the mobile sensing tier (e.g., Tmote Invents). As default,        uploaded data when the uploaded data samples and ground
BikeNet uses a delay-tolerant mode where a BAN’s Person-          truth data samples have a high expected correlation (e.g.,
alNode mules data for sensing roles in its BAN (up to the         temperature sampled at the same location and at the same
limits of its available storage) and uploads the data via wire    time, samples triggered by the same set of circumstances).
or a wireless upload protocol. Inter-BAN muling and in situ       Further, ground truth sensing can be used to satisfy queries
uploading via either mobile SAPs or opportunistically en-         coming from a back end system user that have only coarse lo-
countered static SAPs support queries from back end user          cation context requirements. Ground truth data is also used
applications that may want data in a more timely manner.          to satisfy queries coming from a BAN in the radio range of
    In the BikeNet tasking exchange, a SAP interacts with         a SAP. In this case the BAN can ask for readings from the
available mobile sensing platforms (e.g., Tmote Invents) to       SAP’s ground truth sensors, e.g., as part of a self-calibration
first instantiate a PersonalNode programmed with a cyclist’s      routine.
BAN preference profile. Based on this profile, the Person-        2.2.5 Query Management
alNode assembles a BAN by tasking other available mo-                The query management component on the SAP handles
bile sensing platforms with the required sensing roles as dis-    queries both from the back end system user, and from the
cussed in Section 2.2.1. Aside from this BAN bootstrap-           PersonalNode of a BAN. It invokes a sensing resource dis-
ping, the tasking exchange also includes the handling of user     covery routine to determine what sensing resources are avail-
queries/requests for data by back end system users, received      able to meet the sensing request. The routine checks both any
via the SAP. The PersonalNode responds to these queries by        ground truth sensors on the SAP itself (Section 2.2.4) and
invoking the necessary continuous or triggered sensing (Sec-      available sensing resources on any BANs that may be within
tion 2.2.2) within its BAN.                                       radio range of the SAP. Once a list of available sensing re-
    In the muling exchange, sensed data is transferred be-        sources is compiled, the SAP invokes a sensing resource se-
tween mobile sensors outside of the radio range of either a       lection routine to decide which resources will be tasked in
mobile or static SAP. A simple muling protocol is imple-          order to satisfy the request, and invokes a tasking routine to
mented on every Tmote Invent, but the option to activate          execute the necessary request (i.e., a simple function call if
muling (i.e., spend Flash space to carry others’ data) is set     the resource is on-SAP, or via the tasking exchange (Sec-
by cyclist preference. The protocol uses an advertisement-        tion 2.2.3) if the resource is in a BAN in radio range. In the
accept-data exchange, where the advertisement specifies the       BikeNet implementation, we have experimented with han-
amount of data the provider wants to have muled, the accept       dling queries to the SAP, originating both from the back end
message indicates the amount of data the consumer is will-        and from a BAN in radio range, for ground truth data. In
ing to mule (based on Flash constraints) and the data mes-        particular, using a cellular phone as a mobile SAP, we have
sage represents a burst of data packets from the producer to
the consumer. In addition, Stop-and-Wait ARQ with a max-             1 While related in principle, this notion of ground truth sensing
imum of three resends provides for reliable transfer of the       should not be confused with sensing for experimental validation and
data packet burst. If a producer still receives no acknowledg-    debug (e.g., using the quad capture video helmet in Figure 4(e)).
Figure 7: BikeView portal [4] for data display and query submission. A CO2 map of Hanover, NH, USA streets on a summer weekday
afternoon is shown.
experimented both with event triggered capture of images, techniques, including scatter plots to look for data correla-
sound and videos requested by the BAN (e.g., an audio an- tion, fast Fourier transforms (FFTs) to look for periodicity,
notated ride); and with direct requests from the back end running averages to smooth data to look for trends, and in-
BikeNet web portal for image, sound and video samples. terpolation to align samples according to distance. For ex-
2.2.6 Back End Services ample, we use a method to filter spurious vibration data from
Query Submission Portal. The BikeNet back end in- the TiltSensor when calculating the slope of the cyclists path.
cludes a web portal (BikeView [4]) containing a graphical Currently, the data handling is done in a non-automated way
presentation of a cyclists data, but also allowing for the real by storing raw data streams in flat text log files, processing
time querying of BANs using a GPRS connection via the these files using Awk scripts to extract data of different types
N80, if the cyclist is using such a device for their PersonalN- and apply methods for smoothing, averaging, scaling, and
ode. The user can select the BAN of interest and assemble a using an external tool for FFT analysis. Further, we develop
query to submit to the query manager component of that SAP scripts to transform data values into BikeView [4] visualiza-
using a collection of pull down menus. A final mouse click tions. With BikeView (see Figure 7), we present summarized
transmits the query over the cellular network to the selected collected data sorted by user, and sorted by ride within each
mobile SAP. We implement the ability to query a BAN’s lo- user account (akin to the presentation of “My Runs” on the
cation, capture a camera image, and sample the microphone Nike+iPod web page [6]). Detailed sensed data can be ob-
via this portal interface by sending SMS over GPRS to the tained by simple mouse hovers and clicks over the graphic
N80. representations of different rides. The vision is to provide
Sensor Data Storage, Processing and Visualization. back end sharing between users facilitated by dynamic cre-
The sensor data repository provides a location for the long ation of group pages that are visible to all users in the group
term storage of cyclist experience data on a per-cyclist basis and to which all group members can publish data.
and also provides a convenient location for the aggregation System State Database. The system state database con-
of all long term trace data for all participating cyclists. Ac- tains both static state information (e.g., Tmote Invent phys-
cess to particular data is a matter of a the policy that each cy- ical address and sensing capabilities, PersonalNode human
clist registers with the repository (or a separate access control custodian information) and dynamic state information (e.g.,
entity). The sensor data mining component provides a set of last known position of a mobile SAPs, and BANs, SAP load
standard statistical functions and reusable calculations/ data average) about elements in the network. In particular, the
transformations that a user (e.g., cyclist) can invoke to con- system state database tracks which BANs are currently in ra-
trol the retrieval and presentation of data. For BikeNet we dio range of mobile and static SAPs. This facilitates proper
use a number of data interpretation and inference tools and query routing from the back end query submission portal to42.4 300 10 10
GPS trace Tilt slope angle
Wheel/Pedal ratio 8
A
Latitude (decimal minutes)
250
Lateral Tilt (degrees)
5
Slope angle (degree)
42.3 6
B
4
200 0
2
Ratio (%)
42.2 D
150 0
C -5
-2
42.1
100 -4 -10
-6 C,D
A
42 B 50 -8 -15
-10
41.9 0
-12
-20
18 17.8 17.6 17.4 17.2 17 16.8 0 1 2 3 4 5 0 0.5 1 1.5 2 2.5 3 3.5 4 4.5 5
Longitude (decimal minutes) Distance (km) Distance (Kilometers)
(a) The mapped GPS trace of the cyclist (b) Cyclist fitness is inferred by correlating (c) Lateral tilt plotted versus distance.
route, comprising roads in the vicinity of the gear ratio inferred from the wheel/pedal Changes in lateral tilt are correlated with
Dartmouth College in Hanover, NH, USA. ratio and the measured road slope. turns along the route shown in Figure 8(a).
Figure 8
particular BANs, for BAN-specific user queries. The infor- Figure 8(b) shows the measured slope profile of the route
mation is also valuable more generally for debugging and calculated from TiltSensor readings versus distance (the
management of the network. Wheel/Pedal ratio curve is explained later). The slope s is
calculated according to s = arctan(x/y), where x and y are
3 System Evaluation the TiltSensor’s measured x- and y-channel accelerometer
We build five fully equipped BikeNet bicycles, imple- readings, respectively. We register accurate measurements
ment all of the aforementioned sensing roles using Tmote when the bike is stationary; error increases with speed and
Invent motes and Nokia N80 mobile phones, build a num- terrain roughness due to unfiltered vibrations and cyclist be-
ber of static and mobile SAPs, and implement a functional havior. The slope profile which matches the manually mea-
back end web portal offering query submission and data re- sured ground truth road segment (c.f. Section 2.1.5) well
trieval services. In this section, we present selected results (less than 10% deviation from the ground truth slope mea-
from several groups of experiments respectively targeted at: surements).
quantifying the cyclist experience from sensed data collected Figure 8(c) shows the lateral tilt plotted versus distance.
about a single cyclist and his environment; looking at per- The lateral tilt is calculated in the same manner just de-
formance aspects of key BikeNet subsystems; and measur- scribed for the TiltSensor. A cyclist’s aggressiveness in turn-
ing the real-time performance of a deployed system across ing is inferred. From the plot we correlate the increases in
the Dartmouth campus and in adjacent areas of the town of lateral tilt magnitude shown on the y-axis, with corner turns
Hanover, NH, USA. We use a common path that we call the expected from the mapped GPS trace shown in Figure 8(a).
ground truth route. This route includes a variety of urban cy- Positive lateral angle indicates a right-side lean whereas neg-
cling terrain, including built up busy roads in the town center ative angles indicate left-side leans. In Figure 8(c), we label
with lots of cars and pedestrian traffic and quiet back roads (viz. A, B, C, D) a sample of the lateral tilts that can be cor-
with little or no traffic. The route exposes cyclists to a vari- related with corner turns in the cyclist GPS trace (see Figure
ety of flat terrain, gradual down hill and steep uphill sections. 8(a)), where at A, B, C, and D the biker makes, respectively,
Typically the ground truth route takes 25-30 minutes to ride a right, a right, a left, and a left turn. The sharp left tilt (al-
and is nearly 5km long. The experiments are conducted at most -20 degrees) is due to mounting the bicycle at the start
rush hour and in the middle of the day when there is less of the ride.
traffic and activity. We conducted many experiments over the
The quantitative aspects of the cyclist fitness include the
period August 2006 - August 2007 collecting a typical data
slope of the road/trail that the cyclist covers on his ride, the
set of 0.8 MB per ride per bike. We record the runs using
speed profile of the cyclist, the gear used when traveling up
video from the video helmet (Figure 4(e)) that collects quad-
a given slope, and the location of the route. Figure 8(b)
directional video of a ride for ground truth validation of our
shows the slope profile of the road traversed on the cyclist’s
correlation/inference methods (not part of standard BikeNet
trip, and the ratio of the tire/wheel speed to the pedal speed.
equipment). BikeView [4] contains an example of one such
This ratio infers the approximate gear the bicycle is in at a
video recording.
given point in the route, and provides a notion of the fitness
3.1 Cyclist Experience Mapping of the cyclist. This indicator is most accurate when the cy-
3.1.1 Inference and Cyclist Fitness Sensing clist is going uphill, since when coasting downhill the pedals
In this section we present a series of plots characterizing may not be moved much. A strong cyclist can use a higher
cyclist behavior and the environmental conditions encoun- Wheel/Pedal ratio when climbing hills. In Figure 8(b), inter-
tered during a ride. We collect data from each of the sens- vals where the cyclist changes gears to climb hills are evident
ing roles mentioned in Section 2.2.1, and apply fusion tech- (from roughly 1 to 1.25km and from roughly 2 to 2.7km),
niques and trend analysis to extract additional information where the Wheel/Pedal ratio is nearly 1.
from the raw data. Knowledge of the sensed path slope combined with the6 Tilt slope angle 3800
Coasting Y-channel
Braking Estimated cars detection (magnetometer)
4 Ground truth cars detection (button)
3600 X-channel
Slope Angle (degrees)
2
Magnetometer Reading
Inferred State
0
3400
-2
-4
3200
-6
-8 Coast 3000
-10 Brake
2800
-12
0 0.5 1 1.5 2 2.5 3 3.5 4 4.5 5 0 0.5 1 1.5 2 2.5 3 3.5 4 4.5
Distance (km) Distance (km)
Figure 9: Periods of coasting and strong braking can be inferred Figure 10: From measured magnetic field distortions, we use a
from relationships between pedal RPM, wheel RPM and road slope. thresholding method to infer locations with dense patches of cars.
measured pedal speed and wheel speed allows us to infer ferred. To collect ground truth data for the experiment to
when a cyclist is coasting or braking. On a given bicycle compare against the inference from the MetalDetector, the
there is a finite discrete set of pedal speed to wheel speed ra- car rendezvous event is manually logged by the cyclist with
tios possible when the bicycle chain is engaged with a gear a ButtonMote click. We include the cases when the bike
and providing thrust to the bicycle. The cardinality of this set passes a car (parked or moving), and when a car passes the
is equal to the number of gears the bicycle has. If the mea- bike. We find that detection of cars more than 2m away is
sured ratio of pedal speed to wheel speed does not match one unreliable with our hardware, so we do not try to log when
of the allowable values we can infer that the cyclist is coast- a car passes in the oncoming lane (about 3m away). Each
ing. Braking can be inferred in a similar fashion to coasting. click generates a record of GPS time and location informa-
It is likely a cyclist is braking if the measured wheel speed tion. Figure 10 shows, the raw x-channel and y-channel read-
slows while the slope is negative (downhill). Further, brak- ings of a MetalDetector’s magnetometer plotted versus the
ing is likely when going uphill if the measured wheel speed distance covered along the ride. ButtonMote events and po-
slows faster than dictated by the slope of the hill. However, sitions of inferred cars are overlaid on the same plot. The
this is more challenging to detect since inference of uphill inference algorithm is run against both x and y channel data
braking is also dependent on unknown quantities such as the and works as follows. First, the exponentially weighted mov-
combined mass of the bicycle and the cyclist, and the route ing average of the magnetometer reading is calculated. If the
surface composition/coefficient of rolling friction. difference between the current value and the moving average
Figure 9 shows a plot of the road slope versus distance is greater than a threshold, and the current value is a peak
along the ground truth route. Applying the simple infer- (greater than both the preceding and succeeding values), a
ence technique of observing decreasing speed when the slope car is inferred. The threshold values for x and y channels
is negative (downhill), we infer sharp braking intervals at and the moving average weight are learned by training with
1.6km, 3.3km and 4.1km, which are verified by our known the readings from 0 to 1 kilometers. These trained values are
cyclist behavior. In these cases, we see a sharp decrease then used along the rest of the route from 1 to 4.5 kilome-
in wheel speed concurrent with a sustained downhill slope. ters. While discrepancies between the ground truth data and
Similarly, if the pedal speed is near zero and the wheel speed the output of the detection algorithm exist, we note that our
is high, we can easily infer the cyclist is coasting. In the fig- aim is not counting the exact number of cars but to identify
ure, we infer periods of coasting from roughly 1.25 to 2km areas of high automobile concentration. Using this simple
and 2.7 to 3.3km. thresholding technique we are able achieve a level of detec-
Aside from route topography and personal performance tion accuracy that supports this aim.
metrics, cyclists are interested in the ambience and safety of To provide a measure of air quality along the cyclist’s
a route as a determinant in the overall enjoyment of the cy- route we conduct experiments using a sensor measuring the
cling experience. We take steps towards quantifying the am- level of carbon dioxide in the air surrounding the cyclist. Fig-
bience in terms of automobile traffic, air quality, and sound ure 11(a) shows a trace of the carbon dioxide sensor readings
level. The presence of vehicles is often undesirable for cy- along the route shown in Figure 8(a) for two different cases,
clists who have concerns about safety, noise, or pollution. To namely, rush hour and low traffic. The peaks in the rush hour
infer automobile traffic along the cyclist route (Figure 8(a)), case occur when the biker was cycling on downtown roads
each BAN is equipped with a MetalDetector. When the Met- with a considerable presence of cars. In fact, variation in car-
alDetector passes close to any large metal body the Earth’s bon dioxide levels measured on roadways is likely to be the
magnetic field is deformed and the presence of a car is in- result of automobile exhaust. While carbon dioxide has low510 80
Rush hour Sound reading Health
500 Low traffic Performance
CO2 Reading (PPM)
78 1
Sound volume (dB)
490
480 76 0.8
470
Index
460 74 0.6
450
440 72 0.4
430 70 0.2
420
410 68 0
0 0.5 1 1.5 2 2.5 3 3.5 4 4.5 0 0.5 1 1.5 2 2.5 3 3.5 4 4.5 0 0.5 1 1.5 2 2.5 3 3.5 4 4.5 5
Distance (Kilometers) Distance (Kilometers) Distance (Kilometers)
(a) CO2 level along the ground truth route. (b) Sound level along the ground truth route. (c) Digesting the data: health and perfor-
Large spikes as the cyclist passes through Even small town traffic exceeds the long mance metrics to visualize a cyclist’s expe-
the center of town at rush hour. term health threshold (70dB). rience.
Figure 11
toxicity at all levels we recorded during our experiments, it for a given aim (e.g., joy-riding, exercise). These index val-
can act as a predictor of other noxious automobile exhaust ues can be mapped to colors and routes can be visualized
constituents such as hydrocarbons, nitrous oxides, and par- as a color-coded playlist. As the number and coverage of
ticulate matter. Thus, from readings of the carbon dioxide route segments are built up, a lookup service that returns the
sensor we can infer how enjoyable the traveled route is for a most healthy route at the desired time between two endpoints
cyclist from the standpoint of pollution. The portal snapshot becomes possible. By sharing index values for routes of in-
in Figure 7 shows a CO2 map of the Hanover streets on a terest, and the user-defined preference weights, cyclists are
summer weekday afternoon. able to learn from each other about where the good cycling
Another way to detect the presence of high vehicle den- is.
sity, and to characterize the ambience of a route, is by mea- Health. Air pollution and its effect on public health is of
suring the sound volume. Sound in decibels is plotted versus great interest in many urban communities. In Austria, France
distance in Figure 11(b) for a ride along the ground truth and Switzerland, by measuring particulates specifically from
route. The sound volume peaks near 80dB when the route motorized traffic the effect of air pollution on public health
passes through the main intersections of town where the au- is estimated to account for >20,000 adult deaths, more than
tomobile traffic is more prevalent. 290,000 episodes of bronchitis in children, and more than
3.1.2 Interpreting Cyclist Experience 500,000 asthma attacks each year [20]. Noise pollution is
In Figures 8(b) - 11(b), we present a large amount of raw also a factor in urban areas. According to the Environmental
data and first level inferences. In this section, we introduce Protection Agency’s Office of Noise and Abatement Con-
two example metrics to help cyclists and other system users trol in order to protect from hearing loss, one should not be
understand and make use of the types of data that a BikeNet exposed to more than 70dB for an extended period of time.
system provides. The metrics are weighted combinations of Meanwhile the average city traffic is 85dB and in larger cities
various sensor data types. In the metrics introduced below like New York, the noise level often exceeds 90db. 87%
(health and performance), we constrain ourselves to incor- of America’s city dwellers are exposed to noise so loud it
porating sensors for which we collect data in our prototype has the potential to degrade hearing capacity over time [21].
BikeNet implementation, though there are other appropri- Even in the small town of Hanover, NH, USA (see Figure
ate sensors that might reasonably be added. The weights 11(b)) the noise level is often above 70dB on the main streets
(e.g., a in the expression for Health below) comprise two at certain times. BikeNet sensing supports not only commu-
subweights: the user-defined preference/importance and the nal pollution mapping, but on a more personal level it sup-
normalizing factor for each element. The user-defined pref- ports the categorization of cycling routes according to their
erences reflect relative personal sensitivities (e.g., a cyclist potential impact on a cyclist’s health. We define a health
with asthma might weight the CO2 higher) to the elements index that combines data that indicate safety, noise and air
composing a given index score. With the second subweight, pollution (either directly or through inference) as follows:
we normalize each element (e.g., CO2 ) according to its max-
imum dynamic range measured along routes about which Health = 1.0 − a1 ∗CarDensity − a2 ∗CO2 Level − a3 ∗ SoundLevel.
sensed data has been collected so far. At the back end, or
on a user’s local display, index scores can be plotted versus
distance to see the variations across the route to identify crit- From the raw values obtained from the MetalDetector we
ical/interesting sections. For example, the plot of health in infer the density of cars along the route, along with raw val-
Figure 11(c) shows a large dip in the health index just before ues of CO2 Sensor and sound levels from the SoundSensor,
1km where the CO2 spikes (ref. Figure 11(a)). Secondly, we derive values for the health index of routes that a cyclist
users can compare the average index value among different travels. A higher CO2 level and derived car density imply
routes at different times to identify the most favorable routes there are more cars near the cyclist, creating an unpleasantYou can also read