Exceptional Behaviour Discovery - Repositório Aberto da ...
←
→
Page content transcription
If your browser does not render page correctly, please read the page content below
FACULDADE DE E NGENHARIA DA U NIVERSIDADE DO P ORTO

  Exceptional Behaviour Discovery

                   Carolina Centeio Jorge

     Mestrado Integrado em Engenharia Informática e Computação

               Supervisor: Rosaldo J. F. Rossetti, PhD
           Second Supervisor: Cláudio Rebelo de Sá, PhD

                           July 24th, 2019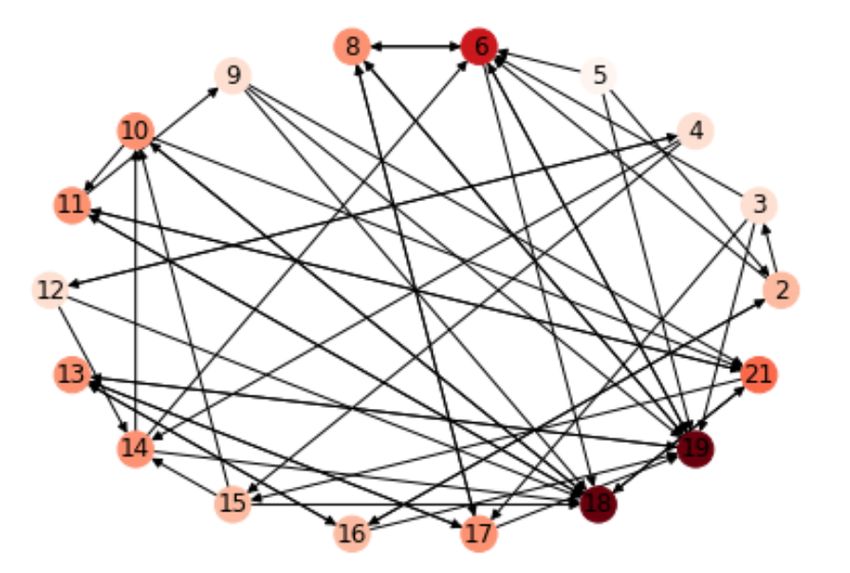
Exceptional Behaviour Discovery

                             Carolina Centeio Jorge

       Mestrado Integrado em Engenharia Informática e Computação

Approved in oral examination by the committee:

Chair: Ana Paula Rocha, PhD
External Examiner: Ricardo Cerri, PhD
Supervisor: Rosaldo J. F. Rossetti, PhD

July 24th, 2019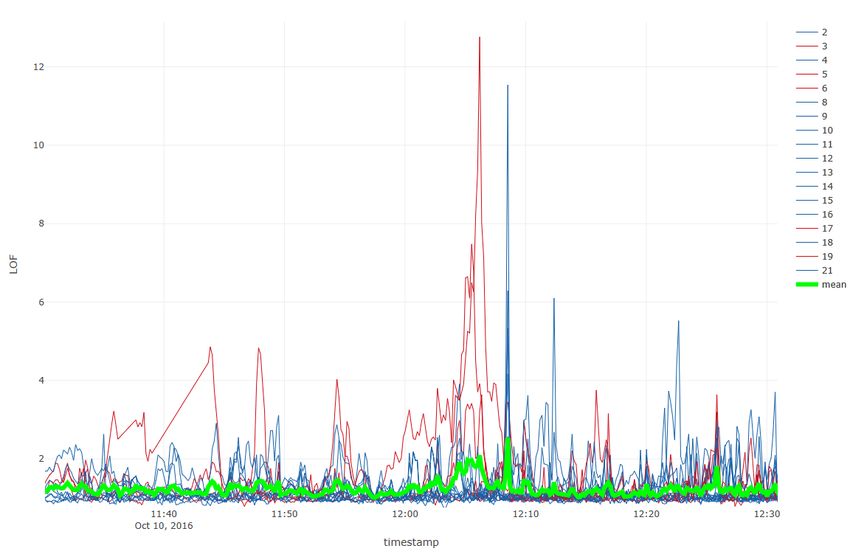
Abstract

Our lives are made of social interactions. These can be recorded by personal gadgets as well
as sensors adequately attached to people for research purposes. In particular, these sensors may
record geo-location over time, tracking the people that are participating in the study. Interac-
tions may follow lines that translate behaviour patterns. Data with spatial and temporal properties
is called spatio-temporal data. Moreover, data that tells position of objects over time is called
movement data. The goal of this dissertation is to propose an approach for the automatic discov-
ery of exceptional social behavior from real movement data. For this, we propose Exceptional
Behaviour Discovery (EBD). Exceptional Behaviour Discovery is a combination of data mining
techniques that aims at finding behaviour that deviates from the norm on social interaction data.
EBD combines Subgroup Discovery, Outlier Detection and Network Science techniques. Sub-
group Discovery (SD) algorithms have been consolidated over the last 20 years and have reached
successful results in many domain fields. There are already SD algorithms that take into account
some spatio-temporal properties. SD has already been applied to the social interactions domain
with the use of network properties. However, it has never been complemented with outlier detec-
tion and specifically adapted to movement data on interactions. Thus, we propose an approach that
receives movement and demographic data, analyzes it as interaction networks, and combines the
network metrics and properties (such as centrality measures and particular graph structures) with
Subgroup Discovery and outlier detection measures (namely Local Outlier Factor and Voronoi ar-
eas). This approach returns descriptive subgroups in the data. The main contributions of this work
are four new quality measures for directed networks, each with 3 variations, the possibility of com-
bining them with the signal of edges (positive or negative), the use of outlier detection measures
as SD targets, the use of Network Science metrics and structures to feed the SD algorithms and
presenting good visualization tools for validation of this approach’s results. The four quality mea-
sures are based on digraphs and multidigraphs, built from movement data. These quality measures
give different results and, as such, the user should choose the one that best suits their problem.
We tested these approaches on two real datasets of children playing in the playground and with
a validation dataset built by us for this purpose. The results are validated with visualization tools
we developed for that end and by experts. We conclude our novel approaches give powerful and
useful insight capable of supporting decisions in the social interactions domain.
    Keywords: social interactions, exceptional behaviour, subgroup discovery, outlier detection,
spatio-temporal data, movement data, network science

                                                  i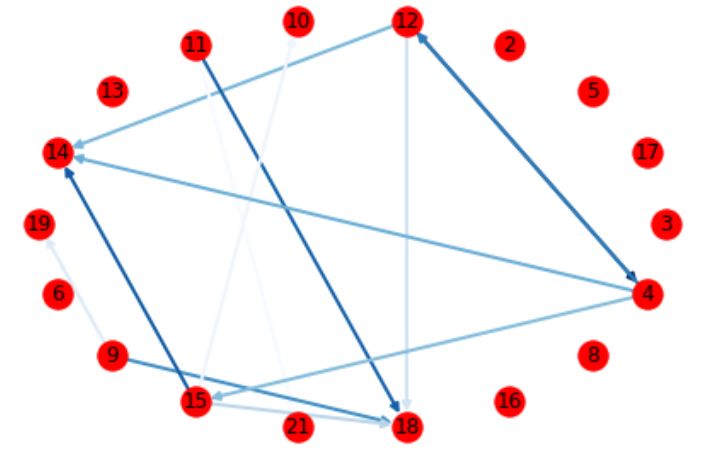
ii
Resumo

A nossa vida é feita de interações. Estas interações podem ser gravadas por dispositivos móveis
que trazemos connosco no quotidiano ou por sensores estrategicamente colocados para fins de
investigação. Em particular, estes sensores podem registar a localização ao longo do tempo das
pessoas a participar no estudo. As interações podem seguir linhas de ação que formam padrões.
Dados com propriedades espaciais e temporais são chamados de dados espaciotemporais. Além
disso, dados que dão a posiçao de objetos ao longo do tempo são também conhecidos como dados
de movimento. O objetivo desta dissertação é propor uma abordagem para a deteção automática
de comportamento excecional nas interações a partir de dados reais de movimento. Para isso,
propomos o conceito de Descoberta de Comportamento Excecional (DCE). Descoberta de Com-
portamento Excecional é uma combinação de técnicas de Mineração de Dados que tem como obje-
tivo principal encontrar comportamento que se desviam da norma em dados de interações sociais.
O EBD combina Descoberta de Subgrupos (DS), detecção de outliers e técnicas de Redes Com-
plexas. Os algoritmos de Descoberta de Subgrupos têm sido consolidados ao longo dos últimos 20
anos e alcançaram resultados bem-sucedidos em muitos campos de domínio. Já existem algorit-
mos DS que têm em consideração algumas propriedades espaciotemporais dos dados. Técnicas de
Descoberta de Subgrupos já foram também aplicadas ao domínio das interações sociais, com o uso
de métricas de redes complexas. No entanto, estas técnicas nunca foram complementadas com de-
teção outliers nem especificamente adaptado para dados de movimento no domínio das interações.
Assim, propomos uma abordagem que recebe dados demográficos e de movimento, analisa-os
como redes complexas de interação e combina métricas da rede (como medidas de centralidade)
com decoberta de subgrupos e medidas de deteção de outliers (como áreas Voronoi e Local Outlier
Factor). Essa abordagem retorna subgrupos descritivos nos dados. As maiores contribuições deste
trabalho são a proposta de 4 novas medidas de qualidade para Descoberta de Subgrupos, cada uma
com três variações, a combinação dessas medidas com a propriedade de sinalização das arestas
(positivas ou negativas), o uso das medidas de outlier como alvos de Subgroup Discovery, o uso
de métricas e estruturas de redes complexas para a Descoberta de Subgrupos e ainda o desenvolvi-
mento de ferramentas de visualização que permitem validar os resultados desta abordagem. Esta
abordagem foi testada em dois datasets reais de interações de crianças no recreio e em um dataset
de validação criado por nós a fim de validar as várias abordagens. Os resultados são validados
com as funções de visualização desenhadas para esse fim, pelo dataset de validação e ainda por
peritos no domínio. Concluímos que a nossa nova abordagem dá uma visão mais completa que
suportará a tomada de decisões no contexto das interações sociais.
    Keywords: interações sociais, comportamento excecional, descoberta de subgrupos, deteção
de outliers, dados espaço-temporais, dados de movimento, redes complexas

                                               iii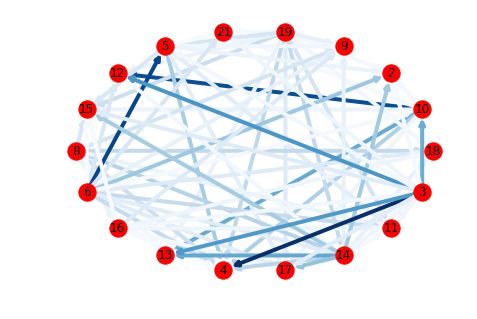
iv
Acknowledgements

First and mainly, to my parents: my best friends. To my mom who never allowed me to pitty my
weaknesses (or make excuses of them), who always fought for my growth as a good, authentic
and independent human being. To my dad who is a role model, always caring and loving, and with
who I can discuss any subject and clear my ideas with, who always asks the right questions and
knows an incredible amount of right answers.
    To my brother, for the laughs and beautiful words.
    To the rest of my family and godmother who I am truly happy and lucky to have and who
make me feel loved everyday.
    To Carlos Soares for helping me to find a good opportunity for my internship.
    To Cláudio, for accepting my challenges from the moment I first called. For encouraging and
motivating me always.
    To Rosaldo Rossetti, for always supporting me and my crazy ideas. For always believing in
me and shooting me further.
    To Martin Atzmueller, Jenny Gibson and Daniel Messinger for the collaboration.
    To the angels that appeared my way in Barcelona: Raffaella, Gloria, Laura, Sergi, David and
Piero. Special gratitude to Gloria, for all the morning runs you accompanied me when I needed it
and you could use some more sleep instead and to Laura for always hearing me out and offering a
pragmatic view of things when I can’t do it myself.
    To my office mates during the internship in Enschede, Zé Carlos and Maurice, for all the
procrastination days that turned into productive dialogues. Thank you for making my days. To my
other good friends in there, Umberto, Caterina and Ilias. And, of course, to Chasse girls for the
laughs on Wednesdays.
    To my lovely colleagues and friends, who always believe in me more than I do: Sérgio, Paulo,
Cris, Tiago, Ariana, Marta and Rui. For seeing me as the strong intelligent, independent woman
that I can only hope to become one day. For welcoming me every time I come back and for missing
me when I leave. You make it sad this is over!
    To my two and only: Catarina and Carlota, for always, always being there for me and show
me the true friendship. No matter how far and for how long apart, you are always there.
    To Filipa, Joana and Trindade, for all the moral online support and advice, despite any distance.
I’m wherever safe if I can get to talk to you.
    To the people of University of Twente and University of Porto. To Erasmus+ for the whole
year abroad that allowed me to meet, learn from and exchange knowledge with amazing people
from all over the world, with different backgrounds and stories in Barcelona and Enschede. This
dissertation also had the collaboration of Kids First project.
    Thanks to all the people along the way for making me a bit bigger, complete and interesting
today.

Carolina (or Ina, or Caro, or Carol)

                                                 v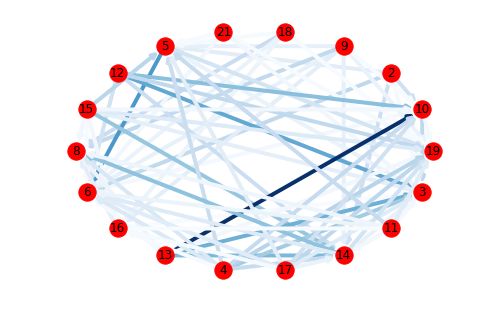
vi
“Só é tua a loucura onde, com lucidez, te reconheças.”

                                        Miguel Torga

    vii
viii
Contents

1   Introduction                                                                                                                                            1
    1.1 Motivation . . . . . . . . .    .   .   .   .   .   .   .   .   .   .   .   .   .   .   .   .   .   .   .   .   .   .   .   .   .   .   .   .   .   1
    1.2 Scope . . . . . . . . . . .     .   .   .   .   .   .   .   .   .   .   .   .   .   .   .   .   .   .   .   .   .   .   .   .   .   .   .   .   .   2
    1.3 Problem Statement . . . .       .   .   .   .   .   .   .   .   .   .   .   .   .   .   .   .   .   .   .   .   .   .   .   .   .   .   .   .   .   2
    1.4 Goals . . . . . . . . . . .     .   .   .   .   .   .   .   .   .   .   .   .   .   .   .   .   .   .   .   .   .   .   .   .   .   .   .   .   .   3
    1.5 Methodological Approach         .   .   .   .   .   .   .   .   .   .   .   .   .   .   .   .   .   .   .   .   .   .   .   .   .   .   .   .   .   3
    1.6 Contributions . . . . . . .     .   .   .   .   .   .   .   .   .   .   .   .   .   .   .   .   .   .   .   .   .   .   .   .   .   .   .   .   .   4
    1.7 Structure . . . . . . . . . .   .   .   .   .   .   .   .   .   .   .   .   .   .   .   .   .   .   .   .   .   .   .   .   .   .   .   .   .   .   5

2   Background                                                                                                                                               7
    2.1 Spatio-Temporal Data Mining             .   .   .   .   .   .   .   .   .   .   .   .   .   .   .   .   .   .   .   .   .   .   .   .   .   .   .    7
    2.2 Subgroup Discovery . . . . .            .   .   .   .   .   .   .   .   .   .   .   .   .   .   .   .   .   .   .   .   .   .   .   .   .   .   .    8
    2.3 Network Science . . . . . . .           .   .   .   .   .   .   .   .   .   .   .   .   .   .   .   .   .   .   .   .   .   .   .   .   .   .   .   11
    2.4 Outlier Detection . . . . . . .         .   .   .   .   .   .   .   .   .   .   .   .   .   .   .   .   .   .   .   .   .   .   .   .   .   .   .   13
    2.5 Summary . . . . . . . . . . .           .   .   .   .   .   .   .   .   .   .   .   .   .   .   .   .   .   .   .   .   .   .   .   .   .   .   .   15

3   Related Work                                                                                                                                            17
    3.1 Subgroup Discovery . . . . . . . . . . . . .                            .   .   .   .   .   .   .   .   .   .   .   .   .   .   .   .   .   .   .   17
         3.1.1 Targets . . . . . . . . . . . . . . . .                          .   .   .   .   .   .   .   .   .   .   .   .   .   .   .   .   .   .   .   18
         3.1.2 Search strategy . . . . . . . . . . . .                          .   .   .   .   .   .   .   .   .   .   .   .   .   .   .   .   .   .   .   19
         3.1.3 Quality Measures . . . . . . . . . . .                           .   .   .   .   .   .   .   .   .   .   .   .   .   .   .   .   .   .   .   19
         3.1.4 Domains . . . . . . . . . . . . . . .                            .   .   .   .   .   .   .   .   .   .   .   .   .   .   .   .   .   .   .   20
         3.1.5 Spatio-temporal Subgroup Discovery                               .   .   .   .   .   .   .   .   .   .   .   .   .   .   .   .   .   .   .   20
         3.1.6 Network Science . . . . . . . . . . .                            .   .   .   .   .   .   .   .   .   .   .   .   .   .   .   .   .   .   .   20
    3.2 Spatio-Temporal Data and Social Interactions                            .   .   .   .   .   .   .   .   .   .   .   .   .   .   .   .   .   .   .   21
         3.2.1 Outliers . . . . . . . . . . . . . . . .                         .   .   .   .   .   .   .   .   .   .   .   .   .   .   .   .   .   .   .   21
         3.2.2 Movement data . . . . . . . . . . . .                            .   .   .   .   .   .   .   .   .   .   .   .   .   .   .   .   .   .   .   21
    3.3 Gap Analysis . . . . . . . . . . . . . . . . .                          .   .   .   .   .   .   .   .   .   .   .   .   .   .   .   .   .   .   .   22

4   Methodological Approach                                                                                                                                 25
    4.1 Pipeline . . . . . . . . . . . . . . . . . . . . . . . . . . . .                                        .   .   .   .   .   .   .   .   .   .   .   25
    4.2 Input: Data . . . . . . . . . . . . . . . . . . . . . . . . . .                                         .   .   .   .   .   .   .   .   .   .   .   26
    4.3 Approach: Exceptional Behaviour Discovery . . . . . . . .                                               .   .   .   .   .   .   .   .   .   .   .   27
        4.3.1 Compositional Subgroup Discovery . . . . . . . . .                                                .   .   .   .   .   .   .   .   .   .   .   27
        4.3.2 Spatio-temporal Compositional Subgroup Discovery                                                  .   .   .   .   .   .   .   .   .   .   .   28
        4.3.3 Subgroup Discovery algorithm . . . . . . . . . . . .                                              .   .   .   .   .   .   .   .   .   .   .   32
        4.3.4 Subgroup Discovery with Outlier Detection . . . . .                                               .   .   .   .   .   .   .   .   .   .   .   32
    4.4 Output: Subgroups . . . . . . . . . . . . . . . . . . . . . .                                           .   .   .   .   .   .   .   .   .   .   .   33

                                                            ix
CONTENTS
5 Results and Analysis 35
5.1 Assessment Approach . . . . . . . . . . . . . . . . . . . . . . . . . . . . . . . . 35
5.2 PlaygroundA dataset . . . . . . . . . . . . . . . . . . . . . . . . . . . . . . . . 36
5.2.1 Quality measures qS1 and qM1 . . . . . . . . . . . . . . . . . . . . . . . 36
5.2.2 Quality measures qS2 and qM2 . . . . . . . . . . . . . . . . . . . . . . . 37
5.2.3 Signed graphs with quality measures qS1 and qM1 . . . . . . . . . . . . . 43
5.2.4 Subgroup Discovery with Outlier Detection . . . . . . . . . . . . . . . . 46
5.2.5 Summary . . . . . . . . . . . . . . . . . . . . . . . . . . . . . . . . . . 49
5.3 PlaygroundB dataset . . . . . . . . . . . . . . . . . . . . . . . . . . . . . . . . 50
5.3.1 Quality measures qM1 with Network Science metrics . . . . . . . . . . . 50
5.3.2 Quality measures qS2 and qM2 with Network Science metrics . . . . . . . 51
5.3.3 Summary . . . . . . . . . . . . . . . . . . . . . . . . . . . . . . . . . . 51
5.4 Validation dataset . . . . . . . . . . . . . . . . . . . . . . . . . . . . . . . . . . 51
5.4.1 Subgroup Discovery with Outlier detection . . . . . . . . . . . . . . . . 53
6 Conclusions 55
6.1 Final remarks . . . . . . . . . . . . . . . . . . . . . . . . . . . . . . . . . . . . 55
6.2 Future Work . . . . . . . . . . . . . . . . . . . . . . . . . . . . . . . . . . . . . 56
References 57
xList of Figures
2.1 Visual differences on classification, subgroup discovery and outlier detection. . . 9
2.2 A set of graphs composing a network. . . . . . . . . . . . . . . . . . . . . . . . 13
2.3 Local Outlier Factor. . . . . . . . . . . . . . . . . . . . . . . . . . . . . . . . . 14
2.4 Voronoi cells. . . . . . . . . . . . . . . . . . . . . . . . . . . . . . . . . . . . . 15
4.1 Approach diagram. . . . . . . . . . . . . . . . . . . . . . . . . . . . . . . . . . 26
4.2 How interactions are considered. . . . . . . . . . . . . . . . . . . . . . . . . . . 29
5.1 Subgroups 3 and 7 of Table 5.2. . . . . . . . . . . . . . . . . . . . . . . . . . . 37
5.2 Histograms of edges’ weights. . . . . . . . . . . . . . . . . . . . . . . . . . . . 40
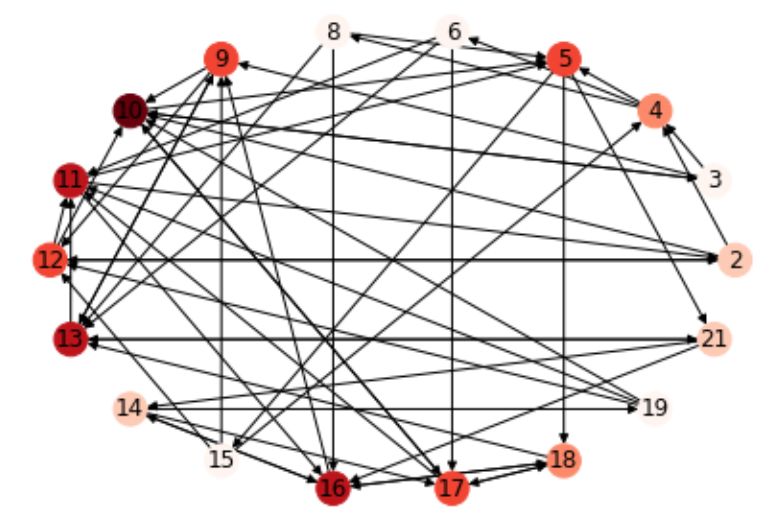
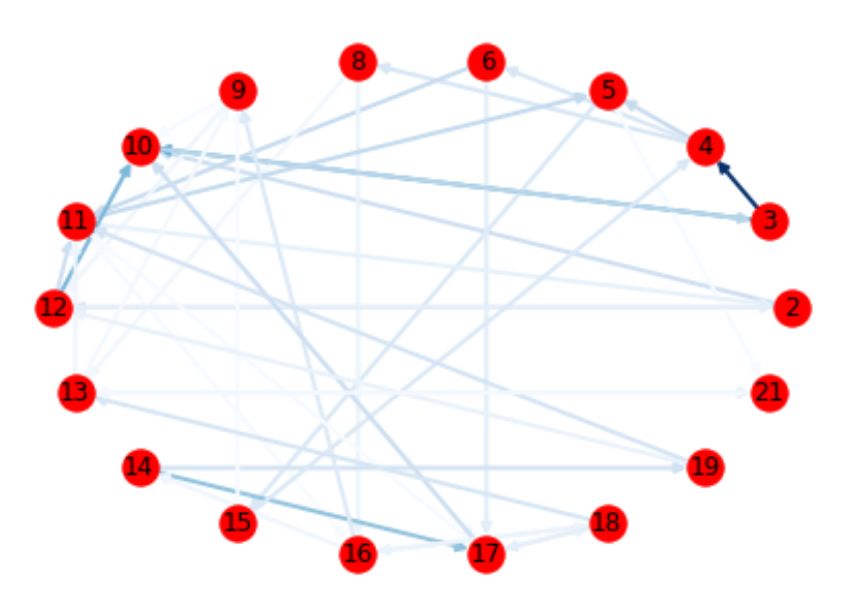
5.3 Interactions digraph and subdigraphs. . . . . . . . . . . . . . . . . . . . . . . . 41
5.4 Bar plots of nodes weights . . . . . . . . . . . . . . . . . . . . . . . . . . . . . 41
5.5 Distribution of weights of the edges in the interactions multidigraph. . . . . . . . 42
5.6 Bar plots of average node weights. . . . . . . . . . . . . . . . . . . . . . . . . . 42
5.7 Dislikes and negative interactions. . . . . . . . . . . . . . . . . . . . . . . . . . 43
5.8 Graph from most scored subgroup regarding ending node (to-node version). . . . 43
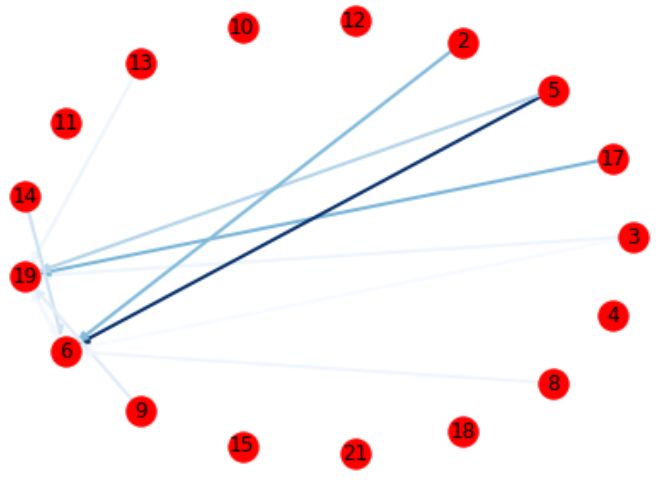
5.9 Plot of the graph representing the peers each kid likes. . . . . . . . . . . . . . . 44
5.10 Subgroup based on the starting nodes in positive interactions. . . . . . . . . . . . 45
5.11 Subgroup based on the ending nodes in negative interactions. . . . . . . . . . . . 45
5.12 Mean Voronoi area of each kid. The red line shows the average. . . . . . . . . . 46
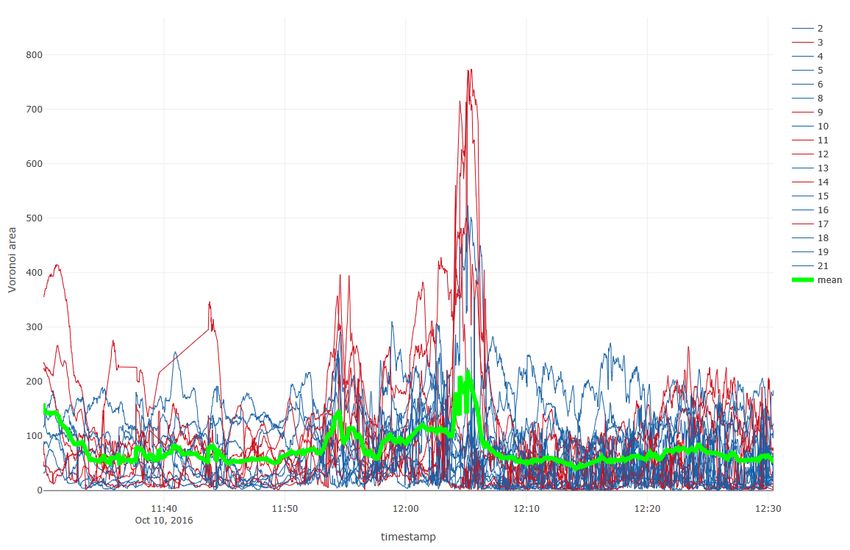
5.13 Voronoi areas of each kid (per line) along time. . . . . . . . . . . . . . . . . . . 47
5.14 Mean LOF of each kid. The red line shows the average. . . . . . . . . . . . . . . 48
5.15 LOF per child over time. . . . . . . . . . . . . . . . . . . . . . . . . . . . . . . 49
5.16 Interactions digraph. . . . . . . . . . . . . . . . . . . . . . . . . . . . . . . . . 52
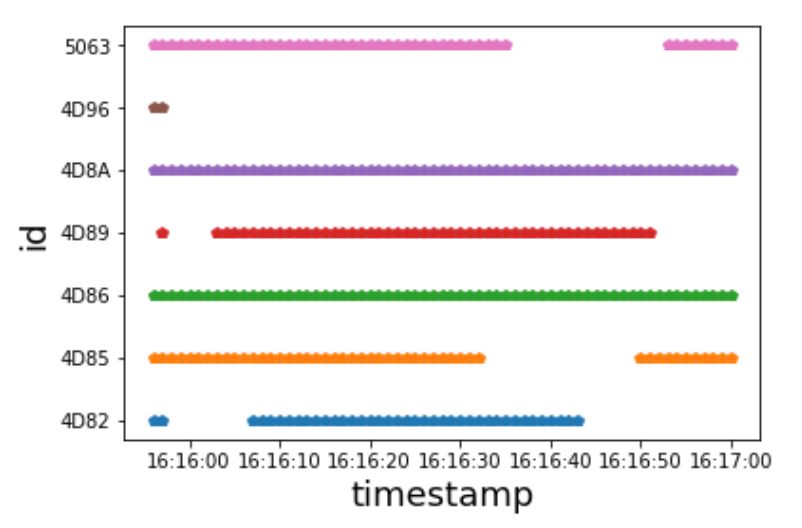
5.17 Signals captured for each tag. . . . . . . . . . . . . . . . . . . . . . . . . . . . . 53
5.18 Outlierness measures for validation dataset. . . . . . . . . . . . . . . . . . . . . 53
5.19 Positions of volunteers in loners experiment. . . . . . . . . . . . . . . . . . . . . 54
xiLIST OF FIGURES
xiiList of Tables
3.1 Characteristics of main algorithms. . . . . . . . . . . . . . . . . . . . . . . . . . 18
3.2 Gap Analysis. . . . . . . . . . . . . . . . . . . . . . . . . . . . . . . . . . . . . 23
5.1 Datasets. . . . . . . . . . . . . . . . . . . . . . . . . . . . . . . . . . . . . . . . 35
5.2 Results of qS1 and qM1 for playgroundA dataset. . . . . . . . . . . . . . . . . . . 38
5.3 Results of qS2 for playgroundA dataset. . . . . . . . . . . . . . . . . . . . . . . 40
5.4 Results of qM2 for playgroundA dataset. . . . . . . . . . . . . . . . . . . . . . . 41
5.5 Negative interactions with qM1 for playgroundA dataset. . . . . . . . . . . . . . 44
5.6 Results for Voronoi area as target . . . . . . . . . . . . . . . . . . . . . . . . . . 46
5.7 Results of qS1 with Network Science metrics for playgroundB dataset. . . . . . . 50
5.8 Results of qS2 for playgroundB. . . . . . . . . . . . . . . . . . . . . . . . . . . . 51
xiiiLIST OF TABLES
xivAbbreviations
SD Subgroup Discovery
KDD Knowledge Discovery in Databases
EMM Exceptional Model Mining
DFD Distribution of False Discoveries
LOF Local Outlier Factor
xvChapter 1
Introduction
In this chapter we introduce the subject of this dissertation. We first motivate the topic, give it a
context and define the problem. Then we present our goals and approach devised to tackle that
problem. Finally, we outline the remaining structure of the document.
1.1 Motivation
People interact everyday through not only verbal but also non-verbal communication. The study
of the non-verbal communication while human beings interact is a possible way to study human
beings as social entities [CQDG+ 18]. As such, we can study these interactions making use of
recent computing technology.
Interactions can be translated into data. As people make more and more use of smart phones
and Web technologies, a great amount of data about users comes from wireless devices or visits to
websites, for example. Such user spatio-temporal data are also known as movement data [LLPT10a].
Other ways of deliberately gathering data from social environments is through sensors (of prox-
imity or geo-localization) previously attached to the people participating in the study without
interfering with their actions or by recording it. From these data, a set of complex networks can be
derived, namely social interaction networks which capture interactions between people involved
in the environment [Atz16].
These interactions may follow patterns, sequences of behaviours, lines of verbal and non-
verbal gestures, whether they are intended or not [Gof67]. In particular, there may be some pat-
terns which do not follow the norm, making them unusual. We define these behaviours that are
unusual as exceptional behaviour.
The detection and interpretation of these patterns is important in several domains (explored in
Chapter 3. The data from the sensors, video or gadgets is usually analyzed by experts from the
specific domain. The automatic extraction of descriptive knowledge from the data could support
the analysis and decisions of these experts.
1Introduction
1.2 Scope
The movement data that suggests social interactions among people can be analyzed using data
mining techniques. We can use Subgroup Discovery (SD) algorithms to find subgroups of people
who share characteristics and whose behaviour deviates from the norm. On the other hand, we
can find people that behave differently from the rest, not belonging to a specific subgroup by using
Outlier Detection techniques. As such, the combination of both Subgroup Discovery and Outlier
detection techniques may lead to powerful insight into interactions.
Subgroup Discovery [Kl2] is a descriptive technique of data mining that provides easy-to-
understand results to the expert. It finds subgroups of objects of a dataset that share the same
characteristics with respect to a property of interest: the target, [HCGdJ11]. Besides the target, a
subgroup discovery algorithm has at least one quality measure and a search strategy well defined.
Thus, by defining the property of interest on the interactions, a quality measure appropriate to the
evaluation of a subgroup of people and a search strategy, we can search for descriptive subgroups
of people with subgroup discovery techniques.
However, some objects deviate from the general behaviour not fitting into a subgroup. These
objects are considered to be outliers. The detection of outliers can find exceptional behaviour that
is not described by subgroup discovery techniques. Thus, we can use outlier measures, such as
Voronoi areas and Local Outlier Factor, to add an outlier score to the people’s information. This
score can be used as a target for subgroup discovery techniques.
Moreover, we can see interactions as complex networks. Therefore, we can make use of
Network Science properties, namely global and local measures to complement the data. These
properties may not only extract knowledge from the data but also work as properties of interest
or quality measures for the data mining techniques. Furthermore, we can use signed graphs to
represent external information, such as who likes who and use it as a different quality measure.
Network science can then be included in the list of techniques to use to discover exceptional
behaviour.
The detection of uncommon behaviour may be important in any domain including people and
their interactions. We can consider organizations, education, security and public health. Thus, the
automatic detection of subgroups and outliers in each of these environments would contribute to
the interpretation of the interactions in the respective domain.
1.3 Problem Statement
The automatic extraction of exceptional behaviour from interaction data has been already tackled
in recent literature. However, the discovery of descriptive subgroups from data that combines both
movement and demographic properties of objects (such as people characterized and interaction
with each other) has never been done. Network science techniques have also been previously used
2Introduction
along with subgroup discovery but not with this type of data. Using outlier detection to comple-
ment subgroup discovery does not exist in the literature. Thus, the combination of subgroup dis-
covery, outlier detection and network science techniques to discover exceptional behaviour from
data with both movement and demographic information has never been done.
1.4 Goals
The goal of this dissertation is to detect and extract characteristics of exceptional behaviour in
datasets with both movement and demographic characteristics. To do so, we want to combine
subgroup discovery techniques with network science and outlier detection techniques. In the end,
we want to suggest a pipeline that receives the data and retrieves information about characteristics
connected to exceptional behaviour, helpful for decision support.
In this work, we want to provide a good literature review of the subgroup discovery algorithms
and choose one that best suits our problem. Then, we want to propose new quality measures to
evaluate the interest of the subgroups in the social interactions contest. These quality measures
include both network science and outlier detection metrics.
We want to develop the necessary tools to analyze and extract knowledge about exceptional
behaviour from movement and demographic data. Visualization of this type of data is also a goal
in this work. Finally, we aim that this solution is suitable for real world data and show it in a case
study.
1.5 Methodological Approach
Exceptional Behaviour Discovery can be defined as the combination of Data Mining techniques
that allow the detection of exceptional behaviour. In this work, we use the combination of Sub-
group Discovery and Outlier Detection techniques. Furthermore, social interactions can be dis-
posed as complex networks, where people are the nodes and the interactions are represented by
edges. Thus, we propose an approach that combines Subgroup Discovery, Outlier detection and
Network Science metrics for the discovery of exceptional behaviour.
People interact on the move. As such, the data to be used has both movement, the location of
a person over time, and demographic properties (the characteristics of the person). We develop
visualization tools that make it possible to visualize this type of data. Then, we can extract directed
interactions and represent them through directed graphs or multigraphs. From these networks, we
can extract some knowledge through metrics and measures. We base a target on the edges’ weights
and develop quality measures from these metrics. It is also possible that this metrics are good
characteristics of the people, too, and can be used to enrich the data. Moreover, we can represent
external information in signed graphs, such as who likes who. We develop other quality measures
which interest lays on the interactions evaluated as positive and/or negative based on those signed
graphs.
3Introduction
Subgroup Discovery finds subgroups: groups of people that share the same characteristics and
deviate from the norm. Subgroups are chosen based on statistical hypothesis and so there is a
possibility that some subgroups are incorrectly classified. However, a subgroup is good if it is
both exceptional and frequent, which means that an object whose behaviour deviates from the
norm as well as everyone else’s may not be detected by subgroup discovery. We then explore
the outlier detection measures, such as Voronoi areas and Local Outlier Factor, to be targets of
subgroup discovery approaches as to find people that are not part of any subgroup when observing
the interactions but also show exceptional behaviour.
We will be applying this approach to two datasets of children tracked with location sensors
in a playground. These datasets present not only the geographic position of children over time,
but other demographic of each child (Gender, Age) and even social characteristics, in one of the
datasets. With our approach, we expect to find subgroups from the in children’s interactions and
behaviour. To validate the subgroups, we use visualization tools, other mathematical measures
and, in some cases, validation datasets created for this purpose.
All in all, we want to develop an approach that extracts descriptive knowledge about excep-
tional behaviour from demographic and spatio-temporal data of social interactions. This approach
receives spatio-temporal data of tracked objects (people) in an interactive environment, along with
some personal and/or social characteristics of these individuals. The approach first either analyses
the data as an interaction network, extracting some of its properties, both global and local (on the
node) or analyses the children in terms of positional behaviour. The output are subgroups of any
or even a combination of the approaches.
1.6 Contributions
This dissertation contributes to the state of the art with the proposal of subgroup discovery ap-
proaches on movement data in the context of social interactions and its validation through visual-
ization tools. These approaches make use of Network Science metrics and properties, such as di-
rected graphs structure (simple graph and multigraph), centrality measures and signed graphs con-
cept. Furthermore, it uses Outlier Detection measures, namely Local Outlier Factor and Voronoi
area, computed from the positions over time of each kid, making it a possible target for SD meth-
ods.
We can summarize the contributions of this work as:
• Visualization of movement data and extracted directed interactions
• Two quality measures based on directed graphs that represent the interactions extracted from
movement data;
• Two quality measures based on directed multigraphs that represent the interactions extracted
from movement data;
• Quality measures based on a signed graph;
4Introduction
• Use of outlier measures (Local Outlier Factor and Voronoi areas) as targets for Subgroup
Discovery algorithms.
Part of this dissertation was accepted in EPIA 2019 (Encontro Português de Inteligência Arti-
ficial) in a paper called Mining Exceptional Social Behaviour [JAH+ 19] and will be published in
the proceedings of this conference, in the thematic track Knowledge Discovery and Business In-
telligence. This work is also going to be submitted for the Machine Learning journal an extension
of [Atz18].
1.7 Structure
The remaining of this document is structured as follows: presentation of the background, in which
we describe the important concepts for the development of this work in Chapter 2. Then we
present the Related Work in Chapter 3, followed by the Methods and Materials in Chapter 4. We
finally present the Results and Analysis in Chapter 5 and conclude in Chapter 6.
5Introduction
6Chapter 2
Background
In this chapter we explain the important concepts and techniques needed to understand the work
presented in this dissertation. We explain Spatio-Temporal Data Mining, define Exceptional Be-
haviour Discovery, explain Subgroup Discovery and give a brief insight into Network Science and
Outlier Detection. In the end, we will summarize the highlights.
2.1 Spatio-Temporal Data Mining
Many domains in which we can use data mining techniques are placed in a temporal or spatial
scenario. Therefore, to learn from the data, it is important to take into account its temporal and
spatial properties [RS99]. Movement data [LLPT10a] is data with properties about objects’ abso-
lute or relative location (and, consequently, about their presence or absence in a certain geometric
space [WSMR15]). These properties, together with social information, suggest social-links and
interactions between people.
Spatial data mining aims at extracting knowledge from the spatial properties of data, such
as spatial relationships, that are not explicitly stored in the dataset [HKS97]. The goal is, then,
to discover spatial patterns, and find possible explanations for the origin of such patterns. Klös-
gen [KM02a] first describes spatial subgroups as operations described between objects on their
spatial properties. As an example, “cities with river" can be considered a subgroup since it is the
intersection (operation) of the spatial properties of some cities with the spatial properties of some
rivers.
Temporal data mining, on the other hand, concerns the analysis of data with temporal proper-
ties [RS99]. These studies can lead into two directions: (1) the discovery of causal relationships
from temporal properties and (2) the discovery of similar patterns at a certain time window, at
distinct times (also known as time series analysis). Temporal analysis can be done in one or more
dimensions of time.
7Background
Spatio-temporal data mining takes into account both spatial and temporal properties of the
data. These two properties can appear together by adding temporal properties in spatial systems
or the other way around (most commonly). Then, spatio-temporal subgroup discovery concerns
the descriptive mining of data by analyzing a target variable (property of interest) in a multidi-
mensional input space [KM02b]. The spatial properties are usually covered by the description
language, whereas the temporal dimension is normally important to analyze the changes in pat-
terns which will determine the quality of a subgroup [KM02b]. The combination of interactive
and automatic approaches, such as geo-referenced and tagged data, enables powerful exploratory
approaches [AL13].
2.2 Subgroup Discovery
Subgroup Discovery (SD) is a descriptive and exploratory data mining technique to identify inter-
esting patterns, the so-called subgroups, that deviate from the norm [Kl2]. These patterns, show
an unusual distribution when compared to the overall population [Atz15]. This interesting be-
havior is typically based on some criteria which balances their relevance between their size and
unusualness.
Fayyad et al. [FPSU96] define Knowledge Discovery in Databases (KDD) as:
“The nontrivial process of identifying valid, novel, potentially useful, and ultimately
understandable patterns in data."
Data are a set of facts (in particular, cases in the database) and a pattern is an expression in some
language describing the data or a model applicable to the subset. Moreover, Fayyad [FPS96]
defines Data Mining as:
“A step in the KDD process that consists of applying data analysis and discovery
algorithms that, under acceptable computational efficiency limitations, produce a par-
ticular enumeration of patterns (or models) over the data."
We can divide Data Mining techniques in two main groups [HCGdJ11]: Predictive induction and
Descriptive induction. Predictive induction aims to classify or predict (includes classification,
regression and temporal series); Descriptive induction aims at extracting interesting knowledge
from data. As for the latest, we can consider the study of association rules and subgroup discov-
ery [KL06].
As in [DK11], we define a dataset as a bag of n records with the form of x = (a1 , . . . , am ,t1 , . . . ,tl ),
where ai is a descriptor and ti is a target. Subgroups are usually described with a description lan-
guage, D, and are induced by a pattern. A pattern, p, is a function p : A → {0, 1} and covers
a record x iff p(a1 , . . . , am ) = 1. A subgroup corresponding to a pattern p is the bag of records,
S p , that p covers: S p = {x ∈ D | p (a1 , . . . , am ) = 1}. D is typically a conjunction of conditions
on attributes, such as: Gender = F ∧ Age ≤ 22. The interestingness of subgroups is measured by
quality measures according to the different types of targets.
8Background
(a) Classification (b) Subgroups (c) Outliers
Figure 2.1: Visual differences on classification, subgroup discovery and outlier detection.
On the one hand, subgroup discovery differs from classification techniques as it attempts to
describe knowledge for the data, whereas a classifier attempts to predict it; it aims at finding indi-
vidual interesting patterns. Also, it does not provide a ready-to-use predictive model. However, we
have certain property of interest defined, the target, which limits the search. Subgroup discovery
is the search for these rules on the training instances. By combining different attributes, the search
looks for the combinations that hold both the condition and the property of interest (target). Thus,
subgroup discovery is somewhere between the two groups of Data Mining techniques (Predictive
Induction and Descriptive Induction).
Furthermore, a supervised-learning problem is a task of correct classification that the system
must learn how to do based on correctly classified observations and context of the problem [Lai70].
Oppositely, in a unsupervised-learning problem both the structure and the classification of the
data are unknown [PC70]. As such, subgroup discovery is not only a supervised learning tech-
nique [LCGF04], as it obtains classification rules, but it can also be seen as an unsupervised-
learning problem as it aims at extracting association rules [NLW09]. An association rule shows
frequent associations (also known as relationships or patterns) that occur in a dataset [HKS97].
Targets can be found of many types. The most common ones are binary [Wro97] (target
is either true or false), nominal [BdJG+ 06] (undetermined number of possible values) or nu-
meric [GR09]. However, they can be of any type. In particular, they can be ranked [dSDSK16a]
or as a distribution [JPA06]. This will be further revised in Chapter 3. Interestingness can then
be defined as a distributional unusualness (or exceptionality) according to a certain property of
interest (target) [dSDSK16b].
The interestingness of a subgroup is measured by one or more quality measures. Given a
subgroup discovery algorithm, a set of subgroups is identified by the quality function [LFK08].
Quality measures are a key factor for the extraction of knowledge because the interest obtained
depends directly on them [HCGdJ11]. Many have been presented in the literature along the years.
Figure 2.1 shows the difference between a classification problem in (a), subgroup discovery in
(b) and outlier detection in (c). We will explain the latter later on.
As said before, SD has been concerned with finding points in the data where the distribution of
the target variable deviates from the global distribution. Exceptional Model Mining (EMM) is an
extension of the subgroup discovery. Leman et al. [LFK08] propose to extend Subgroup Discovery
to targets that are models of the tradition variables of the data. More specifically, EMM aims on
9Background
discovering subgroups where a model fitted to that subgroup is substantially different from that
same model fitted to the entire dataset; it can be seen as the finding of an unusual target interaction,
rather than distribution [dSDSK16b]. The authors aim to find such groups automatically by using
the subgroup discovery approach, choosing a model to represent the interaction among the targets
and a quality measure adapted to that model that will find when the interaction is interesting.
EMM is useful when we are not interested in finding an uncommon value for the property of
interest (target), but rather an uncommon multi-target interaction.
Subgroup discovery algorithms perform a search for relationships between conditions and
targets. We can think of it as a tree and at each level we have the different variables and at each
node we shall perform the quality measure. As such, one important parameter of these algorithms
is the search strategy. Search strategy is directly connected to the number of variables and values
considered [HCGdJ11]. On the other hand, it affects the time and memory needed to run the
algorithm. Subgroup discovery can be done with an exhaustive or heuristic search. Exhaustive
search, such as depth-first or breadth-first, will search all the possibilities and thus guarantee to
find the best subgroups; however, it can easily become very expensive in terms of time. In order
to reduce the number of potential subgroups to evaluate, it is possible to use an heuristic search,
such as beam search. However, due to efficient prune techniques, exhaustive approaches can also
achieve good performances and guarantee to find the best subgroup in complex data such as social
data [AL13]. At the end of the search, the algorithm should return a set of subgroups. Retrieving
a set with high interest and low redundancy is a critical issue in this technique.
When exploring a problem with several variables, which will make the tree large, many candi-
dates are considered for a statistical hypothesis, which may lead to some errors when considering
the subgroup interesting. Thus, it is important to validate the subgroups. Subgroup validation
is poorly explored. However, we can validate a subgroup using Distribution of False Discov-
eries (DFD). DFD consists on generating new subgroups from a version of the dataset (swap-
randomized) in which the correlation with the attributes is destroyed (although the distribution of
the target is maintained). Then, we can determine the p-value for the subgroups retrieved from the
original version of the data, comparing them to the null-hypothesis (the result of DFD). This pro-
cedure is not only valuable to validate subgroups but also to find the best quality measure [DK11].
SD-Map is a Subgroup Discovery algorithm and uses exhaustive search. It makes use of
FP-Growth [HPY00] method which efficiently mines frequent patterns in databases. FP-Growth
uses a special data structure, the FP-tree. FP-tree generates and checks all the candidate patterns,
storing and counting them. Each node in the tree is a tuple (selector, count, node-link). The steps
to build the FP-tree are:
1. Scan the records in the database and collect the set of frequent descriptors, F, and respective
supports. Sort F in support descending order and retrieve L (list of frequent descriptors).
2. • Create a “null" node and define it as root of the tree.
10Background
• For each record in the database select and sort descriptors in according to the order in
L and insert it in the tree using insertInTree([l|L0 ], T ), where l and L0 are the head and
the tail of L, respectively.
• insertInTree([l|L], T ): If T has a child C such that C.item−name = l.item−name, then
increment C’s count by 1; else create a new node C, and let its count be 1, its parent
link be linked to T , and its node-link be linked to the nodes with the same item-name
via the node-link structure. If L0 is nonempty, call insertInTree(L,C) recursively.
Then, FP-growth (in Algorithm 1, where the support of a pattern p is the absolute number of
records covered by p in the database) is called with the parameters FP-tree of the database and
Tree and a null threshold, α: FP-growth(FP-Tree, null). The algorithm returns a complete set
of frequent patterns. For each of these frequent patterns, SD-Map computes the quality of each
subgroup (represented by the pattern) based on the quality function and target. An adaptation of
this algorithm to the problem approached in this work is presented in Chapter 3.
Algorithm 1 FP-growth
Input: Tree, α
Output: Complete set of generated frequent patterns.
1 : if Tree contains a single path P then
2: for all combination (β ) in combinations of nodes in the path P do
3: generate pattern β ∪ α with support = minimum support of nodes in β ;
4: end for
5 : else
6: for all ai in the header of Tree do
7: generate pattern β = ai ∪ α with support = ai .support;
8: construct β ’s conditional patterns base and then β ’s conditional FP-tree Treeβ ;
9: if Treeβ 6= 0/ then
10 : call FP-growth(Treeβ ,β )
11 : end if
12 : end for
13 : end if
The identification of interesting subgroups is an emerging research direction in data mining
and network analysis, in particular social network analysis [Atz18]. Subgroup discovery (as well
as the extended version EMM) are techniques that describe subgroups that behave in an uncommon
way when compared to the overall population. Exceptional behavior discovery, as an approach
based on SD and EMM, provides flexible approaches for data exploration in order to detect inter-
esting and unexpected patterns [Atz16].
2.3 Network Science
Network Science combines ideas from several domains of knowledge so as to address questions
about networks [New10]. A network is a collection of nodes connected with edges and can be
represented like Figure 2.2. We can translate many domains into the form of networks namely
11Background
physical biological, and social scenarios. Representing these scenarios in this way can often lead
to new and useful insights [New10].
A complex network can be represented by a graph [BM76]. A graph G is an ordered triple
(V (G), E(G), ψG ), where V (G) represent the set of vertices, E(G), the edges and ψG is the function
that associates to each edge of G a pair of vertices of V (G). For example: V (G) = {v1 , v2 , . . . , vn },
E(G) = {e1 , e2 , . . . , en } and ψG (e1 ) = (v1 , v2 ). A graph can be directed or undirected. In the
case of G being directed, the output of the function ψG (ei ), (v j , vk ) is ordered and it is known
as a digraph [New10]. Moreover, the graph can have multiple edges, making it a multigraph. If
a multigraph is directed it is a multidigraph and the function ψMG can return the same pair of
vertices for more than one edge.
Studying these networks, we can find levels of description, ranging from the microscopic to
the macroscopic description [DA05]. Microscopic level describes the nodes individually. This
includes degree of centrality (based on the number of links of a node), closeness (based on the
average length of the shortest path between the node and all other nodes in the graph), betweeness
(based on how many shortest paths of the graph go through a node) and pagerank (measured by the
links to a node). More recently proposed microscopic metrics are hubs and authorities [Kle99]. A
hub is a node with many outgoing links to authorities, whereas an authority is a node with many
links from hubs. On the other hand, the macroscopic description translates statistical properties of
the whole network (that usually generalize or model the microscopic level), such as degree distri-
bution, average clustering coefficient, degree correlations, etc. Between these two extreme levels,
there is a ”mesoscopic” one that tries to explain networks’ community structure. Communities are
tightly knit groups within a larger, looser network. When we represent systems in networks, all
these metrics provide powerful knowledge about those systems.
Social networks are networks that represent people or groups of people (nodes) and relation-
ships between them (edges), such as friendships or business connections. These networks are em-
pirically studied by sociologists and usually show strong community structure which are greatly
important for our understanding of the scenarios these networks represent [New06].
Some relationships between people or groups of people are seen as positive or negative. For
example, if two people are considered friends or enemies. This can also be represented through
networks by considering the edges positive or negative. Notice that a negative edge is not the same
as a non-existing edge. Networks like these are called signed networks [New10] and their edges
are signed edges.
Moreover, social interaction networks [WF94] focus on interaction relations between people
as the corresponding actors. In this case, the nodes represent the actors and the edges, the links be-
tween actors, model a interaction or event. These edges may have properties, such as frequency of
occurrence or duration. Furthermore, edges and nodes may have other labels, leading to attributed
networks. From these attributed networks, we can extract and characterize subgroups [Atz18].
In real life, most of the networks are not static; they evolve in several ways and result in
different kinds of patterns. New links and nodes are created over time in many social networks
every time a new actor joins the social network or new interactions (between two actors) occur.
12Background
Figure 2.2: A set of graphs composing a network. The dots represent the nodes and the links
between the nodes are the edges.
Important changes in the network are often caused by external events. This may lead to a number
of important applications such as event and anomaly detection [DACR17].
Network science can then represent interactions over time. These interaction networks may
have temporal properties. We can then extract metrics and measures for a better understanding of
the data as well as important knowledge to complement Subgroup Discovery algorithms.
2.4 Outlier Detection
Sometimes, there are points in the data that deviate from the general behaviour. These points ap-
pear to be inconsistent with the remainder, not belonging to any subgroup and arousing suspicions.
They are known as the outliers [BL94, Haw80]. As such, they can also be seen as exceptional be-
haviour, providing special patterns with meaningful insights [SGD+ 18].
In particular, spatial outliers have been defined as observations with spatial properties whose
non-spatial properties values differ significantly from those in its spatial neighborhood. Thus,
spatial outliers are also divided into global and local outliers [SDYL16]. Local outliers can be seen
as local instability. As an example, a new house in an old neighborhood of a growing metropolitan
area is a spatial outlier when compared to the non-spatial property house age. However, it may not
be an outlier when compared to the general house age of the whole metropolitan area [SLZ03].
A metric for measuring the level of outlierness is the Local Outlier Factor (LOF) [BKNS00].
The LOF reflects how close a point is to other points, translating a degree of isolation. Let k be a
natural number:
• kdistance of an object o is defined as the distance, d, between o and the kth closest object in
the dataset D, ok , meaning that :
– for at least k objects o0 ∈ D\{o}, it holds that d(o, o0 ) ≤ d(o, ok )
– for at most k − 1 objects o0 ∈ D\{o}, it holds that d(o, o0 ) < d(o, ok )
13Background
Figure 2.3: Definitions of reachability, distance and k-distance for Local Outlier Factor if k = 4.
Adapted from [BKNS00]
• The objects o0 whose distance from o is not greater than the k-distance compose the k-
distance neighbourhood, kN, of the object o.
• The reachability distance, reachdistk (o, o0 ), of an object o0 with respect to the object o is
defined as reachdistk (o, o0 ) = max {kdistance(o), d(o, o0 )}.
• local reachability density for a given k, lrdk , of the object o is defined as:
∑o0 ∈kN(o) reachdistk (o, o0 )
lrdk (o) = 1/
|kN(o)|
• Finally, Local Outlier Factor (LOF) of the object o is defined as:
lrdk (o0 )
∑o0 ∈kN(o) lrdk (o)
LOFk (o) =
|kN(o)|
Fig. 2.3 shows the reachability distance of the object o, given k = 4.
Similarly, we can use Voronoi diagrams to measure the outlierness [Qu08]. We define Voronoi
diagram as a subdivision of the objects into Voronoi cells. The Voronoi cell, V (o) for o, is com-
posed of the set of points s in the space that are closer to o than to any other object o0 ∈ D\{o}:
V (o) = {s|d(o, s) ≤ d(o0 , s), ∀o0 ∈ D\{o}}
Fig. 2.4 shows a Voronoi diagram, composed by Voronoi cells.
Outlier detection will then be helpful to find points (or objects) that behave in an exceptional
way. As previously discussed, this can be useful to detect the cases that are not described in any
14Background
Figure 2.4: Voronoi diagram with Voronoi cells delimited by lines, for objects pi . From [Qu08].
of the subgroups. The combination of these two techniques is a novel approach that we use for
discovering exceptional behaviour.
2.5 Summary
In this chapter we revised the important concepts of Spatio-temporal data mining, Subgroup Dis-
covery, Network Science and Outlier detection. Spatio-temporal data mining concerns the analysis
of data with both spatial and temporal properties. Subgroup Discovery is a data mining technique
to identify and describe subgroups that deviate from the overall population regarding a defined
property of interest (target). In addition to the target, the SD algorithms need to have a search
strategy and (at least one) quality measure defined. Network Science provides useful represen-
tations of interaction data as well as metrics, global and local, that provide powerful knowledge
about the data. Finally, we define outliers as points in the data that deviate from the general be-
haviour. All these concepts are connected when defining and studying Exceptional Behaviour
Discovery and are important along this dissertation.
15Background 16
Chapter 3

Related Work

In this chapter, we present the literature review that has motivated this dissertation. This includes
mostly work on Subgroup Discovery (main algorithms developed in the past) and spatio-temporal
data analysis. Moreover, we present outlier detection strategies using this type of data and the
association of data mining techniques with network science and social interactions. Subgroup
Discovery algorithms have been studied for more than 20 years and have brought successful results
in several domains. Subgroup Discovery on data with temporal and spatial properties is also not
new. However, lately spatio-temporal data analysis has been more and more needed as we produce
location data all the time. This type of data is called movement data. We refer some of the
most recent papers that study this type of data in the social and interaction domain. Finally, we
summarize the papers that studied the combination of Subgroup Discovery and network science.

3.1    Subgroup Discovery

Subgroup Discovery algorithms are usually adaptations of other data mining algorithms. Thus,
we can divide them in two main categories: the ones that are extensions of classification algo-
rithms and the ones that are extensions of association algorithms. There is also another smaller
branch dedicated to the extension of evolutionary fuzzy systems. We present them based on their
main characteristics and domain applications. The interpretation of the algorithms was inspired
by [HCGdJ11].
    These algorithms have evolved over time. The first two algorithms appearing were extensions
of classification algorithms, them being EXPLORA [Klö96] and MIDOS [Wro97] in 1996 and
1997, respectively. Later on 2002, Klosgen [KM02a] focus on database integration of spatial
subgroup mining and create SubgroupMiner. This algorithm is also an extension of a classifier
algorithm, along with SD [GL02], CN2-SD [LFKT02], and RSD [LZF02]. APRIORI-SD [KL06,
KLJ03], SD4TS [MRS+ 09], SD-Map [AP06], DpSubgroup [GRW08], Merge-SD [GR09] and
IMR [BG09] extend association algorithms. Finally, Berlanga et al. [BdJG+ 06], Del Jesus et

                                                 17
Related Work
Table 3.1: Characteristics of main algorithms.
Name Target Search strategy Main quality measures
Exhaustive and heuristic Evidence, generality,
Explora Categorical
without pruning redundancy
Midos Binary Exhaustive with pruning Unusualness and size
SubgroupMiner Categorical Beam Search Binomial Test
SD Categorical Beam Search Precision
CN2-SD Categorical Beam Search Unusualness
RSD Categorical Beam Search Unusualness
APRIORI-SD Categorical Beam search with pruning Unusualness
SD4TS Categorical Beam search with pruning Prediction Quality
Piatetsky-Saphiro,
SD-Map Binary Exhaustive with pruning unusualness,
binomial test
Exhaustive search
MergeSD Conitnuos Piatetsky-Saphiro
with pruning
Heuristic Search
IMR Categorical Binomial test
with pruning
SDIGA Nominal Genetic algorithm Confidence and support
Multi-objective
MESDIF Nominal Confidence and support
genetic algorithm
Multi-objective
NMEEF-SD Nominal Confidence and support
genetic algorithm
al.[dJGHM07] and Carmona et al. [CGdJH10] focus on the use of evolutionary algorithms as
heuristics to discover subgroups through fuzzy rules. We have summarized important parameters
of these algorithms in Table 3.1, such as target type, search strategy and main quality measures.
3.1.1 Targets
Targets can be of many types. The most common ones appear in Table 3.1, namely binary, nominal
(or categorical) and numerical. However, these are not the only possible types. Subgroup discov-
ery is very flexible in that sense. In particular, Jorge et al. [JPA06] propose a visual interactive
Subgroup Discovery approach for numerical properties of interest. The procedure shows graphi-
cally the distribution of each subgroup to the analyst along the way, based on statistical measures
of the distribution of the property of interest. The target of this approach is, then, distribution
rules. Another example is when Duivesteijn [dSDSK16b] introduce Exceptional Preference Min-
ing (EPM), a Subgroup Discovery approach where the target concept is a ranking of a fixed set
18Related Work
of labels that aims at finding interesting subgroups (using labelwise and pairwise as quality mea-
sures). Some of the algorithms analyzed can be easily extended for other types of targets (such as
MIDOS). Subgroup discovery is a flexible technique that allows a broad range of targets, based on
what is the intertestigness in the problem.
3.1.2 Search strategy
Regarding the search strategy, these are mainly of three types: exhaustive, heuristic or beam
search. Exhaustive search guarantees the best solution, but if the search space is too large it
can be unaffordable. On the other hand, an heuristic search reduces the subgroups to be evalu-
ated but does not guarantee the finding of the best subgroup. However, there are efficient prune
techniques that make it possible for exhaustive approaches to achieve good performances and
guarantee completeness. For a beam search strategy, discovered subgroups are positively evalu-
ated if they comply with some criteria. The best subgroups, the subgroups which were positively
evaluated are kept in a fixed width beam and in each iteration a conjunction is added to every
subgroup description in the beam. The worst subgroup in the beam is replaced by the best new.
As for the targets, some algorithms are flexible, allowing easy extensions for using other search
strategies [Atz15].
3.1.3 Quality Measures
Quality measures are the key factor for the extraction of knowledge. They define what is in-
tertestigness in a specific problem. There are a wide number of quality measures presented in the
literature depending, precisely, on what is considered to be interesting in a certain problem and
domain.
Quality measures can be based on complexity, generality, interest related to the user and hy-
brid [HCGdJ11]. The ones based on complexity consider the number of rules and the number of
variables. Examples of generality measures are the coverage (percentage of examples covered on
average) and support (frequency of correctly classified examples). The precision measures include
confidence (accuracy) and, of course, precision (measuring the percentage of chosen patterns that
are relevant). Measures of interest which are related to the user include Interest and Novelty. Fi-
nally, the hybrid measures, in which we find Unusualness (this measure is defined as the weighted
relative accuracy of a rule). Depending on the property of interest, the author should choose one
that best fits the problem.
Most of these quality measures, however, do not handle continuous target attributes (or even
ordinal). Pieters et al. [PKD10] provide a list of quality measures for ranked data. For continuous
target attributes, they consider Average, Mean test, z-score, t-Statistic and Median χ 2 Statistic. For
ordinal targets, they consider AUC of ROC (Receiver Operating Characteristic curve to measure
interspersety), among others. Furthermore, Leman et al. [LFK08] describe a number of model
classes and quality measures that can be useful in Exceptional Model Mining. The authors give
examples of three basic types of models for exceptional model mining: correlation, regression
19You can also read


