The PROFOUND Database for evaluating vegetation models and simulating climate impacts on European forests
←
→
Page content transcription
If your browser does not render page correctly, please read the page content below
Earth Syst. Sci. Data, 12, 1295–1320, 2020
https://doi.org/10.5194/essd-12-1295-2020
© Author(s) 2020. This work is distributed under
the Creative Commons Attribution 4.0 License.

           The PROFOUND Database for evaluating vegetation
           models and simulating climate impacts on European
                                forests
          Christopher P. O. Reyer1 , Ramiro Silveyra Gonzalez1 , Klara Dolos2 , Florian Hartig3 , Ylva Hauf1 ,
           Matthias Noack4 , Petra Lasch-Born1 , Thomas Rötzer5 , Hans Pretzsch5 , Henning Meesenburg6 ,
       Stefan Fleck6 , Markus Wagner6 , Andreas Bolte7 , Tanja G. M. Sanders7 , Pasi Kolari8 , Annikki Mäkelä8 ,
               Timo Vesala8 , Ivan Mammarella8 , Jukka Pumpanen9 , Alessio Collalti10,11 , Carlo Trotta11 ,
             Giorgio Matteucci12 , Ettore D’Andrea12 , Lenka Foltýnová13 , Jan Krejza13 , Andreas Ibrom14 ,
           Kim Pilegaard14 , Denis Loustau15 , Jean-Marc Bonnefond15 , Paul Berbigier15 , Delphine Picart15 ,
              Sébastien Lafont15 , Michael Dietze16 , David Cameron17 , Massimo Vieno18 , Hanqin Tian19 ,
         Alicia Palacios-Orueta20 , Victor Cicuendez20 , Laura Recuero20 , Klaus Wiese20 , Matthias Büchner1 ,
              Stefan Lange1 , Jan Volkholz1 , Hyungjun Kim21 , Joanna A. Horemans22 , Friedrich Bohn23 ,
       Jörg Steinkamp24 , Alexander Chikalanov25 , Graham P. Weedon26 , Justin Sheffield27 , Flurin Babst28,29 ,
           Iliusi Vega del Valle1 , Felicitas Suckow1 , Simon Martel16 , Mats Mahnken1 , Martin Gutsch1 , and
                                                        Katja Frieler1
                   1 Potsdam       Institute for Climate Impact Research, Member of the Leibniz Association,
                                               P.O. Box 601203, 14412 Potsdam, Germany
                                     2 Karlsruhe Institute of Technology (KIT), Karlsruhe, Germany
              3 Faculty of Biology and Pre-Clinical Medicine, University of Regensburg, Regensburg, Germany
                         4 Fachagentur Nachwachsende Rohstoffe e.V. (FNR), Gülzow-Prüzen, Germany
         5 Department of Ecology and Ecosystem Management, Technical University of Munich, Munich, Germany
                                  6 Northwest German Forest Research Institute, Göttingen, Germany
                                7 Thünen Institute of Forest Ecosystems, 16225 Eberswalde, Germany
                             8 Department of Forest Sciences, University of Helsinki, Helsinki, Finland
                      9 Biogeochemistry Research Group, University of Eastern Finland, Kuopio, Finland
                     10 National Research Council of Italy, Institute for Agriculture and Forestry Systems

                                                 in the Mediterranean, Perugia (PG), Italy
                11 Department of Innovation in Biological, Agro-food and Forest System, University of Tuscia,

                                                            01100 Viterbo, Italy
                      12 National Research Council of Italy, Institute for Agriculture and Forestry System

                                                in the Mediterranean, Ercolano (NA), Italy
                                       13 Global Change Research Institute, Brno, Czech Republic
             14 Department of Environmental Engineering, Technical University of Denmark, Lyngby, Denmark
                              15 French National Institute for Agricultural Research, Bordeaux, France
                              16 Department of Earth & Environment, Boston University, Boston, USA
                                          17 Centre for Ecology and Hydrology, Edinburgh, UK
                                           18 Centre for Ecology and Hydrology, Lancaster, UK
                          19 School of Forestry and Wildlife Sciences, Auburn University, Auburn, USA
                     20 Departamento de Silvopascicultura, Technical University of Madrid, Madrid, Spain
                        21 Department of Human and Social Systems, University of Tokyo, Tokyo, Japan
                            22 Centre of Excellence PLECO, University of Antwerp, Antwerp, Belgium
                                 23 Helmholtz Centre for Environmental Research, Leipzig, Germany
                       24 Senckenberg Biodiversity and Climate Research Centre, Senckenberg, Germany
                            25 University of Library Study and Information Technology, Sofia, Bulgaria

Published by Copernicus Publications.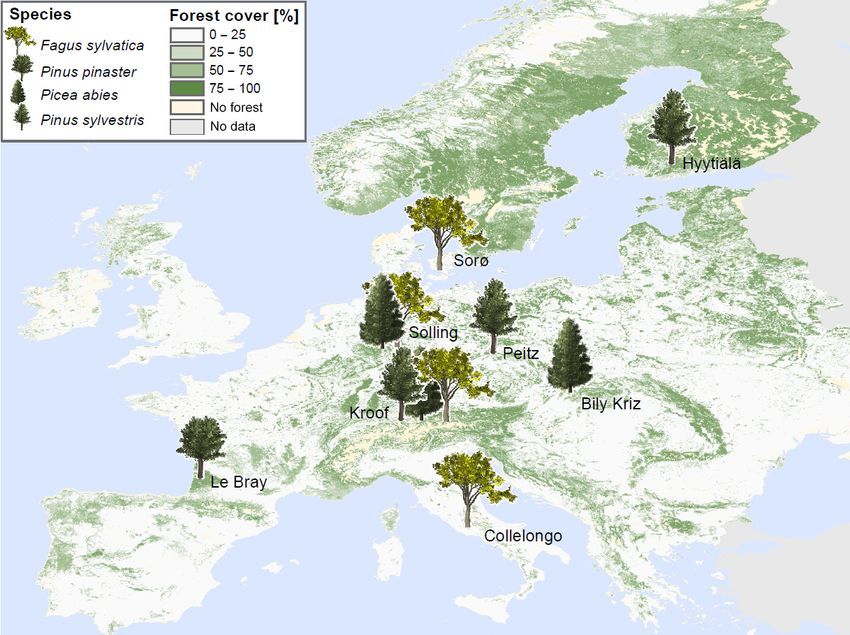
1296                                                                              C. P. O. Reyer et al.: PROFOUND Database

                                                 26 Met  Office, Wallingford, UK
                       27 Dept.   Civil & Environ. Eng., Princeton University, Princeton, NJ 08544, USA
            28 W. Szafer Institute of Botany, Department of Ecology, Polish Academy of Sciences, Cracow, Poland
                               29 Swiss Federal Research Institute WSL, Birmensdorf, Switzerland

                             Correspondence: Christopher P. O. Reyer (reyer@pik-potsdam.de)

                                Received: 5 November 2019 – Discussion started: 29 November 2019
                               Revised: 6 May 2020 – Accepted: 8 May 2020 – Published: 12 June 2020

       Abstract. Process-based vegetation models are widely used to predict local and global ecosystem dynamics
       and climate change impacts. Due to their complexity, they require careful parameterization and evaluation to
       ensure that projections are accurate and reliable. The PROFOUND Database (PROFOUND DB) provides a
       wide range of empirical data on European forests to calibrate and evaluate vegetation models that simulate cli-
       mate impacts at the forest stand scale. A particular advantage of this database is its wide coverage of multiple
       data sources at different hierarchical and temporal scales, together with environmental driving data as well as
       the latest climate scenarios. Specifically, the PROFOUND DB provides general site descriptions, soil, climate,
       CO2 , nitrogen deposition, tree and forest stand level, and remote sensing data for nine contrasting forest stands
       distributed across Europe. Moreover, for a subset of five sites, time series of carbon fluxes, atmospheric heat
       conduction and soil water are also available. The climate and nitrogen deposition data contain several datasets
       for the historic period and a wide range of future climate change scenarios following the Representative Concen-
       tration Pathways (RCP2.6, RCP4.5, RCP6.0, RCP8.5). We also provide pre-industrial climate simulations that
       allow for model runs aimed at disentangling the contribution of climate change to observed forest productivity
       changes. The PROFOUND DB is available freely as a “SQLite” relational database or “ASCII” flat file version
       (at https://doi.org/10.5880/PIK.2020.006/; Reyer et al., 2020). The data policies of the individual contributing
       datasets are provided in the metadata of each data file. The PROFOUND DB can also be accessed via the
       ProfoundData R package (https://CRAN.R-project.org/package=ProfoundData; Silveyra Gonzalez et al., 2020),
       which provides basic functions to explore, plot and extract the data for model set-up, calibration and evaluation.

1 Introduction                                                     while informal methods for calibration and model compar-
                                                                   isons were often used in the past, the community has shifted
Process-based models are key tools for understanding sys-          in recent years towards more formal statistical methods for
tems and forecasting climate change impacts in ecology and         such tasks (Dietze et al., 2013; Hartig et al., 2012), which cre-
Earth system science (Schellnhuber, 1999). Vegetation is a         ates a need for systematic benchmarking data. For all these
crucial component of the Earth system, and forests are par-        tasks, the availability of a wide range of data types crossing
ticularly relevant through their influence on hydrological and     different spatial–temporal scales is generally viewed as ben-
biogeochemical cycles, biodiversity and ecosystem services.        eficial (Grimm and Railsback, 2012).
Process-based vegetation models are used as diagnostic tools          The process of formal calibration, comparison and evalu-
to disentangle the influence of different environmental and        ation of complex vegetation models is often hindered by the
human drivers on biogeochemical cycling as well as vegeta-         availability and the harmonization of suitable data. The data
tion structure from local to plot-level (Eastaugh et al., 2011;    necessary to drive a vegetation model are often complex and
Fontes et al., 2010; Pretzsch et al., 2015; Tiktak and van         need to be compiled from different data sources (e.g. Bag-
Grinsven, 1995) to global scales (Chang et al., 2017; Ito et       nara et al., 2019). In particular for model comparisons, be-
al., 2017). At the same time these models are also the main        sides data for the evaluation of individual models, common
tools to project climate change impacts on vegetation under        input and driving data for process-based vegetation models
changing environmental conditions, again from local (Reyer,        are needed to ensure fair comparisons between the partic-
2015; Rötzer et al., 2013) to global levels (Zhu et al., 2016).    ipating models. Although model comparisons have a long
   With increasing model complexity, the inclusion of more         tradition in vegetation modelling (Cramer et al., 1999, 2001;
and more processes and models being increasingly used as           Bugmann et al., 1996; Morales et al., 2005), they have often
tools for making quantitative projections for policy and man-      been limited by overall data availability and comparability.
agement, there is a strong need to install some quality con-       Common databases that are ready to use for thorough model
trol on their performance. A basic requirement would be that       evaluation would allow the community to gain a better appre-
models are actually able to match observed data. Moreover,         ciation of model differences, explore structural uncertainties

Earth Syst. Sci. Data, 12, 1295–1320, 2020                                         https://doi.org/10.5194/essd-12-1295-2020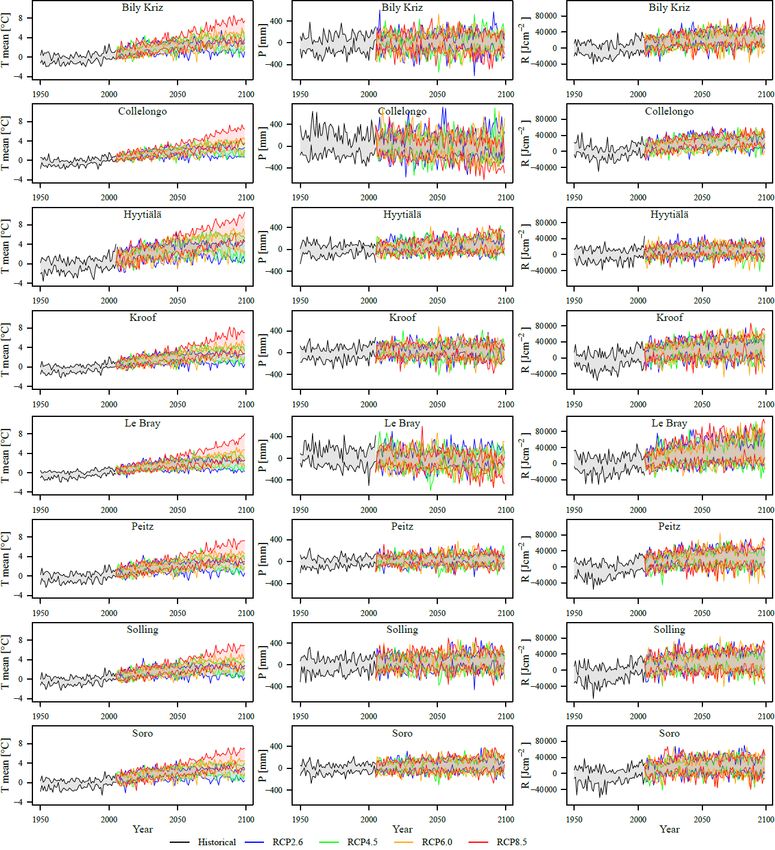
C. P. O. Reyer et al.: PROFOUND Database                                                                                         1297

Figure 1. Location of forest sites and main tree species. Background shows the European forest cover after Brus et al. (2012).

and provide a basis for more systematic ensemble projections            signed to foster comparison of both global/regional models
of climate impacts.                                                     and local models. The climate data, for example, are pro-
   Recently, several initiatives have started compiling model           vided locally (or bias-corrected using local data) in the same
evaluation, input or driving data for a wide range of ap-               way that stand-scale vegetation models would need them and
plications of process-based vegetation models (Huntzinger               also extracted from global gridded datasets that global veg-
et al., 2013; Kelley et al., 2013; Warszawski et al., 2014;             etation models would use. The PROFOUND DB is also de-
Sitch et al., 2015; Collier et al., 2018). Although these ini-          signed to allow for disentangling of uncertainties that affect
tiatives have leveraged important scientific progress, many             quantitative model predictions in ecology (see Lindner et al.,
of them have focussed on the global scale, mostly provid-               2014, and Dietze, 2017, for an explanation of different uncer-
ing evaluation, input and driving data from global products.            tainty types), for example by facilitating standardized evalu-
Such global products generally lack the breadth and depth of            ations of structural or process uncertainties via model com-
process-level detail required to rigorously assess model per-           parisons. Model input and driver uncertainty are addressed
formance at smaller scales as for example they lack long-               through a wide range of climate data from different sources,
term and detailed measurements of forest stand structure.               covering the full range of Representative Concentration Path-
The database for the project “Towards robust projections                ways (RCPs). Collalti et al. (2018, 2019), for example, have
of European forests under climate change” (hereafter PRO-               used the PROFOUND DB to study the effects of thinning on
FOUND DB) described here aims to bring together data from               carbon use efficiency across a combination of all four RCPs
a wide range of data sources to evaluate vegetation models              and five global climate models. Finally, parametric uncer-
and simulate climate impacts at the forest stand scale. It has          tainty can be assessed through the wide range of data that can
been designed to fulfil two objectives:                                 be used for inverse calibration. In the following we describe
                                                                        the main components of the PROFOUND DB (Reyer et al.,
  – to allow for a thorough evaluation of complex, process-             2020) and an R Package (Silveyra Gonzalez et al., 2020) de-
    based vegetation models using multiple data streams                 veloped to explore the database and allow rapid and easy ac-
    covering a range of processes at different temporal                 cess for modellers.
    scales and
  – to allow for climate impact assessments by providing
    the latest climate scenario data.
   The PROFOUND DB only provides data for individual
forest stands but contains a number of elements that are de-

https://doi.org/10.5194/essd-12-1295-2020                                               Earth Syst. Sci. Data, 12, 1295–1320, 2020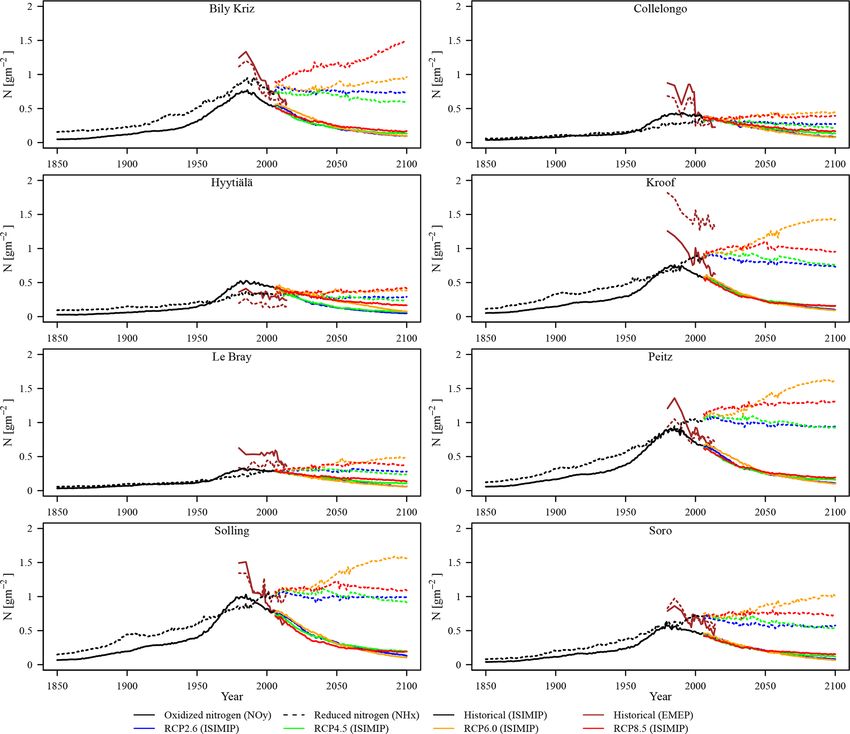
1298                                                                                     C. P. O. Reyer et al.: PROFOUND Database

Table 1. Overview of the data available in the PROFOUND DB. The years indicate the first and the last years for which data are available
except for one-off measurements. The superscript letters indicate the temporal resolution of the data. O: one-off measurement(s); M = 30 min
measurements; D: daily measurements; C: 8 d or 16 d composite; A: annual measurements.

                     Bily Kriz    Collelongo     Hyytiälä       KROOF          Le Bray        Peitz          Solling        Sorø
  Soil               2011O        1995/2008O     1995/1996O     2003/2004O     1995/2003/     2011O          2010O          1997/2004/
                                                                               2004/2005O                                   2006O
  Local climate      2000–2008D   1996–2014D     1996–2014D     1998–2010D     1996–2008D     1901–2010D     1960–2013D     1996–2012D
  Reanalysis         1901–2012D   1901–2012D     1901–2012D     1901–2012D     1901–2012D     1901–2012D     1901–2012D     1901–2012D
  climate
  Climate scenar-    1661–2299D   1661–2299D     1661–2299D     1661–2299D     1661–2299D     1661–2299D     1661–2299D     1661–2299D
  ios (ISIMIP2b)
  Climate scenar-    1950–2099D   1950–2099D     1950–2099D     1950–2099D     1950–2099D     1950–2099D     1950–2099D     1950–2099D
  ios (ISIMIPFT)
  Atmospheric        1765–2500A   1765–2500A     1765–2500A     1765–2500A     1765–2500A     1765–2500A     1765–2500A     1765–2500A
  CO2
  Nitrogen           1861–2100A   1861–2100A     1861–2100A     1861–2100A     1861–2100A     1861–2100A     1861–2100A     1861–2100A
  deposition
  (ISIMIP2b)
  Nitrogen depo-     1980–2014A   1980–2014A     1980–2014A     1980–2014A     1980–2014A     1980–2014A     1980–2014A     1980–2014A
  sition (EMEP)
  Forest tree data   1997–2015A   1992–2012A     2001–2008A     1997–2010A     –              1948–2011A     1967–2014A     1994–2017A
  Forest stand       1997–2015A   1992–2012A     1995–2011A     1997–2010A     1986–2009A     1937–2011A     1967–2014A     1994–2017A
  data
  MODIS              2000–2014C   2000–2014C     2000–2014C     2000–2014C     2000–2014C     2000–2014C     2000–2014C     2000–2014C
  Flux               2000–2008M   1996–2014M     1996–2014M     –              1996–2008M     –              –              1996–2012M
  Meteorological     2000–2008M   1996–2014M     1996–2014M     –              1996–2008M     –              –              1996–2012M
  Atmospheric        2000–2008M   1996–2014M     1996–2014M     –              1996–2008M     –              –              1996–2012M
  heat conduction
  Soil flux series   2000–2008M   1996–2014M     1996–2014M     –              1996–2008M     –              –              1996–2012M

2 The PROFOUND Database                                                 to harmonize the variables as much as possible. The over-
                                                                        all guiding principle for the compilation of the data was to
2.1 Forest site selection and concept                                   provide data that can be easily used by modellers for setting
                                                                        up and evaluating their models. In order to allow for data
The forest sites featured in the PROFOUND DB were se-                   uncertainty to be reflected in model calibration studies, we
lected to provide a wide array of data sources across a Eu-             also included uncertainty estimates for the measured data,
ropean gradient. We focussed in particular on providing long            such as those available for carbon flux measurements (see
time series of tree- and stand-level growth and yield as well           Sect. 3.2.9), wherever possible.
as carbon cycle data available from eddy-flux measurements
because these variables are most commonly in calibrating                2.2 Data sources
and evaluating process-based vegetation models. The se-
lected sites spread along a wide climatic gradient across Eu-           The PROFOUND DB provides information on the site, soil
rope (Fig. 1, Table 3) and cover some of the most common                and forest stand as well as data for climate, atmospheric
European forest types, as well as the main central European             CO2 concentration, nitrogen deposition, carbon fluxes, at-
forest management history of favouring monospecific, even-              mospheric heat conduction and remote sensing at a range
aged forests or mixtures of two tree species.                           of different temporal resolutions (i.e. from 30 min to decadal
   We compiled the data from existing data sources and col-             measurements). Table 1 provides an overview of the different
lected the definitions of variables, their units and information        data types and their temporal resolution available in the PRO-
about the main measurement methods from the site principal              FOUND DB. All variables available are listed in Tables S1–
investigators (PIs) and from official descriptions of the data          S13 in the Supplement. In the following we describe how the

Earth Syst. Sci. Data, 12, 1295–1320, 2020                                                https://doi.org/10.5194/essd-12-1295-2020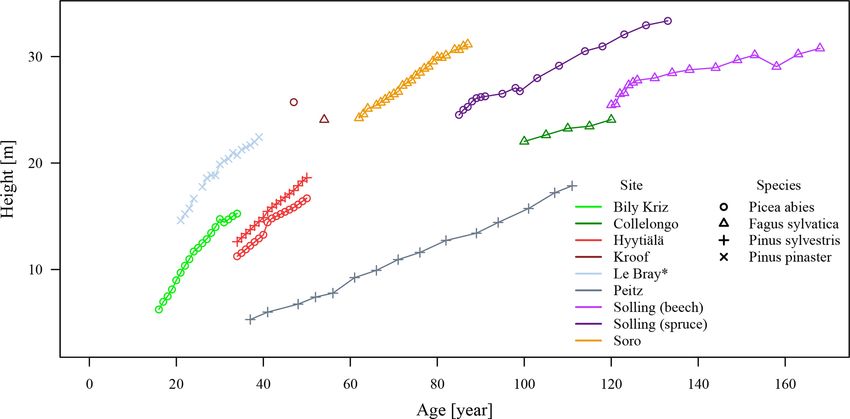
C. P. O. Reyer et al.: PROFOUND Database                                                                                                                       1299

Table 2. Overview of the main site characteristics provided for each forest site in the PROFOUND DB.

                                                                Aspect       Elevation        Slope     FAO soil                     Main tree
   Name                       Lat      Long       Country          (◦ )      (m.a.s.l.)         (%)     typea                        species
   Bily Kriz               49.30      18.32       CZ                180             875        12.5     Haplic Podzol                Picea abies
   Collelongo              41.85      13.59       IT                252            1560          10     Dystric Luvisol              Fagus sylvatica
   Hyytiälä                61.85      24.29       FI                180             185           2     Haplic Podzol                Pinus sylvestris, Picea abies
   KROOF                   48.25      11.40       DE                 1.8            502         2.1     Luvisol                      Picea abies, Fagus sylvatica
   Le Bray                 44.72      −0.77       FR                   –             61           0     Arenosol                     Pinus pinaster
   Peitz                   51.92      14.35       DE                   –             50           0     Dystric Cambisol             Pinus sylvestris
   Solling (beech)         51.77       9.57       DE                225             504           1     Haplic Cambisol              Fagus sylvatica
   Solling (spruce)        51.76       9.58       DE                 90             508           1     Haplic Cambisol              Picea abies
                                                                                                        (dystric, densic)
   Sorø                    55.49       11.64      DK                   –              40           0    Alfisols–Mollisolsb          Fagus sylvatica
 a According to ISSS-ISRIC-FAO (1998). b Depending on base saturation under or over 50 % with a 10–40 cm deep organic layer (see Pilegaard et al., 2003).

individual sub-datasets of the PROFOUND DB have been                                       2.2.4   Reanalysis products
brought together and describe the key variables and charac-
                                                                                           In order to cover longer historical time periods and to assess
teristics of each dataset.
                                                                                           uncertainties due to the choice of different climate inputs, the
                                                                                           PROFOUND DB also provides long historical daily climate
2.2.1     Site information                                                                 time series for each of the sites extracted from four different
For each forest site, the PROFOUND DB contains informa-                                    global reanalysis/observational products:
tion on general site characteristics such as coordinates, ele-
                                                                                             – Princeton’s Global Meteorological Forcing Dataset
vation and forest type (Table 2). There is also information on
                                                                                               (PGMFD v.2, hereafter Princeton) from 1901 to 2012
the potential natural vegetation and main tree species belong-
                                                                                               by Sheffield et al. (2006);
ing to the regional flora (not shown).
                                                                                             – Global Soil Wetness Project Phase 3 (GSWP3) from
2.2.2     Soil data                                                                            1901 to 2010 by Hjungjun Kim (personal communica-
                                                                                               tion, 2018, http://hydro.iis.u-tokyo.ac.jp/GSWP3/, last
The description of the soil profiles contains information                                      access: 5 June 2020);
about physical and chemical properties of each soil horizon
including the organic layer. Unfortunately the soil data are                                 – Water and Global Change programme (WATCH) from
very heterogeneous for the sites, and considerable amounts                                     1901 to 2001 by Weedon et al. (2011);
of data are missing. In order not to lose the data that are avail-
able for only a subset of sites, we did not harmonize the indi-                              – WATCH-Forcing-Data-ERA-Interim (WFDEI) from
vidual variables, but for each site we provide the soil data in                                1901 to 2010 by Weedon et al. (2014).
a consistent format. Despite these limitations, for most sites
                                                                                              Climate variables for the forest stands were extracted from
important soil data such as the depth of horizons, soil texture,
                                                                                           the 0.5◦ ×0.5◦ grid cell of the global reanalysis/observational
bulk density, field capacity, wilting point, carbon and nitro-
                                                                                           product in which the forest stand is located. The data are then
gen content, and pH of the soil solution are available (see
                                                                                           kept at the original 0.5◦ × 0.5◦ resolution to allow for com-
Table S2).
                                                                                           paring the effects of choosing climate inputs for a vegetation
                                                                                           model from a global reanalysis product as opposed to the lo-
2.2.3     Local climate                                                                    cal data presented in Sect. 3.2.3. The difference between the
For every site we compiled the locally observed daily me-                                  local data and the reanalysis data is most obvious for those
teorological data, either from measurement towers or from                                  sites located in complex, hilly terrain such as Collelongo or
nearby meteorological stations. These time series cover the                                KROOF (Table 2). In these hilly locations the grid box av-
main climatic variables required by vegetation models and                                  erage heights of the reanalysis products differ substantially
different time periods for each site (Table 3). They represent                             from the heights of the site measurements.
the best possible climate information for each site and are
most suitable for model simulations comparing simulation                                   2.2.5   Climate scenarios
output to observations.
                                                                                           The PROFOUND DB provides climate                                  scenar-
                                                                                           ios based on simulations performed for                            CMIP5

https://doi.org/10.5194/essd-12-1295-2020                                                                    Earth Syst. Sci. Data, 12, 1295–1320, 2020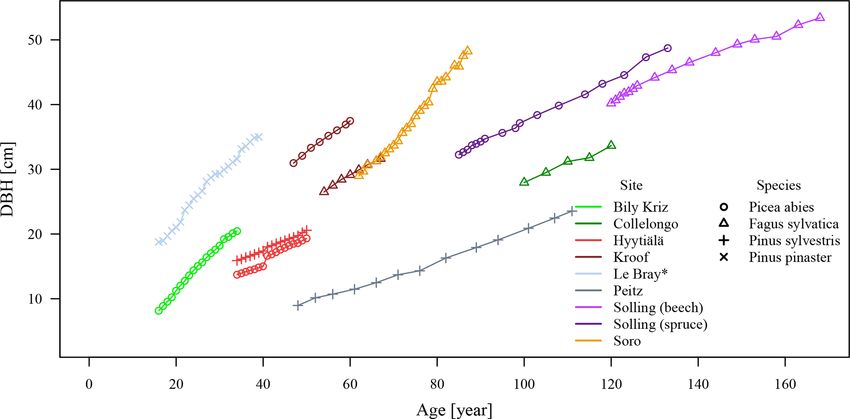
1300                                                                                      C. P. O. Reyer et al.: PROFOUND Database

Table 3. Averages of the daily maximum temperature (Tmax ), daily minimum temperature (Tmin ), daily mean temperature (Tmean ), annual
precipitation sum (P ), daily mean relative humidity (RH), daily mean air pressure (AP), annual sum of global radiation (R, direct + diffuse
shortwave radiation) and daily mean wind speed (W ) for each of the sites in the PROFOUND DB from five different sources: a locally
observed climate and four different global reanalysis/observational products (GSWP3, Princeton, WATCH, WFDEI). The column “Year”
indicates the years for which the mean climates have been calculated for the different sources. Please note that the two Solling sites have the
same climate. NA: not available.

                                                   Tmax     Tmean      Tmin         P        RH          AP             R          W
        Site          Source        Years          (◦ C)     (◦ C)     (◦ C)      (mm)       (%)       (hPa)      (J cm−2 )   (m s−1 )
        Bily Kriz     Local         2000–2008     11.50      7.36      3.80    1434.56     81.99     913.19     378 774.86        2.19
                      GSWP3         2000–2008     12.65      7.66      3.03    1034.22     76.77     957.64     395 464.73        3.71
                      Princeton     2000–2008     12.47      7.67      2.85     914.89     78.77     960.22     402 658.93        3.12
                      WATCH         2000–2001     12.72      8.25      3.43    1124.52     75.08     948.34     322 865.69        2.05
                      WFDEI         2000–2008     12.43      7.66      2.81    1034.40     76.22     950.08     438 978.13        3.25
        Collelongo    Local         1996–2014     11.46      7.24      3.46    1178.62     74.03     849.59     541 888.38        1.73
                      GSWP3         1996–2010     20.64     15.12     10.46     977.40     68.42     903.78     530 247.74        3.83
                      Princeton     1996–2012     20.28     15.17     10.09     757.99     73.76     944.66     539 045.09        4.55
                      WATCH         1996–2001     20.57     15.21      9.99     962.33     69.66     897.07     465 115.41        2.11
                      WFDEI         1996–2010     20.40     15.12     10.22     972.10     75.02     903.20     549 826.57        2.40
        Hyytiälä      Local         1996–2014       7.40     4.36     1.13      604.01     77.95     991.08     309 628.86        3.42
                      GSWP3         1996–2010       8.03     4.00    −0.20      689.08     83.96     998.01     350 511.52        3.42
                      Princeton     1996–2012       7.88     4.06    −0.37      574.87     83.41    1007.97     330 041.85        3.52
                      WATCH         1996–2001       7.93     3.88    −0.17      690.02     81.29     993.85     280 668.38        2.44
                      WFDEI         1996–2010       7.97     4.00    −0.26      668.75     79.23     993.60     328 551.11        2.12
        KROOF         Local         1998–2010     12.99      8.15      3.91     849.46     80.73        NA      391 563.62        1.08
                      GSWP3         1998–2010     14.43      9.65      5.23    1014.37     80.55     954.55     423 260.65        3.04
                      Princeton     1998–2010     14.15      9.66      4.95     772.08     82.05     935.11     433 277.37        3.18
                      WATCH         1998–2001     14.48      9.83      5.39    1061.27     76.35     959.58     337 605.56        2.78
                      WFDEI         1998–2010     14.41      9.65      5.22     976.78     76.67     954.13     431 629.74        2.58
        Le Bray       Local         1996–2008     17.76     13.37      9.39     920.18     76.11    1005.81     472 940.36        3.02
                      GSWP3         1996–2008     19.06     14.23      9.63     918.76     73.90    1014.64     490 253.28        4.90
                      Princeton     1996–2008     18.62     14.24      9.19     951.01     80.41     989.70     484 739.73        4.01
                      WATCH         1996–2001     18.60     13.98      9.34    1095.65     74.66    1021.76     398 738.50        4.28
                      WFDEI         1996–2008     19.20     14.23      9.78     988.57     74.37    1011.63     512 514.20        2.77
        Peitz         Local         1901–2010     13.50      9.02      4.93     533.10     76.37    1008.29     369 794.74        2.35
                      GSWP3         1901–2010     13.48      9.22      5.34     654.19     75.73    1007.39     365 709.48        3.74
                      Princeton     1901–2010     13.20      9.23      5.07     557.89     85.43     999.16     374 370.83        3.51
                      WATCH         1901–2001     13.36      9.06      5.20     601.44     76.93    1007.07     309 797.89        2.79
                      WFDEI         1901–2010     13.47      9.18      5.23     607.58     76.54    1006.45     335 821.69        3.02
        Solling       Local         1960–2013     10.54      6.75      3.39    1113.06     85.56        NA      285 026.90        1.01
                      GSWP3         1960–2010     11.99      8.15      4.67     933.37     79.82     988.95     355 905.60        3.95
                      Princeton     1960–2012     11.76      8.20      4.42     734.76     85.55     995.05     364 950.89        3.75
                      WATCH         1960–2001     11.65      7.79      4.38     962.00     79.38     985.97     300 414.77        2.74
                      WFDEI         1960–2010     11.89      8.14      4.58     963.98     79.21     985.95     353 096.37        3.36
        Sorø          Local         1996–2012     10.66      8.26      5.91     760.52     82.95    1007.71     360 687.83        5.13
                      GSWP3         1996–2010     11.56      9.00      6.58     773.57     78.73    1012.59     376 613.02        5.86
                      Princeton     1996–2012     11.45      9.03      6.44     584.58     81.19    1005.25     363 852.90        4.98
                      WATCH         1996–2001     11.08      8.46      6.26     560.00     82.54    1009.39     343 133.71        5.66
                      WFDEI         1996–2010     11.52      9.01      6.55     640.02     83.06    1009.50     408 098.02        4.81

Earth Syst. Sci. Data, 12, 1295–1320, 2020                                                  https://doi.org/10.5194/essd-12-1295-2020
C. P. O. Reyer et al.: PROFOUND Database 1301 Figure 2. Change in mean annual temperature (T mean), annual precipitation sum (P ) and annual sum of global radiation (R) over the time period 1950–2099 relative to the 1980–2005 average for the ISIMIPFT scenarios. Please note that the two Solling sites have the same climate. https://doi.org/10.5194/essd-12-1295-2020 Earth Syst. Sci. Data, 12, 1295–1320, 2020
1302 C. P. O. Reyer et al.: PROFOUND Database
(https://www.wcrp-climate.org/wgcm-cmip/wgcm-cmip5; improvement of the method of Hempel et al. (2013)
last accessed: 5 June 2020) that were bias-corrected and as described in Frieler et al. (2017) and Lange (2017)
interpolated to a common grid resolution of 0.5◦ × 0.5◦ and the local observed climatologies presented in
according to Hempel et al. (2013). The climate variables for Sect. 3.2.3. The ISIMIP2bLBC data are hence best
each site available were extracted from the grid cell of the suited for scenario studies that require climatic data to
downscaled climate forcing dataset in which the forest plot be as consistent as possible with the observational data
is located. The data can be used in very different ways by (Fig. 3).
the vegetation modelling community.
– The “ISIMIP Fast Track” scenarios (ISIMIPFT) con- 2.2.6 Atmospheric CO2 concentrations
sist of daily climate data available from five different
global climate models (GCMs) (HadGEM2-ES, IPSL- Time series of atmospheric CO2 concentrations are provided
CM5A-LR, MIROC-ESM-CHEM, GFDL-ESM2M and as annual, global data, hence as one time series for all sites
NorESM1-M.) for all four RCPs (Warszawski et al., of the PROFOUND DB assuming a well-mixed atmosphere.
2014). The historical period lasts from 1950 to 2005 and The historical time series of atmospheric CO2 are based on
then splits up into the four RCPs from 2006 to 2099 for global atmospheric CO2 concentrations from Meinshausen
each model. The RCPs cover future warming ranges of et al. (2011) from 1765 to 2005 and have been extended
about 0–9 ◦ C in the late 21st century compared to the for the period 2006–2015 with data from Dlugokencky and
1980–2005 average (Fig. 2). These ISIMIPFT data are Tan (2014). The future annual atmospheric CO2 concentra-
best suited for scenario studies that require a large en- tions follow the four different Representative Concentration
semble of GCMs and RCPs. Pathways (RCPs, RCP2.6, RCP4.5, RCP6.0 and RCP8.5)
from 2016 to 2500 from Meinshausen et al. (2011). Figure 4
– The “ISIMIP2b” scenarios (ISIMIP2b) consist of daily shows the historical increase in CO2 concentrations since
climate data available from four different GCMs (IPSL- 1765 and the projected future emissions according to the dif-
CM5A-LR, GFDL-ESM2M, MIROC5, HadGEM2-ES) ferent RCPs. From RCP2.6 till RCP8.5 the total level of CO2
for RCP2.6 and RCP6.0 (Frieler et al., 2017; Lange, increases strongly, and also the date of stabilizing emissions
2018) as well as RCP4.5 and RCP8.5. The historical is reached much later in RCP8.5. RCP2.6 is the only RCP
period lasts from 1861 to 2005 and then splits up into that projects declining CO2 levels in the long run.
the four RCPs for each GCM from 2006 to 2099. The
RCPs cover future warming ranges of about 1–9 ◦ C in
the late 21st century compared to the 1980–2005 aver- 2.2.7 Nitrogen deposition
age (Fig. S1). For RCP2.6, RCP4.5 and RCP8.5 from The nitrogen deposition data, reported as total deposition of
IPSL-CM5A-LR, HadGEM2-ES and MIROC5, addi- reduced and oxidized wet and dry nitrogen deposition, re-
tional data are also available for the period 2100–2299. spectively, have been extracted for each site of the PRO-
These long-term climatic pathways stabilize at around FOUND DB from two different datasets which serve differ-
1–2 ◦ C in the end of the 23rd century compared to ent purposes.
1980–2005 for RCP2.6, around 3–5 ◦ C for RCP4.5 and
up to 16 ◦ C for RCP8.5. For all four GCMs, there are – EMEP data. For detailed model evaluation studies that
also time series of pre-industrial climatic conditions require the best possible estimates of local nitrogen de-
available from 1661 to 2299 (or 1661–2099 for GFDL- position, we extracted data from the “Co-operative pro-
ESM2M), the so-called pre-industrial control run. The gramme for monitoring and evaluation of long-range
pre-industrial climates from each GCM for the time pe- transmission of air pollutants in Europe” (EMEP) for
riod 1661–1860 can be combined with the historical the time period 1980–2014 (EMEP/CEIP, 2014a, b).
climates from 1861 to 2005 and any future time pe- Sea-salt-corrected data are available from 1980 to 1995
riods from the corresponding GCM to create a long- in 5-year steps and from 1986 to 2014 at annual time
term time series of climate data from 1661 to 2299 (or step and are derived by atmospheric transport modelling
2099 depending on the GCM–RCP combinations) with- (Simpson et al., 2012).
out almost any resampling (Frieler et al., 2017). The
ISIMIP2b data are best suited to test the implications of – ISIMIP data. For model simulation studies, we also
long-term stabilization pathways and different degrees provide nitrogen deposition estimates based on atmo-
of warming relative to pre-industrial conditions in veg- spheric chemistry modelling for a historical time pe-
etation models. riod (1861–2005) and four future scenarios, where ni-
trogen deposition follows the four RCPs. The data are
– The “ISIMIP2b locally bias-corrected” scenarios further described in Lamarque et al. (2013a, b), sea-salt-
(ISIMIP2bLBC) have the same structure as the corrected and consistent with the global nitrogen depo-
ISIMIP2b data but have been bias-corrected using an sition data provided within ISIMIP (Frieler et al., 2017).
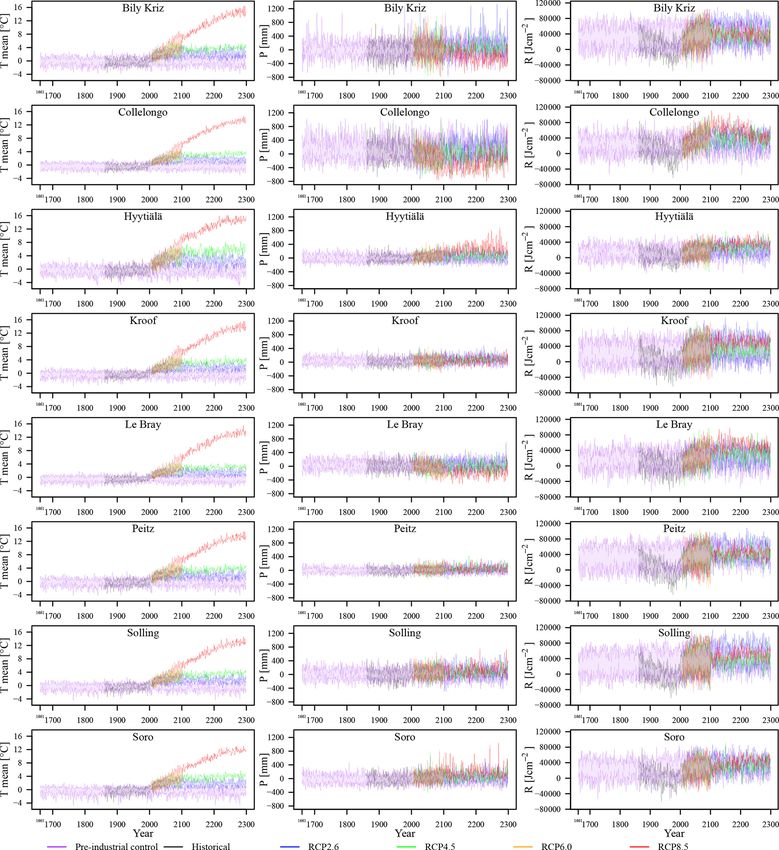
Earth Syst. Sci. Data, 12, 1295–1320, 2020 https://doi.org/10.5194/essd-12-1295-2020C. P. O. Reyer et al.: PROFOUND Database 1303 Figure 3. Change in mean annual temperature (T mean), annual precipitation sum (P ) and annual sum of global radiation (R) over the time period 1661–2299 relative to the 1980–2005 average for the ISIMIP2b locally bias-corrected (ISIMIP2bLBC) scenarios. Please note that the two Solling sites have the same climate. https://doi.org/10.5194/essd-12-1295-2020 Earth Syst. Sci. Data, 12, 1295–1320, 2020
1304                                                                               C. P. O. Reyer et al.: PROFOUND Database

Figure 4. Global atmospheric CO2 concentrations provided for all sites in the PROFOUND DB. The historical time period extends from
1765 to 2015 and the scenarios from 2005 to 2500 for each RCP.

     The data are taken from the global dataset without fur-        the time period 1948–2015. For the Sorø site, the DBH and
     ther corrections and hence are not intended to represent       heights have been reconstructed from tree-ring data (Babst et
     realistic, local forecasts but rather rough estimates of fu-   al., 2014), and the full stand reconstruction is available from
     ture nitrogen projections.                                     1996 to 2010 at annual resolution (see Sect. S1 in the Sup-
                                                                    plement). Individual tree data allow analysis and comparison
   For the 1980–2014 time period, the ISIMIP data are typ-          of model simulations with data on single-tree growth. From
ically lower and less dynamic than the EMEP estimates               the tree data, we calculated a range of widely used stand vari-
(Fig. 5). However, while they do not seem suitable for his-         ables (see Table S8). Additional stand-level data are available
torical model evaluations, they cover a much longer time pe-        for some of the sites, such as leaf litter production or leaf area
riod and are clearly interesting for scenario studies because       index, and have been included (see Table S8).
they feature different nitrogen deposition pathways consis-
tent with RCP climates and CO2 pathways. It is also im-
                                                                    2.2.9   Flux data
portant to note that measured throughfall of NO3 and NH4
is on average lower than modelled total deposition, due to          The carbon fluxes, i.e. net ecosystem exchange (NEE),
canopy uptake (Marchetto et al., 2020). Moreover, for the           ecosystem respiration (RECO) and gross primary production
two Solling sites the data presented here are identical while       (GPP) are taken from the Tier One FLUXNET2015 dataset
in reality total N deposition rates in the spruce stand should      (http://fluxnet.fluxdata.org/, last access: 5 June 2020). We
be higher because of higher dry depositions. Actually, the          provide estimates of fluxes calculated using different esti-
ratio between Solling spruce and Solling beech is 1.4 for           mates for gap-filled and partitioned fluxes to give a rough
NH4 throughfall fluxes, 1.6 for NO3 throughfall fluxes, 1.4         estimate of the uncertainty added to the long-term bud-
for NH4 total deposition and 1.4 for NO3 total deposition,          gets in the process. NEE data are filtered using two dif-
both using a canopy budget model (Ulrich, 1994) for the pe-         ferent methods to calculate uStar thresholds (Barr et al.,
riod 1980–2014. However, these ratios are not constant and          2013, and a modified version of Papale et al., 2006; see also
show an increasing trend over time.                                 FLUXNET2015, 2017). Daytime (i.e. Lasslop et al., 2012)
                                                                    and night-time (i.e. Reichstein et al., 2005) refer to whether
2.2.8   Forest inventory data
                                                                    ecosystem respiration parameters were estimated from only
                                                                    night-time fluxes or also using daytime data (zero intercept of
For each site, the PROFOUND DB provides information                 GPP light response curve). In many cases the number of ac-
about the forest stand at tree and stand level (Table 4). The       cepted night-time fluxes is low and the temperature range is
data are available for different time periods and have differ-      narrow, which leads to high uncertainty in the estimated res-
ent measurement intervals, but generally they cover mostly          piration. This can be improved by also using daytime fluxes.
the second half of the 20th century and the first decade of         On the other hand in the daytime method the uncertainties of
the 21st century (Table 1). The data also cover a wide ar-          photosynthetic light, temperature and possible vapour pres-
ray of height–age and diameter at breast height (DBH)–age           sure deficit (VPD) responses may be attributed to respira-
relationships (Figs. 6–7). For seven out of nine sites individ-     tion parameters. Further information about the daytime and
ual tree DBH and height measurements are available. The             night-time methods is available in Lasslop et al. (2010) and
time series length ranges between 15 and 65 years within            Reichstein et al. (2005) and also FLUXNET2015 (2017). We

Earth Syst. Sci. Data, 12, 1295–1320, 2020                                           https://doi.org/10.5194/essd-12-1295-2020
C. P. O. Reyer et al.: PROFOUND Database 1305
Figure 5. Total deposition of reduced (NHx ) and oxidized (NOy ) nitrogen (N) at each of the sites of the PROFOUND DB. The historical
period for the EMEP data extends from 1980 to 2014 and for the historical ISIMIP data from 1861–2005. The future scenarios are available
from 2006 to 2100 and follow the RCP2.6 and RCP6.0 scenarios. Please note that the two Solling sites have the same N depositions (see text
for further explanations).
also extracted different uncertainty estimates for each vari- 2.2.10 Remote sensing data
able. Additionally, we provide time series of the sensible and
latent heat flux, soil (soil water and soil temperature) and The PROFOUND DB includes remote sensing information
meteorological variables at a 30 min time resolution from at different spatial scales and temporal frequencies, specific
the FLUXNET2015 database including measurement uncer- for each product. We included five MODIS products (ORNL
tainty estimates. Table 5 provide an overview of the main DAAC, 2008a–e) and several vegetation indices calculated
carbon fluxes at each of the sites featured in the PROFOUND from the surface reflectance data for each of the forest sites.
DB. Tables S9 and S11–S13 provides the full list of available The original MODIS scenes are available at the NASA Land
variables. Processes Distributed Archive Center (LP DAAC) (https:
//lpdaac.usgs.gov/, last access: 5 June 2020). The specific
time series included in the PROFOUND DB were down-
loaded from the Land Product Subset Web Service of the
Oak Ridge National Laboratory Distributed Active Archive
https://doi.org/10.5194/essd-12-1295-2020 Earth Syst. Sci. Data, 12, 1295–1320, 20201306 C. P. O. Reyer et al.: PROFOUND Database
Table 4. Summary of the main stand variables for the forest stands in the PROFOUND DB. The first number in each cell indicates the value
at the first measurement and the second number at the last measurement. The basal area-weighted mean height and DBH are shown for
all stands with the exception of Le Bray for which the arithmetic mean height and DBH are shown (marked by asterisks). The numbers in
brackets indicate different data availability for height than for the other variables.
No of. DBH Height BA Age Stem density
Name Main species obs. Year (cm) (m) (m2 ha−1 ) (year) (ha−1 )
Bily Kriz Picea abies 19 1997–2015 8.16–20.47 6.26–15.26 10.33–36.96 16–34 2408–1252
Collelongo Fagus sylvatica 5 1992–2012 27.95–33.65 22.03–24.08 32.25–43.76 100–120 905–740
Hyytiälä Picea abies 17 1995–2011 13.74–19.32 11.24–16.7 2.96–3.8 34–50 965–770
Hyytiälä Pinus sylvestris 17 1995–2011 15.89–20.58 12.61–18.62 12.64–18.33 34–50 870–684
KROOF Picea abies 8 1997–2010 30.96–37.49 (25.73) 30.26–39.66 47–60 512–434
(1) (1997)
KROOF Fagus sylvatica 8 1997–2010 26.5–31.64 (24.07) 12.44–13.2 54–67 324–220
(1) (1997)
Le Bray∗ Pinus pinaster 24 1986–2009 18.76–35.01 (14.61–22.44) 23.3–19.19 16–39 819–195
(18) (1991–2009)
Peitz Pinus sylvestris 13 1948–2011 8.96–23.54 6.75–17.86 20.66–36.36 48–111 4150–886
Solling (beech) Fagus sylvatica 16 1967–2014 40.19–53.4 25.45–30.78 26.99–25.52 120–168 245–130
Solling (spruce) Picea abies 17 1967–2014 32.25–48.74 24.51–33.36 44–49.46 85–133 595–290
Sorø Fagus sylvatica 24 1994–2017 28.99–48.25 24.23–31.15 18.50–29.76 62–87 407–199
Figure 6. Time series of tree diameter at breast height (DBH) versus age of the forest stands in the PROFOUND DB. The basal area-weighted
mean DBH is shown for all stands with the exception of Le Bray for which the arithmetic mean DBH is shown (marked by asterisks). For
Sorø, the DBHs have been reconstructed (see text in Sects. 4.9 and S1).
Center (ORNL DAAC) (https://daac.ornl.gov/MODIS/, last In any case the alteration of the original data was minimal.
access: 5 June 2020). The ORNL DAAC MODIS subsetting It is also important to note that the size of the pixel is large
web service is implemented to allow users access to mas- compared to the plot size of the forest stands, which means
sive amounts of remote sensing data (Santhana-Vannan et al., the pixel data also contain other vegetation types than the
2011). In addition, a second set of vegetation indexes was ones present at the sites.
calculated from the reflectance values. A summary of this in- Three general types of data are included: (1) geophysi-
formation is shown in Table 6. The full list of variables and cal variables as measured from the MODIS sensor, i.e. re-
how they were aggregated is provided in Table S10. flectance and temperature; (2) spectral indexes derived di-
The main difference among the forest sites is the data qual- rectly from reflectance values at different wavelengths; and
ity, which is highly dependent on the presence of clouds. (3) vegetation properties (i.e. FPAR, LAI, GPP and net pho-
When possible, low-quality observations have been substi- tosynthesis) as estimated from physical variables through a
tuted by interpolated values, otherwise the cell was left blank. range of models.
Earth Syst. Sci. Data, 12, 1295–1320, 2020 https://doi.org/10.5194/essd-12-1295-2020C. P. O. Reyer et al.: PROFOUND Database 1307
Figure 7. Time series of tree height versus age of the forest stands in the PROFOUND DB. The basal area-weighted mean height is shown
for all stands with the exception of Le Bray for which the arithmetic mean height is shown (marked by ∗ ). For Sorø, the heights have been
reconstructed (see text in Sects. 4.9 and S1).
Table 5. Summary of the observed carbon fluxes at the sites in the PROFOUND DB. Shown is the range (min and max) and the average (in
brackets) of the annual sums in the observational period. All data are estimates based on the CUTRef method with daytime data included for
RECO and GPP. GPP is expressed with negative values because it is considered a downward flux from the atmosphere. Likewise, negative
NEE values indicate a carbon sink and positive values a carbon source.
Name Years NEE (t C ha−1 ) RECO (t C ha−1 ) GPP (t C ha−1 )
Bily Kriz 2000–2008 −9.117 to −3.277 (−6.52) 5.478 to 10.295 (7.918) −20.477 to −11.071 (−16.577)
Collelongo 1996–2014 −25.129 to −3.36 (−8.152) 4.495 to 15.936 (8.079) −26.675 to −5.259 (−16.546)
Hyytiälä 1996–2014 −8.167 to −1.22 (−2.49) 1.668 to 11.511 (8.943) −14.984 to −10.0 (−11.709)∗
Le Bray 1996–2008 −7.396 to 0.104 (−3.915) 8.236 to 21.609 (14.569) −23.651 to −12.648 (−19.455)∗
Sorø 1996–2012 −8.245 to 0.892 (−1.92) 15.147 to 22.345 (17.335) −23.832 to −15.873 (−19.163)
∗ The year 2007 is without data for Hyytiälä and the year 2002 for Le Bray.
Although the MODIS sensor acquires daily information, the MOD09A1 product at 500 m spatial resolution. The cri-
the PROFOUND DB includes only composite data; that is, teria for the compositing process are low cloudiness, cloud
for each pixel the best value during a period of time (8 or shadows and low solar zenith angle; when several of these
16 d) is selected as being representative of that specific pe- criteria are fulfilled the selection is based on the minimum
riod. Spatial resolution is also specific for each product and value in the blue band (Vermote et al., 2015).
is dependent on the physical and technical limitations in the The second set of spectral indexes was computed from
acquisition process of the variables involved in the product the MOD09A1 product. The indices based on the spectral
computation. shape have the advantage of combining information on three
The NDVI and EVI at 250 m spatial resolution com- bands instead of two, and when the bands used are located
ing from the MOD13Q1 product were calculated from the in the SWIR region relevant information related to water is
visible and near-infrared spectral regions. A temporal fre- captured (Palacios-Orueta et al., 2005; Khanna et al., 2007;
quency (16 d composite) was chosen to minimize the effect Palacios-Orueta et al., 2012).
of clouds. The EVI index was developed to correct for at- LAI is defined as the one-sided green leaf area per unit
mospheric and background effects so that it shows a larger ground area in broadleaf canopies and as one-half the to-
dynamic range in areas with high vegetation density (Didan tal needle surface area per unit ground area in conifer-
et al., 2015). ous canopies. The FPAR is the fraction of photosyntheti-
The spectral profiles in the whole optical domain (i.e. 459– cally active radiation (400–700 nm) that is absorbed by the
2155 nm) for each 8 d composite are represented by the sur- canopy (Myneni, 2015). Gross primary productivity and net
face spectral reflectance at seven wavelengths coming from photosynthesis estimations are based on the light use ef-
https://doi.org/10.5194/essd-12-1295-2020 Earth Syst. Sci. Data, 12, 1295–1320, 20201308 C. P. O. Reyer et al.: PROFOUND Database
Table 6. Summary of the remote sensing data included in the PROFOUND DB. VIS, NIR and SWIR are the visible, near-infrared and
shortwave infrared regions of the electromagnetic spectrum. NDVI: normalized difference vegetation index; EVI: enhanced vegetation in-
dex; FPAR: fraction of photosynthetically absorbed radiation; LAI: leaf area index; GPP: gross primary productivity; NDWI: normalized
difference water index; AR: angle at red; ANIR: angle at NIR; AS1: angle at shortwave infrared 1; AS2: angle at shortwave infrared 2; SANI:
shortwave angle slope index; SASI: shortwave angle slope index.
MODIS Spatial Temporal
Variable source resolution (km) frequency (d) Time period
Reflectance (%) at seven spectral bands MOD09A1 0.5 8 2000–2015
in the optical domain VIS–NIR–SWIR
Land surface temperature (night & day, MOD11A2 1 8 2000–2015
kelvin)
NDVI, EVI MOD13Q1 0.25 16 2000–2015
FPAR, LAI MOD15A2 1 8 2000–2015
(dimensionless −1,1)
GPP & net photosynthesis MOD17A2 1 8 2000–2014
(g C m−2 d−1 )
EVI, NDVI, NDWI Ratio indexes calculated from 0.5 8 2000–2015
(dimensionless −1,1) MOD09A1
AR, ANIR, AS1, AS2 Angular indexes calculated 0.5 8 2000–2015
(radians, 0–3.14) from MOD09A1
SANI (−3.14–3.14) Angular normalized indexes 0.5 8 2000–2015
SASI (−314–314) calculated from MOD09A1
Table 7. Generic future management scenarios for the main tree species featured in the PROFOUND DB.
Thinning Intensity (% of Interval Stand age for
Species regime basal area) (yr) final harvest References
Pinus sylvestris below 20 15 140 Pukkala et al. (1998), Fürstenau et al. (2007),
González et al. (2005), Lasch et al. (2005)
Picea abies below 30 15 120 Pape (1999), Pukkala et al. (1998), Hanewinkel
and Pretzsch (2000), Sterba (1987), Lähde et al.
(2010)
Fagus sylvatica above 30 15 140 Schütz (2006), Mund (2004), Hein and Dhôte
(2006), Cescatti and Piutti (1998)
Quercus robur/petraea above 15 15 200 Hein and Dhôte (2006), Fürstenau et al. (2007),
Štefančík (2012), Kerr (1996), Gutsch et al.
(2011)
Pinus pinaster below 20 10 45 Loustau et al. (2005), De Lary (2015), Banos et
al. (2016)
ficiency (LUE) concept (Monteith, 1972) using satellite- 3 Description of the forest sites
derived FPAR (from MOD15) and independent estimates
of PAR, besides other types of ancillary data. These are The most northern site is Hyytiälä in Finland with a boreal
highly aggregated variables that have gone through several climate, while the most southern sites are Le Bray in France
modelling steps already. Detailed information on the model and Collelongo in Italy with an oceanic and Mediterranean
and information sources used can be found in Running and montane climate, respectively. All other sites represent tem-
Zhao (2015). perate climatic conditions ranging, however, from oceanic
Earth Syst. Sci. Data, 12, 1295–1320, 2020 https://doi.org/10.5194/essd-12-1295-2020C. P. O. Reyer et al.: PROFOUND Database 1309
Table 8. Planting information for the sites included in the PROFOUND DB. The numbers in brackets indicate plausible ranges (NA: not
available).
Density Age Height Age when DBH is
Name (ha−1 ) (years) (m) reached (years) Remarks
Bily Kriz 4500 4 0.5 9 Historical planting density was
5000 ha−1 but current practices are
4500 ha−1 only.
Collelongo 10 000 4 1.3 4 Only a rough approximation; usually
natural regeneration is the regeneration
method. DBH = 0.1 cm at height 1.3 m.
Hyytiälä 2250 (2000–2500) 2 0.25 (0.2–0.3) 6 (5–7) Regenerate as pure pine stand.
KROOF (beech) 6000 (5000–7000) 2 0.6 (0.5–0.7) 5 The planting density is for single-
species stands; hence when regenerat-
ing the two-species-stand KROOF, the
planting density of each species should
be halved.
KROOF (spruce) 2250 (2000–2500) 2 0.35 (0.3–0.4) 7 The planting density is for single-
species stands; hence when regenerat-
ing the two-species-stand KROOF, the
planting density of each species should
be halved.
Le Bray 1250 (1000–14 000) 1 0.2 (0.1–0.25) 3 (2–5) These are the current practices (De
Lary, 2015) and should be used for fu-
ture regeneration. Historically, the site
was seeded with 3000–5000 seedlings
per hectare and then cleared once or
twice to reach a density of 1250 ha−1
at 7 years old when seedlings reach the
size for DBH recruitment.
Peitz 9000 (8000–10 000) 2 0.175 (0.1–0.25) 5 The “age when DBH is reached = 5” is
an estimate.
Solling (beech) 6000 (5000–7000) 2 0.6 (0.5–0.7) 5 The actual stand was established in
1847 from natural regeneration. Until
the beginning of measurements in 1966,
the stand was regularly thinned. All fig-
ures in the table are estimates. Natu-
ral regeneration is the recommended re-
generation method of stand establish-
ment; stem count in 2014: 130.
Solling (spruce) 2250 (2000–2500) 2 0.35 (0.3–0.4) 7 The actual stand was planted in 1891 on
a former meadow. Until the beginning
of measurements in 1966, the stand was
regularly thinned. All figures in the ta-
ble are estimates; stem count in 2014:
290.
Sorø 6000 4 0.82 6 Planted in 1921, with stem count of
288 ha−1 in 2010 (Wu et al., 2013).
https://doi.org/10.5194/essd-12-1295-2020 Earth Syst. Sci. Data, 12, 1295–1320, 20201310 C. P. O. Reyer et al.: PROFOUND Database
(Belgium, Denmark) to temperate (France, Germany) to sub- 3.3 Hyytiälä (FI)
continental (Czech Republic). Unfortunately, sites represent-
ing more continental and (east) Mediterranean forests from The most northern site included in the PROFOUND DB is
southern and southeastern Europe are missing. the ICP Forests Level II site Hyytiälä, Finland. It is also a
FLUXNET site and the coldest site with an annual temper-
ature of 4.4 ◦ C and 604 mm annual precipitation during the
3.1 Bily Kriz (CZ)
1996–2014 period and lies at 185 m a.s.l. The soil is classi-
The Bily Kriz site belongs to the ICP Forests Level II net- fied as a Haplic Podzol. Picea abies is the naturally dominant
work and is a FLUXNET site located in the Moravian– tree species building Fennoscandian moss-rich spruce forests
Silesian Beskydy Mountains, Czech Republic, at an altitude with Pinus sylvestris. A Pinus sylvestris stand was sown
of 875 m a.s.l. The climate is temperate with an annual mean in 1962, today with admixtures of Picea abies and hard-
temperature of 7.4 ◦ C and an annual precipitation sum of wood species (Betula pendula, Betula pubescens and Pop-
1434 mm over the 2000–2008 period. The soil is classified as ulus tremula). Mean DBHs were 17 cm for P. sylvestris, 5 cm
a Haplic Podzol. The site is typical for mountain regions of for P. abies and 7 cm for hardwood species in the year 2008.
temperate Europe such as the Black Forest, Bohemian Forest More information about the site can be found in Haataja and
Šumava and forested Carpathians (Hercynian (spruce–)fir– Vesala (1997), Rannik et al. (2004), Vesala et al. (2005), Il-
beech forests) but also the higher mountain belts in the (sub- vesniemi et al. (2009), Mammarella et al. (2009), and Ilves-
)Mediterranean. Stand-forming tree species for such sites are niemi et al. (2010).
Fagus sylvatica, Abies alba and Picea abies. Currently, a
large part of mixed mountain forests are strongly managed 3.4 KROOF (DE)
for timber production. The main tree species occurring in
Bily Kriz are Picea abies, rarely with a small proportion The KROOF forest belongs to the “Kranzberg Forest Roof
of Fagus sylvatica. The stand data represent an (even-aged) Experiment” of the Technical University of Munich (TUM)
Picea abies monoculture with a mean DBH of 19 cm (year and the Helmholtz Zentrum München. The site is located
2015). The potential vegetation belongs to the geobiocoene- close to Freising, Germany, in the Kranzberger Forst in
type groups: Abieti-fageta (5AB3) – Abies alba Mill. + Fa- 502 m a.s.l. (wc-alt.). Mean annual temperature is around
gus sylvatica L. with understory: Calamagrostis arundinacea 8.2 ◦ C, and annual rainfall is around 849 mm during the pe-
(L.) Roth, Oxalis acetosella L., Vaccinium myrtillus L., De- riod 1998–2010. The soil type, Luvisol, is typical for the re-
schampsia flexuosa (L.) Trin. More information about the site gion. The potential natural vegetation is (sessile oak–) beech
can be found in Kratochvilova et al. (1989) and Meteorolog- forest (Fagus sylvatica, Quercus petraea, Quercus robur).
ical yearbook (2012). The establishment of the research plot dates back to 1992.
The mixed stand comprises large groups of Fagus sylvat-
3.2 Collelongo (IT) ica surrounded by Picea abies with mean DBHs of 26 and
33 cm in 2010, respectively. Other occurring species are Acer
The experimental site of Collelongo is located in Selva Pi- platanoides (20 cm), Pinus sylvestris (31 cm), Larix decidua
ana, a pure Fagus sylvatica forest in Collelongo (AQ, central (26 cm) and Quercus robur (29 cm). More information about
Italy) at 1560 m a.s.l. Located 100 km from Rome, it is one of the site can be found in Pretzsch et al. (1998, 2014) and
the first Italian sites of the ICP network and also part of the Matyssek et al. (2014).
ILTER international network. The climate is Mediterranean
montane, with a mean annual temperature of 7.2 ◦ C and a
mean annual precipitation of 1179 mm in the period 1996– 3.5 Le Bray (FR)
2014. Bedrock consists of Cretaceous limestone. Soil depth
The ICP Forests site Le Bray is located 20 km southwest
exhibits high spatial variability ranging from 40 to 100 cm
of Bordeaux, France, at an altitude of 61 m a.s.l. Mean
and is classified as a Humic Alisol (Chiti et al., 2010) or Dys-
annual temperature is about 13.4 ◦ C, and precipitation is
tric Luvisol according to the FAO classification. The stand is
920 mm during the 1996–2008 period, constituting a moder-
a typical Apennine beech forest dominated by Fagus sylvat-
ate oceanic climate. The soil type is Arenosol (sandy and hy-
ica with sporadic trees of Taxus baccata. The phytosociologi-
dromorphic podzol), which is one of the most common soils
cal association is Polysticho – Fagetum (Feoli and Lagonegro
in the region. The natural vegetation is formed by deciduous
1982). Currently, Collelongo constitutes a managed Fagus
broadleaf forests such as pedunculate oak forests (Quercus
sylvatica stand with mean DBH of 25 cm in 2012. In the area
robur), partly with Quercus pyrenaica, Quercus suber and
around the eddy-flux tower there are only Fagus sylvatica
Pinus pinaster. The first measurements were made in 1986
trees. Moreover the footprint of the tower is totally included
in the monospecific planted Pinus pinaster stand. The site
in the Fagus sylvatica forest. More information about the site
experienced a storm in 1999 and lost a large number of trees.
can be found in Chiti et al. (2010), Collalti et al. (2016) and
In 2009, the mean DBH was 35 cm. The final clear cut of
D’Andrea et al. (2019).
the site occurred at the beginning of 2009. More information
Earth Syst. Sci. Data, 12, 1295–1320, 2020 https://doi.org/10.5194/essd-12-1295-2020C. P. O. Reyer et al.: PROFOUND Database 1311
about the site can be found in Porté and Loustau (1998), Bosc Potential natural vegetation is a Luzulo luzuloido Fagetum.
et al. (2003) and Berbigier et al. (2001). Dominant species of the actual ground vegetation are Vac-
cinium myrtillus, Polytrichum formosum and Deschampsia
3.6 Peitz (DE)
flexuosa (Bolte et al., 2004). The forest is a 133-year-old Nor-
way spruce (Picea abies) stand with a mean DBH of 46.6 cm
Peitz is a long-term research plot in eastern Brandenburg, and a mean height of 33.1 m in 2016. More information about
Germany. The site lies at about 50 m a.s.l. The annual rain- the site can be found in Le Mellec et al. (2010), Bonten et
fall amounts to more than 608 mm, and annual mean temper- al. (2011), Meesenburg et al. (2016), Fleck et al. (2016) and
ature is around 9.2 ◦ C during the 1901–2010 period. The soil Wegehenkel et al. (2017).
type is a Dystric Cambisol. The potential natural vegetation
is a south Scandinavian, east central European dwarf shrub 3.9 Sorø (DK)
and lichen-rich pine forest mix (Pinus sylvestris), partly
with Quercus robur in the understorey, with Vaccinium vitis- The ICOS site Sorø (DK-Sor in the FLUXNET and ICOS
idaea, Calluna vulgaris, Cladina spp. and Dicranum poly- databases) is located in Denmark at an elevation of 40 m a.s.l.
setum on sandy soils and siliceous rocks. The forest is a pine The climate is warm temperate and fully humid with a mean
forest (Pinus sylvestris) with a mean DBH of around 23 cm annual temperature of 9 ◦ C and annual precipitation sum of
and a stand height of 17 m in 2011. The understorey consists 774 mm during the period 1996–2010. The soil has been
partly of Quercus robur. Measurements were started in 1948. classified as Alfisols and Mollisols. Potential natural vege-
More information about this site can be found in Riek and tation is deciduous broadleaved forest dominated by Fagus
Stähr (2004) and Noack (2011, 2012) and about the climate sylvatica. Other species occurring in the area are Fraxinus
data in Gerstengarbe et al. (2015). excelsior, Larix decidua, Picea abies, Quercus spp. and Acer
spp. However, the region is mostly used as cropland. Data
on tree DBH are reconstructed from tree-ring measurement
3.7 Solling beech (DE) (Babst et al., 2014) and historical management information
Solling 304 is a long-term intensive forest monitoring plot for the time period from 1994 to 2017. Stand data are derived
(Level II) of the ICP Forests network in central Germany. from these data for the time period from 1994 to 2017 (see
The plot is also part of the LTER (site LTER_EU_DE_009) Sect. S1). The mean DBH of this Fagus sylvatica stand was
and of the permanent soil monitoring programme of the state 41 cm in the year 2017. More information about the site can
of Lower Saxony. The site is situated in the centre of the be found in Ladekarl (2001), Pilegaard et al. (2003, 2011)
Solling plateau at an elevation of about 500 m a.s.l. The mean and Wu et al. (2013). More information about the site can be
temperature was around 6.8 ◦ C and the mean annual rain- found in Ladekarl (2001), Pilegaard et al. (2003, 2011) and
fall amounted to 1113 mm during the period 1960–2013. The Wu et al. (2013).
bedrock consist of Triassic sandstone covered with a 60 to
80 cm deep solifluction layer of loess material from which 4 Forest management of the sites
the soil, classified as an Haplic Cambisol, has developed. The
humus type is a typical Moder. The tree layer consists only of The sites available in the PROFOUND DB are managed
European beech (Fagus sylvatica L.). Oxalis acetosella and forests, and the historic management can be derived from the
Luzula luzuloides are the major species of the sparse ground tree and stand-level data (in terms of reduction of stem num-
vegetation. Actual vegetation was assigned to the Luzulo- bers). However, for future scenario studies, generic, simple
Fagetum typicum and is close to the potential natural veg- management and planting guidelines are available (Tables 7–
etation. The forest is a 168-year-old stand with a mean DBH 8). This future management corresponds best to “intensive
of 50 cm and a mean height of 30.7 m in 2016. More infor- even-aged forestry” as defined by Duncker et al. (2012).
mation about the site can be found in Meiwes et al. (2009),
Meesenburg et al. (2009, 2016), Panferov et al. (2009), Le 5 The PROFOUND R package (ProfoundData)
Mellec et al. (2010), and Fleck et al. (2016).
The ProfoundData R package provides functions to access
3.8 Solling spruce (DE) the PROFOUND DB (Figs. S2 and S3). The ProfoundData
package plus a detailed vignette explaining the functional-
Solling 305 is also a long-term intensive forest monitoring ities are available on CRAN (https://CRAN.R-project.org/
plot of the ICP Forests Level II network in central Ger- package=ProfoundData, last access: 5 June 2020). The Pro-
many. As the Solling beech site it belongs to the LTER foundData package serves as an interface for users that want
(site LTER_EU_DE_009) and is a permanent soil monitor- to access the PROFOUND DB as a relational database via
ing plot of the state of Lower Saxony. It is situated close to the R statistical software (R Core Team, 2016). The follow-
the Solling beech site at an elevation of about 508 m a.s.l. ing main functions are included to achieve this goal:
and has similar site conditions as the Solling beech stand.
https://doi.org/10.5194/essd-12-1295-2020 Earth Syst. Sci. Data, 12, 1295–1320, 2020You can also read


