Differences in interactions between transmembrane domains tune the activation of metabotropic glutamate receptors - eLife
←
→
Page content transcription
If your browser does not render page correctly, please read the page content below
RESEARCH ARTICLE

                                   Differences in interactions between
                                   transmembrane domains tune the
                                   activation of metabotropic glutamate
                                   receptors
                                   Jordana K Thibado1, Jean-Yves Tano2, Joon Lee3, Leslie Salas-Estrada4,
                                   Davide Provasi4, Alexa Strauss5, Joao Marcelo Lamim Ribeiro4, Guoqing Xiang3,
                                   Johannes Broichhagen6, Marta Filizola4, Martin J Lohse2,7, Joshua Levitz1,3,5*
                                   1
                                    Physiology, Biophysics and Systems Biology Graduate Program, Weill Cornell
                                   Graduate School of Medical Sciences, New York, United States; 2Max Delbrück
                                   Center for Molecular Medicine, Berlin, Germany; 3Department of Biochemistry,
                                   Weill Cornell Medicine, New York, United States; 4Department of Pharmacological
                                   Sciences, Icahn School of Medicine at Mount Sinai, New York, United States; 5Tri-
                                   Institutional PhD Program in Chemical Biology, New York, United States; 6Leibniz-
                                   Forschungsinstitut für Molekulare Pharmakologie, Berlin, Germany; 7ISAR Bioscience
                                   Institute, Planegg-Munich, Germany

                                   Abstract The metabotropic glutamate receptors (mGluRs) form a family of neuromodulatory
                                   G-protein-coupled receptors that contain both a seven-helix transmembrane domain (TMD) and a
                                   large extracellular ligand-binding domain (LBD) which enables stable dimerization. Although
                                   numerous studies have revealed variability across subtypes in the initial activation steps at the level
                                   of LBD dimers, an understanding of inter-TMD interaction and rearrangement remains limited.
                                   Here, we use a combination of single molecule fluorescence, molecular dynamics, functional assays,
*For correspondence:               and conformational sensors to reveal that distinct TMD assembly properties drive differences
jtl2003@med.cornell.edu            between mGluR subtypes. We uncover a variable region within transmembrane helix 4 (TM4) that
                                   contributes to homo- and heterodimerization in a subtype-specific manner and tunes orthosteric,
Competing interests: The
                                   allosteric, and basal activation. We also confirm a critical role for a conserved inter-TM6 interface in
authors declare that no
competing interests exist.         stabilizing the active state during orthosteric or allosteric activation. Together this study shows that
                                   inter-TMD assembly and dynamic rearrangement drive mGluR function with distinct properties
Funding: See page 26
                                   between subtypes.
Received: 29 January 2021
Accepted: 19 April 2021
Published: 21 April 2021
                                   Introduction
Reviewing editor: Janice L
                                   Assembly into multi-subunit complexes is an essential aspect of many membrane receptors. Dimer-
Robertson, Washington
University in St Louis, United
                                   ization or higher order oligomerization can shape the ligand sensitivity or signaling dynamics of a
States                             protein complex by producing various forms of allostery and cooperativity or mediate the formation
                                   of binding, functional, or regulatory sites (Changeux and Christopoulos, 2016; Katzung, 2004). In
   Copyright Thibado et al. This
                                   many cases, the formation of a multi-subunit complex is required for function. For example, ligand-
article is distributed under the
                                   gated ion channels require multiple subunits to form a functional pore, making assembly into com-
terms of the Creative Commons
Attribution License, which         plexes an absolute necessity. In the case of the vast superfamily of G-protein-coupled receptors
permits unrestricted use and       (GPCRs) the role of quaternary structure has remained more enigmatic and is likely different for the
redistribution provided that the   various subfamilies and their individual members. The proposed dimerization of family A GPCRs,
original author and source are     such as rhodopsin or the beta-adrenergic receptors, has sparked intense debate (Ferré et al., 2014;
credited.                          Milligan et al., 2019; Sleno and Hébert, 2019) with recent studies showing that dimerization is

Thibado et al. eLife 2021;10:e67027. DOI: https://doi.org/10.7554/eLife.67027                                                       1 of 32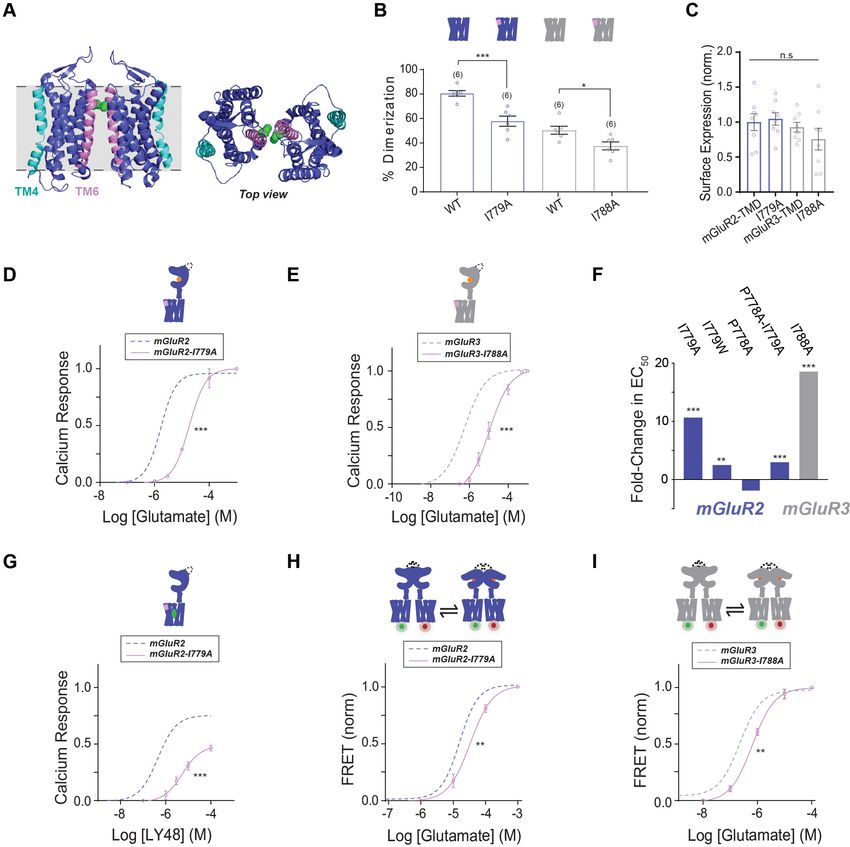
Research article                                                        Neuroscience Structural Biology and Molecular Biophysics

                                   likely transient (Hern et al., 2010; Kasai et al., 2011; Meral et al., 2018; Işbilir et al., 2020;
                                   Möller et al., 2020; Felce et al., 2017), and is not generally required for G protein activation
                                   (Bayburt et al., 2007; Whorton et al., 2008; Whorton et al., 2007; Kuszak et al., 2009). Impor-
                                   tantly, a structural understanding of GPCR dimerization has remained elusive with a wide range of
                                   dimer interfaces proposed for different GPCRs and, more recently, the emergence of the concept of
                                   dynamic, ‘rolling’ inter-subunit interfaces which inter-change and are associated with different func-
                                   tional states (Gurevich and Gurevich, 2008; Meral et al., 2018; Sleno and Hébert, 2019;
                                   Dijkman et al., 2018; Jin et al., 2018).
                                       One major exception to the secondary, modulatory role for dimerization in the function of GPCRs
                                   are the family C GPCRs, including the metabotropic glutamate receptors (mGluRs) and a number of
                                   other subfamilies (Ellaithy et al., 2020; Pin and Bettler, 2016). Family C GPCRs contain canonical
                                   seven-helix transmembrane domains (TMDs) but are distinguished by their large, bi-lobed, extracel-
                                   lular ligand binding domains (LBDs), which are essential for their constitutive homo- and heterodime-
                                   rization (Romano et al., 1996; Doumazane et al., 2011; Levitz et al., 2016; Lee et al., 2020).
                                   Unlike family A GPCRs, reconstituted mGluR2 monomers are unable to undergo glutamate-medi-
                                   ated G-protein activation (El Moustaine et al., 2012), although they can be activated by TMD-tar-
                                   geting allosteric drugs. In response to orthosteric agonists, mGluR LBD dimers undergo dramatic
                                   rearrangement between conformations which both reshape and are controlled by a complex inter-
                                   LBD dimer interface, as deciphered through crystallographic (Kunishima et al., 2000;
                                   Tsuchiya et al., 2002; Muto et al., 2007; Koehl et al., 2019) and spectroscopic (Levitz et al.,
                                   2016; Vafabakhsh et al., 2015; Olofsson et al., 2014) studies. However, how such motions are
                                   transmitted to the TMDs, how TMDs can be activated directly by allosteric drugs and the role of
                                   associated inter-TMD interactions in this family of receptors remains unclear, although a variety of
                                   recent studies have provided insight.
                                       A series of Förster resonance energy transfer (FRET) studies of full-length mGluR1 have shown
                                   that glutamate and other agonists produce relative motions between the TMDs that occur on fast
                                   millisecond time scales that precede eventual receptor activation (Hlavackova et al., 2012;
                                   Marcaggi et al., 2009; Grushevskyi et al., 2019; Tateyama et al., 2004; Tateyama and Kubo,
                                   2006). Structural interpretation of such studies has been limited but the FRET efficiency increase
                                   seen with intersubunit sensors points to a rearrangement that increases inter-TMD interaction upon
                                   LBD activation. Notably, we recently developed an isolated TMD FRET sensor which showed that
                                   TMD-targeting allosteric drugs are able to produce intersubunit rearrangements autonomously with-
                                   out allosteric input from the LBDs (Gutzeit et al., 2019), pointing to a multi-state model of inter-
                                   TMD interaction and raising questions about TMD rearrangement in response to allosteric versus
                                   orthosteric activation. In line with these findings, a prior cross-linking study of full-length mGluR2
                                   provided evidence for close proximity of TM4 and TM5 helices in inactive states and TM6 helices in
                                   active states (Xue et al., 2015). Despite such studies, the relative contribution of inter-TMD interac-
                                   tions within mGluR dimers remains unknown.
                                       High-resolution structural studies have provided further insight but no clear consensus regarding
                                   TMD interfaces. Crystal structures of isolated mGluR1 (Wu et al., 2014) and mGluR5 (Doré et al.,
                                   2014; Christopher et al., 2019; Christopher et al., 2015) TMDs have shown TM1-mediated dimer-
                                   ization or monomers, respectively, while a cryogenic electron microscopy (cryo-EM) study of full-
                                   length mGluR5 (Koehl et al., 2019) showed no TMD interface in an inactive nanodisc-reconstituted
                                   form but a clear TM6 interface in a glutamate and positive allosteric modulator-bound pre-active
                                   state. Finally, a series of cryo-EM studies of the related GABAB receptors showed a lipid-mediated
                                   inactive TM5 interface that re-arranged to a TM6 interface in the presence of agonist and a positive
                                   allosteric modulator (Mao and Shen, 2020; Papasergi-Scott et al., 2020; Park et al., 2020;
                                   Shaye et al., 2020). Together these studies point to a role for TMD rearrangement in mGluR activa-
                                   tion, but the steps prior to formation of a putative active TM6 interface are not clear.
                                       Recent work has also revealed conformational heterogeneity between mGluR subtypes at the
                                   level of the LBDs that shape the activation properties of different homo- and heterodimers
                                   (Levitz et al., 2016; Vafabakhsh et al., 2015; Habrian et al., 2019). Such findings are in line with
                                   the notion that the eight mGluR subtypes are fine-tuned for their distinct roles within the synapse
                                   that require unique glutamate sensitivity, activation kinetics and other signaling properties
                                   (Reiner and Levitz, 2018). This raises the possibility that such variability between subtypes also
                                   exists at the TMDs and can be used as a lens to dissect the TMD activation mechanism. Intriguingly,

Thibado et al. eLife 2021;10:e67027. DOI: https://doi.org/10.7554/eLife.67027                                                       2 of 32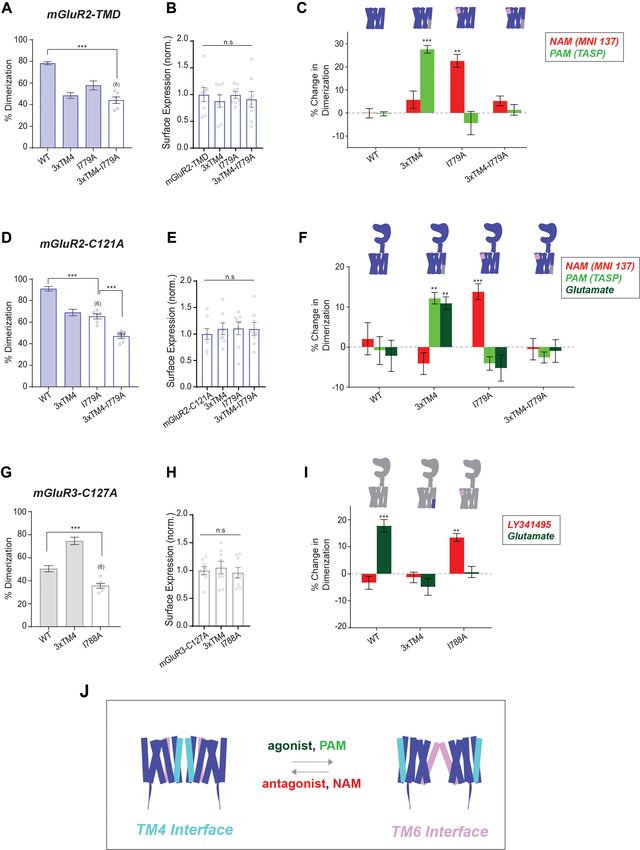
Research article                                                        Neuroscience Structural Biology and Molecular Biophysics

                                   we recently used a single-molecule imaging approach to determine that while all isolated mGluR
                                   TMDs tested show a clear propensity for dimerization, the mGluR2 subtype shows substantially
                                   higher dimerization propensity than other subtypes (Gutzeit et al., 2019), providing a jumping off
                                   point for this study.
                                       Here, we use a combination of optical, functional, and computational techniques to dissect the
                                   role of inter-TMD interaction in mGluR dimerization and activation with a focus on the highly homol-
                                   ogous group II mGluRs (mGluR2 and mGluR3). Single-molecule fluorescence subunit counting
                                   experiments and coarse-grained (CG) molecular dynamics (MD) simulations reveal TMD-mediated
                                   differences in dimer assembly between mGluR2 and mGluR3. Using observations from sequence
                                   analysis, mutagenesis, and subunit counting, we isolate this effect to specific residues at the cyto-
                                   plasmic end of transmembrane helix 4 (TM4). Functional experiments demonstrate that TM4 resi-
                                   dues play a modulatory role in both orthosteric and allosteric activation of group II mGluRs and
                                   controlling basal activity. Using new inter-TMD FRET sensors in full-length mGluRs, we characterize
                                   how orthosteric drugs, allosteric modulators and TM4 residues influence the relative TMD conforma-
                                   tional dynamics of group II mGluRs. Further, we demonstrate that activation associated inter-TMD
                                   dynamics involve reorientation away from a TM4 inactive interface toward a TM6 active interface by
                                   employing single molecule subunit counting experiments in the presence of ligands. Finally, we find
                                   that inter-TMD dimerization shows an intermediate level in mGluR2/3 heterodimers compared to
                                   homodimers, supporting the role of TMD interactions as mediators of the molecular diversity of
                                   mGluRs.

                                   Results
                                   The transmembrane domain mediates differences in dimerization
                                   between metabotropic glutamate receptors
                                   Motivated by our finding that isolated mGluR TMDs dimerize to variable levels in the absence of
                                   extracellular domains (Gutzeit et al., 2019), we sought to further understand the molecular basis of
                                   mGluR TMD dimerization using single molecule pulldown (SiMPull). In this technique, detergent-sol-
                                   ubilized receptor complexes are isolated from fresh cell lysate and sparsely immobilized via antibod-
                                   ies on a glass coverslip. Protein complexes are imaged using TIRF microscopy and photobleaching
                                   step analysis of complexes reports on receptor stoichiometry (Jain et al., 2011). We restrict our
                                   analysis to surface receptors by using N-terminally SNAP-tagged receptor constructs labeled with
                                   membrane-impermeable fluorophores. Expression and labeling of constructs in HEK 293 T cells with
                                   benzylguanine-conjugated fluorophore LD555 (‘BG-LD555’; see Materials and methods) showed
                                   fluorescence labeling at the plasma membrane with minimal fluorescence inside the cell (Figure 1A).
                                   Receptors were immobilized using an HA-tag at the N-terminus of each construct that directly pre-
                                   cedes the SNAP tag (Figure 1B). Consistent with previous work, SNAP-mGluR2-TMD molecules pho-
                                   tobleached primarily in one-step (54.1%) or two-step (41.4%) events with a small population of >3
                                   steps (4.5%) (Figure 1C). This represents a population of 83.1 ± 1.5% dimers when normalized based
                                   on the obligatory dimerization of SNAP-mGluR2 (Figure 1D; see Materials and methods)
                                   (Gutzeit et al., 2019). Importantly, we and others have shown that isolated mGluR TMD constructs
                                   maintain functionality based on downstream responses to allosteric modulators (Goudet et al.,
                                   2004; El Moustaine et al., 2012; Koehl et al., 2019; Gutzeit et al., 2019).
                                      Since mGluR TMDs do not form strict dimers, we asked if our preparation maintains the cellular
                                   composition of monomers and dimers or if TMDs exchange with one another such that new dimers
                                   are formed. To test this, we either co-expressed HA-SNAP-mGluR2-TMD and CLIP-mGluR2-TMD
                                   and labeled the same coverslip with both BG-LD655 (for SNAP) and BC-DY547 (for CLIP) or trans-
                                   fected and labeled separate coverslips with either construct/fluorophore combination prior to mixing
                                   for 45 min during co-lysis (Figure 1—figure supplement 1A–C). Following lysis, protein complexes
                                   were isolated via an anti-HA antibody and all data was taken within 2 hr. As expected, in the positive
                                   co-expression control HA-SNAP-mGluR2-TMD was able to co-precipitate many spots for CLIP-
                                   mGluR2-TMD (Figure 1—figure supplement 1D). In contrast, we observed background levels of
                                   spots for the test condition where separate populations of cells were mixed following labeling (Fig-
                                   ure 1—figure supplement 1E,F). This suggests that there is no exchange between TMD dimers
                                   within detergent on the timescale of our experiments and indicates that our technique can be

Thibado et al. eLife 2021;10:e67027. DOI: https://doi.org/10.7554/eLife.67027                                                       3 of 32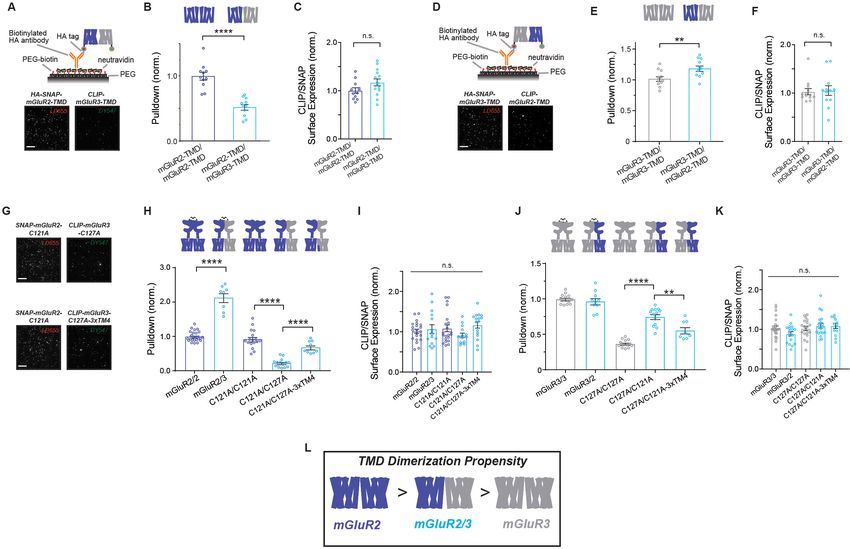
Research article                                                                Neuroscience Structural Biology and Molecular Biophysics

Figure 1. mGluR2 and mGluR3 transmembrane domains show different dimerization propensities in a single molecule pulldown assay. (A) Left,
cartoons of SNAP-mGluR2-TMD (top) and SNAP-mGluR3-TMD (bottom) labeled with fluorophore LD555. Right, representative images showing
expression and surface labeling of SNAP-mGluR2-TMD (top) and SNAP-mGluR3-TMD (bottom) in HEK 293 T cells before lysis. (B) Top, schematic
showing the SiMPull setup. Bottom, representative image of single molecules with representative fluorescence time course for an individual protein
complex (red circle) demonstrating two-step photobleaching. Scale bar = 10 mm. (C) Histogram summarizing the photobleaching step distribution for
SNAP-mGluR2-TMD (n = 1598 total spots from 14 movies) and SNAP-mGluR3-TMD (n = 1435 total spots from 10 movies). Dashed line on the SNAP-
mGluR3-TMD plot shows the normalized photobleaching step distribution for SNAP-mGluR2-TMD for comparison. (D) Bar graph showing percent
dimerization for SNAP-tagged constructs. * indicates statistical significance (one-way ANOVA, p=8.9E-30; Tukey-Kramer for mGluR2 vs. mGluR3 p=0.78,
for mGluR3 vs. mGluR2-TMD p=6.9E-8, for mGluR2-TMD vs. mGluR3-TMD p=8.2E-13, for mGluR3-TMD vs. b2AR p=1.7E-12). (E) Bar graph showing
surface expression for constructs in (D). Values are normalized to SNAP-mGluR2. Expression is not significantly different between constructs (one-way
ANOVA, p=0.64). (F) Bar graph showing the percent dimerization for SNAP-tagged constructs. * indicates statistical significance (one-way ANOVA,
p=2.1E-17; Tukey-Kramer for mGluR2 vs. mGluR2-C121A p=0.27, for mGluR2-C121A vs. mGluR2-C121A-mGluR3TMD p=2.5E-5, for mGluR3 vs. mGluR3-
C127A p=1.1E-12, for mGluR3-C127A vs. mGluR3-C127A-mGluR2TMD p=4.1E-8). (G) Bar graph showing surface expression for constructs in (F). Values
are normalized to SNAP-mGluR2. Expression is not significantly different between constructs (one-way ANOVA, p=0.12). (H) Schematic illustrating the
effect of inter-TMD interactions in mGluR2 and mGluR3 dimer assembly. The ’3 steps
                                    (2.9%) (Figure 1C) compared to SNAP-mGluR2-TMD. Thus, unlike their full-length counterparts
                                    which both show strict dimerization (Levitz et al., 2016), mGluR2-TMD and mGluR3-TMD show

Thibado et al. eLife 2021;10:e67027. DOI: https://doi.org/10.7554/eLife.67027                                                                   4 of 32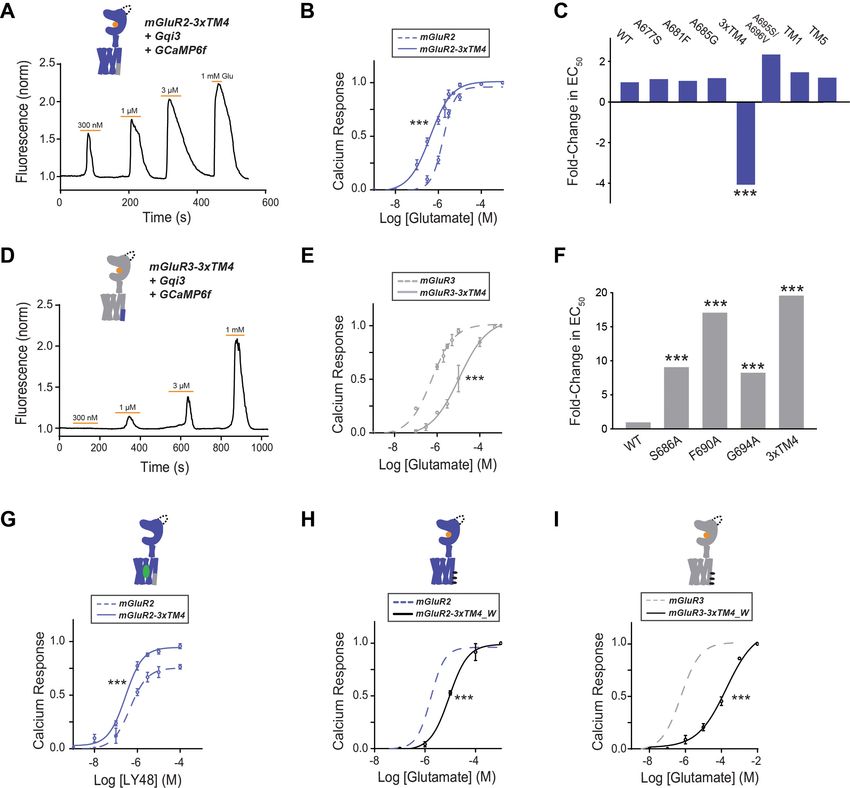
Research article                                                         Neuroscience Structural Biology and Molecular Biophysics

                                   distinct dimerization propensities that are less than an obligate dimer but greater than a canonical
                                   class A GPCR, b2AR, which we used as a monomeric or minimal dimerization control (Figure 1D).
                                   These dimerization differences appear to reflect truly distinct assembly properties as surface expres-
                                   sion levels were similar across constructs (Figure 1E). Importantly, SNAP-mGluR2-TMD and SNAP-
                                   mGluR3-TMD retained their differential dimerization propensities when they were immobilized via
                                   their C-terminus and when SiMPull experiments were conducted under different detergent condi-
                                   tions (Figure 1—figure supplement 2).
                                       To confirm that the dimerization propensities observed in detergent-based single-molecule sub-
                                   unit counting experiments reflect those occurring in the cell membrane, we measured ensemble
                                   FRET levels for the TMDs of both mGluR2 and mGluR3 at comparable expression levels in live cells.
                                   SNAP-mGluR2-TMD or SNAP-mGluR3-TMD constructs were labeled with SNAP-reactive donor (BG-
                                   LD555) and acceptor (BG-LD655) fluorophores. Fluorescence recovery of the donor was examined
                                   following acceptor bleaching with 640 nm illumination (Figure 1—figure supplement 3A). The per-
                                   cent change in donor fluorescence was greater for SNAP-mGluR2-TMD compared to SNAP-mGluR3-
                                   TMD, consistent with the interpretation that mGluR2 has a greater inter-TMD dimerization propen-
                                   sity compared to mGluR3 (Figure 1—figure supplement 3B). As a control, SNAP-b2AR showed less
                                   donor recovery than both mGluR constructs (Figure 1—figure supplement 3B). Combined, these
                                   results indicate that our single molecule experiments are an accurate reflection of mGluR dimeriza-
                                   tion in the membrane.
                                       To provide a structural context to the different dimerization propensities of mGluR2 and mGluR3,
                                   we used extended coarse-grained (CG) molecular dynamics (MD) simulations of pairs of receptors
                                   randomly placed relative to each other in a 1-palmitoyl-2-oleoyl-sn-glycero-3-phosphocholine
                                   (POPC) lipid bilayer (Figure 1—figure supplement 4A) and analyzed their most probable interface
                                   formation with Markov state models (MSMs) (Figure 1—figure supplement 4B). The results reveal
                                   the exploration of multiple dimeric configurations (or macrostates) for both mGluR2 and mGluR3
                                   (Figure 1—source data 1) and confirm a higher dimerization propensity for mGluR2-TMD compared
                                   to mGluR3-TMD (~40% and ~25% dimeric fractions, respectively), as well as a differential involve-
                                   ment of TMs in dimeric interfaces (see figure legend of Figure 2—figure supplement 2B for list of
                                   microstates). To determine the optimal lag time and validate the Markov model, we estimated the
                                   transition probability matrix Pðt Þ for increasing values of the lag time t . The implied relaxation
                                   timescales predicted by each Markov model were calculated as ti ¼ t =logðli Þ, where li are the
                                   eigenvalues of the transition matrix (Figure 1—figure supplement 5). For lag times t  20ns the
                                   predicted implied timescales are approximately time-independent, indicating that the probabilities
                                   and kinetics calculated from the transition matrix at this lag time accurately reflect the behavior of
                                   the system. We grouped all sampled microstates into macrostates consisting of symmetric and asym-
                                   metric dimeric configurations with specific TM helices exhibiting high probability (larger than 40%)
                                   to be at an interface and forming the largest number of dimeric contacts (Figure 1—figure supple-
                                   ment 4B-G). This analysis draws attention to TM1, TM4, and TM5 as the most contributing helices
                                   (macrostates with probabilities larger than 10%) in the case of mGluR2 or TM3 and TM7 in the case
                                   of mGluR3 (Figure 1—source data 1). Significant transition fluxes observed between the different
                                   dimeric macrostates (Figure 1—figure supplement 4B) indicate that direct interconversion between
                                   some of the identified dimeric configurations does not require reverting first to the monomeric
                                   state.
                                       Next, we asked whether the variable propensity for TMD dimerization between mGluR2 and 3
                                   has an effect in the context of the full-length receptor. To sensitize our constructs to effects at non-
                                   covalent interfaces, we mutated a cysteine within the LBD that produces an inter-subunit disulfide
                                   bond. Our previous work has demonstrated that mGluRs remain functional with this mutation
                                   (Levitz et al., 2016). Consistent with previous work (Levitz et al., 2016), mutation of this intersubu-
                                   nit disulfide bridge in mGluR2 (C121A) had a minimal effect on mGluR2 dimerization (Figure 1F).
                                   However, in stark contrast, the equivalent mutation in mGluR3, C127A, produced a substantial two-
                                   fold reduction in dimerization (Figure 1F). We hypothesized that differences in sensitivity to cysteine
                                   mutation are due to differences in the relative inter-TMD interaction and reasoned that if the TMD
                                   plays a role in mGluR dimerization, an mGluR2-C121A chimera with the mGluR3 TMD (‘mGluR2-
                                   C121A-mGluR3TMD’) would reduce dimerization further. Indeed, this construct showed normal
                                   expression (Figure 1G), but reduced dimerization compared to mGluR2-C121A (Figure 1F). We
                                   next tested the reverse chimera to see if the mGluR2-TMD can rescue the reduced dimerization of

Thibado et al. eLife 2021;10:e67027. DOI: https://doi.org/10.7554/eLife.67027                                                        5 of 32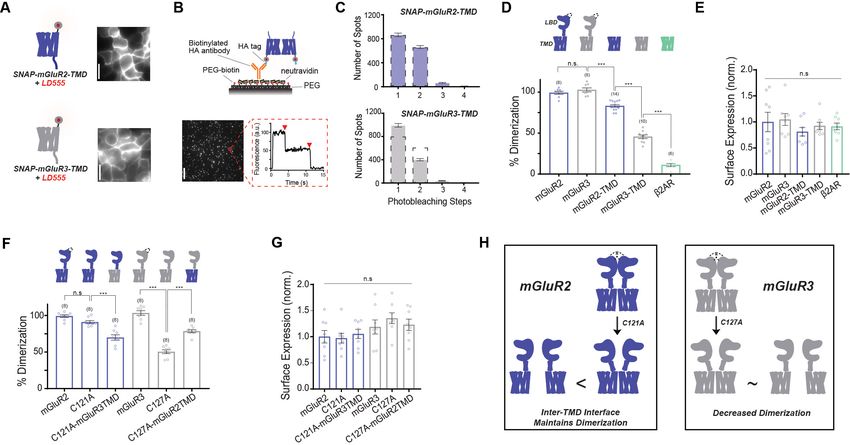
Research article                                                        Neuroscience Structural Biology and Molecular Biophysics

                                   mGluR3-C127A. As hypothesized, ‘mGluR3-C127A-mGluR2TMD’ showed unaltered expression
                                   (Figure 1G) but increased dimerization compared to SNAP-mGluR3-C127A (Figure 1F). Together
                                   these results indicate that the TMD contributes to differences in dimerization between full-length
                                   mGluR2 and mGluR3. Specifically, the greater dimer propensity between mGluR2 TMDs increases
                                   the dimerization of full-length mGluR2 while the decreased inter-TMD interactions in mGluR3 leads
                                   to less favorable dimer formation and therefore greater dimer dissociation in the mGluR3-C127A
                                   background (Figure 1H). Notably, TMD chimeras were not able to fully swap the relative dimeriza-
                                   tion propensities between subtypes, suggesting that other differences outside of the TMD also con-
                                   tribute to differential assembly of mGluR2 and mGluR3.

                                   Residues in TM4 control the relative TMD dimerization propensities of
                                   mGluR2 and mGluR3
                                   Having demonstrated that the TMD plays a critical role in subtype-specific modes of mGluR dimer-
                                   ization, we wondered which specific regions of the TMD contribute to this effect. Together the exist-
                                   ing literature suggests that inter-TMD interaction among class C GPCRs is multifaceted and diverse
                                   (see Introduction), motivating further analysis and careful comparison between receptor subtypes.
                                   We started by assessing sequence conservation across mGluR subtypes. Across all eight rat mGluRs,
                                   most TM helices show 70%) for all TMs except for TM4 (33%)
                                   (Figure 2B). Outward-facing residues in TM4 also exhibited the lowest (0%) sequence identity of the
                                   group II mGluR TMs. Given that the overall sequence identity between mGluR2 and mGluR3 is nearly
                                   70%, it is reasonable to hypothesize that the increased heterogeneity of TM4 contributes to sub-
                                   type-specific differences in TMD dimerization.
                                       Our CG MD simulations showed a range of mGluR2 and mGluR3 TMD dimerization interfaces
                                   (Figure 1—figure supplement 4). However, we hypothesized that the presence of large, dimeric
                                   extracellular domains might give preference to specific dimerization modes. To test this hypothesis,
                                   we carried out steered MD simulations of full-length CG models to representative dimeric configura-
                                   tions of the two receptors and calculated energetic differences between them (Figure 2—figure
                                   supplement 2). Notably, while the identified symmetric TM1/TM1 dimeric configuration of the
                                   mGluR2-TMD was suggested to be more stable than the asymmetric TM1/TM4 and TM1/TM5
                                   mGluR2-TMD dimers (energy differences of 580 ± 18 kJ mol 1,–169 ± 18 kJ mol 1, respectively) in
                                   the presence of the LBD, other dimeric configurations such as the symmetric (TM4)/(TM4) dimer of
                                   mGluR2 (Figure 2—figure supplement 3A), showed higher compatibility with the full-length recep-
                                   tor than the TM1/TM1 dimer and other highly populated macrostates (energy differences of
                                     1370 ± 18 kJ mol 1,–1950 ± 18 kJ mol 1, and 1540 ± 18 kJ mol 1 from the TM1/TM1, TM1/TM4,
                                   and TM1/TM5, respectively). In contrast, the identified TM4/TM4 dimer configuration of mGluR3-
                                   TMD (Figure 2—figure supplement 3B), was estimated to be less stable than the identified largest
                                   mGluR3-TMD dimer macrostate in the presence of the LBD (energy difference of +630 ± 12 kJ
                                   mol 1 from the TM7/TM3 interface).
                                       Together, examination of amino acid sequence conservation and CG MD simulations point to
                                   TM4 as a potential mediator of the differential TMD dimerization of mGluR2 and mGluR3. Intrigu-
                                   ingly, differences in TM4 between the group II mGluRs have been reported to contribute to the spe-
                                   cific interaction of mGluR2, but not mGluR3, with the 5-HT2A serotonin receptor, a class A GPCR
                                   (González-Maeso et al., 2008; Fribourg et al., 2011; Moreno et al., 2016; Delille et al., 2012).
                                   This interaction has been attributed to three outward-facing alanine residues (A677, A681, A685) at
                                   the cytosolic end of TM4 of mGluR2 (Figure 2A) that allow mGluR2, but not mGluR3, to interact
                                   with 5-HT2AR (Moreno et al., 2012). Importantly, these three alanine residues and the correspond-
                                   ing residues in mGluR3 are conserved across species (Figure 2—figure supplement 1D) and are
                                   observed within many of the TM4-containing dimer interfaces obtained by CG MD simulations

Thibado et al. eLife 2021;10:e67027. DOI: https://doi.org/10.7554/eLife.67027                                                       6 of 32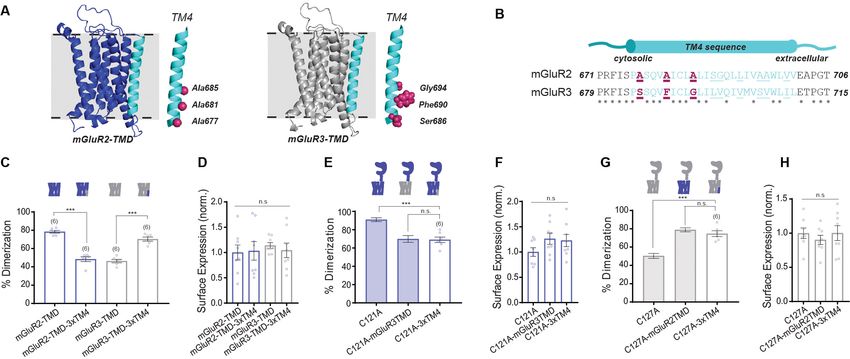
Research article                                                               Neuroscience Structural Biology and Molecular Biophysics

Figure 2. Residues in TM helix four mediate differences in inter-TMD interaction between mGluR2 and mGluR3. (A) Homology models of the TMD of
mGluR2 (purple) and mGluR3 (gray) showing TM4 (cyan) residues of interest in magenta. (B) TM4 sequence alignment for mGluR2 and mGluR3. (C) Bar
graph showing percent dimerization for SNAP-tagged TMD constructs. * indicates statistical significance (one-way ANOVA, p=4.7E-10; Tukey-Kramer
for mGluR2-TMD vs. mGluR2-TMD-3xTM4 p=1.5E-8, for mGluR3-TMD vs. mGluR3-TMD-3xTM4 p=5.3E-7). (D) Bar graph showing surface expression for
constructs in (C). Values are normalized to SNAP-mGluR2-TMD. Expression is not significantly different between constructs (one-way ANOVA, p=0.91).
(E) Bar graph showing percent dimerization for SNAP-tagged full-length constructs. * indicates statistical significance (one-way ANOVA, p=7.6E-5;
Tukey-Kramer for mGluR2-C121A vs. mGluR2-C121A-3xTM4 p=0.00015, for mGluR2-C121A-mGluR3TMD vs. mGluR2-C121A-3xTM4 p=0.98). Shaded
bars show repeated data from Figure 1F. (F) Bar graph showing surface expression for constructs in (E). Values are normalized to SNAP-mGluR2-
C121A. Expression is not significantly different between constructs (one-way ANOVA, p=0.19). (G) Bar graph showing percent dimerization SNAP-
tagged constructs labeled with LD555. * indicates statistical significance (one-way ANOVA, p=3.6E-7; Tukey-Kramer for mGluR3-C127A vs. mGluR3-
C127A-3xTM4 p=1.5E-5, for mGluR3-C127A-mGluR2TMD vs. mGluR3-C127A-3xTM4 p=0.53). Shaded bars show repeated data from Figure 1F. (H) Bar
graph showing surface expression for constructs in (G). Values are normalized to SNAP-mGluR3-C127A. Expression is not significantly different between
constructs (one-way ANOVA, p=0.65). Number of movies analyzed for each condition is shown in parenthesis above each bar. Error bars are s.e.m.
Associated figure supplements include Figure 2—figure supplements 1–6.
The online version of this article includes the following source data and figure supplement(s) for figure 2:
Source data 1. Data and statistics for Figure 2 and associated supplemental figures.
Figure supplement 1. mGluR TMD sequence conservation analysis.
Figure supplement 2. Convergence assessment of the free energy differences between representative dimeric configurations of highly populated
macrostates.
Figure supplement 3. Symmetric TM4-TM4 interfaces for group II mGluR TMDs.
Figure supplement 4. Further analysis of dimerization of TM4 mutants of mGluR2 and mGluR3 TMD constructs.
Figure supplement 5. Further analysis of mutations to outward-facing mGluR2 TMD residues: TM1 and TM5 mutants do not alter dimerization .
Figure supplement 6. Further analysis of dimerization of mGluR2 and mGluR3 mutant constructs.

                                    (Figure 2—figure supplement 3). We thus wondered whether these alanine residues also play a
                                    role in mGluR homodimer formation.
                                       To test our hypothesis, we swapped A677, A681, and A685 in mGluR2 with the corresponding
                                    residues in mGluR3: S686, F690, and G694 (Figure 2A,B) and vice versa to create two mGluR-TMD
                                    mutants, ‘mGluR2-TMD-3xTM4’ and ‘mGluR3-TMD-3xTM4’. Strikingly, we found that dimerization
                                    propensity was determined by which 3xTM4 residues were present in the construct (Figure 2C). For
                                    mGluR2-TMD-3xTM4, we observed a reduction in dimerization from 78.4 ± 1.4% for mGluR2-TMD
                                    to 48.4 ± 2.4%. Conversely, mGluR3-TMD-3xTM4 increased dimerization from 46.3 ± 1.7% for
                                    mGluR3-TMD to 70.0 ± 2.0%. These data indicate that TM4 residues determine the relative dimeriza-
                                    tion propensity of group II mGluRs at the TMD level. Importantly, both mutants expressed similarly
                                    to wild-type receptors (Figure 2D). Single amino acid swap constructs in the SNAP-mGluR2-TMD

Thibado et al. eLife 2021;10:e67027. DOI: https://doi.org/10.7554/eLife.67027                                                                 7 of 32
Research article Neuroscience Structural Biology and Molecular Biophysics
background show that although each mutation individually alters dimerization, all three mutants
combined in the 3xTM4 constructs are required for the greatest effect (Figure 2—figure supple-
ment 4).
We also examined whether mutating other non-conserved outward-facing residues in TM4 influ-
ences TMD dimerization. We swapped mGluR2 residues A695 and A696 with mGluR3 residues S703
and V704 to make mGluR2-TMD-A695S/A696V. Notably, these positions were shown to cross-link in
a prior study of mGluR2 (Xue et al., 2015). mGluR2-TMD-A695S/A696V exhibited indistinguishable
expression and dimerization compared to SNAP-mGluR2-TMD, suggesting that outward-facing resi-
dues at the extracellular end of TM4 do not influence the relative TMD dimerization propensities
between mGluR2 and mGluR3 (Figure 2—figure supplement 5A–C). We also tested differences
between mGluR2 and mGluR3 in TM1 (F584, G587 in mGluR2 and I593, T596 in mGluR3) and TM5
(A726, G730, A733 in mGluR2 and S735, I739, T742 in mGluR3) by swapping non-conserved out-
ward-facing residues and observed no effect in SiMPull or in terms of surface expression (Figure 2—
figure supplement 5D–G). Among these residues, only one (F584 in mGluR2 and I593 in mGluR3)
was found to participate in dimeric configurations identified by simulation (specifically, the TM1/TM1
interface; Figure 1—figure supplement 4). While these SiMPull and computational results do not
rule out the possibility that the extracellular end of TM4, TM1 or TM5 contribute to TMD dimeriza-
tion, they show that these regions are not major mediators of the differences between mGluR2 and
mGluR3.
While isolated TMDs are very useful for studying TMD behavior directly, we asked if the identified
TM4 residues are relevant within the context of full-length mGluRs. We first produced an mGluR2-
C121A-3xTM4 construct and examined its dimerization propensity compared to mGluR2-C121A and
mGluR2-C121A-mGluR3TMD. Consistent with isolated TMD data, we found that the effect of swap-
ping the entire TMD was mimicked by only introducing the 3xTM4 mutant (Figure 2E). This effect
was also observed with mGluR3-C127A-3xTM4 where the increase in dimerization matched what
was observed for mGluR3-C127A-mGluR2TMD (Figure 2G). All mutants showed no effect on recep-
tor expression levels (Figure 2F,H).
Together, these experiments show that TM4 residues control the relative TMD dimerization pro-
pensity, at least for mGluR2. Importantly, TMD chimeras or 3xTM4 swap mutations showed no clear
effect on dimerization in full-length wild type backgrounds likely due to the maintenance of the disul-
fide bridge that stabilized LBD dimerization (Figure 2—figure supplement 6). This indicates that
the cysteine mutation is needed to reveal the distinct inter-TMD interaction modes that exist within
mGluR2 and mGluR3 dimers.
TM4 residues control orthosteric and allosteric activation of group II
mGluRs
Having observed a clear, but variable role for inter-TMD interfaces involving the cytosolic end of
TM4 in dimerization, we next investigated how this region contributes to mGluR function. We turned
to a calcium imaging assay in HEK 293 T cells where a G protein chimera (Conklin et al., 1993)
allows Gi/o-coupled receptors, such as mGluR2 and mGluR3, to produce release of calcium from
intracellular stores which can be quantified by measuring the fluorescence increase from a fluores-
cent calcium sensor such as GCaMP6f (Materials and methods). We started by measuring the gluta-
mate response of wild type mGluR2 and mGluR3. As expected from previous studies (Levitz et al.,
2016; Tora et al., 2018), mGluR3 showed a higher apparent glutamate affinity compared to mGluR2
(Figure 3—figure supplement 1A,B). Disrupting the TM4 interface in mGluR2-3xTM4 produced a
four-fold leftward shift compared to wild-type mGluR2 (Figure 3A–C). Based on this result, we won-
dered whether mGluR3-3xTM4 would have reduced apparent glutamate affinity compared to
mGluR3. Indeed, we observed a 20-fold rightward shift for mGluR3-3xTM4 compared to wild type
mGluR3 (Figure 3D–F). To further understand the contribution of each residue, we also tested single
mutants. Interestingly, mGluR2-A677S, -A681F, and -A685G did not show different glutamate EC50
values compared to wild-type mGluR2 (Figure 3C; Figure 3—figure supplement 1C). Conversely,
mGluR3-S686A, -F690A, and -G684A all exhibited significant rightward shifts compared to mGluR3,
although no single mutant had as reduced apparent affinity as mGluR3-3xTM4 (Figure 3F; Fig-
ure 3—figure supplement 1D). Similar rightward and leftward shifts were observed for mGluR2-
3xTM4 and mGluR3-3xTM4 using a G-protein-coupled inward-rectifier potassium (GIRK) channel-
based patch-clamp assay (Materials and methods; Figure 3—figure supplement 1E–G), showing
Thibado et al. eLife 2021;10:e67027. DOI: https://doi.org/10.7554/eLife.67027 8 of 32Research article Neuroscience Structural Biology and Molecular Biophysics Figure 3. Differences in TM4 residues mediate different activation properties of mGluR2 and mGluR3. (A) Representative calcium imaging trace showing calcium responses induced by glutamate application from a HEK 293 T cell expressing mGluR2-3xTM4, a G-protein chimera and GCaMP6f. (B) Glutamate calcium imaging concentration response curves for mGluR2 (EC50 = 1.68 ± 0.03 mM) and mGluR2-3xTM4 (EC50 = 0.41 ± 0.06). All values are normalized to saturating (1 mM) glutamate. * indicates statistical significance (two-way ANOVA, p=5.2E-10). (C) Summary of glutamate EC50 shifts relative to wild-type mGluR2 obtained for mGluR2 mutants. * indicates statistical significance (two-way ANOVA; for mGluR2 vs. mGluR2-3xTM4, p=5.2E- 10). ‘TM1’=F584I, G587T; ‘TM5’=A726S, G730I, A733T (D) Representative calcium imaging trace showing calcium responses from mGluR3-3xTM4. (E) Glutamate calcium imaging concentration response curves for mGluR3 (EC50 = 0.56 ± 0.06) and mGluR3-3xTM4 (EC50 = 11.0 ± 0.1). All values are normalized to saturating (1 mM) glutamate. * indicates statistical significance (two-way ANOVA, p=3.6E-10). (F) Summary of glutamate EC50 shifts relative to wild-type mGluR3 obtained for mGluR3 mutants. * indicates statistical significance (two-way ANOVA; for mGluR3 vs. mGluR3-S686A, p=2.2E- 8; for mGluR3 vs. mGluR3-F690A, p=2.6E-14; for mGluR3 vs. mGluR3-G694A, p=4.8E-10; for mGluR3 vs. mGluR3-3xTM4, p=3.6E-10). (G) LY48 calcium imaging concentration response curves for mGluR2 (EC50 = 0.45 ± 0.10) and mGluR2-3xTM4 (EC50 = 0.27 ± 0.06). mGluR2-3xTM4 has ~17% greater efficacy than mGluR2 at saturating LY48. All values are normalized to saturating (1 mM) glutamate. * indicates statistical significance (two-way ANOVA, p=1.3E-7). (H) Glutamate calcium imaging concentration response curves for mGluR2 and mGluR2-3xTM4_W (EC50 = 9.01 ± 0.08). All values are Figure 3 continued on next page Thibado et al. eLife 2021;10:e67027. DOI: https://doi.org/10.7554/eLife.67027 9 of 32
Research article                                                             Neuroscience Structural Biology and Molecular Biophysics

Figure 3 continued
normalized to saturating (1 mM) glutamate. * indicates statistical significance (two-way ANOVA, p=0.00087). (I) Glutamate calcium imaging
concentration response curves for mGluR3 and mGluR3-3xTM4_W (EC50 = 186.00 ± 0.27). All values are normalized to saturating (1 mM) glutamate. *
indicates statistical significance (two-way ANOVA, p=1.2E-10). Associated figure supplement includes Figure 3—figure supplements 1–2.
The online version of this article includes the following source data and figure supplement(s) for figure 3:
Source data 1. Data and statistics for Figure 3 and associated supplemental figures.
Figure supplement 1. Further data showing differences in TM4 residues mediate different activation properties of mGluR2 and mGluR3.
Figure supplement 2. Further analysis of 3xTM4_W mutants in mGluR2 and mGluR3 constructs.

                                   that the effects of TM4 mutations on function are maintained using endogenous Gi/o proteins.
                                   Together, these measurements show that inter-TM4 interactions influence orthosteric activation of
                                   group II mGluRs.
                                       We also tested glutamate responses of the TM1 (F584I/G587T), TM4 (A695S/A696V) and TM5
                                   (A726S/G730I/A733T) mutants which showed no change compared to wild-type in dimerization
                                   experiments (Figure 2—figure supplement 5). Consistent with their lack of effect on dimerization,
                                   all three mutants showed identical concentration response curves compared to wild-type mGluR2
                                   (Figure 3C; Figure 3—figure supplement 1I).
                                       Next, we wondered whether the 3xTM4 residues also influence allosteric activation. Our work
                                   and others’ have demonstrated that positive allosteric modulators (PAMs) can function as direct ago-
                                   nists of mGluR2 (Gutzeit et al., 2019; El Moustaine et al., 2012; Goudet et al., 2004;
                                   O’Brien et al., 2018). We tested the mGluR2 PAM LY487379 (LY48) (Johnson et al., 2003) with
                                   mGluR2 and mGluR2-3xTM4. Like the glutamate response, we observed a small leftward shift in
                                   EC50 for mGluR2-3xTM4 compared to wild type mGluR2 (Figure 3G, Figure 3—figure supplement
                                   1H). We also observed that the mGluR2-3xTM4 LY48 PAM response showed greater maximal effi-
                                   cacy, with saturating (100 mM) LY48 giving 19.4% greater amplitude compared to wild type mGluR2.
                                   This finding shows that 3xTM4 residues also influence allosteric activation.
                                       Given the clear effects of TM4 perturbations on group II mGluR function, we asked what the
                                   effects of harsher alteration of this interface would be. We tested this by introducing bulky, hydro-
                                   phobic tryptophan residues into outward facing residues of TM4 to disrupt inter-subunit interaction.
                                   We first produced mGluR2-3xTM4_W (A677W, A681W, A685W) in the isolated TMD background
                                   and observed reduced dimerization compared to both mGluR2-TMD and mGluR2-3xTM4 (Fig-
                                   ure 3—figure supplement 2A), despite normal surface expression levels (Figure 3—figure supple-
                                   ment 2B). In contrast to what was observed with mGluR2-3xTM4, full-length mGluR2-3xTM4_W
                                   showed a small right-shift in the functional calcium imaging concentration response curve
                                   (Figure 3H), suggesting that harsh perturbation to the lipid-targeting face of TM4 impairs activation.
                                   Consistent with this, mGluR3-3xTMD_W (S686W/F690W/G684W) showed similarly reduced dimer-
                                   ization compared to wild-type mGluR3-TMD (Figure 3—figure supplement 2A) despite normal sur-
                                   face expression levels (Figure 3—figure supplement 2B) and showed a pronounced right-shift
                                   compared to wild-type mGluR3 in the functional calcium imaging assay (Figure 3I). Together these
                                   results confirm the importance of TM4 in group II mGluR TMD dimerization and suggest that out-
                                   ward-facing residues in TM4 influence inter-subunit rearrangement for both receptor subtypes.

                                   SNAP- and Halo-based FRET sensors enable analysis of the effects of
                                   TM4 interface perturbation on conformational dynamics of full-length
                                   mGluRs
                                   Having established the role of TM4 residues in influencing dimerization and both orthosteric and
                                   allosteric activation, we next wondered how they influence mGluR conformational dynamics using
                                   fluorescence resonance energy transfer (FRET). We first examined whether TM4 residues influence
                                   inter-LBD dynamics using a well-established assay where a decrease in FRET between N-terminal
                                   SNAP-tags is correlated with activation-associated inter-LBD reorientation (Doumazane et al., 2013;
                                   Olofsson et al., 2014; Vafabakhsh et al., 2015). HEK 293 T cells were transfected with SNAP-
                                   tagged mGluR constructs and after labeling with SNAP-reactive donor (BG-LD555) and acceptor
                                   (BG-LD655) fluorophores (Materials and methods), the donor fluorophore was excited with a 561 nm
                                   laser while donor and acceptor channels were imaged simultaneously with a dual camera imaging

Thibado et al. eLife 2021;10:e67027. DOI: https://doi.org/10.7554/eLife.67027                                                             10 of 32
Research article Neuroscience Structural Biology and Molecular Biophysics
system as described previously (Gutzeit et al., 2019). 3xTM4 mutants produced inter-LBD FRET
responses that were indistinguishable from their wild-type counterparts with identical glutamate con-
centration-response curves (Figure 4—figure supplement 1A,B). As previously shown, mGluR3 but
not mGluR2 showed a clear basal FRET response to the competitive antagonist LY341495 in the
absence of glutamate, consistent with constitutive inter-LBD dynamics that drive basal activity
(Vafabakhsh et al., 2015; Levitz et al., 2016). mGluR3-3xTM4 maintained a basal response to LY34
that was indistinguishable from wild-type, while both mGluR2 and mGluR2-3xTM4 showed no basal
response to LY34 (Figure 4—figure supplement 1C,D). Together these data show that 3xTM4
mutants undergo normal LBD motions, suggesting that their functional effects are mediated down-
stream at the TMDs themselves. Furthermore, this underscores the large effects of the 3xTM4 muta-
tions on receptor activation, given that despite normal glutamate sensitivity at the LBDs apparent
glutamate affinities were shifted by up to nearly 20-fold in the case of mGluR3 (Figure 3).
We next sought to directly probe dynamics at the TMD by developing new FRET sensors based
on ours and others’ previous studies of mGluR1 where insertion of fluorescent proteins (i.e. CFP/
YFP) into intracellular loops or C-termini have yielded sensors of activation-associated conforma-
tional changes that are suitable for live cell studies (Hlavackova et al., 2012; Marcaggi et al., 2009;
Grushevskyi et al., 2019; Tateyama et al., 2004; Tateyama and Kubo, 2006). We re-engineered
this approach to incorporate HaloTags (Los et al., 2008; Schihada et al., 2018) which enable the
use of organic fluorophores, such as the family of rhodamine-based Janelia Fluor (‘JF’) dyes
(Grimm et al., 2016; Grimm et al., 2020; Grimm et al., 2015), which show enhanced brightness
and stability compared to fluorescent proteins. We produced constructs where a HaloTag is inserted
into the second intracellular loop of mGluR2 or mGluR3 to monitor proximity between TMDs
(Figure 4A). It is important to note that these constructs are unable to couple to G proteins as has
been reported with all previous inter-TMD fluorescent-protein based sensors of full-length mGluRs
(Tateyama et al., 2004; Tateyama and Kubo, 2006; Marcaggi et al., 2009; Hlavackova et al.,
2012; Grushevskyi et al., 2019). Following expression, these constructs were labeled with HaloTag
donor (JF549) and acceptor (JF646) dyes at a 1:3 ratio where optimal results were observed (Fig-
ure 4—figure supplement 2A). Consistent with prior fluorescent protein-based constructs for
mGluR1, glutamate application resulted in a FRET increase for both the mGluR2 and mGluR3 sensors
(Figure 4B; Figure 4—figure supplement 2B,C). Importantly, no FRET responses were observed
when constructs were labeled with only donor or only acceptor fluorophores (Figure 4—figure sup-
plement 2D,E). FRET responses were reversible upon drug washout and concentration-dependent
(Figure 4—figure supplement 3A,B). Concentration response curves for wild-type constructs
showed the expected higher apparent glutamate affinity for mGluR3 compared to mGluR2
(Figure 4C).
We further characterized the sensitivity of the FRET sensors to different types of compounds. As
expected, glutamate responses were fully blocked by the competitive antagonist LY341495 (Fig-
ure 4—figure supplement 3C,D) at the same concentration (5 mM) used for block of functional
responses (Figure 4—figure supplement 3E,F). We next asked if glutamate-induced FRET increases
are blocked by TMD-targeting mGluR NAMs. We focused on the non-specific group II mGluR NAM
MNI 137, which (10 mM) was only able to produce a weak, partial block of glutamate-induced FRET
responses (32.0 ± 4.5% for mGluR2; 42.9 ± 7.4% for mGluR3) (Figure 4D,E; Figure 4—figure sup-
plement 3G) at the same saturating concentration (10 mM) where full block of functional responses
was observed (Figure 4E; Figure 4—figure supplement 3H,I). Further raising the MNI 137 concen-
tration to 50 mM (IC50 ~10 nM Hemstapat et al., 2007) did not increase the extent of block of gluta-
mate-induced mGluR3 FRET responses (44.9 ± 8.3%; n = 3). These results indicate that these FRET
sensors partially report on conformational changes that are insensitive to NAMs. In addition, we
tested a saturating concentration of the mGluR2 PAM LY48 and, in contrast to its robust functional
activation properties (Figure 3G), observed weak FRET increases that were 33.5 ± 3.9% of the ampli-
tude of the response to saturating glutamate (Figure 4F).
Next, we asked if the inter-TMD FRET sensors are sensitive to perturbation to TM4. We found
that mGluR2-3xTM4 exhibited a clear leftward-shift compared to mGluR2, while mGluR3-3xTM4
exhibited a rightward-shift compared to mGluR3 (Figure 4G–I), supporting a role for TM4 in control-
ling intersubunit motions. In addition, mGluR3-3xTM4 exhibited a reduced basal FRET response to
LY341495 compared to wild type mGluR3 (Figure 4J,K), suggesting that the increased dimerization
propensity of the TM4 interface is capable of decreasing the basal activity of the receptor. We
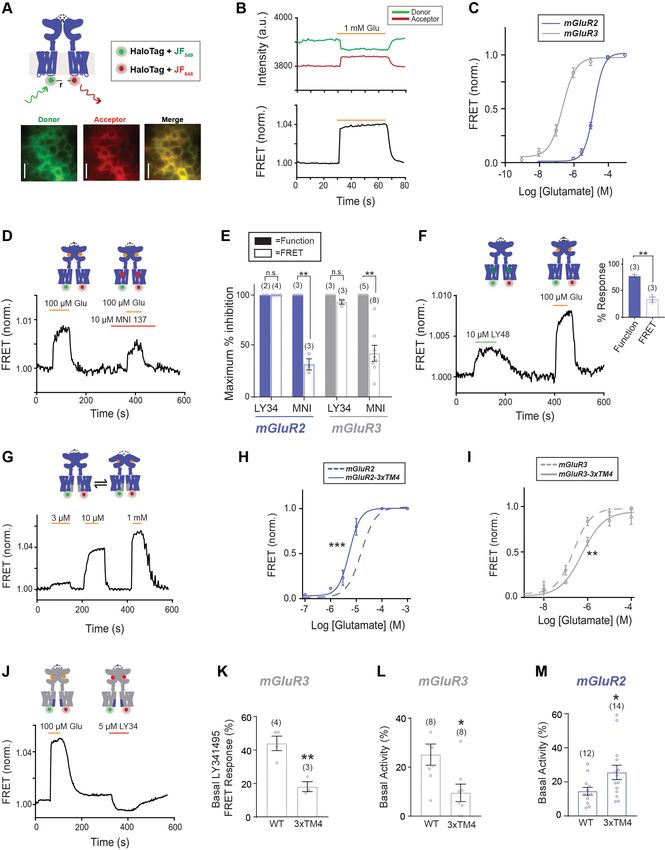
Thibado et al. eLife 2021;10:e67027. DOI: https://doi.org/10.7554/eLife.67027 11 of 32Research article Neuroscience Structural Biology and Molecular Biophysics Figure 4. An inter-TMD FRET assay enables detection of inter-TMD conformational dynamics in full-length mGluR2 and mGluR3 in live cells. (A) Top, schematic showing an mGluR2 dimer with a HaloTag inserted into intracellular loop 2 (ICL2). and labeled with donor and acceptor fluorophores. Bottom, representative cell images showing donor and acceptor channels after donor excitation with a 561 nm laser. Scale bar = 20 mm. (B) Representative FRET trace showing donor and acceptor fluorescence intensity (top) during glutamate application. A corresponding normalized FRET Figure 4 continued on next page Thibado et al. eLife 2021;10:e67027. DOI: https://doi.org/10.7554/eLife.67027 12 of 32
Research article                                                                 Neuroscience Structural Biology and Molecular Biophysics

Figure 4 continued
trace (bottom) shows reversible FRET increases upon glutamate stimulation. (C) Glutamate FRET concentration response curves for mGluR2
(EC50 = 15.75 ± 0.04) and mGluR3 (EC50 = 0.23 ± 0.08). All values are normalized to saturating (1 mM) glutamate. (D) Application of the negative
allosteric modulator MNI 137 partially blocks glutamate-induced FRET increases for mGluR2. (E) Quantification of saturating LY34 (5 mM) and MNI (10
mM) blockade of glutamate responses in FRET and calcium imaging for mGluR2 and mGluR3. * indicates statistical significance (unpaired t-test, for MNI
inhibition in FRET vs. function for mGluR2, p=0.0064; for MNI inhibition in FRET vs. function for mGluR3, p=0.013). (F) Representative FRET trace shows
application of positive allosteric modulator LY48 at a saturating concentration induces a smaller FRET response than saturating glutamate for mGluR2.
Inset, quantification of LY48 response in FRET and calcium imaging for mGluR2. * indicates statistical significance (unpaired t-test, p=0.0033) (G)
Representative FRET trace showing glutamate titration for mGluR2-3xTM4. (H) Glutamate FRET concentration response curves for mGluR2 and mGluR2-
3xTM4 (EC50 = 5.39 ± 0.03). All values are normalized to saturating (1 mM) glutamate. * indicates statistical significance (two-way ANOVA, p
value = 1.7E-6). (I) Glutamate FRET concentration response curves for mGluR3 and mGluR3-3xTM4 (EC50 = 0.56 ± 0.10). All values are normalized to
saturating (1 mM) glutamate. * indicates statistical significance (two-way ANOVA, p value = 0.0083). (J) Representative FRET trace showing weak
sensitivity to LY34 in the absence of glutamate for mGluR3-3xTM4. (K) Summary showing decrease in basal FRET response to LY34 for mGluR3-3xTM4
compared to wild-type mGluR3. * indicates statistical significance (unpaired t-test, p=0.0048). (L) Summary showing decrease in basal activity as
assessed by LY34 application in patch clamp recordings for mGluR3-3xTM4 compared to wild-type mGluR3. * indicates statistical significance (unpaired
t-test, p=0.015). (M) Summary showing increase in basal activity as assessed by Ro 64 application in patch clamp recordings for mGluR2-3xTM4
compared to wild-type mGluR2. * indicates statistical significance (unpaired t-test, p=0.033). The number of cells tested are shown in parentheses. Error
bars represent s.e.m. Associated figure supplements include Figure 4—figure supplements 1–4.
The online version of this article includes the following source data and figure supplement(s) for figure 4:
Source data 1. Data and statistics for Figure 4 and associated supplemental figures.
Figure supplement 1. Differences in TM4 residues do not alter inter-LBD conformational dynamics.
Figure supplement 2. Characterization of inter-TMD FRET sensor in mGluR2 and mGluR3.
Figure supplement 3. Characterization of inter-TMD conformational dynamics in response to orthosteric and allosteric drugs.
Figure supplement 4. Further characterization of inter-TMD conformational dynamics and control of basal activity.

                                     tested basal receptor activity using the GIRK channel patch clamp assay and, indeed, observed
                                     reduced basal activity for mGluR3-3xTM4 compared to wild-type mGluR3 (Figure 4L; Figure 4—fig-
                                     ure supplement 4B,C). Interestingly the basal FRET response was larger for LY341495 than MNI
                                     137, despite comparable responses to both antagonists in the patch clamp assay (Figure 4—figure
                                     supplement 4A,D), further supporting the partial sensitivity of the FRET sensor to allosteric com-
                                     pounds. Based on the clear effect of TM4 mutations on mGluR3 basal activity, we also asked if TM4
                                     perturbations alter basal activity of mGluR2. Since mGluR2 does not show basal LBD dynamics (Fig-
                                     ure 4—figure supplement 1C,D), we used the NAM Ro 64–2259 to detect mGluR2 basal activity
                                     due to its ability to serve as an inverse agonist (Gutzeit et al., 2019). Using the patch clamp assay,
                                     we observed a significant increase in basal activity for mGluR2-3xTM4 compared to mGluR2
                                     (Figure 4M; Figure 4—figure supplement 4E,F). Together these results indicate that orthosteric
                                     and allosteric compounds influence inter-TMD conformational dynamics to control receptor activity
                                     in a way that is tuned by a TM4-containing dimer interface.

                                     Testing an inter-TMD rearrangement model of mGluR activation
                                     Previous biochemical and structural studies have strongly argued that TMDs undergo reorientation
                                     to a TM6 interface upon activation (Xue et al., 2015; Koehl et al., 2019). Notably, TM6 is highly
                                     conserved across mGluR subtypes compared to other transmembrane helices and is 100% identical
                                     between mGluR2 and mGluR3 (Figure 2—figure supplement 1). This supports a model where diver-
                                     gent inter-TMD interaction modes across mGluR subtypes in inactive states converge on a common
                                     active-state interface. To test this model of mGluR activation, we introduced mutations at the TM6
                                     interface based on the full-length mGluR5 agonist- and PAM-bound cryo-EM structure where a sin-
                                     gle point of contact exists between TMDs centered on conserved isoleucine 791 (I779 in mGluR2
                                     and I788 in mGluR3) in TM6 (Koehl et al., 2019; Figure 5A). We first tested alanine (I779A) and
                                     tryptophan (I779W) mutants in the isolated mGluR2-TMD to determine if either mutation altered
                                     dimerization in SiMPull experiments. Interestingly, both mutants showed reduced dimerization com-
                                     pared to the wild type mGluR2-TMD (Figure 5—figure supplement 1A), suggesting that both TM4-
                                     and TM6-containing interfaces contribute to the dimer population in this assay. Mutation to a nearby
                                     conserved proline (P778) in the TM6 interface also decreased TMD dimerization (Figure 5—figure
                                     supplement 1A) and mutation to the same conserved TM6 residue in mGluR3, I788A, produced a

Thibado et al. eLife 2021;10:e67027. DOI: https://doi.org/10.7554/eLife.67027                                                                   13 of 32
Research article Neuroscience Structural Biology and Molecular Biophysics Figure 5. Testing the role of TM6 in group II mGluR activation. (A) Left, cryo-EM structure of mGluR5 TMD dimer (PDB: 6N51) with TM4 highlighted in cyan and TM6 highlighted in pink. The side chain of I791 (I779 in mGluR2, I788 in mGluR3) is shown in green. Right, top view. (B) Bar graph showing percent dimerization for SNAP-tagged constructs labeled with LD555. * indicates statistical significance (one-way ANOVA, p=1.2E-8; Tukey-Kramer for mGluR2-TMD vs. mGluR2-TMD-I779A p=0.00017, for mGluR3-TMD vs. mGluR3-TMD-I788A p=0.045). (C) Bar graph showing surface expression for constructs in (B). Values are normalized to SNAP-mGluR2-TMD. Expression is not significantly different between constructs (one-way ANOVA, p=0.30). (D) Calcium imaging glutamate concentration response curves for mGluR2 and mGluR2-I779A (EC50 = 18.66 ± 0.80). All values are normalized to saturating (1 mM) glutamate. * indicates statistical significance (two-way ANOVA, p=1.2E-10). (E) Glutamate calcium imaging concentration response curves for mGluR3 and mGluR3-I788A (EC50 = 10.43 ± 0.10). All values are normalized to saturating (1 mM) glutamate. * indicates statistical significance (two-way ANOVA, p=8.2E-10). (F) Summary of glutamate EC50 shifts relative to wild type mGluR2 or mGluR3 obtained for their respective mutants. * indicates statistical significance (two-way ANOVA; for mGluR2 vs. mGluR2-I779A, p=1.2E-10; for mGluR2 vs. mGluR2-I779W, p=0.0028; for mGluR2 vs. Figure 5 continued on next page Thibado et al. eLife 2021;10:e67027. DOI: https://doi.org/10.7554/eLife.67027 14 of 32
Research article                                                                Neuroscience Structural Biology and Molecular Biophysics

Figure 5 continued
mGluR2-P778A-I779A, p=0.0015; for mGluR3 vs. mGluR3-I788A, p=8.2E-10). mGluR2-P778A is not significantly different from mGluR2 (two-way ANOVA,
p=0.27). (G) LY48 calcium imaging concentration response curves for mGluR2 and mGluR2-I779A (EC50 = 5.46 ± 0.01). mGluR2-I779A has ~31% lower
efficacy than mGluR2 at saturating LY48. All values are normalized to saturating (1 mM) glutamate. * indicates statistical significance (two-way ANOVA,
p=6.2E-9). (H) Glutamate FRET concentration response curve for mGluR2 and mGluR2-I779A (EC50 = 33.63 ± 0.07). All values are normalized to
saturating (1 mM) glutamate. * indicates statistical significance (two-way ANOVA, p=0.00060). (I) Glutamate FRET concentration response curve for
mGluR3 and mGluR3-I788A (EC50 = 0.66 ± 0.05). All values are normalized to saturating (1 mM) glutamate. * indicates statistical significance (two-way
ANOVA, p=0.030). Associated figure supplement includes Figure 5—figure supplement 1.
The online version of this article includes the following source data and figure supplement(s) for figure 5:
Source data 1. Data and statistics for Figure 5 and associated supplemental figure.
Figure supplement 1. Further characterization of TM6 in mGluR activation.

                                     similar decrease in TMD dimerization (Figure 5B). Importantly, surface expression did not differ
                                     between wild-type and mutant constructs (Figure 5C; Figure 5—figure supplement 1B).
                                         To determine whether functional differences exist between the mutants, we performed calcium
                                     imaging experiments with mutations in the full-length mGluR2 background. mGluR2-I779W, -I779A,
                                     and -P778A-I779A all showed right-shifted concentration response curves compared to mGluR2
                                     while mGluR2-P778A was not significantly different but did show a modest left-shift (Figure 5D,F;
                                     Figure 5—figure supplement 1D,E). Similar to mGluR2, mGluR3-I788A showed a 19-fold rightward
                                     shift in glutamate response compared to wild-type (Figure 5E,F; Figure 5—figure supplement 1F),
                                     suggesting that this residue indeed plays an important conserved role in group II mGluR activation.
                                         Having confirmed the importance of inter-TM6 interactions to orthosteric activation, we asked if
                                     this interface also influences allosteric drug activation. It remains unclear how similar the orthosteric
                                     and allosteric activation pathways are given that these ligands bind at very distant sites and are able
                                     to activate mGluRs independently of each other. mGluR2 and mGluR4 PAMs can activate full-length
                                     receptors even in the presence of orthosteric antagonists suggesting that LBD-driven re-arrange-
                                     ment can be bypassed by TMD-targeting compounds (Gutzeit et al., 2019; Rovira et al., 2015).
                                     We tested the response of mGluR2-I779A to LY48 and found a 12-fold rightward shift and a 29.9%
                                     reduction in maximal PAM efficacy compared to saturating glutamate (Figure 5G). Together, these
                                     results clearly indicate that TM6 interactions also play a role in allosteric activation.
                                         Next, we asked how perturbing the TM6 interface would alter the conformational dynamics
                                     detected by our TMD FRET sensors. We introduced the I779A mutation into the mGluR2 inter-sub-
                                     unit FRET sensor and observed a modest right shift in the concentration response curve (Figure 5H;
                                     Figure 5—figure supplement 1G). While the functional assay revealed an 11-fold rightward shift for
                                     I779A, the change in EC50 was only two-fold, suggesting that this sensor primarily senses steps in
                                     the activation process that occur prior to TM6 interface formation or conformational changes stabi-
                                     lized by the TM6 interface. A similar, small right-shift was observed with the mGluR3 inter-TMD
                                     FRET sensor (Figure 5I; Figure 5—figure supplement 1H). Combined, these results underscore the
                                     importance of the TM6 interface in the conformational changes that drive group II mGluR activation.
                                         Having determined that both the cytosolic end of TM4 and the extracellular end of TM6 shape
                                     the mGluR activation process, we next sought to further clarify the specific role of each region in
                                     mediating TMD dimerization with the hypothesis that a TM4 to TM6 interface switch occurs during
                                     both orthosteric and allosteric activation. This model is both based on our data and aforementioned
                                     previous cross-linking and structural studies (Koehl et al., 2019; Xue et al., 2015). We decided to
                                     conduct SiMPull experiments on wild-type and mutant receptors in the presence of ligands to inves-
                                     tigate effects on receptor dimerization.
                                         We previously found that allosteric drugs did not alter the dimerization of the mGluR2 TMD
                                     (Gutzeit et al., 2019). However, we anticipated that mutating either the TM4 or TM6 interface
                                     (Figure 6A) would sensitize the mGluR2-TMD to shifts in dimerization propensity produced by favor-
                                     ing distinct states. Indeed, while wild-type mGluR2-TMD showed no sensitivity to PAM or NAM
                                     treatment, mGluR2-TMD-3xTM4 showed a clear increase in dimerization following treatment with a
                                     PAM (TASP) while mGluR2-TMD-I779A showed a clear increase following treatment with a NAM
                                     (MNI 137) (Figure 6C; Figure 6—figure supplement 1A). This result is consistent with a model
                                     where PAM treatment shifts the dimer toward a TM6 interface enabling rescue of reduced TM4-
                                     mediated dimerization for 3xTM4, whereas NAM treatment shifts the dimer toward a TM4 interface

Thibado et al. eLife 2021;10:e67027. DOI: https://doi.org/10.7554/eLife.67027                                                                  15 of 32
You can also read