Loss of centromere function drives karyotype evolution in closely related Malassezia species - eLife
←
→
Page content transcription
If your browser does not render page correctly, please read the page content below
RESEARCH ARTICLE

                                     Loss of centromere function drives
                                     karyotype evolution in closely related
                                     Malassezia species
                                     Sundar Ram Sankaranarayanan1, Giuseppe Ianiri2†, Marco A Coelho2,
                                     Md Hashim Reza1, Bhagya C Thimmappa1‡, Promit Ganguly1,
                                     Rakesh Netha Vadnala3, Sheng Sun2, Rahul Siddharthan3, Christian Tellgren-Roth4,
                                     Thomas L Dawson Jnr5,6, Joseph Heitman2*, Kaustuv Sanyal1*
                                     1
                                       Molecular Mycology Laboratory, Molecular Biology and Genetics Unit, Jawaharlal
                                     Nehru Centre for Advanced Scientific Research, Bengaluru, India; 2Department of
                                     Molecular Genetics and Microbiology, Duke University Medical Center, Durham,
                                     United States; 3The Institute of Mathematical Sciences/HBNI, Chennai, India;
                                     4
                                       National Genomics Infrastructure, Science for Life Laboratory, Department of
                                     Immunology, Genetics and Pathology, Uppsala University, Uppsala, Sweden; 5Skin
                                     Research Institute Singapore, Agency for Science, Technology and Research
                                     (A*STAR), Singapore, Singapore; 6Department of Drug Discovery, Medical
                                     University of South Carolina, School of Pharmacy, Charleston, United States
*For correspondence:
heitm001@duke.edu (JH);
sanyal@jncasr.ac.in (KS)

Present address: †Department
                                     Abstract Genomic rearrangements associated with speciation often result in variation in
of Agricultural, Environmental
                                     chromosome number among closely related species. Malassezia species show variable karyotypes
and Food Sciences, University of     ranging between six and nine chromosomes. Here, we experimentally identified all eight
Molise, Campobasso, Italy;           centromeres in M. sympodialis as 3–5-kb long kinetochore-bound regions that span an AT-rich core
‡
  Department of Biochemistry,        and are depleted of the canonical histone H3. Centromeres of similar sequence features were
Robert-Cedergren Centre for          identified as CENP-A-rich regions in Malassezia furfur, which has seven chromosomes, and histone
Bioinformatics and Genomics,         H3 depleted regions in Malassezia slooffiae and Malassezia globosa with nine chromosomes each.
University of Montreal, Montreal,    Analysis of synteny conservation across centromeres with newly generated chromosome-level
Canada                               genome assemblies suggests two distinct mechanisms of chromosome number reduction from an
Competing interests: The             inferred nine-chromosome ancestral state: (a) chromosome breakage followed by loss of
authors declare that no              centromere DNA and (b) centromere inactivation accompanied by changes in DNA sequence
competing interests exist.           following chromosome–chromosome fusion. We propose that AT-rich centromeres drive karyotype
Funding: See page 26                 diversity in the Malassezia species complex through breakage and inactivation.

Received: 26 November 2019
Accepted: 20 January 2020
Published: 20 January 2020

Reviewing editor: Wolf-Dietrich
                                     Introduction
Heyer, University of California,
                                     Centromeres are the genomic loci on which the kinetochore, a multi-subunit complex, assembles to
Davis, United States                 facilitate high-fidelity chromosome segregation. The centromere-specific histone H3 variant CENP-A
                                     is the epigenetic hallmark of centromeres, as it replaces canonical histone H3 in the nucleosomes to
   Copyright Sankaranarayanan
                                     make specialized centromeric chromatin that acts as the foundation to recruit other kinetochore pro-
et al. This article is distributed
                                     teins. A remarkable diversity in the organization of centromere DNA sequences has been observed
under the terms of the Creative
Commons Attribution License,         to accomplish this conserved role (Roy and Sanyal, 2011; Yadav et al., 2018b).
which permits unrestricted use           The smallest known centromeres are the point centromeres present in budding yeasts of the fam-
and redistribution provided that     ily Saccharomycetaceae that span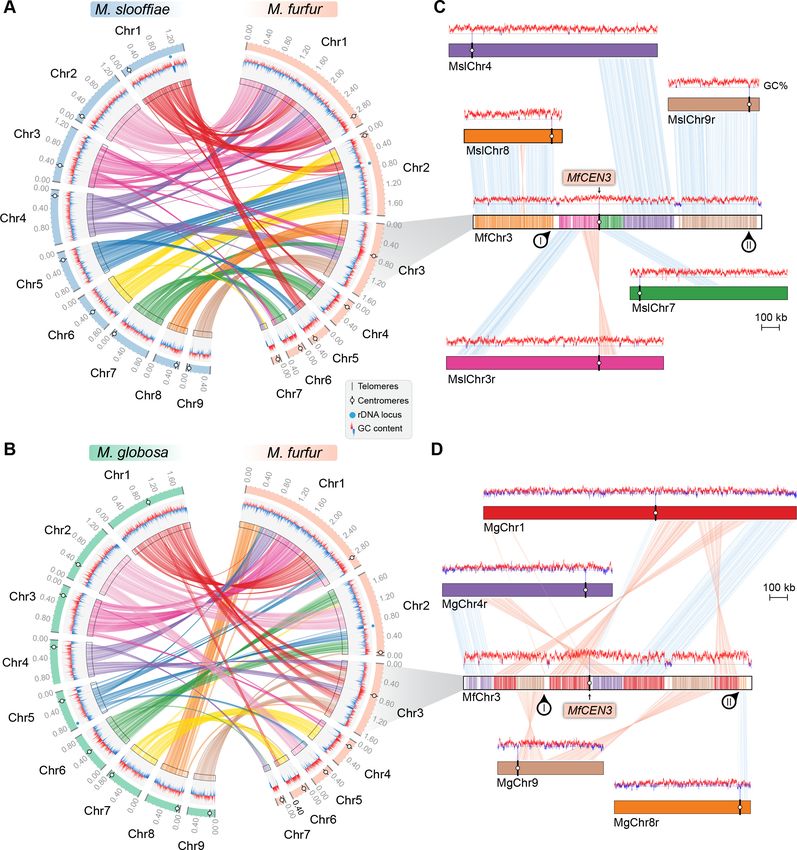
Research article                                                                                      Genetics and Genomics

                                   eLife digest Millions of yeast, bacteria and other microbes live in or on the human body. A type
                                   of yeast known as Malassezia is one of the most abundantmicrobes living on our skin. Generally,
                                   Malassezia do not cause symptoms in humans but are associated with dandruff, dermatitis and other
                                   skin conditions in susceptible individuals. They have also been found in the human gut, where they
                                   exacerbate Crohn’s disease and pancreatic cancer.
                                      There are 18 closely related species of Malassezia and all have an unusually small amount of
                                   genetic material compared with other types of yeast. In yeast, like in humans, the genetic material is
                                   divided among several chromosomes. The number of chromosomes in different Malassezia species
                                   varies between six and nine.
                                      A region of each chromosome known as the centromere is responsible for ensuring that the
                                   equal numbers of chromosomes are passed on to their offspring. This means that any defects in
                                   centromeres can lead to the daughter yeast cells inheriting unequal numbers of chromosomes.
                                   Changes in chromosome number can drive the evolution of new species, but it remains unclear if
                                   and how centromere loss may have contributed to the evolution of Malassezia species.
                                      Sankaranarayanan et al. have now used biochemical, molecular genetic, and comparative
                                   genomic approaches to study the chromosomes of Malassezia species. The experiments revealed
                                   that nine Malassezia species had centromeres that shared common features such as being rich in
                                   adenine and thymine nucleotides, two of the building blocks of DNA.
                                      Sankaranarayanan et al. propose that these adenines and thymines make the centromeres more
                                   fragile leading to occasional breaks. This may have contributed to the loss of centromeres in some
                                   Malassezia cells and helped new species to evolve with fewer chromosomes.
                                      A better understanding of how Malassezia organize their genetic material should enable in-depth
                                   studies of how these yeasts interact with their human hosts and how they contribute to skin disease,
                                   cancer, Crohn’s disease and other health conditions. More broadly, these findings may help
                                   scientists to better understand how changes in chromosomes cause new species to evolve.

                                   making them genetically defined centromeres. Small regional centromeres, identified in several Can-
                                   dida species, form the second category (Sanyal et al., 2004; Padmanabhan et al., 2008;
                                   Kapoor et al., 2015; Chatterjee et al., 2016) and have a 2–5-kb region enriched by kinetochore
                                   proteins. These centromeres can either have unique DNA sequences or a homogenized core that is
                                   flanked by inverted repeats. The third type of centromere structure is the large regional centromere,
                                   which is often repetitive in sequence and spans more than 15 kb. Large regional centromeres can be
                                   transposon-enriched, as in Cryptococcus species, or organized into repeat structures around a cen-
                                   tral core, as in Schizosaccharomyces pombe (Chikashige et al., 1989; Clarke and Baum, 1990;
                                   Sun et al., 2017; Yadav et al., 2018b).
                                       Although the organization of DNA elements is variable, a majority of known centromeres share
                                   AT-richness as a common feature. Examples include the CDEII of point centromeres, central core
                                   sequences in S. pombe, and centromeres of Neurospora crassa, Magnaporthe oryzae, Plasmodium
                                   falciparum, and diatoms (Fitzgerald-Hayes et al., 1982; Iwanaga et al., 2010; Rhind et al., 2011;
                                   Kapoor et al., 2015; Diner et al., 2017; Yadav et al., 2019). Even the recently described mosaic
                                   centromere structure observed in Mucor circinelloides that has lost CENP-A comprises an AT-rich
                                   kinetochore-bound core region (Navarro-Mendoza et al., 2019). Although suppression of recombi-
                                   nation around centromeres has been correlated with reduced GC content (Lynch et al., 2010), the
                                   genetic underpinning that determines how an AT-rich DNA region favors kinetochore assembly
                                   remains unclear. Ironically, AT-rich sequences have been shown to be fragile sites within a chromo-
                                   some (Zhang and Freudenreich, 2007).
                                       Several lines of evidence suggest that centromeres are species-specific and are among the most
                                   rapidly evolving genomic regions, showing variation even between closely related species
                                   (Bensasson et al., 2008; Padmanabhan et al., 2008; Rhind et al., 2011; Roy and Sanyal, 2011).
                                   This evolution is accompanied by the concomitant evolution of CENP-A and the associated kineto-
                                   chore proteins (Talbert et al., 2004). Functional incompatibilities between centromeres result in uni-
                                   parental genome elimination in interspecies hybrids (Ravi and Chan, 2010; Sanei et al., 2011). The

Sankaranarayanan et al. eLife 2020;9:e53944. DOI: https://doi.org/10.7554/eLife.53944                                             2 of 33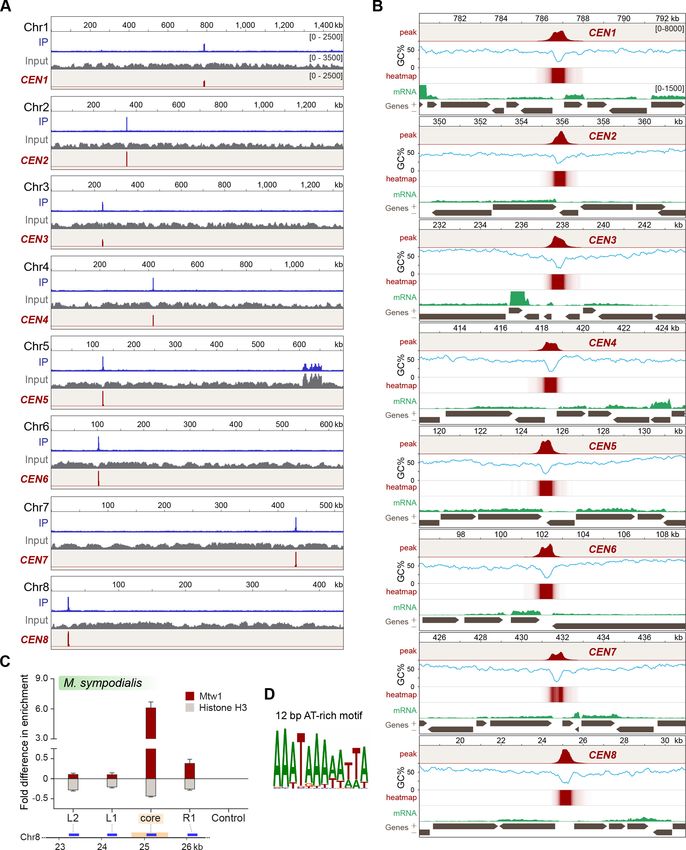
Research article                                                                                      Genetics and Genomics

                                   divergent nature of centromeres is proposed to be a driving force for speciation (Henikoff et al.,
                                   2001; Malik and Henikoff, 2009).
                                      Asexual organisms, by virtue of inter- and intra-chromosomal rearrangements, diversify into spe-
                                   cies clusters that are distinct in genotype and morphology (Barraclough et al., 2003). These geno-
                                   typic differences include changes in both chromosomal organization and number. Centromere
                                   function is directly related to karyotype stabilization following a change in chromosome number.
                                   Rearrangements in the form of telomere–telomere fusions and nested chromosome insertions
                                   (NCIs), wherein an entire donor chromosome is ‘inserted’ into or near the centromere of a non-
                                   homologous recipient chromosome, are among the major sources of chromosome number reduction
                                   (Lysak, 2014). Such events often result in the formation of dicentric chromosomes that are subse-
                                   quently stabilized by breakage-fusion-bridge cycles (McClintock, 1941) or via inactivation of one
                                   centromere through different mechanisms (Han et al., 2009; Sato et al., 2012). Well-known exam-
                                   ples of telomere–telomere fusions include the formation of extant human chromosome 2 by fusion
                                   of two ancestral chromosomes (Yunis and Prakash, 1982; IJdo et al., 1991), the reduction in karyo-
                                   type observed within members of the Saccharomycotina such as Candida glabrata, Vanderwalto-
                                   zyma polyspora, Kluyveromyces lactis, and Zygosaccharomyces rouxii (Gordon et al., 2011), and the
                                   exchange of chromosomal arms seen in plants and fungi (Schubert and Lysak, 2011; Sun et al.,
                                   2017). NCIs have predominantly shaped karyotype evolution in grasses (Murat et al., 2010).
                                   Reduction of chromosome number by centromere loss has also been reported (Gordon et al.,
                                   2011).
                                      To investigate whether centromere breakage can be a natural source of karyotype diversity in
                                   closely related species, we sought to identify centromeres in a group of Malassezia yeast species
                                   that exhibit variation in chromosome number. Malassezia species are lipid-dependent basidiomyce-
                                   tous fungi that are naturally found as part of the animal skin microbiome (Theelen et al., 2018).
                                   At present, the Malassezia genus includes 18 species divided into three clades: A, B, and C. These
                                   species also have unusually compact genomes of less than 9 Mb, organized into six to nine chromo-
                                   somes as revealed by electrophoretic karyotyping of some of these species (Boekhout and Bos-
                                   boom, 1994; Boekhout et al., 1998; Wu et al., 2015). Fungemia-associated species such as
                                   Malassezia furfur belong to Clade A. Clade B includes common inhabitants of human skin that are
                                   phylogenetically clustered into two subgroups, namely Clade B1 that contains Malassezia globosa
                                   and Malassezia restricta and Clade B2 that contains Malassezia sympodialis and related species.
                                   Clade C includes Malassezia slooffiae and Malassezia cuniculi, which diverged earlier from a Malasse-
                                   zia common ancestor (Wu et al., 2015; Lorch et al., 2018).
                                      Besides humans, Malassezia species have been detected on the skin of other animals. For exam-
                                   ple, M. slooffiae was isolated from cows and goats, M. equina from horses, M. brasiliensis and M.
                                   psittaci from parrots, and the cold-tolerant species M. vespertilionis from bats (Lorch et al., 2018;
                                   Theelen et al., 2018). In addition, culture-independent studies of fungi from environmental samples
                                   showed that Malassezia species that are closely related to those found on human skin were also
                                   detected in diverse niches, such as deep-sea vents, soil invertebrates, hydrothermal vents, corals,
                                   and Antarctic soils (Amend, 2014). More than ten Malassezia species have been detected as a part
                                   of the human skin microbiome (Findley and Grice, 2014). The human skin commensals such as M.
                                   globosa, M. restricta, and M. sympodialis have been associated with dermatological conditions such
                                   as dandruff/seborrheic dermatitis, atopic dermatitis, and folliculitis (Theelen et al., 2018). Recent
                                   reports implicate M. restricta in conditions such as Crohn’s disease and M. globosa in the progres-
                                   sion of pancreatic cancer (pancreatic ductal adenocarcinoma) (Aykut et al., 2019; Limon et al.,
                                   2019). Elevated levels of Malassezia species and the resulting inflammatory host response have
                                   been implicated in both of these disease states. The nature of genomic rearrangements in each spe-
                                   cies may influence its ability to adapt and cause disease in a specific host niche. Thus, studying the
                                   mechanisms of karyotype evolution is an important step towards understanding the evolution of the
                                   Malassezia species complex.
                                      Kinetochore proteins serve as useful tools in the identification of centromeres because of their
                                   centromere-exclusive localization. CENP-A replaces histone H3 in the centromeric nucleosomes. This
                                   has been shown as a reduction in histone H3 levels at the centromeres in Candida lusitaniae
                                   (Kapoor et al., 2015) and in a human neocentromere (Lo et al., 2001). These CENP-A nucleosomes
                                   act as a foundation to recruit CENP-C, the KMN (KNL1C-MIS12C-NDC80C) network, and other
                                   kinetochore proteins (Musacchio and Desai, 2017).

Sankaranarayanan et al. eLife 2020;9:e53944. DOI: https://doi.org/10.7554/eLife.53944                                             3 of 33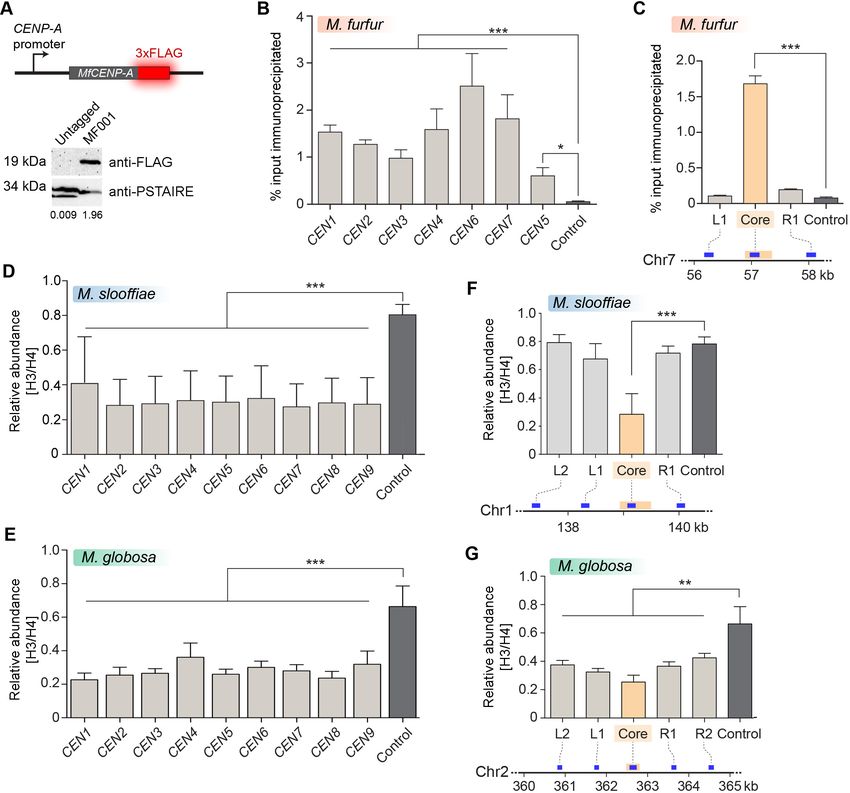
Research article                                                                                      Genetics and Genomics

                                      In this study, we experimentally validated all of the eight centromeres of M. sympodialis using the
                                   Mtw1 protein (Mis12 in S. pombe), a subunit of the KMN complex, as the kinetochore marker. The
                                   Mis12 complex proteins are evolutionarily conserved outer kinetochore proteins that link the chro-
                                   matin-associated inner kinetochore proteins to the microtubule-associated outer kinetochore pro-
                                   teins. Members of the Mis12 complex localize to centromeres in other organisms (Goshima et al.,
                                   1999; Goshima et al., 2003; Westermann et al., 2003; Roy et al., 2011). Recent studies suggest
                                   that the protein domains associated with the Mis12 complex members are exclusive to kinetochore
                                   proteins and are not detected in any other proteins, making them attractive tools for identifying cen-
                                   tromere sequences (Tromer et al., 2019). Using the features of centromeres of M. sympodialis and
                                   newly generated chromosome-level genome assemblies, we predicted centromeres in related
                                   Malassezia species carrying seven, eight, or nine chromosomes, and experimentally validated the
                                   centromere identity in representative species of each karyotype, each belonging to a different
                                   Malassezia clade. We employed gene synteny conservation across these centromeres to understand
                                   their transitions from an inferred ancestral state of nine chromosomes. On the basis of our results,
                                   we propose that centromere loss by two distinct mechanisms drives karyotype diversity.

                                   Results
                                   Chromosome number varies in the Malassezia species complex
                                   Previous reports that are based on pulsed-field gel electrophoresis (PFGE) have suggested that chro-
                                   mosome number varies within the Malassezia species complex. The early diverged species M. sloof-
                                   fiae of Clade C was reported to have nine chromosomes (Boekhout et al., 1998). Clade B
                                   Malassezia species are reported to have nine (M. globosa and M. restricta), eight (M. sympodialis),
                                   or six chromosomes (M. pachydermatis). Among the Clade A species, M. obtusa and M. furfur
                                   CBS14141 were both reported to have seven chromosomes (Boekhout and Bosboom, 1994;
                                   Zhu et al., 2017). A high-quality reference genome is a prerequisite to understanding the rearrange-
                                   ments associated with chromosome number variation. In addition, such a reference genome will also
                                   assist in resolving ambiguities in PFGE-based estimates of chromosome number when similar-sized
                                   chromosomes are present. Complete genome assemblies were not available for many of the species
                                   with reported numbers of chromosomes. To obtain better-assembled reference genomes, we
                                   sequenced the genomes of M. slooffiae and M. globosa as representatives of the nine-chromosome
                                   state, and of M. furfur as a representative of the seven-chromosome state, using PacBio SMRT
                                   sequencing technology (Figure 1, Figure 1—figure supplement 1).
                                       The M. globosa genome was completely assembled into nine contigs with telomeres on both
                                   ends (BioSample accession SAMN10720087). We validated these contigs by matching each band on
                                   the pulsed-field gel with the contig sizes from the genome assembly, and further confirmed these by
                                   chromoblot analysis following PFGE. This analysis shows that chromosome 5 contains the rDNA
                                   locus and migrates further than the expected size of 902 kb, as a diffuse ensemble of different sizes
                                   along with chromosome 3 (Figure 1A). The assembled genome of M. slooffiae has 14 contigs of
                                   which nine contigs have telomeres on both ends, indicative of nine chromosomes (BioSample acces-
                                   sion SAMN10720088). Each of the nine contigs could be assigned to the bands observed in the
                                   pulsed-field gel (Figure 1B). For M. furfur, the final genome assembly consisted of seven contigs
                                   with telomeres on both ends and matched the expected chromosome sizes obtained from an earlier
                                   PFGE analysis of CBS14141 (Figure 1C). The complete genome assembly of M. sympodialis
                                   reported earlier is distributed into eight chromosomes with telomere repeats on both ends
                                   (Figure 1D), and serves as a representative of an eight-chromosome state in this study.
                                       Changes in chromosome number are always associated with the birth or loss of centromeres,
                                   which stabilizes the karyotype in organisms with monocentric chromosomes. To understand the tran-
                                   sitions between these different karyotypic states observed in the Malassezia species complex, we
                                   sought to validate centromeres in species representative of each karyotype experimentally.

                                   Kinetochores cluster and localize to the nuclear periphery in M.
                                   sympodialis
                                   Organisms that have point centromeres possess Ndc10, Cep3, and Ctf13 of the CBF3 complex, a
                                   cognate protein complex that is specific to point centromeres. None of these point-centromere-

Sankaranarayanan et al. eLife 2020;9:e53944. DOI: https://doi.org/10.7554/eLife.53944                                             4 of 33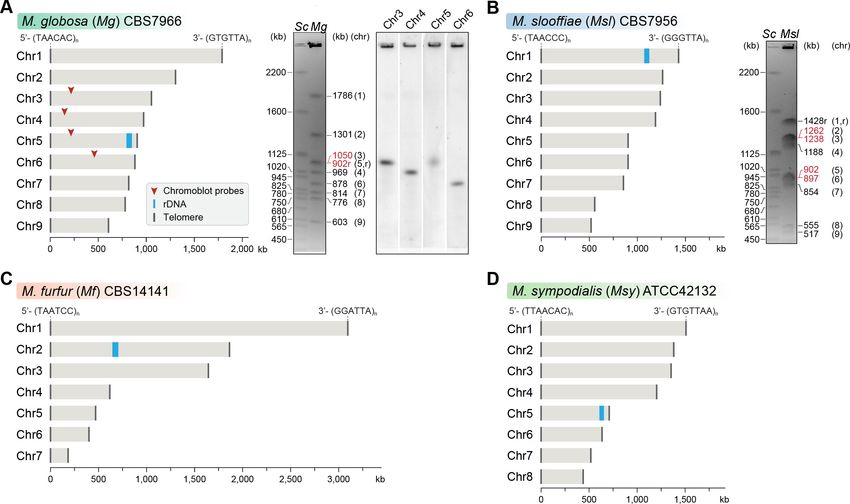
Research article                                                                                                 Genetics and Genomics

Figure 1. Genome assembly and karyotype diversity in representative Malassezia species. The genomes of (A) M. globosa, (B) M. slooffiae, and (C) M.
furfur were sequenced and assembled in this study, whereas the genome assembly of (D) M. sympodialis was reported earlier (Zhu et al., 2017) and is
shown for comparison. In each panel, bar plots represent the assembled chromosomes of the indicated Malassezia species, with the telomeres and the
ribosomal DNA (rDNA) marked as dark gray and blue bars, respectively. Telomere-repeat motifs are shown at the 50 - and 30 -ends of the Chr1 in each
species. Electrophoretic karyotypes of M. globosa (Mg) and M. sloffiiae (Msl), are shown in (A) and (B), respectively, with chromosome sizes estimated
from the genome assembly. Chromosomes of Saccharomyces cerevisiae (Sc) served as size markers. The chromosome containing the rDNA (marked
with an ‘r’), in M. globosa, co-migrates with Chr3. This was assessed by chromoblot hybridization using unique sequences from Chr3, Chr4, Chr5, and
Chr6 as probes (regions indicated by red arrowheads). Chromosomes of similar size (denoted in red) migrate together in the gel and appear as a
doublet band (i.e. MgChr3–MgChr5, MslChr2–MslChr3, and MslChr5–MslChr6).
The online version of this article includes the following source data and figure supplement(s) for figure 1:
Figure supplement 1. Statistics of the genome assemblies of M. globosa, M. slooffiae, and M. furfur generated in this study.
Figure supplement 1—source data 1. Statistics of the genome assemblies of M. globosa, M. slooffiae, and M. furfur generated in this study.

                                    specific proteins could be detected in M. sympodialis. However, we could detect homologs of
                                    CENP-A, CENP-C, and most of the outer kinetochore proteins in the genome of M. sympodialis
                                    (Figure 2A and Figure 2—figure supplement 1). We functionally expressed an N-terminally GFP-
                                    tagged Mtw1 protein (Protein ID: SHO76526.1) from its native promoter, and the expression of the
                                    fusion protein was confirmed by western blotting (Figure 2B). Upon staining with anti-GFP antibod-
                                    ies and DAPI (40 ,6-diamidino-2-phenylindole), we were able to detect punctate localization of Mtw1
                                    at the nuclear periphery (Figure 2C), consistent with the clustered kinetochore localization observed
                                    in other yeasts (Goshima et al., 1999; Euskirchen, 2002; Roy et al., 2011). Live-cell images of
                                    MSY001 (GFP-MTW1) cells revealed that the kinetochores (GFP-Mtw1) remained clustered through-
                                    out the cell cycle, starting from unbudded G1 cells in interphase to large-budded cells in mitosis
                                    (Figure 2D).

Sankaranarayanan et al. eLife 2020;9:e53944. DOI: https://doi.org/10.7554/eLife.53944                                                          5 of 33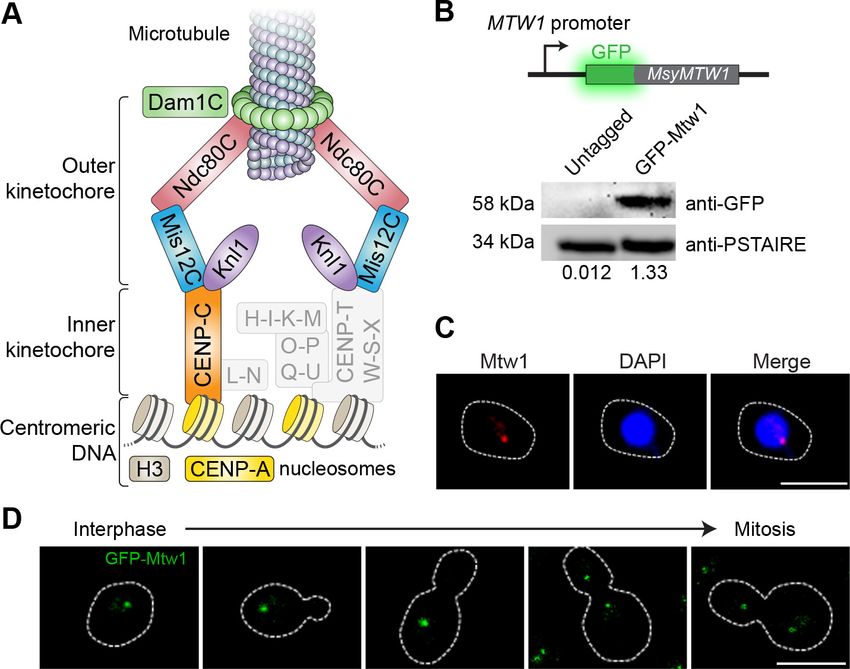
Research article                                                                                                   Genetics and Genomics

Figure 2. Kinetochores cluster and localize at the nuclear periphery in M. sympodialis. (A) Schematic of the kinetochore organization of M. sympodialis.
Gray boxes indicate proteins absent in M. sympodialis. The outer kinetochore protein Mtw1 (a component of Mis12C) served as the kinetochore marker
in the present study. (B) Line diagram representation of Mtw1 tagged with GFP at the N- terminus. Immunoblot analysis of whole-cell lysates prepared
from the untagged M. sympodialis strain (ATCC42132) and from GFP-Mtw1 expressing cells (MSY001) probed with anti-GFP antibodies and anti-
PSTAIRE antibodies. PSTAIRE served as a loading control. Relative intensity values normalized to PSTAIRE are indicated below each lane. (C)
Logarithmically grown MSY001 cells expressing GFP-Mtw1 were fixed and stained with DAPI (blue) and anti-GFP antibodies (pseudo-colored in red).
Scale bar, 2.5 mm. (D) Cell cycle stage-specific localization dynamics of GFP-Mtw1. Scale bar, 2.5 mm.
The online version of this article includes the following source data and figure supplement(s) for figure 2:
Figure supplement 1. Identification of kinetochore proteins in M. sympodialis by BLAST.
Figure supplement 1—source data 1. Identification of kinetochore proteins in M. sympodialisby BLAST.

                                     Mtw1 is localized to a single region at the GC minima of each M.
                                     sympodialis chromosome
                                     Having identified Mtw1 as an authentic kinetochore protein, we performed ChIP-sequencing using
                                     the GFP-Mtw1 expressing strain of M. sympodialis (MSY001). Mapping the reads to the reference
                                     genome of M. sympodialis strain ATCC42132 (Zhu et al., 2017) identified one significantly enriched
                                     locus on each of the eight chromosomes (Figure 3A). The lengths of the Mtw1-enriched centromere
                                     regions identified from the ChIP-seq analysis ranged from 3167 bp to 5143 bp with an average
                                     length of 4165 bp (Table 1). However, the region of maximum Mtw1 enrichment on each

Sankaranarayanan et al. eLife 2020;9:e53944. DOI: https://doi.org/10.7554/eLife.53944                                                            6 of 33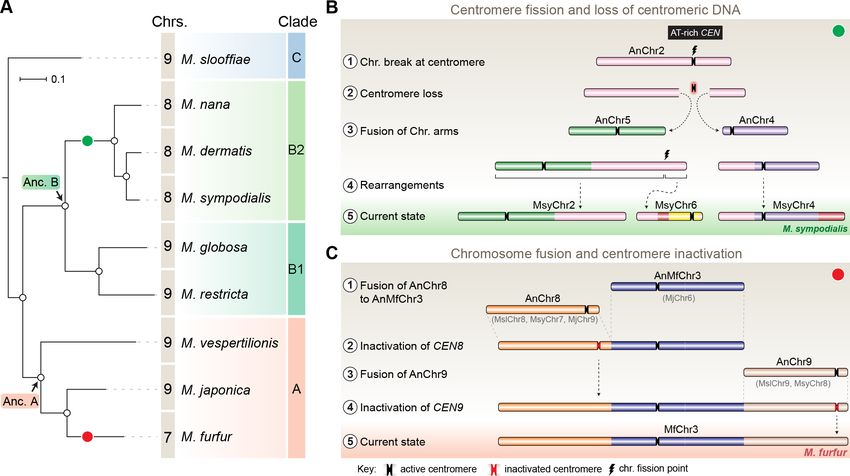
Research article                                                                                         Genetics and Genomics

Table 1. Coordinates of centromeres and their GC content in M. sympodialis.
Coordinates and length of Mtw1-enriched regions in comparison with those of the core centromeres in M. sympodialis.
                                                      Core centromere                           Full-length centromere
                                Coordinates                                                     Coordinates
Chromosome number               Start           End             Length (bp)             %GC     Start           End             Length (bp)
1                               786,541         787,061         520                     16.4    784,833         788,599         3767
2                               355,760         355,841         81                      20      354,218         357,486         3269
3                               237,534         238,686         1152                    15.6    235,615         239,940         4326
4                               418,202         418,728         526                     15.2    415,985         420,656         4672
5                               125,056         125,220         164                     18      123,219         127,284         4066
6                               101,950         102,502         552                     14.4    100,342         105,251         4910
7                               431,542         431,987         445                     13.2    430,028         433,194         3167
8                               24,694          25,564          870                     18.4    22,334          27,476          5143

Genome average GC content (in %): 58.5.

                                    chromosome (based on the number of sequenced reads aligned) mapped to the intergenic region
                                    harboring the GC trough (approximately 1 kb long), which was previously predicted to be the cen-
                                    tromeres of M. sympodialis (Figure 3B) (Zhu et al., 2017). The regions of Mtw1 enrichment span
                                    beyond the core centromeres and include active genes located proximal to these troughs
                                    (Figure 3B, Figure 3—figure supplement 1A). However, these open reading frames (ORFs) do not
                                    show consensus features such as the orientation of transcription or functional classification. We vali-
                                    dated this enrichment by ChIP-qPCR analysis with primers homologous to the predicted centro-
                                    meres compared to those homologous to a control region distant from the centromere (Figure 3—
                                    figure supplement 1B).

                                    Histone H3 is depleted at the core centromere with active genes at the
                                    pericentric regions in M. sympodialis
                                    The presence of CENP-A nucleosomes at the kinetochore should result in reduced histone H3
                                    enrichment at the centromeres when compared to a non-centromeric locus. To test this, we per-
                                    formed ChIP with anti-histone H3 antibodies and analyzed the immunoprecipitated (IP) DNA by
                                    qPCR. As compared to a control ORF region that is unlinked to the centromere (190 kb away from
                                    CEN1), the pericentric regions flanking the core centromere showed a marginal reduction in histone
                                    H3 enrichment, which was further reduced at the core, that maps to the GC trough with the highest
                                    enrichment of the kinetochore protein Mtw1. That the core centromere region showing the maxi-
                                    mum depletion of histone H3 coincided with the regions most enriched with Mtw1 further supports
                                    that histone H3, in these regions, is possibly replaced by its centromere-specific variant CENP-A
                                    (Figure 3C).

                                    The short regional centromeres of M. sympodialis are enriched with a
                                    12-bp-long AT-rich consensus sequence motif
                                    To understand the features of M. sympodialis centromeres, we analyzed the centromere DNA
                                    sequences for the presence of consensus motifs or structures such as inverted repeats. PhyloGibbs-
                                    MP (Siddharthan et al., 2005; Siddharthan, 2008) predicted a 12-bp-long AT-rich motif common to
                                    all of the centromere sequences of M. sympodialis (Figure 3D). We swept the PWM from the Phylo-
                                    Gibbs-MP output across each chromosome of M. sympodialis and counted the number of motif pre-
                                    dictions in a sliding 500-bp window, sliding by 100 bp at a time. Sites with log-likelihood-ratio (LLR)
                                    of >7.5 were counted as motif predictions. The LLR is the natural logarithm of the ratio of the likeli-
                                    hood of the12-bp substring arising as a sample from the PWM to the likelihood of it being generic
                                    ‘background’. In each case, the global peak coincides with the centromere (Figure 3—figure sup-
                                    plement 2A). In each chromosome, the centromere region shows between 7 and 13 motif matches,
                                    whereas no other 500-bp window shows more than three matches. This suggests that the AT-rich
                                    motif is more enriched at the centromeres than at any other region in the M. sympodialis genome

Sankaranarayanan et al. eLife 2020;9:e53944. DOI: https://doi.org/10.7554/eLife.53944                                                  7 of 33
Research article Genetics and Genomics Figure 3. Localization of Mtw1 to single-peaks identifies centromeres on each of the eight chromosomes of M. sympodialis. (A) GFP-Mtw1 ChIP-seq reads were mapped to each chromosome. The x-axis indicates chromosomal coordinates (in kb) and the y-axis indicates read depth. ‘Input’, reads from total DNA; ‘IP,’ reads from immunoprecipitated sample; CEN, Mtw1-enriched regions derived by subtracting input reads from those of the IP sample (peak values 0–2500). Additional peaks observed in both IP and input tracks on Chr5 are from the rDNA locus. (B) A 13 kb-window of the Mtw1 enrichment profile (CEN, represented as peaks and heat-map in two different tracks, red) plotted along with the GC content (%GC, blue) and regions of transcription (RNA-seq, green). Numbers in the topmost track in every panel indicate chromosomal coordinates (in kb). The scales for the y-axis are as follows: CEN (0–8000), %GC (0–75), RNA-seq reads (0–1500). Gray arrows in each panel indicate predicted ORFs based on RNA-seq data with Figure 3 continued on next page Sankaranarayanan et al. eLife 2020;9:e53944. DOI: https://doi.org/10.7554/eLife.53944 8 of 33
Research article                                                                                                    Genetics and Genomics

Figure 3 continued
arrowheads indicating the direction of transcription of the corresponding gene, also marked as ‘+’ and ‘–’ in the axis label. (C) Fold difference in Mtw1
and histone H3 enrichment at CEN8, as compared to a non-centromeric control region (190 kb away on the right of CEN1) by qPCR analysis. Schematic
of a 4-kb region of Chr8 with the CEN8 core (yellow box) is depicted below the graph. Blue lines indicate regions assayed by PCR: core-region
corresponding to the GC trough; L1 and R1, 750 bp away from the core; L2, 1500 bp away from the core; and a non-centromeric control region (190 kb
away from centromere in Chr1). The x-axis indicates regions across the CEN8 probed by PCR and the y-axis indicates fold difference in the enrichment
of Mtw1 and histone H3 as compared to the control region. Error bars indicate standard deviations (SD). Values from three experiments, each
performed with three technical replicates, were used to generate the plot. (D) Logo of the consensus DNA sequence identified from M. sympodialis
centromeres, graphically represented with the size of the base corresponding with the frequency of occurrence.
The online version of this article includes the following source data and figure supplement(s) for figure 3:
Source data 1. Source raw data for Figure 3C (ChIP-qPCR for GFP-Mtw1 and Histone H3 across MsyCEN8).
Figure supplement 1. Mtw1-enriched regions in M. sympodialis contain transcriptionally active genes.
Figure supplement 1—source data 1. Source raw data for Figure 3—figure supplement 1B (ChIP-qPCR for GFP-Mtw1 across all M. sympodialis
centromeres).
Figure supplement 2. Sequence features of centromeres in M. sympodialis.
Figure supplement 3. Enrichment of the 12-bp motif at the centromere core in M. sympodialis.

                                     (Figure 3—figure supplement 2A). To ensure that this is not an artifact of the GC-poor nature of
                                     the centromere, we repeated the analysis with a synthetic shuffled PWM, created by scrambling the
                                     order of the columns of the original PWM (that is, scrambling the positions in the motif while keep-
                                     ing the corresponding weight vectors the same). This shuffled motif showed more matches in the
                                     centromeres than are seen in the non-centromeric genomic sequence, but significantly fewer than
                                     are seen in the authentic centromeric sequences of most chromosomes (Figure 3—figure supple-
                                     ment 2B). A dot-plot analysis was performed to detect the presence of any direct or inverted-repeat
                                     structure associated with the centromeres in M. sympodialis. Analysis of all of the centromere
                                     sequences and 5-kb flanking sequences using SyMap confirmed the lack of direct/inverted repeat
                                     structures (Figure 3—figure supplement 2C).
                                        In the absence of any centromere-exclusive DNA sequence, the unique and distinguishing fea-
                                     tures of centromere regions in M. sympodialis are an AT-rich core region of
Research article Genetics and Genomics
Table 2. Coordinates, length, and GC content (in %) of the centromeres predicted in M. furfur, M. globosa, M. slooffiae, and M.
restricta.
Core centromere
% GC
Chr./scaffold CEN Start End Length (bp) % GC genome
M. furfur Chr1 CEN1 2,850,135 2,850,402 268 15.7 64.9
CBS14141
Chr2 CEN2 68,763 68,931 168 15.4
Chr3 CEN3 717,557 718,084 528 22.9
Chr4 CEN4 155,897 156,301 405 18.3
Chr5 CEN5 342,885 343,372 488 21.5
Chr6 CEN6 86,112 86,832 721 27
Chr7 CEN7 56,894 57,339 445 20.9
M. globosa Chr1 CEN1 981,894 982,242 349 17.7 52.05
CBS7966
Chr2 CEN2 362,480 362,807 327 25.9
Chr3 CEN3 219,647 220,121 474 27.2
Chr4 CEN4 152,635 152,994 359 18.3
Chr5 CEN5 215,437 215,595 158 17
Chr6 CEN6 464,007 464,114 107 32.4
Chr7 CEN7 736,701 737,015 314 18.1
Chr8 CEN8 59,472 59,817 345 19.7
Chr9 CEN9 114,080 114,535 455 23.5
M. slooffiae Chr1 CEN1 138,919 139,465 547 26 66.31
CBS7956
Chr2 CEN2 132,717 133,193 477 23.1
Chr3 CEN3 367,665 368,177 513 23.8
Chr4 CEN4 130,942 131,501 560 27
Chr5 CEN5 183,442 183,981 540 28.5
Chr6 CEN6 411,984 412,552 569 27.4
Chr7 CEN7 54,307 54,889 583 30
Chr8 CEN8 497,637 498,149 513 24
Chr9 CEN9 55,948 56,479 532 26.7
M. restricta Chr1 CEN1 347,813 348,406 594 29.7 55.73
CBS877
Chr2 CEN2 87,190 87,806 617 33.3
Chr3 CEN3 1,101,494 1,102,083 590 33.9
Chr4 CEN4 754,356 754,989 634 34.2
Chr5 CEN6 621,177 621,863 687 31.7
Chr6 CEN7 390,657 391,286 630 35.1
Chr7 CEN8 362,842 363,381 540 32
Chr8 CEN9 117,021 117,603 583 32.8
Chr9 CENR 70,306 70,913 608 36.3
globosa, the regions spanning a centromere (CEN2) also depicted a similar reduction in the histone
H3 levels (Figure 4G). Taken together, the significant reduction in the histone H3 levels at the pre-
dicted centromeres, indicative of the presence of CENP-A, suggests that these putative centromere
regions are indeed bona fide centromeres in these species.
Sankaranarayanan et al. eLife 2020;9:e53944. DOI: https://doi.org/10.7554/eLife.53944 10 of 33Research article Genetics and Genomics Figure 4. Centromeres in M. furfur, M. slooffiae, and M. globosa map to global GC troughs on each chromosome. (A) Schematic of epitope tagging of CENP-A with 3xFLAG at the C-terminus. (Bottom) Immunoblot analysis using whole-cell lysates prepared from the untagged wild-type M. furfur (CBS14141) cells and CENP-A-3xFLAG expressing cells (MF001) probed with anti-FLAG antibodies and anti-PSTAIRE antibodies. PSTAIRE served as the loading control. (B) Abundance of CENP-A at each of the predicted M. furfur centromeres by qPCR analysis of DNA immunoprecipitated with anti- FLAG affinity gel in MF001 cells expressing CENP-A-3xFLAG. The x-axis indicates individual CEN regions assayed with primers that are homologous to the GC troughs on each chromosome that were predicted to be centromeres (see Supplementary file 1 for primer sequences). The non-centromeric control sequence maps to a region 1.3 Mb away from predicted CEN1. The y-axis indicates enrichment of CENP-A estimated as the percentage of input immunoprecipitated. (C) Abundance of CENP-A across MfCEN7 by ChIP-qPCR analysis in MF001 cells. A schematic representation of a 2-kb region is shown below the graph. The yellow bar indicates the centromere core of CEN7 corresponding to the GC trough. Blue bars indicate regions analyzed by qPCR: L1 and R1, which are 750 bp away from the centromere core. ‘Control’ refers to a region 1.3 Mb away from CEN1. CENP-A enrichment is plotted along the y-axis as the percentage of input immunoprecipitated. (D, E) Comparison of the relative abundance of histone H3 compared to histone H4 at the predicted centromeres to a non-centromeric control locus in M. slooffiae (D) and M. globosa (E), respectively. Enrichment was estimated as the percentage of input immunoprecipitated with histone H3 and histone H4 antibodies and their ratio is plotted as Figure 4 continued on next page Sankaranarayanan et al. eLife 2020;9:e53944. DOI: https://doi.org/10.7554/eLife.53944 11 of 33
Research article                                                                                                   Genetics and Genomics

Figure 4 continued
relative enrichment (y-axis). The x-axis indicates centromeres in each species and these were assayed with primers homologous to GC troughs (i.
e. predicted centromeres) in each chromosome (see Supplementary file 1 for primer sequences). The control region that is unlinked to the centromere
corresponds to a locus 630 kb away from CEN1 in M. slooffiae and 416 kb away from CEN2 in M. globosa. (F) The relative abundance of histone H3
compared to histone H4 across MslCEN1 as determined by qPCR analysis of the DNA immunoprecipitated using histone H3 and histone H4
antibodies. A schematic of the MslCEN1 locus is shown below the graph. The yellow bar indicates the CEN1 core region corresponding to the GC
trough. Blue bars indicate regions analyzed by qPCR: L1 and L2 map to regions 750 bp and 1.5 kb to the left of the CEN1 core; R1 maps to a region
750 bp to the right of the CEN1 core. The control region corresponds to a locus 630 kb away from the CEN1 core. The ratio of enrichment of histone
H3 to that of histone H4 is plotted as the relative enrichment (y-axis). (G) The relative abundance of histone H3 compared to histone H4 across
MgCEN2 by qPCR analysis of the DNA immunoprecipitated using histone H3 and histone H4 antibodies. A schematic of a 5-kb region containing
MgCEN2 is shown below the graph. The yellow bar indicates the CEN2 core region corresponding to the GC trough. Blue bars indicate regions
analyzed by qPCR: L1 and L2 indicate regions 750 bp and 1.5 kb to the left of the CEN2 core; R1 and R2 indicate regions 750 bp and 1.5 kb to the right
of the CEN2 core. The control region corresponds to a locus 416 kb away from the CEN2 core. The ratio of enrichment of histone H3 to that of histone
H4 is plotted as the relative enrichment (y-axis). Values from three experiments, each performed with three technical replicates, were used to generate
the plots in panels (B–G). Error bars indicate standard deviations (SD). Statistical significance was tested by one-way ANOVA: *, significant at p
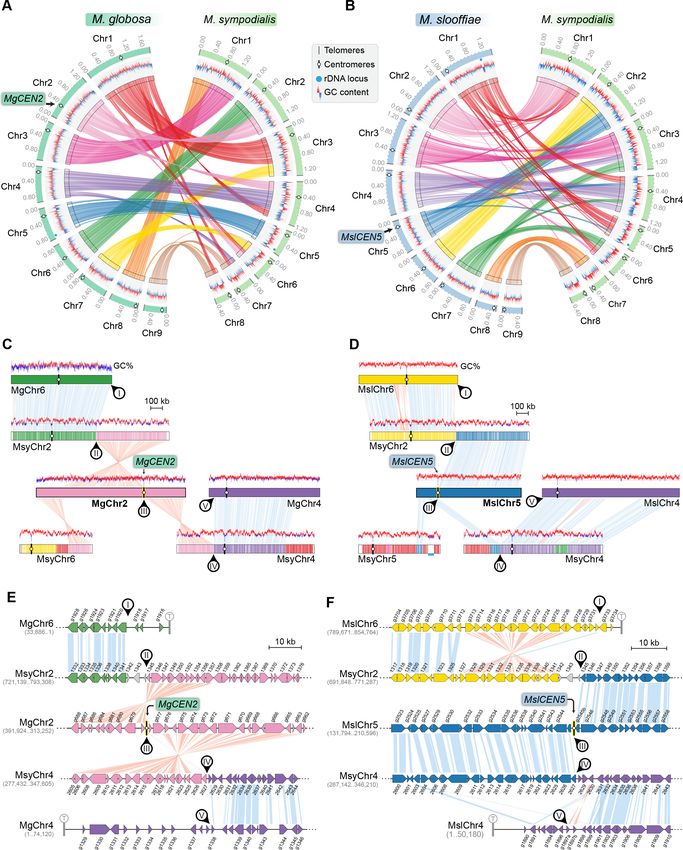
Research article                                                                                              Genetics and Genomics

Figure 5. MgCEN2 and MslCEN5 map to a synteny breakpoint in M. sympodialis. (A, B) Circos plots depicting the gene synteny blocks that are
conserved between M. globosa and M. sympodialis chromosomes and between M. slooffiae and M. sympodialis chromosomes. Tracks from outside to
inside represent the positions of centromeres and telomeres, GC content (plotted as blue and red lines indicating GC content below or above genome
Figure 5 continued on next page

Sankaranarayanan et al. eLife 2020;9:e53944. DOI: https://doi.org/10.7554/eLife.53944                                                     13 of 33
Research article                                                                                                   Genetics and Genomics

Figure 5 continued
average, calculated in 0.4-kb non-overlapping windows), and colored connectors indicate regions of conserved gene synteny between the two species.
(C, D) Linear chromosome plots depicting syntenic regions between Chr2 of M. globosa and Chr5 of M. slooffiae with chromosomes of M. sympodialis.
GC content (in %) is shown as red/blue lines above each chromosome. Circular labels mark the gene synteny breakpoints. The synteny breakpoint at
MgCEN2 and MslCEN5 is marked as III. The regions on MsyChr2 and MsyChr4 where the homologs of ORFs flanking the breakpoint are located are
marked II and IV, respectively. Labels I and V indicate gene synteny conservation on the other side of the fusion points II and IV on MsyChr2 and
MsyChr4 as compared to M. globosa and M. slooffiae chromosomes, respectively. (E, F) Zoomed-in image of the gene synteny breakpoint at MgCEN2
and MslCEN5, representing the conservation of genes flanking these centromeres in M. sympodialis chromosomes at the ORF level.

                                       that of M. furfur. Of the nine centromeres in M. slooffiae, three centromeres belonged to conserved
                                       gene synteny blocks and four others retained partial gene synteny conservation in M. furfur
                                       (Figure 6A, Table 3). A similar pattern of gene synteny conservation was observed between M. glo-
                                       bosa and M. furfur (Figure 6B, Table 3). The genes flanking the remaining two centromeres (CEN8
                                       and CEN9) in M. slooffiae were present in conserved gene synteny blocks in the two arms of MfChr3
                                       (Figure 6C). However, the regions corresponding to CEN8 and CEN9 in M. slooffiae appear to have
                                       evolved to decreased AT-richness in M. furfur. A similar centromere inactivation mechanism was
                                       observed when CEN8 and CEN9 of M. globosa were compared to the corresponding syntenic
                                       regions in M. furfur (Figure 6D). These results suggest centromere inactivation by changes in the
                                       centromeric DNA sequence in this species (Figure 6—figure supplement 1).

                                       The common ancestral Malassezia species contained nine chromosomes
                                       To trace the ancestral karyotype in Malassezia, we predicted centromeres and inferred chromosome
                                       numbers in other species of clades A and B on the basis of GC troughs and gene synteny. We identi-
                                       fied putative centromeres in M. dermatis and M. nana in Clade B because of their relatively better-
                                       assembled genomes distributed in 18 and 13 scaffolds, respectively. Of these, we could predict
                                       eight centromeric regions marked by GC troughs that were also enriched with the 12-bp motif in
                                       each species (Figure 7—figure supplement 1A–B, Figure 7—figure supplement 2A–B and
                                       Table 4). Furthermore, in both of these species, the eight putative centromeres shared complete
                                       gene synteny with the regions spanning M. sympodialis centromeres, indicating that their common
                                       ancestor had eight chromosomes (green circle in Figure 7A, Figure 7—figure supplement 3 and
                                       Table 3). To map the common ancestor in Clade B Malassezia species, we analyzed regions flanking
                                       centromeres of Chr2 of M. globosa and Chr8 of M. restricta, both of which mapped to the gene syn-
                                       teny breakpoint of the genome of the Malassezia species that have eight chromosomes
                                       suggesting that their common ancestor, named as Ancestor B (Anc. B), also had nine chromosomes
                                       (Figure 7A, Figure 7—figure supplement 3). On the basis of our centromere predictions in Clade B
                                       species and synteny analysis, we propose that centromere breakage would have occurred in the

Table 3. Synteny of centromeres across all of the Malassezia species analyzed in this study.
Clade C                            Clade B1                                  Clade B2                                      Clade A
M. slooffiae      M. dermatis     M. nana      M. sympodialis      M. globosa       M. restricta     M. vespertilionis     M. japonica      M. furfur
(9 Chr)           (8 Chr)         (8 Chr)      (8 Chr)             (9 Chr)          (9 Chr)          (9 Chr)               (9 Chr)          (7 Chr)
CEN2              CEN1            CEN1         CEN1                CEN3             CEN5 partial     CEN6                  CEN8             CEN4
CEN6              CEN2            CEN2         CEN2                CEN6             CEN7             CEN9                  CEN4 partial     CEN2 partial
CEN3              CEN3            CEN3         CEN3                CEN1             CEN3             CEN7 partial          CEN6 partial     CEN3 partial
CEN4              CEN4            CEN4         CEN4                CEN4             CEN1             CEN1                  CEN2             CEN7 partial
CEN1              CEN6            CEN6         CEN5                CEN5             CEN2             CEN4                  CEN7             CEN1
CEN7              CEN5            CEN5         CEN6                CEN7             CEN6             CEN5 partial          CEN5 partial     CEN6
CEN8              CEN7            CEN7         CEN7                CEN9             CEN4             CEN2                  CEN9 partial     Inactivated
CEN9              CEN8            CEN8         CEN8                CEN8             CEN9             CEN8                  CEN1             Inactivated
CEN5              BP              BP           BP                  CEN2             CEN8 partial     CEN3                  CEN3 partial     CEN5

‘BP’ indicates the presence of a gene synteny break. ‘Inactivated’ indicates centromere inactivation resulting from sequence divergence and erosion of AT-
richness.

Sankaranarayanan et al. eLife 2020;9:e53944. DOI: https://doi.org/10.7554/eLife.53944                                                            14 of 33
Research article Genetics and Genomics
common ancestor of M. sympodialis, M. nana, and M. dermatis after divergence from the common
ancestor of M. globosa and M. restricta, which retained a nine-chromosome configuration
(Figure 7A,B).
As mentioned earlier, M. furfur and M. obtusa of Clade A contain seven chromosomes each
(Boekhout and Bosboom, 1994; Boekhout et al., 1998). To further understand the karyotype varia-
tions within this clade, we predicted the chromosome number in Malassezia vespertilionis and Malas-
sezia japonica because their genomes are relatively well assembled (Sugita et al., 2003;
Lorch et al., 2018). In both of these species, we were able to predict nine GC troughs, indicative of
the centromeres of nine chromosomes (Figure 7—figure supplement 1C–D, Table 4). In the case of
M. vespertilionis, all of the predicted centromeres showed enrichment of the 12-bp motif (Figure 7—
figure supplement 2C). However, the 12-bp motif was found to be enriched in all of the predicted
centromeres except the centromere of scaffold 7 of M. japonica (Figure 7—figure supplement 2D).
The presence of species with nine chromosomes in Clade A suggests that the ancestral state in this
clade, Anc. A, also contained nine chromosomes (Figure 7A).
We identified nine centromeres in M. slooffiae, the only species in Clade C with a well-assembled
genome. The presence of species with nine chromosomes in each of the three clades of Malassezia
species, the conservation of gene synteny across orthologous centromeres, and the similar centro-
mere features shared by all nine species analyzed in this study suggest that Malassezia species
diverged from a common ancestor that had nine chromosomes with short regional centromeres
enriched with the 12-bp AT-rich DNA sequence motif.
Discussion
In this study, we experimentally validated the chromosome number in M. slooffiae and M. globosa
by PFGE analysis. We sequenced and assembled the genomes of M. slooffiae, M. globosa, and M.
furfur and compared each one with the genome of M. sympodialis in order to understand the karyo-
type differences observed in members of the Malassezia species complex. These species represent
each of the three major clades of Malassezia species with chromosome numbers ranging from seven
to nine. Because centromere loss or gain directly influences the chromosome number of a given spe-
cies, we experimentally identified the centromeres of these representative species to understand the
mechanisms of karyotype diversity. Kinetochore proteins are useful tools in identifying the centro-
meres of an organism. The localization of the evolutionarily conserved kinetochore protein Mtw1
suggested that kinetochores are clustered throughout the cell cycle in M. sympodialis. ChIP-
sequencing analysis identified short regional (Research article Genetics and Genomics Figure 6. Inactivation of CEN8 and CEN9 of M. slooffiae and M. globosa in MfChr3 resulted in reduction in chromosome number in M. furfur. (A, B) Circos plots depicting the gene synteny blocks that are conserved between the M. slooffiae or M. globosa chromosomes and the M. furfur chromosomes. Tracks from outside to inside represent positions of centromeres and telomeres, GC content (plotted as blue and red lines indicating GC content below or above genome average, calculated in 0.4-kb non-overlapping windows), and colored connectors indicate regions of conserved gene synteny between each pair of two species. (C) Linear chromosome plot depicting the regions that show synteny between Chr3 of M. furfur and Chr3, Chr4, Chr7, Chr8, and Chr9 of M. slooffiae. GC content (in %) is shown as red/blue lines above each chromosome. Regions corresponding to MslCEN8 and MslCEN9 in MfChr3 are marked I and II, respectively. (D) Linear chromosome plot depicting the conservation of gene synteny between Chr3 of M. furfur and Chr1, Chr4, Chr8, and Chr9 of M. globosa. Regions corresponding to MgCEN9 and MgCEN8 in MfChr3 are marked I and II, respectively. Figure 6 continued on next page Sankaranarayanan et al. eLife 2020;9:e53944. DOI: https://doi.org/10.7554/eLife.53944 16 of 33
Research article                                                                                                Genetics and Genomics

Figure 6 continued
The online version of this article includes the following figure supplement(s) for figure 6:
Figure supplement 1. Loss of AT-content in regions corresponding to CEN8 and CEN9 of M. slooffiae and M. globosa in MfChr3.

                                      Yadav et al., 2018a), rather than the basidiomycetes with large regional centromeres. By combining
                                      these features, we conclude that the genome size and the presence of complete RNAi machinery
                                      could determine the centromere type of a species, irrespective of the phylum to which it belongs.

Table 4. Coordinates, length, and GC content (in %) of the centromeres predicted in M. dermatis, M. nana, M. vespertilionis, and M.
japonica.
                                                                                                     Core centromere
                                                                                                                                           % GC
                          Chr./scaffold                     CEN            Start               End              Length (bp)   % GC         genome
M. dermatis               BCKX01000001.1 (Scf1)             CEN1           711,456             711,978          523           22.8         59.05
JCM11348
                          BCKX01000002.1 (Scf2)             CEN2           1,014,281           1,014,977        697           31.7
                          BCKX01000003.1 (Scf3)             CEN3           232,065             232,795          731           29.3
                          BCKX01000004.1 (Scf4)             CEN4           409,839             410,631          793           29.5
                          BCKX01000005.1 (Scf5)             CEN5           94,520              95,018           499           18.2
                          BCKX01000006.1 (Scf6)             CEN6           473,487             474,334          848           30.4
                          BCKX01000007.1 (Scf7)             CEN7           76,361              76,975           615           26
                          BCKX01000008.1 (Scf8)             CEN8           17,893              18,540           648           26.4
M. nana                   BCLA01000001.1 (Scf1)             CEN1           715,036             715,592          557           27.8         57.95
JCM12085
                          BCLA01000002.1 (Scf2)             CEN2           349,428             350,120          693           33
                          BCLA01000003.1 (Scf3)             CEN3           220,773             221,345          573           27.9
                          BCLA01000004.1 (Scf4)             CEN4           410,594             411,387          794           33.2
                          BCLA01000005.1 (Scf5)             CEN5           524,594             525,105          512           24.8
                          BCLA01000006.1 (Scf6)             CEN6           133,647             134,324          678           33.6
                          BCLA01000007.1 (Scf7)             CEN7           408,363             409,067          705           34.2
                          BCLA01000008.1 (Scf8)             CEN8           398,756             399,423          668           32.5
M. vespertilionis         KZ454987.1 (Scf1)                 CEN1           410,820             411,340          521           15.7         56.6
CBS15041
                          KZ454988.1 (Scf2)                 CEN2           1,275,509           1,276,238        730           25.8
                          KZ454989.1 (Scf3)                 CEN3           322,361             323,277          917           38.2
                          KZ454990.1 (Scf4)                 CEN4           583,450             584,319          870           28.9
                          KZ454991.1 (Scf5)                 CEN5           802,843             804,042          1200          28.8
                          KZ454992.1 (Scf6)                 CEN6           739,896             740,558          663           22.3
                          KZ454993.1 (Scf7)                 CEN7           268,699             269,626          928           28.8
                          KZ454994.1 (Scf8)                 CEN8           10,985              11,865           881           28
                          KZ454995.1 (Scf9)                 CEN9           19,047              19,724           678           29.1
M. japonica               BCKY01000001.1 (Scf1)             CEN1           1,068,050           1,068,614        564           25.1         62.35
JCM11963
                          BCKY01000002.1 (Scf2)             CEN2           139,423             139,920          497           20.3
                          BCKY01000003.1 (Scf3)             CEN3           350,068             350,603          535           24.3
                          BCKY01000004.1 (Scf4)             CEN4           380,877             381,439          562           24.2
                          BCKY01000005.1 (Scf5)             CEN5           507,632             508,230          598           24.5
                          BCKY01000006.1 (Scf6)             CEN6           240,968             250,550          582           23.7
                          BCKY01000007.1 (Scf7)             CEN7           286,711             287,234          523           24.9
                          BCKY01000008.1 (Scf8)             CEN8           87,314              87,873           559           23.9
                          BCKY01000010.1 (Scf10)            CEN9           230,906             231,456          530           24.1

Sankaranarayanan et al. eLife 2020;9:e53944. DOI: https://doi.org/10.7554/eLife.53944                                                      17 of 33
Research article Genetics and Genomics
Figure 7. Karyotype evolution by loss of centromere function in Malassezia species. (A) Phylogenetic relationships between the Malassezia species
analyzed in this study are represented and their chromosome numbers are shown. Species representing each clade are color-coded on the basis of
previous reports (Theelen et al., 2018). The chromosome numbers for M. slooffiae and M. globosa are based on results from this study. In the case of
M. sympodialis, M. restricta, and M. furfur, the chromosome numbers are based on previous reports (Boekhout and Bosboom, 1994; Senczek et al.,
1999; Zhu et al., 2017). For M. dermatis, M. nana, M. vespertilionis, and M. japonica, the number of chromosomes were estimated from the predicted
number of centromeres. The nodes corresponding to the ancestral state for Clade A and Clade B are labeled ‘Anc. A’ and ‘Anc. B’, respectively. Green
and red circles indicate the origins of karyotypes that have eight and seven chromosomes, respectively, from an ancestral state of nine chromosomes.
(B) Schematic of the centromere loss by breakage and the resulting reduction in chromosome number as observed in M. sympodialis (represented as
the current state). A karyotype with nine chromosomes (as shown for M. globosa) is depicted as the ancestral state. (C) Proposed model of centromere
inactivation observed in M. furfur as a consequence of fusion of AnChr8 and AnChr9 to the AnMfChr3 equivalent, resulting in a seven-chromosome
configuration. The fusion product corresponding to extant MfChr3 is represented as the current state.
The online version of this article includes the following figure supplement(s) for figure 7:
Figure supplement 1. Putative centromeres of M. dermatis, M. nana, M. vespertilionis, and M. japonica map to global GC troughs in each
chromosome.
Figure supplement 2. The 12-bp AT-rich motif is enriched at the putative centromeres of M. dermatis, M. nana, M. vespertilionis, and M. japonica.
Figure supplement 3. All of the predicted centromeres of M. sympodialis, M. nana, and M. dermatis belong to gene synteny blocks that are also
conserved in species containing nine chromosomes.
Figure supplement 4. MgCEN2 and MgCEN3 are predicted to form secondary structures.
Based on the binding patterns of the kinetochore protein across the M. sympodialis genome, the
3–5-kb long region can be divided into two domains: (a) an AT-rich CEN core that maps to the inter-
genic region containing the GC trough, which shows maximum kinetochore binding (Research article Genetics and Genomics
technical limitations. Other than M. sympodialis, M. pachydermatis, and M. furfur, no other Malasse-
zia species have been successfully transformed (Ianiri et al., 2016; Celis et al., 2017; Ianiri et al.,
2017a). Moreover, in all of these cases, the genetic manipulations are performed by Agrobacterium-
mediated transconjugation, which cannot be used for the introduction of circular plasmids. Hence,
the functional significance of the 12-bp motif remains unknown and remains an important question
to be addressed in the future to provide an understanding of centromere function in these species.
The centromeres in M. sympodialis contain transcribed ORFs, which have also been documented
in the centromeres of rice, maize, and Zymoseptoria tritici (Nagaki et al., 2004; Wang et al., 2014).
In contrast to these cases, our read count analysis did not reveal any significant difference in the
transcription (RPKM values) of centromere-associated ORFs and ORFs elsewhere in the genome of
M. sympodialis. We posit that the 12-bp AT-rich motif sequences could facilitate the transcription of
these genes by recruiting transcription factors that have a possible role in kinetochore assembly.
Binding of Cbf1 at CDEI in S. cerevisiae centromeres and of Ams2 at the central core sequences of
S. pombe centromeres are classic examples of transcription factors facilitating kinetochore stability
in fungal systems (Hemmerich et al., 2000; Chen et al., 2003). A fine regulation of transcription by
Cbf1, Ste12, and Htz1, and the resulting low-level cenRNAs, have been implicated in proper chro-
mosome segregation in budding yeast (Ohkuni and Kitagawa, 2011; Ling and Yuen, 2019). These
studies reinforce the role of transcription in centromere function irrespective of the centromere
structure.
In this study, we report three high-quality chromosome-level genome assemblies and identified
centromeres in nine Malassezia species, representing all of the three Malassezia clades with differing
numbers of chromosomes. This will serve as a rich resource for comparative genomics in the context
of niche adaptation and speciation. Analysis of gene synteny conservation across centromeres using
these genomes revealed breakage at the centromere as one of the mechanisms that results in a kar-
yotype change between closely related species — those with nine chromosomes, such as M. sloof-
fiae and M. globosa, and those with eight chromosomes, such as M. sympodialis. Gene synteny
breakpoints adjacent to the centromeres have been reported in C. tropicalis, which has seven
chromosomes, one less than C. albicans (Chatterjee et al., 2016). Centromere loss by breakage was
proposed to have reduced the Ashbya gossypii karyotype by one when compared to the pre-whole
genome duplication ancestor (Gordon et al., 2011). Breakpoints of conserved gene synteny
between mammalian and chicken chromosomes were also mapped to the centromeres
(International Chicken Genome Sequencing Consortium, 2004). Similar consequences in the karyo-
type have been reported in cases where centromeres were experimentally excised. Besides neocen-
tromere formation, survival by fusion of acentric chromosome arms has been shown in S. pombe
(Ishii et al., 2008). Such fusions are detected upon deletion of centromeres in another basidiomy-
cete, C. deuterogattii (Schotanus and Heitman, 2019). By comparing the ancestral state (M. sloof-
fiae) and other Malassezia species with either the same number or fewer chromosomes, we
observed gene synteny breaks that were adjacent to centromeres (indicated by partial synteny con-
servation), in addition to the break observed at MgCEN2 or MslCEN5. Does
this suggest that Malassezia centromeres are fragile in nature? We advance the following hypothesis
to explain the observed breaks at centromeres.
Studies of the common fragile sites in the human genome suggest different forms of replication
stress as a major source of instability and subsequent breakage at these sites (Helmrich et al., 2011;
Letessier et al., 2011; Ozeri-Galai et al., 2011). The resolution of the resulting replication fork stall
has been shown to be critical for the stability of these fragile sites (Schwartz et al., 2005). Studies
of the human fragile site FRA16D show that the AT-rich DNA (Flex1) results in fork stalling as a con-
sequence of cruciform or secondary structure formation (Zhang and Freudenreich, 2007). Centro-
meres are natural replication fork stall sites in the genome (Greenfeder and Newlon, 1992;
Smith et al., 1995; Mitra et al., 2014). The AT-rich core centromere sequence in M. globosa is also
predicted to form secondary structures (Figure 7—figure supplement 4), which can be facilitated
by the inherent replication fork stall at the centromeres. Whenever these secondary structures are
unresolved and the fork restart fails, double strand breaks (DSBs) can occur at the centromeres.
Chromosomal breakage and aneuploidy resulting from such defects are known to occur in cancers
(Kops et al., 2005). In mammals, centromeric DSBs are repaired efficiently compared to regions
elsewhere in the genome, largely because of the presence of several homology tracts in the form of
repetitive DNA sequences and the stiffness provided by the inherent heterochromatic state, which
Sankaranarayanan et al. eLife 2020;9:e53944. DOI: https://doi.org/10.7554/eLife.53944 19 of 33Research article Genetics and Genomics
facilitates ligation (Rief and Löbrich, 2002). Malassezia species are haploid in nature and lack typical
pericentric heterochromatin marks. Although the efficiency of centromeric DSB repair in the absence
of long tracts of homologous sequences is not known in this species complex, we propose that the
AT-rich core sequences, by virtue of secondary structure formation during DNA replication, could
occasionally undergo DNA breakage at the centromere in Malassezia species.
The second mechanism of chromosome number reduction suggested by our analyses comparing
the M. furfur genome with the genomes of M. slooffiae or M. globosa involves the inactivation of
centromeres in the process of transition from a nine-chromosome state to a seven-chromosome
state. Centromere inactivation occurs in cases involving the fusion of centric chromosomal frag-
ments, stabilizing the fusion product and generating a functionally monocentric chromosome, as
seen during the origin of human Chr2 from the ancestor shared with the great apes (Yunis and Pra-
kash, 1982; IJdo et al., 1991). A larger proportion of known centromere inactivation events were
shown to be mediated by epigenetic modifications, in which inactivated centromeres are enriched
with marks such as H3K9me2/3, H3K27me2/3, or DNA methylation, emphasizing the role of hetero-
chromatin in this process (Zhang et al., 2010; Koo et al., 2011; Sato et al., 2012). Deletion of the
centromere sequence corresponding to kinetochore binding has also been reported as an alternate
mechanism, albeit a less frequent mechanism, in both humans and in yeast (Stimpson et al., 2010;
Gordon et al., 2011; Sato et al., 2012). In difference to what might be expected according to the
two modes described above, we observed divergence in the sequences corresponding to the inacti-
vated centromeres (CEN8 and CEN9 of both M. slooffiae and M. globosa) in the arms of M. furfur
Chr3, resulting in the loss of AT-richness of these centromere core regions (Figure 7C). This is also
suggestive of a functional role for AT-rich DNA in centromere function in these species.
A change in chromosome number between two closely related species such as C. albicans and C.
tropicalis is associated with a change in centromere structure: centromeres in C. albicans are unique
short regions that are epigenetically regulated, whereas those in C. tropicalis are associated with
genetically defined homogenized inverted repeats (Chatterjee et al., 2016). Strikingly, in both the
transitions described above for Malassezia species, we did not observe any change in the centro-
mere structure. The emergence of evolutionarily new centromeres, as seen in primate evolution, was
not detected in Malassezia species (Rocchi et al., 2009; Kalitsis and Choo, 2012). This is particularly
striking in the absence of conservation of any specific centromere-exclusive DNA sequence. This sug-
gests that a strong driving force helps to maintain the highly conserved centromere properties in
closely related Malassezia species that descended from a common ancestor, even after extensive
chromosomal rearrangements involving centromeres that might have driven speciation. Further-
more, centromere inactivation/loss of centromere function seems to be a conserved theme
mediating variation in chromosome number from unicellular yeast species to metazoans, including
primates.
Materials and methods
The reagents, strains, plasmids, and primers used in this study are listed in the Key Resources Table
below.
Key resources table
Reagent type Additional
(species) or resource Designation Source or reference Identifier information
Biological sample CBS7966 CBS Wild-type strain
(Malassezia globosa)
Biological sample CBS7956 CBS Wild-type strain
(Malassezia slooffiae)
Biological sample CBS14141 CBS Wild-type strain
(Malassezia furfur)
Biological sample ATCC42132 ATCC Wild-type strain
(Malassezia sympodialis)
Continued on next page
Sankaranarayanan et al. eLife 2020;9:e53944. DOI: https://doi.org/10.7554/eLife.53944 20 of 33You can also read