Variable particle size distributions reduce the sensitivity of global export flux to climate change
←
→
Page content transcription
If your browser does not render page correctly, please read the page content below
Biogeosciences, 18, 229–250, 2021
https://doi.org/10.5194/bg-18-229-2021
© Author(s) 2021. This work is distributed under
the Creative Commons Attribution 4.0 License.

Variable particle size distributions reduce the sensitivity of global
export flux to climate change
Shirley W. Leung1 , Thomas Weber1,2 , Jacob A. Cram1,3 , and Curtis Deutsch1
1 Schoolof Oceanography, University of Washington, Seattle, 98195, USA
2 Schoolof Arts and Sciences, University of Rochester, Rochester, 14627, USA
3 Horn Point Laboratory, University of Maryland Center for Environmental Science, Cambridge, 21613, USA

Correspondence: Shirley Leung (shirlleu@uw.edu) and Jacob Cram (jcram@umces.edu)

Received: 5 May 2020 – Discussion started: 25 May 2020
Revised: 27 October 2020 – Accepted: 11 November 2020 – Published: 14 January 2021

Abstract. Recent earth system models predict a 10 %–20 %          findings suggest that to more accurately predict changes in
decrease in particulate organic carbon export from the sur-       biological pump strength under a warming climate, earth sys-
face ocean by the end of the 21st century due to global cli-      tem models should include dynamic particle-size-dependent
mate change. This decline is mainly caused by increased           remineralization depths.
stratification of the upper ocean, resulting in reduced shallow
subsurface nutrient concentrations and a slower supply of nu-
trients to the surface euphotic zone in low latitudes. These
predictions, however, do not typically account for associated     1   Introduction
changes in remineralization depths driven by sinking-particle
size. Here we combine satellite-derived export and particle       A key mechanism that controls the partitioning of carbon
size maps with a simple 3-D global biogeochemical model           dioxide (CO2 ) between the atmosphere and ocean is the bi-
that resolves dynamic particle size distributions to investi-     ological pump, in which CO2 is fixed into phytoplankton or-
gate how shifts in particle size may buffer or amplify pre-       ganic matter via photosynthesis and is then exported from
dicted changes in surface nutrient supply and therefore ex-       the surface to the deep ocean as sinking particles (e.g., Duck-
port production. We show that higher export rates are em-         low et al., 2001). Decomposition of this particulate organic
pirically correlated with larger sinking particles and presum-    carbon (POC) in the ocean interior maintains a reservoir of
ably larger phytoplankton, particularly in tropical and sub-      respired CO2 that is sequestered out of contact with the at-
tropical regions. Incorporating these empirical relationships     mosphere, thus exerting an important control on long-term
into our global model shows that as circulation slows, a de-      atmospheric CO2 concentrations and global climate (e.g.,
crease in export is associated with a shift towards smaller       Martínez-García et al., 2014; Passow and Carlson, 2012;
particles, which sink more slowly and are thus remineralized      Sarmiento and Siegenthaler, 1992). Carbon exported out of
shallower. This shift towards shallower remineralization in       the surface euphotic zone also fuels the metabolism of organ-
turn leads to greater recycling of nutrients in the upper wa-     isms in the mesopelagic zone, sustaining economically and
ter column and thus faster nutrient recirculation into the eu-    socially important fisheries, as well as ecologically impor-
photic zone. The end result is a boost in productivity and ex-    tant zooplankton and micronekton communities (e.g., Boyd
port that counteracts the initial circulation-driven decreases.   et al., 2019; Friedland et al., 2012). POC export is also an im-
This negative feedback mechanism (termed the particle-size–       portant driver of dissolved oxygen concentrations in the wa-
remineralization feedback) slows export decline over the next     ter column. Where sinking POC fluxes are particularly high
century by ∼ 14 % globally (from −0.29 to −0.25 GtC yr−1 )        and supply of oxygen via physical transport is low, enhanced
and by ∼ 20 % in the tropical and subtropical oceans, where       bacterial degradation of particles can deplete available oxy-
export decreases are currently predicted to be greatest. Our      gen and create hypoxic or even suboxic conditions in which
                                                                  many organisms cannot survive (e.g., Deutsch et al., 2015,

Published by Copernicus Publications on behalf of the European Geosciences Union.
230                                                   S. W. Leung et al.: Variable particle sizes reduce export flux sensitivity

2020; Hofmann and Schellnhuber, 2009). Given the critical           ineralization and further exacerbate circulation-driven nutri-
role of POC export in driving ocean carbon sequestration, the       ent supply decreases, leading to a positive feedback on ex-
global climate system, fisheries productivity, and dissolved        port production. A decrease in mineral ballasting and protec-
oxygen availability, there is a growing need to better under-       tion of particles with ocean acidification may also feedback
stand how export will respond to future climate warming.            negatively on export decreases by shoaling remineralization
   Recent earth system models (ESMs) that are part of the           depths (Hofmann and Schellnhuber, 2009).
Coupled Model Intercomparison Project 5 (CMIP5) predict                Future changes in sinking-particle size may also lead to
decreases in global export production (defined as the sinking       strong feedbacks on export. Recent work has shown that par-
POC flux at 100 m) of ∼ 10 %–20 % by 2100 (Bopp et al.,             ticle size, through its influence on sinking speed (Alldredge
2013; Cabré et al., 2015a) and ∼ 30 % by 2300 (Moore et al.,        and Gotschalk, 1988; Smayda, 1971), plays a paramount
2018). In many of these models, primary production and              role in determining remineralization length scales and carbon
subsequent carbon export are largely limited by the physi-          transfer efficiency to depth (Cram et al., 2018; Kriest and Os-
cal supply of nutrients to the surface ocean, which is pre-         chlies, 2008; Weber et al., 2016). Potential mechanisms that
dicted to slow with future warming (Cabré et al., 2015a; Fu         could drive changing particle sizes include changes in under-
et al., 2016; Laufkötter et al., 2015; Moore et al., 2018).         lying phytoplankton community structure and organic mat-
Mechanisms driving this nutrient supply slowdown include            ter packaging processes at higher trophic levels. Whatever
(i) surface warming-induced stratification of the water col-        the mechanism, the direction and magnitude of the particle-
umn, which will shoal winter mixed layers, limit vertical ex-       size–remineralization feedback in a warming ocean will de-
change, and “trap” nutrients in the ocean interior (Bopp et al.,    pend on how particle sizes change as export declines in the
2013; Cabré et al., 2015a; Capotondi et al., 2012; Moore            future. If the export decline is associated with a shift to-
et al., 2018), and (ii) a weakening of the trade winds, which       wards larger organic particles that sink more quickly, rem-
will reduce upwelling rates and vertical nutrient supply in         ineralization depths will deepen and further reduce surface
tropical oceans (Bopp et al., 2001; Collins et al., 2010), as       nutrient supply and export in a positive feedback. If, on the
well as lateral Ekman-driven nutrient supply into the sub-          other hand, export decreases are associated with a shift to-
tropics (Letscher et al., 2016).                                    wards smaller sinking particles, shallower remineralization
   Changes in the POC flux itself, however, also have the po-       will allow for faster nutrient recirculation to the surface and
tential to modulate nutrient supply to the surface ocean and        dampen stratification-driven decreases in nutrient supply and
therefore impact export. Because particles release nutrients        export in a negative feedback.
when they decompose, the depth scale of particle reminer-              Despite the potential importance of particle size, CMIP5
alization determines the proximity of these nutrients to the        models do not resolve dynamic particle size distributions and
surface and their resupply rate to the euphotic zone (Kwon          so cannot fully capture biological feedbacks driven by par-
et al., 2009; Yamanaka and Tajika, 1996). Shallow reminer-          ticle size (Laufkötter et al., 2016; Le Quéré et al., 2005;
alization in mesopelagic waters, especially above the perma-        Séférian et al., 2020). More complex models that resolve
nent pycnocline, drives rapid nutrient recirculation to the sur-    aggregation–disaggregation transformations and/or particle
face; nutrients remineralized in deeper waters, on the other        size distributions have been developed (Gehlen et al., 2006;
hand, can take hundreds of years to re-emerge at the surface        Jokulsdottir and Archer, 2016; Kriest and Oschlies, 2008;
(Martin et al., 1987; Matsumoto, 2007b). This raises the pos-       Niemeyer et al., 2019; Schwinger et al., 2016), but they have
sibility of feedback loops in which changes in particle rem-        not been used to examine the interactions between climate
ineralization depth might either dampen (negative feedback)         change, particle size, and export production. Furthermore,
or enhance (positive feedback) circulation-driven decreases         parameters and processes in most previous models are not
in primary production and export. For instance, increasing          constrained by observations of particle size distributions or
ocean temperatures may speed up bacterial remineralization          the relationships between particle size and export.
rates (Cavan et al., 2019; Cram et al., 2018; John et al., 2014;       Here we combine new data analyses and idealized model
Laufkötter et al., 2017; Marsay et al., 2015; Matsumoto,            experiments to assess the potential impact of feedbacks in-
2007a) and enhance recycling of nutrients near the surface,         duced by dynamic particle-size-dependent remineralization
which would dampen physically driven decreases in surface           depths on future export changes. We use remotely sensed
nutrient concentrations and result in a negative feedback on        datasets to empirically constrain the relationship between ex-
export. Oxygen concentrations, on the other hand, are pre-          port rates and sinking-particle size and then implement this
dicted to decrease with future warming (Bopp et al., 2002;          relationship in a 3-D global biogeochemical model that re-
Cabré et al., 2015b; Keeling et al., 2010; Long et al., 2016;       solves particle size distributions. Together, these analyses
Matear and Hirst, 2003; Schmidtko et al., 2017) and slow            reveal a negative particle-size–remineralization (PSR) feed-
bacterial remineralization and zooplankton-mediated particle        back effect on export, suggesting that ESMs lacking these
disaggregation rates (Cavan et al., 2017; Devol and Hartnett,       interactions may overestimate the decrease in ocean carbon
2001; Hartnett and Devol, 2003; Laufkötter et al., 2017; Van        export during the 21st century.
Mooy et al., 2002). This would result in deeper particle rem-

Biogeosciences, 18, 229–250, 2021                                                       https://doi.org/10.5194/bg-18-229-2021
S. W. Leung et al.: Variable particle sizes reduce export flux sensitivity                                                            231

Figure 1. Global maps of annual mean (a) particle size distribution slope (β) measured by remotely sensed particulate backscatter and
reproduced from Kostadinov et al. (2009) and (b) remineralization depth, defined as the depth at which particulate flux out of the euphotic
zone is decreased by a factor of e assuming β in (a) at the surface, calculated using a particle remineralization and sinking model (PRiSM,
described in Sect. 2.1.1). Larger values of β are associated with smaller particles, while smaller values of β are associated with larger
particles.

2     Methods                                                           pirical relationships are in some cases derived from measure-
                                                                        ments of sinking phytoplankton and in other cases from those
2.1     Ocean biogeochemical and particle                               of sinking particles or porous aggregates. PRiSM therefore
        remineralization model                                          implicitly assumes that phytoplankton and smaller particles
                                                                        behave similarly as they sink down the water column.
2.1.1    Model setup                                                       Particle abundances in the ocean tend to follow a power-
                                                                        law distribution, with many more small particles than large
We quantified the particle size remineralization (PSR) feed-            ones (Boss et al., 2001; Buonassissi and Dierssen, 2010;
back using an idealized ocean biogeochemical model, which               Cael and White, 2020; Sheldon et al., 1972; White et al.,
comprises a simple nutrient cycle (DeVries et al., 2014) em-            2015). Thus, PRiSM produces particles in the surface eu-
bedded within the observationally constrained Ocean Circu-              photic zone (< 75 m) following a power-law size spectrum,
lation Inverse Model (OCIM) (DeVries, 2014). OCIM assim-                in which the log of the particle number density declines lin-
ilates passive and transient tracer data to generate an annual          early with the log of the particle diameter, between the sizes
mean circulation that realistically reproduces water mass dis-          of 20 and 2000 µm in diameter. Accordingly, the relative
tributions and ventilation rates at 2◦ horizontal resolution on         abundance of small and large particles is controlled by the
24 vertical layers. The circulation rates are stored in a trans-        slope of the spectrum on a log–log scale (β): a shallower
port matrix (A) that quantifies physical exchanges between              slope (small β) indicates a greater proportion of large par-
every grid cell in our model. Thus, all physical (advective             ticles relative to small ones, while a steeper slope (large β)
and diffusive) fluxes of tracer X in our model are repre-               indicates a smaller proportion of large particles. This surface
sented by the matrix–vector product A∗ [X]. OCIM has pre-               particle size distribution slope is defined via specification of a
viously been used successfully for high-fidelity simulation of          global β map. Previous work with PRiSM has demonstrated
nutrients (DeVries, 2014) and oxygen (DeVries and Weber,                that spatial variations in annual mean β of the magnitude ob-
2017) and does not suffer from the equatorial biases often              served by satellite can lead to large differences in particle
evident in dynamical models with the same resolution. Nutri-            fluxes at depth (Fig. S1 in the Supplement; Fig. 1a and b;
ent cycling comprises phytoplankton phosphate (PO3−      4 ) up-
                                                                        DeVries et al., 2014).
take and export as sinking organic particles out of the surface            Following export, the simulated particle size spectrum
ocean (< 75 m), particle remineralization in the subsurface             evolves through the water column due to remineralization
(> 75 m), and production and decomposition of dissolved or-             and size-dependent sinking. Remineralization is represented
ganic phosphorus (DeVries et al., 2014). Nutrient concentra-            by first-order mass loss from particles, such that each indi-
tions in the ocean interior represent the sum of preformed              vidual particle shrinks and sinks more slowly with depth.
nutrients, transported from regions of incomplete utilization           Because smaller, slower-sinking particles reside for longer
in the ocean surface, and the accumulated product of partic-            within any given depth interval and therefore have more time
ulate and dissolved organic matter remineralization.                    to remineralize, they are preferentially lost from the particle
   Vertical particle fluxes are simulated by the 1-D mecha-             population over depth. A constant rate of microbial respira-
nistic Particle Remineralization and Sinking Model (PRiSM)              tion is used, optimized to fit global in situ phosphate distribu-
(DeVries et al., 2014). PRiSM computes particle flux pro-               tions (DeVries et al., 2014). There are therefore no temporal
files as a function of particle size distribution at the surface,       changes in bacterial respiration due to warming, for example,
microbial remineralization rate, and empirical relationships            which allows us to isolate changes in export that stem from
between particle size, mass, and sinking velocity. These em-            the PSR feedback alone. While PRiSM has recently been ex-

https://doi.org/10.5194/bg-18-229-2021                                                             Biogeosciences, 18, 229–250, 2021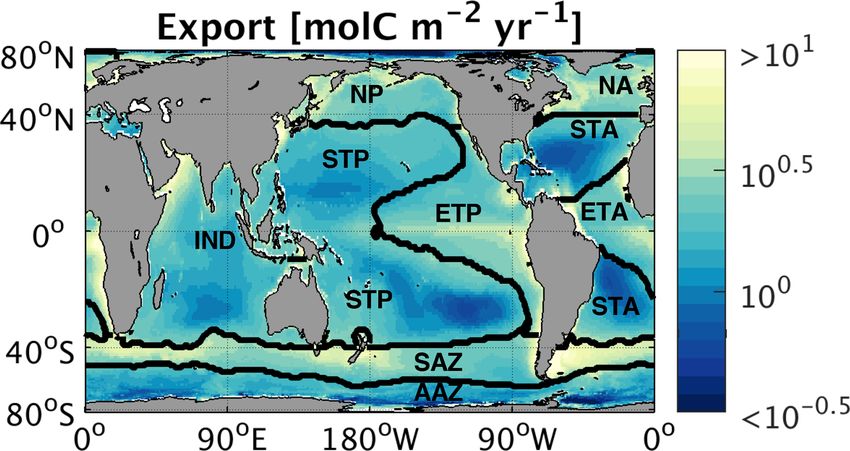
232                                                   S. W. Leung et al.: Variable particle sizes reduce export flux sensitivity

panded to include temperature and oxygen effects on bacte-          vations. Mathematically, β is updated at a given grid point as
rial respiration and remineralization (Cram et al., 2018), as       follows between time steps t and t + 1:
well as to represent particle disaggregation (Bianchi and We-
ber et al., 2018), here we use the original version described in                    dβsat Et+1 − Et
                                                                    βt+1 = βt +                     ,                                    (1)
DeVries et al. (2014), which can be solved analytically and                        dEn, sat  Et
has previously undergone parameter optimization to best fit                                                            dβsat
global phosphate distributions.                                     where E is the modeled export rate and dE           n, sat
                                                                                                                               is the empiri-
   The model configuration and parameter values used here           cal time-independent fractional change in satellite-derived β
are outlined in Table S1 in the Supplement. Further model           (βsat ) per change in satellite-derived time-mean normalized
details and validation are described in DeVries et al. (2014).      export (En, sat , defined as absolute export divided by time-
Here we extend the original PRiSM-enabled biogeochemical            mean export calculated between 1997 and 2010 at a given
model in DeVries et al. (2014) in two important ways:               grid point – see Sect. 2.2.2 for details).
                                                                                                       dβsat
                                                                       To disable the feedback, dE      n, sat
                                                                                                               is set equal to zero so that
 1. The original diagnostic nutrient uptake term (i.e.,             modeled β remains constant over time. To enable the feed-
    nutrient-restoring production) is replaced by the prog-                  dβsat
                                                                    back, dE  n, sat
                                                                                     is set equal to the linear temporal regression co-
    nostic organic matter production scheme developed by            efficient between βsat and En, sat , which is computed from
    Weber and Deutsch (2012) with minor parameter up-               remotely sensed time series of the two variables at each grid
    dates (see Table S2 in the Supplement). This scheme             cell over the global ocean (Sect. 2.2). Thus, when the feed-
    calculates phytoplankton growth, in terms of PO3−   4 up-       back is enabled, changes in modeled β over time are dictated
    take, as a function of observed annual mean tempera-            by the magnitude of modeled export change as well as the
    tures (Locarnini et al., 2010) and solar radiation lev-         strength and direction of the relationship between observed β
    els (Rossow and Schiffer, 1999), along with modeled             and export, which can vary spatially.
    [PO3−4 ]. This formulation successfully reproduces the
    broad spatial patterns of surface [PO3−                         2.2     Empirical analyses of phytoplankton size, β, and
                                              4 ] (Weber and
    Deutsch, 2012), suggesting that our model accurately                    export from satellite data
    captures the balance between preformed and remineral-
    ized nutrients in the ocean interior. Of the organic phos-      Because the strength and direction of our modeled PSR feed-
    phorus produced by uptake in the euphotic zone, 10 % is         back depend strongly on the observed relationship between β
                                                                                  dβsat
    routed to dissolved organic matter, which circulates and        and export ( dEn, sat
                                                                                          in Eq. 1), we sought a robust empirical
    degrades over time, with the remainder being routed to          constraint on this relationship. Section 2.2.1 and 2.2.2 de-
    particulate organic matter (Thornton, 2014). An empir-          scribe the global satellite-derived time series maps of β and
    ical, spatially variable relationship between particulate       export used here, respectively. Section 2.2.3 then describes
    C-to-P ratios and phosphate concentrations (Galbraith           how these monthly-mean β and export maps are used to com-
                                                                                                      dβsat
    and Martiny, 2015) is then used to convert particulate          pute a range of possible global dE  n, sat
                                                                                                               relationships.
    organic phosphorus fluxes into POC fluxes.
                                                                    2.2.1    Global satellite-derived particle size distribution
 2. We add the ability to enable or disable the PSR feedback                 map
    by implementing an empirical relationship that links
    changes in particle size spectrum slope (β) to changes          Global 1/12◦ by 1/12◦ monthly maps of β observed by
    in carbon export out of the surface ocean (< 75 m) (see         the satellite Sea-viewing Wide Field-of-view Sensor (SeaW-
    Sect. 2.1.2).                                                   iFS, in operation from September 1997 to December 2010)
                                                                    were downloaded from ftp://ftp.oceancolor.ucsb.edu//pub/
2.1.2   Model representation of the PSR feedback                    org/oceancolor/MEaSUREs/PSD/ (last access: 2 May 2012).
                                                                    These β maps were derived from remotely sensed particulate
When the PSR feedback is disabled within our model,                 backscattering measurements, which were previously vali-
circulation-driven changes in the nutrient supply to the eu-        dated with in situ near-surface Coulter counter measurements
photic zone (see Sect. 2.3) will lead to changes in POC ex-         (Kostadinov et al., 2009). To enable more efficient compu-
port, but β (and therefore particle remineralization depths)        tation, we reduced the resolution of the original monthly β
remains constant over time. With the PSR feedback enabled,          maps to 1◦ by 1◦ via spatial averaging. At this resolution,
any change in POC export is accompanied by a change in β,           time-mean β ranges from ∼ 3.3 in coastal high-latitude re-
the direction and magnitude of which is specified using the         gions (where high nutrient conditions favor larger phyto-
empirical relationships discussed in Sect. 2.2. We note that,       plankton) to ∼ 5.3 in the subtropics (where low macronutri-
by design, this modeling approach makes no assumptions              ent concentrations favor small phytoplankton) (Fig. 1a). Al-
about the mechanisms driving shifts in the particle size distri-    though β from Kostadinov et al. (2009) is computed only
bution; rather, it merely stipulates that β changes in tandem       over particle sizes ranging from 0.002 to 63 µm, we assume
with POC export, in a manner that is consistent with obser-         that the same β continues to hold for larger particles up to

Biogeosciences, 18, 229–250, 2021                                                          https://doi.org/10.5194/bg-18-229-2021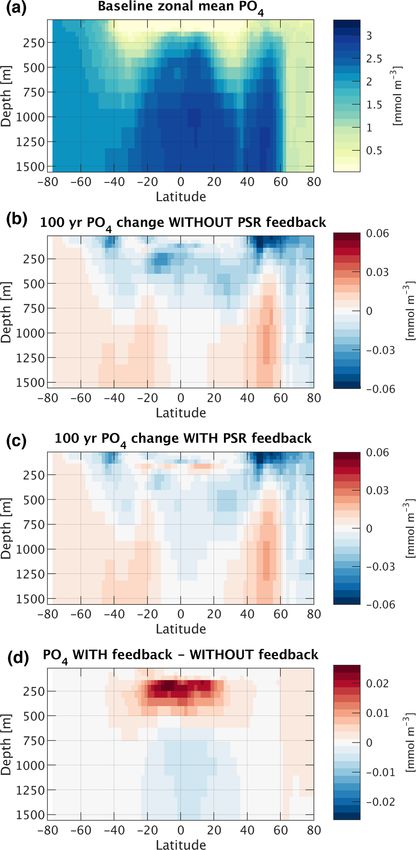
S. W. Leung et al.: Variable particle sizes reduce export flux sensitivity                                                          233

2000 µm (the largest particle size in PRiSM), as supported by
prior research (e.g., Durkin et al., 2015). Ideally, measure-
ments of β would be computed over the same particle size
range as simulated in PRiSM (20–2000 µm); however, such
a dataset was not readily available. Indeed, the Kostadinov
et al. (2009) observations of β were the only readily avail-
able measurements spanning long enough timescales, with
high enough spatiotemporal resolution to compute the rela-
tionships between β and POC export needed for this study.

2.2.2   Global satellite-derived export maps                          Figure 2. Global map of regionally weighted annual mean export,
                                                                      averaged over nine different export maps (detailed in Sect. 2.2.2).
POC export was computed as the product of net primary                 Contours indicate biogeochemical regions used for weighting and
production (NPP) and the particle export ratio (export/NPP            spatial averaging.
or e ratio), both of which can be derived from satellite
data. To create a range of plausible global monthly ex-
port maps, we multiplied all possible permutations of the             Reuer et al., 2007) within each region defined here (Table S3
three monthly NPP estimates and e-ratio algorithms, yield-            in the Supplement; see Weber et al. (2016) for derivation
ing nine distinct monthly datasets of global export span-             of weighting factors). Figure 2 shows the weighted annual
ning > 10 years (Fig. S2 in the Supplement). All three                mean carbon export flux over the nine map sets, as well as
sets of monthly satellite NPP maps were downloaded from               the regions used for weighting, which are delineated based
http://sites.science.oregonstate.edu/ocean.productivity/ (last        on biogeochemical characteristics such as sea surface tem-
access: 2011) and derived from SeaWiFS observations pro-              perature and surface phosphate concentrations (Weber et al.,
cessed through the following algorithms: (i) the chlorophyll-         2016). The Atlantic and Pacific oceans are divided into warm
based Vertically Generalized Production Model (VGPM)                  subtropics dominated by smaller picophytoplankton (STA,
(Behrenfeld and Falkowski, 1997); (ii) the Eppley-VGPM                STP), cold subarctic regions dominated by blooms of larger
model (VGPME), containing a modified relationship be-                 microphytoplankton in the north (NA, NP), and cool trop-
tween temperature and production compared to the original             ical upwelling zones dominated by larger phytoplankton in
VGPM (Carr et al., 2006); and (iii) the Carbon-based Pro-             the east (ETA, ETP). The Indian Ocean is kept intact (IND),
duction Model (CbPM), which uses particulate backscatter-             while the Southern Ocean is divided into the productive,
derived carbon rather than chlorophyll to measure phyto-              diatom-dominated Subantarctic zone (SAZ) and the high-
plankton biomass (Behrenfeld et al., 2005). The three e-ratio         nutrient, low-chlorophyll Antarctic zone (AAZ). The Indian
algorithms we used were the ecosystem-model-based rela-               Ocean region (IND) did not contain a sufficient number of
tionship of Laws et al. (2000) and the empirical relation-            in situ observations of export to enable comparison to the
ships of Dunne et al. (2005) and Laws et al. (2011). All three        satellite export maps, so all nine maps are weighted equally
of these algorithms link e ratio to sea surface temperature           there.
(SST) and NPP. The in situ, statistically interpolated SST
dataset used here was NOAA’s Extended Reconstructed Sea               2.2.3   Regionally variable   empirical β vs. export
Surface Temperature (ERSST) v3b, downloaded from https:

                                                                                              dβsat
                                                                              relationships dEn, sat
//www1.ncdc.noaa.gov/pub/data/cmb/ersst/v3b/netcdf/ (last
access: 13 November 2020) (Smith et al., 2008). Euphotic
zone depths needed to compute D2005 e ratios were derived             We quantified the empirical relationship between β and ex-
from SeaWiFS-sensed chlorophyll concentrations (down-                 port individually for each grid cell by extracting the monthly
loaded from the same website as NPP) according to Eq. (10)            time series (September 1997–December 2010) of β and nor-
in Lee et al. (2007). As with β, all variables were computed          malized export (En ) from the satellite products described
and stored on a 1◦ by 1◦ grid over the entirety of the SeaWiFS        above and then applying linear regression. This process pro-
period (September 1997–December 2010, i.e., 160 months                duced a spatially variable, 1◦ by 1◦ global map of the best-
                                                                                           dβsat
long).                                                                fit linear slopes ( dEn, sat
                                                                                                   ) relating β and En . To capture the
                                           dβsat                                                 dβsat
   In the following computations of dE      n, sat
                                                     (Sect. 2.2.3),   range of plausible dE       n, sat
                                                                                                         maps, we repeated this process
we employed all nine sets of global monthly export maps               for each of the nine export products to generate nine dis-
                                                                                       dβsat
to propagate uncertainty into our assessment of the PSR               tinct global dE    n, sat
                                                                                                maps (Fig. S3 in the Supplement). To
                                               dβsat
feedback. When computing most likely dE          n, sat
                                                        values, we    smooth out small-scale noise and illuminate large-scale pat-
weighted the nine export map sets according to how well               terns in the β vs. export relationship, we spatially averaged
                                                                           dβsat
each map set’s annual mean export matches in situ oxy-                the dE n, sat
                                                                                    slopes over the ocean biogeochemical regions de-
gen and mass-balance-based observations (Emerson, 2014;               fined in Fig. 2 (Fig. 3a). Finally, we set all grid points within

https://doi.org/10.5194/bg-18-229-2021                                                           Biogeosciences, 18, 229–250, 2021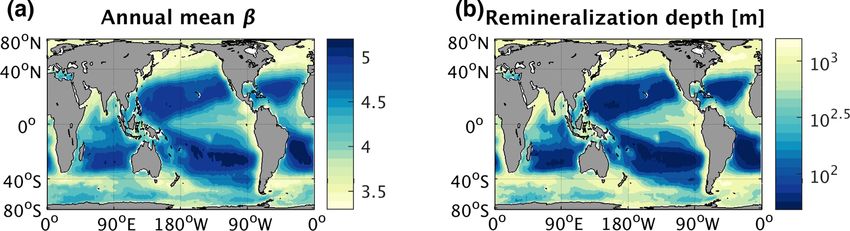
234 S. W. Leung et al.: Variable particle sizes reduce export flux sensitivity
a given region equal to that region’s weighted (Table S3;
dβsat
Sect. 2.2.2) mean value (Fig. 3b) to generate the final dE n, sat
map used in our PSR feedback-on runs (Fig. 3c).
dβsat
To quantify the sensitivity of dE n, sat
to the choice of export
dβsat
map used, we computed upper- and lower-bound dE n, sat
maps
by adding and subtracting 1 SD (error bars in Fig. 3b) to
dβsat
the weighted regional mean dEn, sat
values. Conducting PSR
dβsat
feedback-on runs using upper- and lower-bound dE n, sat
maps
establishes the range of PSR feedback strengths we can rea-
sonably expect from our model forced with empirically de-
rived relationships.
2.3 Model runs to simulate future ocean warming and
quantify the PSR feedback effect
To represent present-day conditions, we run a baseline sim-
ulation with modern-day circulation rates to steady state. To
simulate increased water column stratification and reduced
vertical exchange due to warming in an idealized way, we
uniformly and instantaneously reduce circulation and dif-
fusion rates by 10 % throughout the ocean (i.e., we multi-
ply the tracer transport matrix A by 0.9, such that circula-
tion patterns remain unchanged, but the absolute exchange
rates between all grid cells are scaled down by 10 %). For
comparison, observations show that the Atlantic Meridional
Overturning Circulation (AMOC) has weakened by about
15 % since the mid-20th century due to anthropogenic warm-
ing (Caesar et al., 2018), while ESMs project that AMOC
will weaken by 11 %–34 % over the 21st century, depending
on the chosen radiative forcing scenario (11 % assumes the
“high mitigation” RCP2.6 scenario, while 34 % assumes the
“business-as-usual” RCP8.5 scenario) (Collins et al., 2019).
A 10 % decrease in circulation rates is therefore a relatively
conservative estimate of the effects of anthropogenic warm-
ing. Although modulation of ocean circulation rates in re-
sponse to climate change will be more complicated and vari-
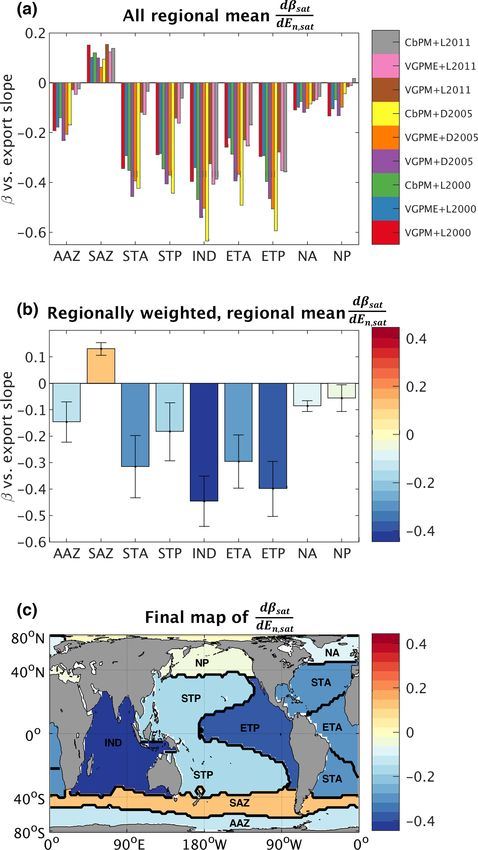
Figure 3. (a) All regional mean changes in particle size slope for able than the uniform 10 % decrease applied here (e.g., Tog-
dβsat
a given change in time-mean normalized export, dE values gweiler and Russell, 2008), we seek only a simple, ideal-
n, sat
(i.e., spatial averages of each map in Fig. S3 over regions shown ized way to approximate the reduced surface nutrient sup-
in Fig. 2), colored by corresponding export map. Color bar la- ply that is expected in a warmer future ocean. Although we
bels indicate the NPP and e-ratio algorithms used to generate the
use a simplified representation of future changes in ocean
given export map (see Sect. 2.2.2 for full descriptions of the algo-
circulation, the exact same simplified representation is im-
rithms). NPP algorithm key: VGPM represents the Vertically Gen-
eralized Production Model (VGPM) (Behrenfeld and Falkowski, plemented in both PSR feedback-on and feedback-off sim-
1997); VGPME represents the Eppley-VGPM model (Carr et al., ulations. We are thus isolating the effects of the PSR feed-
2006); and CbPM represents the Carbon-based Production Model back from the effects of the circulation change. It is therefore
(Behrenfeld et al., 2005). E-ratio algorithm key: L2000 represents not unreasonable to assume that our calculated PSR feed-
Laws et al. (2000); D2005 represents Dunne et al. (2005); and back strength would be comparable to that computed from a
L2011 represents Laws et al. (2011). (b) Regionally weighted mean physical model with a more complex representation of future
dβsat
dEn, sat , averaged over the nine possibilities for each region shown circulation changes, as long as that model also applied identi-
in Fig. 3a. Error bars represent 1 weighted SD. (c) Global map of re- cal circulation changes in PSR feedback-on and feedback-off
dβsat scenarios.
gionally variable dE used in model runs with the PSR feedback
n, sat
on. To quantify the impact of the global PSR feedback on
export changes with future warming, we run the slower-
circulation rate simulation with and without the PSR feed-
Biogeosciences, 18, 229–250, 2021 https://doi.org/10.5194/bg-18-229-2021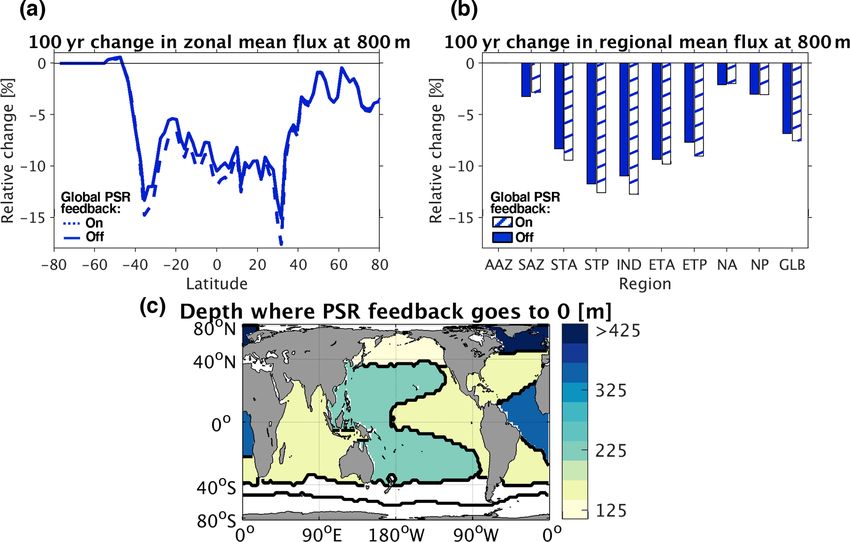
S. W. Leung et al.: Variable particle sizes reduce export flux sensitivity                                                      235

back effect enabled. In feedback-off runs, β is set equal to        (large β) are associated with reduced export rates and low-
annual mean values (Fig. 1a) for the entire duration of the         nutrient conditions, while large particles (small β) are asso-
run. In feedback-on runs, β is initially set equal to annual        ciated with increased export rates and high-nutrient condi-
mean values but is allowed to change according to Eq. (1),          tions.
        dβsat
with dE  n, sat
                defined as in Fig. 3c for the entire duration of       This line of reasoning may also explain why more
the run. Additional feedback-on runs were conducted us-             nutrient-limited regions (i.e., the subtropics) exhibit espe-
                                      dβsat
ing the upper- and lower-bound dE       n, sat
                                               maps (described in   cially strong negative relationships between β and export
Sect. 2.2.3).                                                       (Figs. 3, S3 and S4); both β and export are likely predomi-
   All of the above-described runs were also repeated with          nantly driven (in opposite directions) by surface nutrient sup-
10 % faster circulation rates to determine whether the PSR          ply in these areas. Where light or temperature take over as
feedback strength is symmetrical with regard to the direc-          the dominant factors limiting phytoplankton productivity, the
tion of circulation change. Within all runs, β is constrained       relationships between β and export are weakened, as in the
to realistically remain between 2 and 6.5 at all grid points, al-   higher-latitude regions (Figs. 3, S3 and S4). The counterin-
though these extremes are rarely reached. We run all experi-        tuitive weakly positive relationship between β and export in
mental simulations for 100 years (initializing with conditions      the Subantarctic zone (SAZ) of the Southern Ocean (Fig. S5
from the end of the present-day spin-up) to study near-future       in the Supplement) is in line with findings from Lam and
changes in export production and nutrient distributions and         Bishop (2007), who showed that areas in the Southern Ocean
to facilitate comparison with 100-year changes projected by         with higher biomass and larger particles at the surface were
the state-of-the-art earth system models discussed above.           actually associated with lower rates of export out of the eu-
                                                                    photic zone. In these diatom-dominated regions, zooplankton
                                                                    may be more active and have higher particle grazing efficien-
3     Results and discussion                                        cies, leading to faster attenuation of particulate carbon fluxes
                                                                    with depth. The unique relationship between β and export in
3.1    Empirically derived
                            spatially
                                      resolved β vs. export        the SAZ is worth further exploration and may be further elu-
                      dβsat
       relationships dE n, sat
                                                                    cidated by NPP datasets that are specifically calibrated for
                                                                    the Southern Ocean (e.g., Johnson et al., 2013), but this is
No matter which export datasets are used (Sect. 2.2),               beyond the scope of the current study.
satellite-derived β and export are strongly negatively cor-
related (Figs. 3, S3 and S4 in the Supplement). The vast            3.2   An empirical negative global
majority of variance in both β and export occurs over sea-                particle-size–remineralization (PSR) feedback
sonal (rather than interannual or longer) timescales; there-
fore, the coincident seasonal cycles of β and export ac-            To determine how the empirically derived relationships be-
count for much of the relationship between the two variables        tween β and export ultimately affect the direction and
(Figs. S3 and S4). Because β and export are negatively cor-         strength of the PSR feedback effect on a global scale, we
related, export tends to be high when β is small (particles are     must first understand the effects of β on sinking-particle
large) and low when β is large (particles are small). These         speeds and remineralization depths. Past work has broadly
empirical findings are in agreement with Cram et al. (2018),        established a positive relationship between particle size and
who observed that large particles tend to comprise a larger         sinking speed in the ocean (Alldredge and Gotschalk, 1988;
fraction of the sinking flux where productivity and carbon          Smayda, 1971; Iversen and Ploug, 2010) – although there are
export are high.                                                    exceptions to these rules (Cael and White, 2020; Laurenceau-
   While our analysis does not provide mechanistic insights         Cornec et al., 2020), particularly in the Southern Ocean (Mc-
into the roots of the negative correlation between β and ex-        Donnell and Buesseler, 2010). The characteristic depth scale
port, a plausible explanation for the direction of this relation-   of particle remineralization is proportional to this sinking
ship is as follows. Low-nutrient conditions select for small        speed divided by a microbially mediated remineralization
phytoplankton with high surface area to volume ratios, such         rate (Kwon et al., 2009; McDonnell et al., 2015). Here we
that smaller phytoplankton are more abundant in low-nutrient        define remineralization depth as the depth at which POC flux
conditions (Litchman et al., 2007). In these nutrient-limited       out of the euphotic zone is reduced by a factor of e or 63 %
regions of the ocean, productivity and export are also sup-         (i.e., the e-folding depth of the flux) (Fig. 1b). The domi-
pressed. Thus, nutrient availability controls both the export       nance of smaller sinking particles in the water column re-
rate and the size structure of the phytoplankton community          sults in a shallower remineralization depth, as bacteria have
over much of the ocean. Assuming that phytoplankton size            more time to decompose these slow-sinking particles into nu-
in turn controls the size of sinking particles, as suggested by     trients and CO2 as they pass through the upper layers of the
past research (e.g., Guidi et al., 2007, 2008, 2009), the avail-    water column (Bach et al., 2016). Together with the empiri-
ability of nutrients then ultimately controls sinking-particle      cal relationships we found between POC export and particle
size as well. This potentially explains why small particles         size (Sect. 3.1), this points towards a predominantly nega-

https://doi.org/10.5194/bg-18-229-2021                                                        Biogeosciences, 18, 229–250, 2021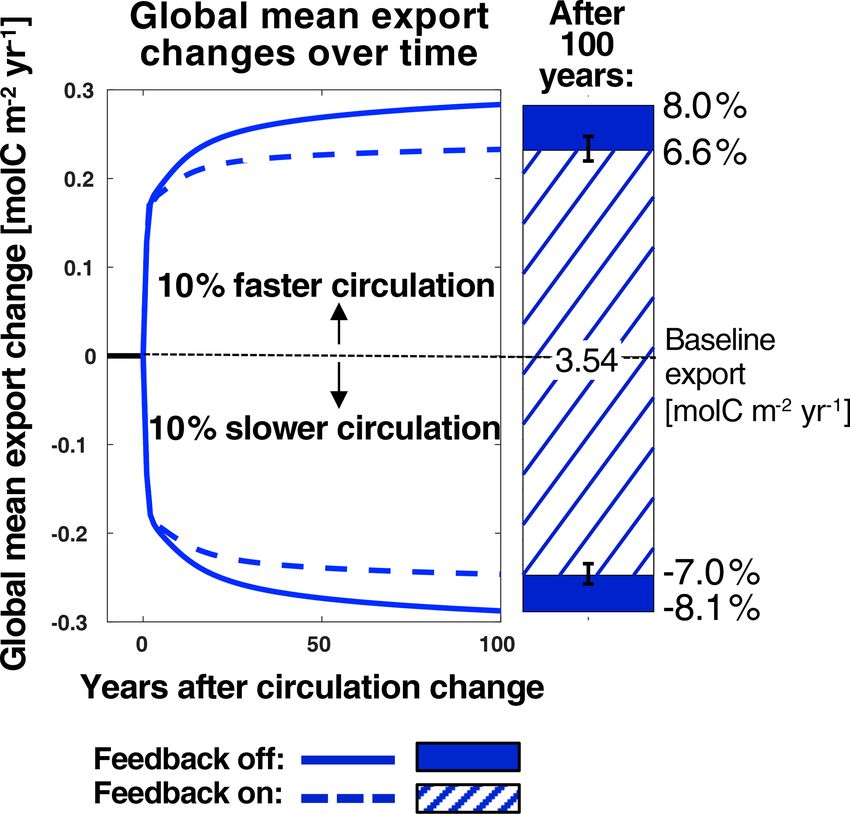
236                                                       S. W. Leung et al.: Variable particle sizes reduce export flux sensitivity

Figure 4. (a) Schematic diagram of the particle-size–remineralization (PSR) negative feedback on export production. A change in circulation
rates induced by climate change alters surface nutrient supply and subsequent export production (green arrow). Changes in surface nutrient
supply also drive changes in phytoplankton and resultant sinking-particle sizes (red arrow). Changes in sinking-particle sizes in turn alter
remineralization depth and consequently surface nutrient supply and export (blue arrow). (b) Schematic depicting decreased export produc-
tion with decreases in circulation rates and surface nutrient supply. (c) Schematic depicting a theoretical relationship between export and β,
here termed the phytoplankton size selection ecological effect (EE), in which smaller phytoplankton dominate in low-nutrient low-export
conditions. (d) Schematic depicting all previous components of the PSR feedback, in addition to the crucial final component: the particle
remineralization depth sinking speed effect (SSE), in which smaller particles tend to get remineralized shallower, leading to a greater recycled
surface nutrient supply and therefore greater export.

tive feedback loop that would dampen the response of POC                        alize shallower in the water column. More regenerated
export to physically induced changes in nutrient supply. In                     nutrients would then accumulate within shallower wa-
a warming and stratifying ocean, this hypothesized particle-                    ters and thus recirculate more quickly to the surface.
size–remineralization feedback would theoretically proceed                      In isolation, a shift to smaller particles would there-
through the following steps at any given location, which are                    fore ultimately lead to greater surface nutrient availabil-
illustrated schematically in Fig. 4:                                            ity and larger export rates (Fig. 4a, blue arrow), rep-
                                                                                resented by the positive slope of the blue export-vs.-β
  1. Slower circulation (SC) – First, stratification of the wa-                 line in Fig. 4d. In the presence of this sinking speed ef-
     ter column and slowing trade winds with climate warm-                      fect (SSE), changes in export and β under slowed cir-
     ing will reduce shallow subsurface nutrient concentra-                     culation must fall along the blue sinking speed-related
     tions and vertical exchange or upwelling rates. This                       export-vs.-β line (Fig. 4d). In the absence of this sinking
     slows nutrient supply into the euphotic zone, which in                     speed effect (i.e., particle size does not affect sinking
     turn decreases phytoplankton productivity and resultant                    rates or remineralization depths), there is no such re-
     export production (Fig. 4a and b, green arrows).                           quirement, and the initial stratification-induced export
                                                                                decrease would remain unaltered (“SC without SSE,
  2. Ecological effect (EE) – A decrease in surface nutri-
                                                                                with EE” point in Fig. 4d).
     ent supply also selects for smaller phytoplankton, which
     presumably leads to a larger proportion of small parti-
     cles in the export flux. The net result of this ecologi-             Only in the presence of both the ecological and sinking speed
     cal effect (EE) (Fig. 4a, red arrow) is captured in a pre-           effects does the PSR feedback function in full; in this case,
     dominantly negative relationship between export and β                after circulation is slowed, export and β must reach a new
     (Fig. 4c, red line). Constrained by this empirical rela-             steady state at the intersection of the red and blue lines (“SC
     tionship, changes in export and β under slowed circu-                with SSE and EE” yellow star in Fig. 4d). Thus, the overall
     lation (SC) must fall along the red line in Fig. 4c (“SC             decrease in POC export would be smaller than predicted from
     with EE” point). In the absence of the ecological effect             decreased circulation rates and surface nutrient supply alone.
     (i.e., phytoplankton and particle sizes are not affected by          That is, the net effect of phytoplankton selection and particle-
     changes in the nutrient supply), there is no such require-           size-dependent remineralization depths provide a negative
     ment and β would remain unchanged under a slowed                     feedback on, or dampening of, changes in export, due to the
     circulation scenario (“SC without EE” point in Fig. 4c).             empirically derived negative relationship between β and ex-
                                                                          port. While we have assumed that phytoplankton community
  3. Sinking speed effect (SSE) – Smaller particles result-               structure is the underlying mechanism linking POC export
     ing from the ecological response to a reduced nutrient               and particle size, the PSR feedback would operate in the
     supply would sink more slowly and therefore reminer-                 same direction discussed here if another mechanism were ul-

Biogeosciences, 18, 229–250, 2021                                                                https://doi.org/10.5194/bg-18-229-2021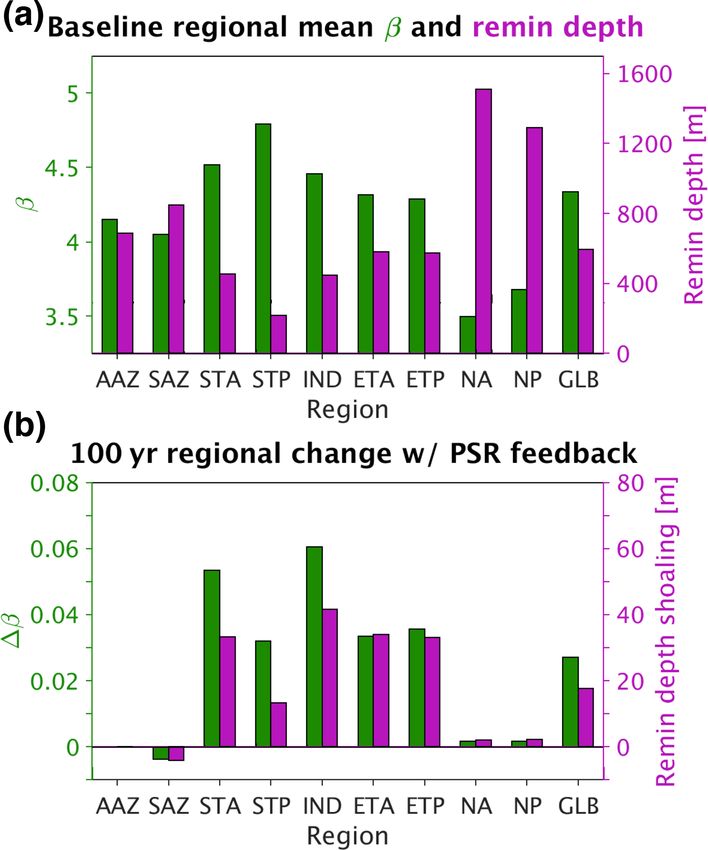
S. W. Leung et al.: Variable particle sizes reduce export flux sensitivity                                                        237

timately responsible for the empirical negative relationship
between these two factors. Though the above description fo-
cuses on export decreases under decreased circulation rates,
the PSR feedback would result in an analogous dampening of
export increases under increased circulation rates and surface
nutrient supply.

3.3     Predicted export changes in the presence of the
        global negative PSR feedback effect

In this section, we discuss how predicted future changes
in export production and mesopelagic POC flux differ be-
tween biogeochemical model simulations with and without
the PSR feedback effect applied globally. Section 3.3.1 ex-
amines global mean changes in export with and without the
PSR feedback applied globally. Section 3.3.2 and 3.3.3 then
zoom into zonal and regional mean export changes with and
without the global PSR feedback. Finally, Sect. 3.3.4 exam-
ines changes in deeper mesopelagic POC fluxes with and            Figure 5. Changes in global mean export over time from baseline
without the global PSR feedback.                                  conditions (current-day circulation, ran to steady state) after in-
                                                                  creasing or decreasing circulation rates by 10 %. Dashed and solid
3.3.1    Predicted global mean export changes with and            lines represent runs with the PSR feedback turned off and on, re-
         without the global PSR feedback                          spectively. The bars on the right show absolute changes in global
                                                                  mean export from the baseline case 100 years after changing cir-
                                                                  culation rates. Corresponding relative changes (calculated as abso-
To examine the global strength of the PSR feedback within
                                                                  lute changes from the baseline over the baseline mean) are listed in
our model under an idealized climate change scenario,             black. Global mean export in the baseline case is listed on the zero
we compare global mean export changes over time in                line. Hatching and solid patterns represent runs with the PSR feed-
the PSR feedback-on and feedback-off runs after a 10 %            back turned off and on, respectively. The error bars represent export
decrease in circulation rates (Fig. 5, comparing slower-          decreases generated when employing the upper- and lower-bound
circulation dashed and solid lines). In both the feedback-          dβsat
                                                                  dE      maps described in Sect. 2.2.3.
                                                                    n, sat
on and feedback-off cases, instantaneously decreasing cir-
culation rates reduces surface nutrient supply and immedi-
ately leads to a sharp decrease in global mean export of
∼ 0.2 molC m−2 yr−1 from 3.54 molC m−2 yr−1 . After this          (Fig. 6b). The greatest regional mean β increase of 0.06 oc-
initial plunge, global mean export declines by an additional      curs in the Indian Ocean (IND), resulting in a 41 m shoaling
0.09 molC m−2 yr−1 over the next 100 years with the feed-         of remineralization depths there (Fig. 6b). Results from runs
                                                                                                           dβsat
back off (for a total decrease of 0.29 molC m−2 yr−1 or           employing upper- and lower-bound dE       n, sat
                                                                                                                   maps (defined in
8.1 %) vs. an additional 0.05 molC m−2 yr−1 with the feed-        Sect. 2.2.3, represented by the error bars in Fig. 4b) lend fur-
back on (for a total decrease of 0.25 molC m−2 yr−1 or 7.0 %)     ther support to our findings and indicate that the modeled
(Fig. 5, slower-circulation lines and bars).                      global PSR feedback effect size is relatively insensitive to
                                                                                                                     dβsat
   Turning the PSR feedback on in our model reduced the to-       the choice of export maps used to compute dE         n, sat
                                                                                                                              (Fig. 5,
tal 100-year predicted decrease in export by ∼ 14 % relative      black error bars).
to the PSR feedback-off scenario (the ratio of the solid col-        The PSR feedback also dampens the response of global-
ored bar length to the full bar length below zero in Fig. 5. At   mean carbon export to an instantaneous increase in ocean
equilibrium (when global mean export stabilizes ∼ 500 years       circulation rates (Fig. 5). One hundred years after circula-
after decreasing circulation rates), this feedback effect in-     tion rates are increased by 10 %, global mean carbon export
creases to ∼ 16 %. With the feedback turned on, particle sizes    increases from 3.54 molC m−2 yr−1 by 0.28 molC m−2 yr−1
shrink and remineralization depths shoal in response to an        (8.0 %) with the feedback off, whereas it increases by
initial circulation-driven decrease in surface nutrient supply,   ∼ 0.23 molC m−2 yr−1 (6.6 %) with the feedback on (Fig. 5,
thereby moderating this initial decrease by keeping more re-      faster-circulation lines and bars). Thus, increasing circula-
cycled nutrients at the surface. In particular, global mean β     tion rates by 10 % with the PSR feedback on reduces the
increases by 0.03 (from 4.34 to 4.37) under 10 % decreased        100-year increase in export production by ∼ 18 % (the ra-
circulation rates after 100 years with the PSR feedback on        tio of the solid colored bar length to the full bar length above
(Fig. 6a and b), corresponding to a 17 m global mean shoal-       zero in Fig. 5). At equilibrium, this feedback effect increases
ing (from 595 to 578 m) of e-folding remineralization depths      to ∼ 20 %. With the feedback turned on, particle sizes grow

https://doi.org/10.5194/bg-18-229-2021                                                        Biogeosciences, 18, 229–250, 2021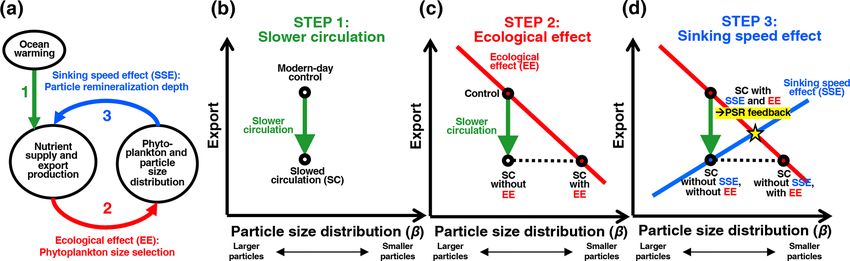
238 S. W. Leung et al.: Variable particle sizes reduce export flux sensitivity
response to any physical perturbation in nutrient supply, re-
gardless of the direction.
The strength of the PSR feedback also does not depend
on the size of circulation rate changes. Indeed, we observed
that PSR feedback strength remains constant whether circu-
lation rates are increased or decreased by 10 % or 50 %. Thus,
the percentage difference in projected export change between
PSR feedback-on and feedback-off cases is relatively uni-
form even under quite different changes in circulation rates.
3.3.2 Predicted zonal and regional mean export
changes without the global PSR feedback
In our baseline simulation under current-day circulation
rates, POC export covaries tightly throughout the low-to-mid
latitudes with nutrient concentrations in shallow subsurface
waters beneath the euphotic zone, quantified here as [PO4 ]
at 200 m depth (P200 m ) (Figs. 7a and b and 8a). South of
∼ 40◦ S and north of ∼ 40◦ N, other factors such as light
and/or temperature become limiting; as a result, export does
not vary as tightly with P200 m in these higher-latitude re-
gions. The spatial structure of the relationship between ex-
port and P200 m confirms that nutrient supply from subsur-
Figure 6. (a) Baseline (current-day circulation, ran to steady state) face layers is the primary driver of export rates throughout
regional mean β (shown in green) and e-folding remineralization
the nutrient-limited low-to-mid latitudes. Therefore, in these
(remin) depth (shown in purple). (b) Absolute change in regional
mean β (shown in green) and absolute shoaling of regional mean
regions, the following balance approximately holds:
remineralization depth (shown in purple) 100 years after decreasing
circulation rates by 10 % with the PSR feedback turned on. GLB
Export = E ≈ wP200 m , (2)
stands for global mean.
where w is the local upwards nutrient supply velocity, which
represents the net effect of all vertical exchange processes,
including diffusion, upwelling, entrainment, and mixing.
and remineralization depths deepen in response to an initial This relationship between export, upwelling, and subsurface
circulation-driven increase in surface nutrient supply, thereby nutrient concentrations reflects the common assumption that,
moderating this initial increase by transferring more nutrients at steady state, export flux out of the euphotic zone must ap-
to deeper waters where they recirculate more slowly to the proximately balance the supply of nutrients into the euphotic
surface. In particular, global mean β decreases by 0.03 units zone by upwelling (e.g., Ducklow et al., 2001; Passow and
(from 4.34 to 4.31) under 10 % increased circulation rates, Carlson, 2012). This balance can in turn be used to derive
corresponding to a 20 m global mean deepening (from 595 (via perturbation analysis) a simple, approximate diagnostic
to 615 m) of e-folding remineralization depths (not shown). for understanding changes in export under altered circulation
The greatest regional mean β decrease of 0.07 occurs in the rates at any given location:
Indian Ocean (IND), resulting in a 54 m shoaling of reminer-
alization depths there. Compared with the decreased circu- 1E = 1w · P200 m, baseline + wbaseline · 1P200 m , (3)
lation case, absolute changes in remineralization depths are
slightly larger under increased circulation rates because rem- where baseline denotes variables from the baseline simula-
ineralization depth changes are more sensitive to variations tion ran to steady state with current-day circulation rates and
in β when particles are larger (that is, at smaller values of β). 1 denotes change from the baseline simulation under altered
Because remineralization depth changes are greater under circulation rates. (Note that we ignore the “perturbation prod-
increased circulation rates, so too is the global PSR feed- uct” term, 1w · 1P200 m , because it is negligible.)
back strength (14 % with decreased circulation rates vs. 18 % Though Eqs. (2) and (3) are not mathematically equiv-
with increased circulation rates). Again, results from PSR alent to the full model solution, they explain much of the
feedback-on runs constrained by upper- and lower-bound full model’s behavior and provide us with a tool to simplify,
dβsat
dEn, sat maps further support the notion that the PSR feedback deconvolve, and better understand the different mechanisms
size is relatively insensitive to the choice of export maps used leading to export changes. In particular, when ocean circu-
dβsat
to compute dE n, sat
(Fig. 5, error bars). Thus, the effect of the lation is slowed, Eq. (3) allows us to identify two different
PSR feedback is to buffer changes in export production in contributions to the resultant reduction in export through the
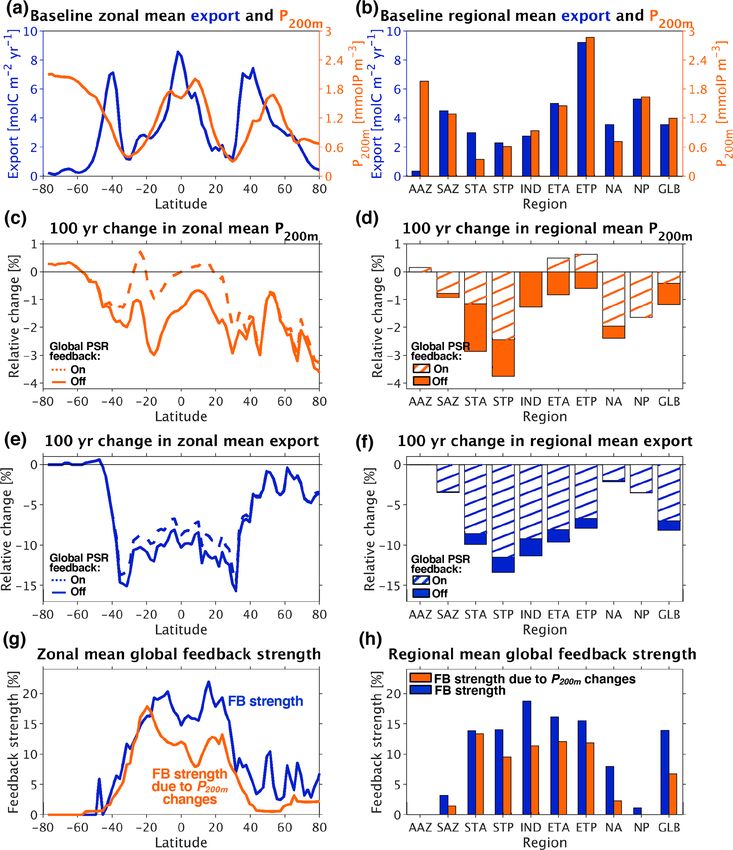
Biogeosciences, 18, 229–250, 2021 https://doi.org/10.5194/bg-18-229-2021S. W. Leung et al.: Variable particle sizes reduce export flux sensitivity 239 Figure 7. (a) Baseline (current-day circulation, ran to steady state) zonal mean export and shallow subsurface (200 m) phosphate concentra- tion. (b) Same as (a) but with regional and global (GLB) rather than zonal means. (c) Relative changes (calculated as absolute changes from the baseline over the baseline mean) in zonal mean phosphate concentration at 200 m depth 100 years after decreasing circulation rates by 10 %. (d) Same as (c) but with regional and global means. (e) Relative changes in zonal mean export 100 years after decreasing circulation rates by 10 %. (f) Same as (e) but with regional and global means. (g) Zonal mean PSR feedback (FB) strength, calculated as the difference in zonal mean export change from baseline between the feedback-off and feedback-on cases divided by the zonal mean export change in the feedback-off case alone (left-hand side of Eq. 4; shown in blue). Predicted zonal mean PSR feedback strength from changes in circulation and shallow subsurface phosphate concentration (right-hand side of Eq. (4); shown in orange). (h) Same as (g) but with regional and global means. low-to-mid latitudes. First, and most intuitively, when circu- ent utilization in the surface of the Southern Ocean in re- lation rates are uniformly decreased, w is reduced across the sponse to slower circulation, which is then propagated into entire ocean (1w < 0) and the supply of “baseline” nutrients the low-to-mid-latitude interior through Antarctic Interme- is curtailed. Second, a decrease in circulation rates also re- diate Water and Subantarctic Mode Water (e.g., Sarmiento duces phosphate concentrations throughout the shallow sub- et al., 2004; Marinov et al., 2006), as observed in future cli- surface layer in the low-to-mid latitudes (1P200 m < 0) (solid mate simulations by more complex ESMs (e.g., Moore et al., lines and bars in Figs. 7c and d and 8b). This decrease in 2018). P200 m is likely largely driven by enhanced biological nutri- https://doi.org/10.5194/bg-18-229-2021 Biogeosciences, 18, 229–250, 2021
240                                                       S. W. Leung et al.: Variable particle sizes reduce export flux sensitivity

                                                                        decrease we imposed on circulation rates leads to 100-year
                                                                        zonal mean export decreases of > 15 % at 35◦ N and S and
                                                                        ∼ 10 % between 35◦ N and S (solid line in Fig. 7e). Region-
                                                                        ally, the oligotrophic subtropics (especially the STP) exhibit
                                                                        the largest relative decreases in export (∼ 10 %–13 %), fol-
                                                                        lowed closely by the tropics (ETA, ETP) with export de-
                                                                        creases around 8 %–10 % (solid bars in Fig. 7f). As expected,
                                                                        the decrease in export mirrors the pattern of 1P200 m in low-
                                                                        to-mid-latitude regions due to a strong dependence of export
                                                                        on nutrient supply from the shallow subsurface here.

                                                                        3.3.3   Predicted zonal and regional mean export
                                                                                changes with the global PSR feedback

                                                                        As with the global mean (Sect. 3.3.1), we quantify zonal
                                                                        and regional mean PSR feedback strength as the difference
                                                                        in circulation-driven export change from baseline between
                                                                        the feedback-on and feedback-off runs, normalized by the
                                                                        change from baseline in the feedback-off run. In other words,
                                                                        the PSR feedback strength is the percentage by which turning
                                                                        on the PSR feedback reduces (dampens) the response of car-
                                                                        bon export to changes in ocean circulation (blue line and bars
                                                                        in Fig. 7g and h). Thus, the zonal mean feedback strength
                                                                        (blue line in Fig. 7g) is equal to the difference between the
                                                                        dashed and solid lines divided by the solid line in Fig. 7e,
                                                                        while the regional mean PSR feedback strength (blue bars in
                                                                        Fig. 7h) is equal to the length of the solid colored portion of
                                                                        the bars divided by the entire length of the bars in Fig. 7f. The
                                                                        PSR feedback strength is greatest (most strongly damping) in
                                                                        the low-to-mid latitudes and in the tropics (ETA, ETP) and
                                                                        subtropics (STA, STP, IND), with the feedback able to re-
                                                                        duce zonal and regional mean export changes by up to 20 %
                                                                        in these regions (blue lines and bars in Fig. 7g and h). To
                                                                        understand this spatial pattern, we combine Eq. (3) with our
                                                                        definition of PSR feedback strength to yield the following
                                                                        diagnostic, which can help separate out the various determi-
                                                                        nants of PSR feedback strength:
                                                                                                   1Eon − 1Eoff
                                                                        PSR feedback strength =
                                                                                                      1Eoff
                                                                                                   1P200 m, on − 1P200 m, off
Figure 8. (a) Baseline (current-day circulation, ran to steady state)
zonal mean phosphate concentration. (b) Absolute change in zonal                                         P200 m, baseline
                                                                                                 ≈                            ,      (4)
mean phosphate concentration 100 years after decreasing circula-                                    1w          1P200 m, off
                                                                                                            +
tion rates by 10 % with the PSR feedback turned off. (c) Same as (b)                               wbaseline P200 m, baseline
but with the PSR feedback turned on. (d) Difference in zonal mean
                                                                        where on or off denotes whether the PSR feedback was
phosphate concentration between PSR feedback-on and feedback-
off runs (i.e., b minus c).
                                                                        turned on or off under the altered circulation rates. This ex-
                                                                        pression reveals that the PSR feedback effect is strongest
                                                                        wherever activating the feedback leads to the greatest damp-
                                                                        ening of changes in P200 m compared to the changes that
   Together, the decreases in shallow subsurface nutrient con-          occur in the feedback-off
                                                                                                    case. In the decreased
                                                                                                                           circula-
                                                                                              1w
centrations (P200 m ) and vertical exchange rates (w) result in         tion simulations wbaseline  = −10 % everywhere , the low-
substantial reductions in export throughout most of the ocean           to-mid-latitude regions display the greatest differences in
under our decreased circulation simulations as dictated by              P200 m changes between feedback-on and feedback-off runs
Eq. (3), with the greatest reductions occurring in nutrient-            (Figs. 7c and d and 8b–d); these regions undergo the great-
limited areas. In the absence of the PSR feedback, the 10 %             est reductions in circulation-driven export change due to the

Biogeosciences, 18, 229–250, 2021                                                           https://doi.org/10.5194/bg-18-229-2021
You can also read