The role of the NMD factor UPF3B in olfactory sensory neurons - eLife
←
→
Page content transcription
If your browser does not render page correctly, please read the page content below
RESEARCH ARTICLE

                                     The role of the NMD factor UPF3B in
                                     olfactory sensory neurons
                                     Kun Tan1†, Samantha H Jones1†, Blue B Lake2, Jennifer N Dumdie1,
                                     Eleen Y Shum1, Lingjuan Zhang3, Song Chen2, Abhishek Sohni1, Shivam Pandya1,
                                     Richard L Gallo3, Kun Zhang2, Heidi Cook-Andersen1,4, Miles F Wilkinson1,5*
                                     1
                                       Department of Obstetrics, Gynecology, and Reproductive Sciences, School of
                                     Medicine University of California, San Diego, San Diego, United States;
                                     2
                                       Department of Bioengineering, University of California, San Diego, San Diego,
                                     United States; 3Department of Dermatology, University of California, San Diego,
                                     San Diego, United States; 4Division of Biological Sciences, University of California,
                                     San Diego, San Diego, United States; 5Institute of Genomic Medicine, University of
                                     California, San Diego, San Diego, United States

                                     Abstract The UPF3B-dependent branch of the nonsense-mediated RNA decay (NMD) pathway
                                     is critical for human cognition. Here, we examined the role of UPF3B in the olfactory system.
                                     Single-cell RNA-sequencing (scRNA-seq) analysis demonstrated considerable heterogeneity of
                                     olfactory sensory neuron (OSN) cell populations in wild-type (WT) mice, and revealed that UPF3B
                                     loss influences specific subsets of these cell populations. UPF3B also regulates the expression of a
                                     large cadre of antimicrobial genes in OSNs, and promotes the selection of specific olfactory
                                     receptor (Olfr) genes for expression in mature OSNs (mOSNs). RNA-seq and Ribotag analyses
                                     identified classes of mRNAs expressed and translated at different levels in WT and Upf3b-null
                                     mOSNs. Integrating multiple computational approaches, UPF3B-dependent NMD target transcripts
*For correspondence:                 that are candidates to mediate the functions of NMD in mOSNs were identified in vivo. Together,
mfwilkinson@health.ucsd.edu          our data provides a valuable resource for the olfactory field and insights into the roles of NMD in
†
 These authors contributed           vivo.
equally to this work

Competing interests: The
authors declare that no              Introduction
competing interests exist.
                                     Nonsense-mediated RNA decay (NMD) is a conserved pathway originally discovered by virtue of its
Funding: See page 22                 ability to degrade aberrant RNAs harboring premature termination codons (PTCs) and thus protect
Received: 17 April 2020              cells from truncated, potentially toxic, dominant-negative proteins (Chang et al., 2007; Conti and
Accepted: 09 August 2020             Izaurralde, 2005; Kurosaki et al., 2019; Lykke-Andersen and Jensen, 2015; Palacios, 2013). Sub-
Published: 10 August 2020            sequently, it was discovered that NMD degrades subsets of normal RNAs, with loss or disruption of
                                     NMD leading to dysregulation of 5–20% of the normal transcriptome in species spanning the phylo-
Reviewing editor: Didier YR
                                     genetic scale (Chan et al., 2007; He et al., 2003; Mendell et al., 2004). This discovery raised the
Stainier, Max Planck Institute for
Heart and Lung Research,
                                     possibility that the function of NMD extends beyond quality control. This notion has been supported
Germany                              by scores of subsequent studies showing that NMD factors are critical for many fundamental pro-
                                     cesses, including development, differentiation, cell proliferation, the integrated stress response, the
   Copyright Tan et al. This
                                     unfolded protein response, and autophagy (Chang et al., 2007; Karam et al., 2015;
article is distributed under the
                                     Kurosaki et al., 2019; Nasif et al., 2018).
terms of the Creative Commons
Attribution License, which              NMD is well-studied at the biochemical level, with over 15 proteins known to be involved in this
permits unrestricted use and         pathway (Chang et al., 2007; Kurosaki et al., 2019). Three of these proteins—UPF1, UPF2, and
redistribution provided that the     UPF3—are present in all eukaryotes and considered to be the core NMD factors (Conti and Izaur-
original author and source are       ralde, 2005). UPF1 is an RNA helicase that forms a complex with the adaptor proteins UPF2 and
credited.                            UPF3. In vertebrates, UPF3 is encoded by two paralogs: UPF3A (also called ‘UPF3’) and UPF3B (also

Tan et al. eLife 2020;9:e57525. DOI: https://doi.org/10.7554/eLife.57525                                                             1 of 29
Research article                                                                            Developmental Biology Neuroscience

                                    called ‘UPF3X’). UPF3A serves as a weak NMD factor and NMD repressor, while UPF3B is a NMD
                                    branch-specific factor that stimulates NMD (Chan et al., 2007; Shum et al., 2016). UPF3B directly
                                    binds to the exon-junction complex (EJC), a large multi-subunit complex recruited to RNAs just
                                    upstream of exon-exon junctions after RNA splicing (Woodward et al., 2017). The EJC triggers
                                    NMD when allowed to interact with other NMD factors. Evidence suggests that EJCs are displaced
                                    by the ribosome during the pioneer round of translation, and thus only EJCs deposited downstream
                                    of the stop codon defining the main open-reading frame (ORF) are able to elicit NMD (Dostie and
                                    Dreyfuss, 2002). Ribosomes would also be predicted to displace the last EJC when the termination
                                    codon resides ~50 nucleotides or less upstream of the last exon-exon junction, based on the length
                                    of the EJC and ribosome footprints. This has led to the ‘ 50-nt boundary rule,’ an empirically veri-
                                    fied dictum which states that only in-frame stop codons further than ~50 nt upstream of the last
                                    exon-exon junction elicit NMD (Nagy and Maquat, 1998). While there are exceptions to this 50-nt
                                    boundary rule (Carter et al., 1996), it reliably predicts a large proportion of EJC-dependent NMD
                                    target mRNAs (Boehm et al., 2014; Gehring et al., 2005; Hurt et al., 2013). NMD can be triggered
                                    by other molecular signals in addition to downstream EJCs. For example, long 3’-untranslated
                                    regions (UTRs) and short ORFs upstream of the main ORF (uORFs) can, in some cases, trigger NMD
                                    in an EJC-independent manner (Barrett et al., 2012; Bühler et al., 2006; Chang et al., 2007;
                                    Hurt et al., 2013; Kebaara and Atkin, 2009; Rebbapragada and Lykke-Andersen, 2009).
                                        While considerable progress has been made in understanding the molecular features that elicit
                                    NMD, we are still largely in the dark with regard to which transcripts are targeted for rapid decay. It
                                    is critical to define such NMD target mRNAs in order to begin to unravel the molecular mechanisms
                                    by which NMD influences biological processes. A particularly large gap in the field is the identity of
                                    NMD targets in vivo.
                                        Many lines of evidence suggests that NMD is not a single linear pathway but instead consists of
                                    several branches, each of which depends on different factors and promotes the decay of different
                                    sets of transcripts (Chan et al., 2007; Gehring et al., 2005; Mabin et al., 2018). In this report, we
                                    focus on the UPF3B-dependent branch of NMD, which has been shown to be important for the ner-
                                    vous system. Pedigree analysis of numerous families harboring mutations in the UPF3B gene have
                                    demonstrated that both nonsense and missense mutations cause intellectual disability in humans
                                    (Nguyen et al., 2014; Tarpey et al., 2007). Humans with UPF3B mutations also commonly have
                                    autism, schizophrenia, and/or attention-deficit/hyperactivity disorder (Nguyen et al., 2014;
                                    Tarpey et al., 2007). To understand the underlying mechanism for these behavioral defects, we gen-
                                    erated Upf3b-deficient mice (Huang et al., 2011; Karam et al., 2015). These Upf3b-null mice suffer
                                    from specific learning and memory deficits, including fear-conditioned learning, and thus replicate
                                    some aspects of the behavioral defects in UPF3B-deficient humans (Huang et al., 2018). In part,
                                    these behavioral defects may stem from abnormal neural connectivity, as cortical pyramidal neurons
                                    from Upf3b-null mice undergo impaired dendritic spine maturation in vivo (Huang et al., 2018). Fur-
                                    thermore, cultured UPF3B-depleted neural cells have subtle dendrite outgrowth defects (Jolly et al.,
                                    2013), and expression of UPF3B mutants reduces neurite branching (Alrahbeni et al., 2015). The
                                    behavioral defects in Upf3b-null mice may also result from neural differentiation and/or maturation
                                    defects that were uncovered using loss-of-function approaches in neural precursor cells in vitro, or
                                    by forced expression of UPF3B mutants in cell lines in vitro (Alrahbeni et al., 2015; Huang et al.,
                                    2018; Jolly et al., 2013).
                                        In this communication, we examine the role of UPF3B in the olfactory system, a useful model for
                                    studying neural development and function. There is also considerable clinical interest in the olfactory
                                    system, as olfactory defects predict the later onset of numerous CNS disorders, including Parkinson’s
                                    and Alzheimer’s disease (Doty, 2012). Olfactory dysfunction also strongly associates with autism
                                    (Rozenkrantz et al., 2015). The olfactory epithelium (OE) retains a life-long capacity for neurogene-
                                    sis and harbors a robust regeneration system that responds to injury (Whitman and Greer, 2009).
                                    Importantly, the olfactory system is much simpler than the CNS. Mature olfactory sensory neurons
                                    (mOSNs) develop via a relatively simple linear pathway involving horizontal basal cells (HBCs), glo-
                                    bose basal cells (GBCs), and immature olfactory sensory neurons (iOSNs). Both HBCs and GBCs are
                                    stem cells, but the two types have different roles (Schwob et al., 2017). HBCs are reserve stem cells,
                                    as they are normally quiescent and only undergo proliferative expansion in response to OE injury
                                    (Peterson et al., 2019). In contrast, GBCs are a heterogeneous cell population that consists of con-
                                    stitutively active stem cells as well as progenitors (Schwob et al., 2017). Lineage-tracing analysis

Tan et al. eLife 2020;9:e57525. DOI: https://doi.org/10.7554/eLife.57525                                                            2 of 29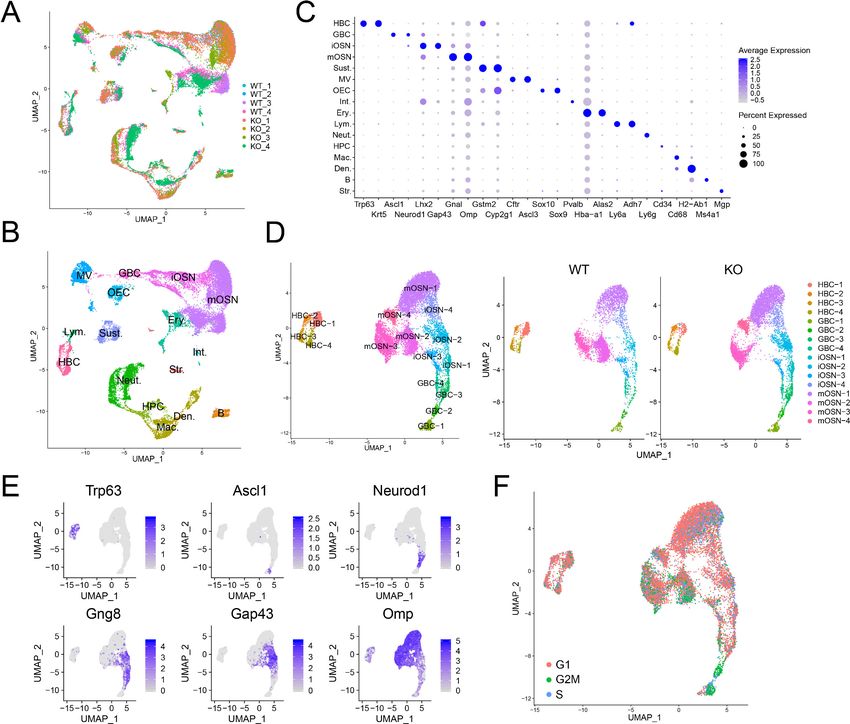
Research article                                                                             Developmental Biology Neuroscience

                                    and single-cell RNA sequencing (scRNA-seq) analysis have shown that after proliferative expansion,
                                    HBCs and GBCs give rise to iOSNs, which are responsible for undergoing maturation
                                    (Fletcher et al., 2017). Of note, iOSNs share markers with another OSN stage called ‘immediate
                                    neural precursors (INPs).” Given the ambiguity of the nomenclature, we will refer to cells with either
                                    INP or iOSN characteristics as iOSNs. iOSNs ultimately differentiate into mOSNs, which send an
                                    axon to neurons in the glomeruli region of the olfactory bulb, relaying olfactory information from the
                                    outside world to the CNS. mOSNs recognize odorants through chemosensory receptors, including
                                    olfactory receptors (OLFRs), members of the G-protein-coupled receptor super-family, as well as
                                    trace amine–associated receptors, guanylate cyclases, and members of the membrane-spanning 4-
                                    pass A gene family (Bear et al., 2016; Saraiva et al., 2019).
                                        To gain insight into the nature of the cells in the OE and their developmental relationships, recent
                                    studies have performed transcriptome profiling using whole OE, pools of sorted OSNs, single OSNs,
                                    or single OE cells (Fletcher et al., 2017; Ibarra-Soria et al., 2014; Saraiva et al., 2015;
                                    Saraiva et al., 2019; Tan et al., 2015). These studies have revealed new OE cell subsets, inferred
                                    the developmental pathways of both OSN and non-neural OE cells, defined classes of genes exhibit-
                                    ing enriched expression and unique patterns of expression in different OE subsets, and revealed the
                                    expression patterns and dynamics of OLFRs during OSN development and in individual mOSNs.
                                    These studies have also advanced our understanding of mammalian olfaction evolution.
                                        In this study, we ascertain whether the NMD factor, UPF3B, has roles in the olfactory system.
                                    Using scRNA-seq and RNA-seq analyses, we obtained evidence that UPF3B influences the frequency
                                    of specific OSN subsets, broadly suppresses the expression of immune genes in OSNs, and shapes
                                    the Olfr gene repertoire. We also identified high-confidence NMD target mRNAs in vivo that are
                                    candidates to act downstream of UPF3B in mOSNs. As part of our analysis, we also provide new cel-
                                    lular and molecular information on WT OSNs and their development in vivo. Our findings in Upf3b-
                                    null NMD-deficient mice introduce a useful biological system to understand the role of RNA metabo-
                                    lism in neurons, and our scRNA-seq, RNA-seq, and RiboTag datasets are new resources that can be
                                    used by the olfactory field.

                                    Results
                                    UPF3B-regulated genes in mOSNs
                                    To assess whether NMD-deficient Upf3b-null mice have an olfactory defect, we measured their
                                    weight during their growth phase. This follows from the fact that newborn mice are blind and there-
                                    fore depend on the olfactory system to initiate milk suckling for survival (Logan et al., 2012). We
                                    quantified the weight of Upf3b-null and littermate WT mice and found that Upf3b-null mice have a
                                    statistically significant postnatal weight deficit (p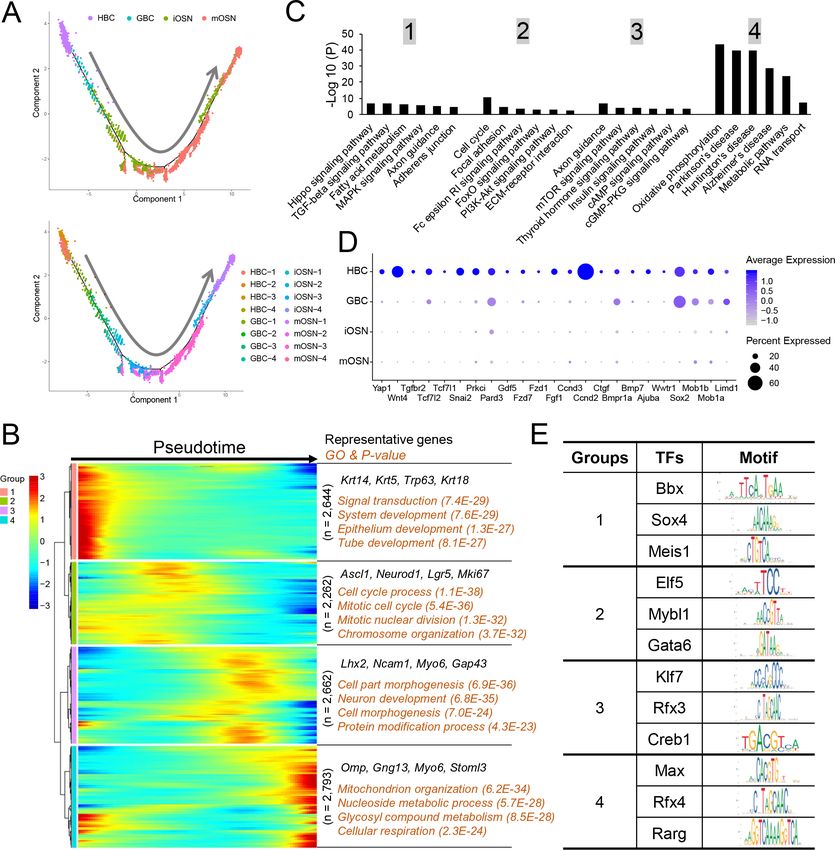
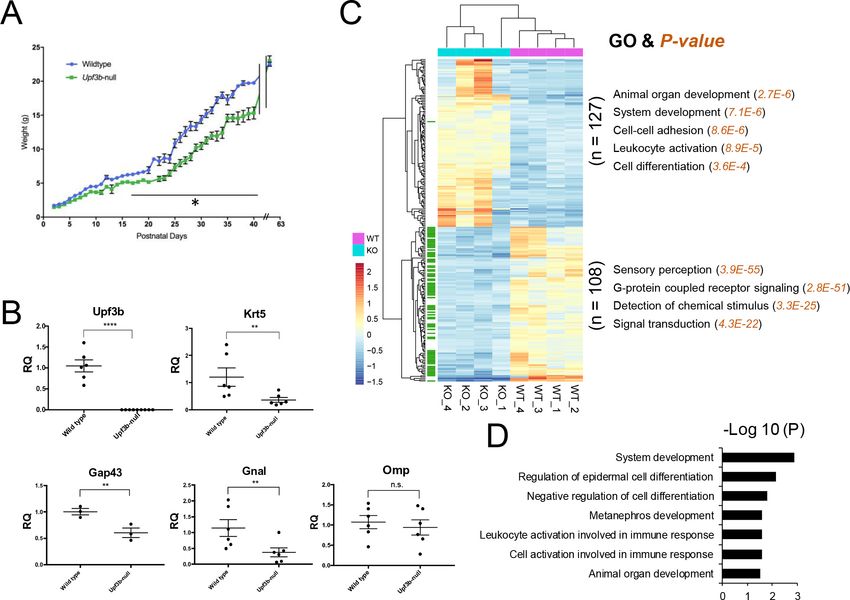
Research article                                                                                        Developmental Biology Neuroscience

Figure 1. Identification of UPF3B-regulated genes and NMD target genes in the olfactory system. (A) The weight of Upf3b-null vs. WT (wild type) mice
at the indicated time points. Upf3b-null mice gain weight slowly during postnatal development but then reach the weight of WT mice at the last time
point (9 weeks), a pattern indicative of a partial olfactory defect. *, p
Research article                                                                            Developmental Biology Neuroscience

                                    Identification of NMD target mRNAs in mOSNs
                                    NMD is thought to influence biological systems by virtue of its ability to promote the decay of spe-
                                    cific subsets of mRNAs (Lykke-Andersen and Jensen, 2015). As described in the introduction, there
                                    is dearth of knowledge regarding the identity of such NMD target RNAs, particularly in cells in their
                                    normal in vivo context. Our RNA-seq analysis of purified mOSNs from Upf3b-null and WT mice pro-
                                    vided an opportunity to identify in vivo direct NMD targets. Because NMD is a negative regulatory
                                    pathway (it degrades its targets), the 127 RNAs upregulated in Upf3b-null mOSNs are candidates to
                                    be direct NMD targets. Among them, we found that 73 had at least one of the well-established
                                    molecular features known to elicit NMD, including an exon-exon junction >50 nt downstream of the
                                    main ORF (dEJ) (Table 1; see the Introduction for an explanation of NMD-inducing features [NIFs]).
                                    Thus, these 73 mRNAs are strong candidates to be UPF3B-dependent NMD target mRNAs in
                                    mOSNs.
                                        Given that NMD degrades its target RNAs, this predicts that its targets should be stabilized after
                                    inactivation of UPF3B. Thus, we measured the stability of the 127 mRNAs upregulated in Upf3b-null
                                    mOSNs using a method that infers RNA stability based on pre-mRNA and steady-state mRNA levels
                                    (Alkallas et al., 2017). This method revealed that 82 of 127 upregulated genes encode mRNAs sta-
                                    bilized in Upf3b-null mOSNs as compared to WT mOSNs (Supplementary file 2). Of these 82 stabi-
                                    lized and upregulated mRNAs, 52 have at least 1 of the 3 well-established NIFs (Table 1), and thus
                                    we classified these 52 mRNAs as high-confidence mOSN NMD targets. The statistically enriched GO
                                    biological functions of the proteins encoded by these 52 mRNAs are listed in Figure 1D.

Table 1. UPF3B-dependent NMD target mRNAs in mOSNs.
Symbol            log2FC (KO/WT)    Padj       dEJ    uORF    3’UTR length   Symbol    log2FC (KO/WT)   Padj       dEJ   uORF   3’UTR length
Prelid3a          1.099967          0.003745   YES    NO      1572           Fmo2      2.02039          0.014815   NO    NO     2411
1700025G04Rik     0.662926          0.012989   NO     YES     8870           Gab2      0.98414          0.003018   NO    NO     3927
6030419C18Rik     0.73232           0.036112   NO     YES     55             Gdf11     1.429234         0.005353   NO    NO     2811
9330159F19Rik     0.542375          0.017617   NO     YES     3408           Gldn      2.115908         0.045841   NO    NO     2970
Adcy6             2.587005          0.002078   NO     YES     2356           Hk2       2.296045         0.033161   NO    NO     2285
Cdh24             1.560901          0.001303   NO     YES     121            Lbh       1.417311         0.024315   NO    NO     2498
Fam84b            0.719841          0.001704   NO     YES     3969           Luc7l     0.492061         8.19E-05   NO    NO     3738
Inpp5f            1.178064          0.043839   NO     YES     949            Map3k9    0.79841          0.021555   NO    NO     1029
Lrp2              2.504276          0.008534   NO     YES     1305           Msrb3     1.668851         0.033388   NO    NO     2972
Mafg              0.577538          0.046713   NO     YES     4167           Neurl3    1.966306         0.00546    NO    NO     1763
Plxnc1            2.322167          0.048567   NO     YES     2320           Notch2    1.68375          0.047733   NO    NO     2917
Prdm4             0.420203          0.027945   NO     YES     1160           Plekha5   0.608634         0.004216   NO    NO     3461
Ptch1             0.768864          0.01088    NO     YES     3205           Rab43     1.033148         0.0151     NO    NO     3737
Ptger2            3.032221          0.035664   NO     YES     1825           Rac2      3.029035         0.038392   NO    NO     2319
Sash3             2.352656          0.033245   NO     YES     1309           Raver2    1.921185         0.027779   NO    NO     1892
Serpinb11         1.991555          0.002719   NO     YES     468            Rflnb     0.755198         0.017617   NO    NO     2716
Snx33             1.512032          0.012417   NO     YES     1258           Sik1      2.027635         1.48E-06   NO    NO     2035
Zfp36             1.802697          0.025165   NO     YES     774            Slc38a6   1.21151          0.025847   NO    NO     1512
Agap2             1.264604          0.00099    NO     NO      1357           Slc5a1    2.563582         0.00527    NO    NO     1868
Aox2              1.36834           0.018035   NO     NO      1640           Swap70    1.863436         0.009993   NO    NO     2169
Atp10d            3.315656          0.017617   NO     NO      2384           Tgm2      2.395934         0.042993   NO    NO     1399
Bhlhe40           1.435423          0.000192   NO     NO      1593           Themis2   3.496025         0.015464   NO    NO     1053
Btg2              1.281148          0.000173   NO     NO      2199           Tmprss2   2.167673         0.005867   NO    NO     1456
Cybrd1            2.372842          0.002733   NO     NO      4269           Tob2      0.667082         0.001453   NO    NO     2459
Cyth4             2.162221          0.045105   NO     NO      1455           Ywhag     0.644673         0.017707   NO    NO     2586
Ermn              1.686519          0.005793   NO     NO      2641           Zcchc6    0.512078         0.003018   NO    NO     1346

Tan et al. eLife 2020;9:e57525. DOI: https://doi.org/10.7554/eLife.57525                                                               5 of 29
Research article Developmental Biology Neuroscience
To determine whether these high-confidence NMD target mRNAs correspond to known NMD
targets, we assembled a list of likely mouse NMD substrates defined by previous studies
(Supplementary file 3). To qualify to be in this list, the RNA must have at least one known NMD-
inducing feature (NIF) (Palacios, 2013) and experimental evidence from at least one assay that it is
an NMD substrate (e.g. high UPF1 occupancy or upregulation and/or stabilization in response to
NMD-factor depletion). We found that 11 of these previously defined likely mouse NMD target
mRNAs overlapped with the 52 high-confidence targets identified in our study: Atp10d, Lbh,
Slc38a6, Tgm2, Notch2, Ywhag, Luc7l, Ptch1, 1700025G04Rik, Ptger2, and Msrb3. Of note, it is not
surprising that only a proportion of the upregulated mRNAs we identified in NMD-deficient mOSNs
are previously known NMD targets, as NMD target mRNAs can be tissue-, cell type-, and NMD fac-
tor-specific (Huang et al., 2011). The list of previously defined candidate NMD targets that we com-
pared with were defined in non-neuronal tissues and cell lines made deficient in NMD by knocking
down or eliminating factors other than UPF3B (Supplementary file 3).
The mOSN transcriptome and translome
We next determined the translation rate of mRNAs in mOSNs, both as a resource for the field and
to address the relationship of NMD with translation in vivo. We assayed the translation rate of
mRNAs in mOSNs using RiboTag mice, which express an epitope-tagged ribosomal protein,
RPL22HA, which is incorporated into actively translating ribosomes specifically in cells expressing
CRE (Sanz et al., 2009). Immunoprecipitation (IP) of the cell lysates of interest with an HA antibody
purifies the ribosome-associated mRNAs (Figure 2A, left) with an efficiency associated with poly-
some density (Hornstein et al., 2016). To examine ribosome density specifically in WT mOSNs, we
isolated RiboTag-labeled mRNA from the OE of RiboTag; Omp-Cre mice and performed RNA-seq
analysis. As a validation of cell-type specificity, we found that IP of OE lysates with the HA antisera
enriched for the mOSN marker, Omp, whereas these lysates were depleted of the HBC and GBC
markers, Krt5 and Lgr5, respectively (Figure 2A, right). We then elucidated inferred translation effi-
ciency (TE) for all expressed mRNAs in mOSNs – the ‘mOSN translome’ – by calculating the ratio of
the IP signal from the RiboTag mice OE lysates over mOSN steady-state mRNA level, the latter
determined as described above (Supplementary file 2).
Given that 3’UTR length has been shown to influence translation rates in cultured cells
(Spies et al., 2013), we examined the relationship of 3’UTR length and TE in mOSNs in vivo. We
found that mOSN mRNAs harboring 3’UTRs of >2 kb have much higher average TE than mOSN
mRNAs harboring shorter 3’UTRs (Figure 2B). Highly translated mOSN mRNAs have an average
3’UTR length of ~1.8 kb, while lowly translated mOSN mRNAs have an average 3’UTR length of
only ~0.9 kb (Figure 2C).
To assess the potential functional relevance of translation, we binned WT mOSN mRNAs into
three groups: high (top 30%), medium (middle 40%), and low (bottom 30%) (Supplementary file 2).
We also binned WT mOSN mRNAs into three groups based on their steady-state level
(Supplementary file 2), allowing us to place mOSN mRNAs into the nine categories shown in
Figure 2D. GO analysis revealed that category #1—which is mRNAs expressed at high level that are
also highly translated—encode proteins that tend to function in ‘metabolism,’ ‘intercellular trans-
port,’ and ‘catabolism’ (Figure 2E). Categories #2 and #3—which are also highly translated mRNAs
but less well expressed at the RNA level than category #1—encode proteins with strikingly different
functions: ‘development,’ ‘cell migration,’ and ‘morphogenesis’ (Figure 2E). Category #6—which is
lowly expressed and modestly translated mRNAs—encode proteins involved in ‘signal transduction,’
‘differentiation,’ and ‘development,’ including ‘nervous system development’ (Figure 2E). The cate-
gories with most Olfr genes—#4 and #5—are also only moderately translated (Figure 2E). Upf3b-
null mOSNs had similar numbers of mRNAs in the nine categories as WT mOSNs (compare
Figure 2J with Figure 2D), indicative of UPF3B not altering the mOSN transcriptome and translome
globally. Rather, UPF3B influences specific mRNAs, as described above for the mOSN transcriptome,
and below for the mOSN translome.
The relationship between NMD and translation in vivo
NMD is a translation-dependent pathway, based on protein-synthesis inhibitor and transfection
experiments in immortalized cell lines (Belgrader et al., 1993; Carter et al., 1995; Karousis and
Tan et al. eLife 2020;9:e57525. DOI: https://doi.org/10.7554/eLife.57525 6 of 29Research article Developmental Biology Neuroscience
A Whole OE
B 2.5
n.s.
*
*
Ribo IP mOSNs
Sorted mOSNs 2.0
Relative expression
HA
Values
1.5
RPL22
1.0
mOSN Translome
(RiboTag+/-; Omp+/-; Upf3b-null) mRNA in mOSNs
0.5
0.0
Krt5 Lgr5 Omp
Log2FC (KO/WT) Log2TE (WT)
C D F 6 *
3'UTR>2kb 1kbResearch article Developmental Biology Neuroscience
Figure 2 continued
WT mOSNs is shown for mOSNs binned by TE (a and c have the highest and lowest TE values, respectively). *, p 1). We then independently plot-
ted these two sets of mRNAs in terms of TE and NMD magnitude (i.e. the degree of upregulation in
Upf3b-null mOSNs relative to WT mOSNs). The results show that the high-translation group exhib-
ited a correlation between their inferred translation rate and NMD magnitude (R2 = 0.5; Figure 2G).
In contrast, the low-translation group of mRNAs exhibited no correlation between their translation
rate and NMD magnitude (R2 = 0.06; Figure 2G). Together, these results support that NMD is trans-
lation-dependent in vivo and that its magnitude tends to be enhanced for highly translated mRNAs.
Our mOSN translome data also allowed us to assess the reciprocal question: does Upf3b influ-
ence translation in vivo? When we plotted the TE of mRNAs when expressed in Upf3b-null mOSNs
vs. when expressed in WT mOSNs, we found that the vast majority of mRNAs were similarly trans-
lated in both genetic backgrounds, as measured by RiboTag analysis (Figure 2H,
Supplementary file 2). Only 16 mOSN mRNAs migrated off the diagonal and thus had a significant
change in TE as a result of Upf3b loss (Figure 2H,I).
Identification of OE cell clusters
To determine whether UPF3B influences the cellular composition of the OE, we performed scRNA-
seq analysis on dissociated OE cells from 4 Upf3b-null and 4 WT mice. After filtering out poor quality
cells, 25,165 cells remained for subsequent analysis. Biological replicates exhibited similar cell distri-
butions (Figure 3A). Using a nonlinear dimensionality-reduction technique—uniform manifold
approximation and projection (UMAP)—we identified cell clusters corresponding to 16 known cell
types in the OE (Figure 3B). Some of the gene markers used to define these cell clusters are shown
in Figure 3C. Genes exhibiting enriched expression in each of the 16 cell types are listed in
Supplementary file 4.
Re-clustering of OSN precursors/OSNs (HBCs, GBCs, iOSNs, and mOSNs) revealed several cell
sub-clusters within each of these four stages (Figure 3D,E). The identification of these sub-clusters
suggested that each of these developmental stages exhibit considerable heterogeneity, at least at
the transcriptome level. Genes exhibiting enriched expression in each sub-cluster are shown in
Supplementary file 4.
HBC are known to be reserve stem cells, while GBCs consist of active stem cells and progenitors
(Schwob et al., 2017). Consistent with this, cell-cycle analysis showed that all four HBC sub-clusters
primarily contain quiescent cells, while the GBC sub-clusters have many cells that are proliferating
(Figure 3F). All four HBC sub-clusters express similar levels of well-established HBC markers, includ-
ing Krt5 and Trp63 (Figure 4A). These HBC sub-clusters are each uniquely marked by novel gene
markers that we identified (Figure 4A and Supplementary file 4).
GBCs also segregated into four sub-clusters (Figure 3D), which is consistent with past studies
demonstrating that GBCs are heterogeneous (Cau et al., 1997; Manglapus et al., 2004;
Schwob et al., 2017). Monocle pseudotime trajectory analysis suggested that these four sub-
Tan et al. eLife 2020;9:e57525. DOI: https://doi.org/10.7554/eLife.57525 8 of 29Research article Developmental Biology Neuroscience
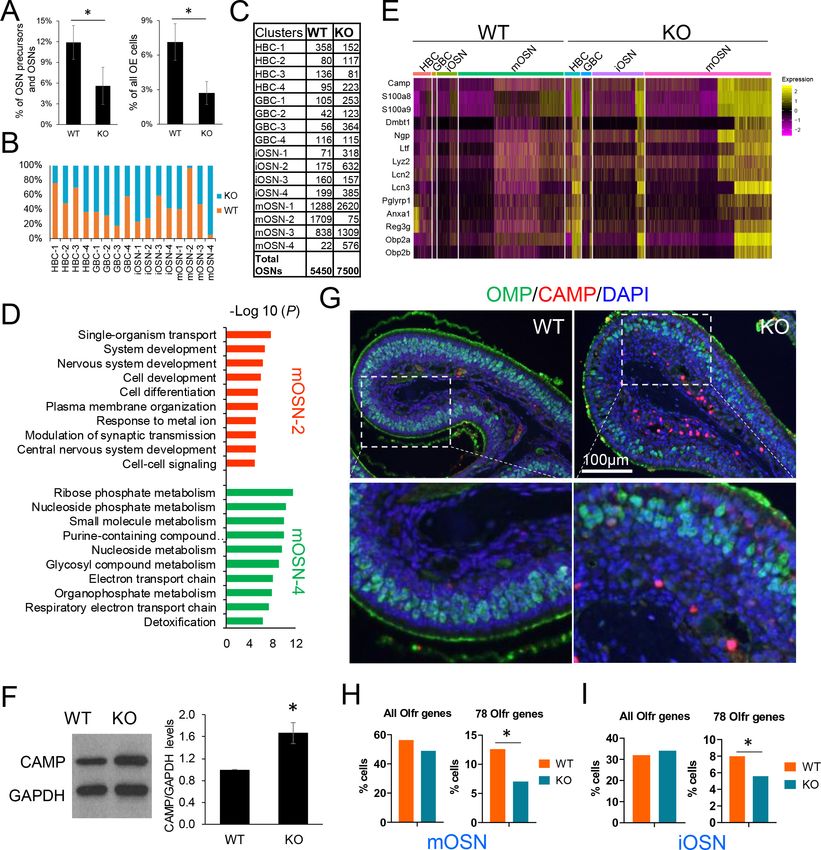
Figure 3. Identification of OE cell subsets using scRNAseq analysis. (A) UMAP plot of OE cells from 4 Upf3b-null (KO) and 4 WT mice analyzed by
scRNAseq. (B) Same UMAP plot as is in (A), showing the identity of the different cell clusters. (C) Dotplot depicting the expression of gene markers in
the cell clusters defined in (B). (D) Left, UMAP plot of reclustered OSN precursors/OSNs defined in (A). Right, genotype information. (E) Same UMAP
plot as in (D), showing the expression of stage-specific markers. (F) Same UMAP plot as in (D), showing inferred cell-cycle phase based on the
expression of a large set of G2/M- and S-phase genes (Kowalczyk et al., 2015).
clusters have a linear developmental relationship, with GBC-1 the most immature, GBC-2 more
advanced, and GBC-3 and 4 the most advanced (Figure 4B). Consistent with this developmental
trajectory, both GBC-1 and GBC-2 express the early GBC marker Ascl1 (Cau et al., 1997;
Manglapus et al., 2004). GBC-1 is likely to be more primitive than GBC-2, based on the frequent
and high expression of the later GBC markers Neurog1 and Neurod1 (Cau et al., 1997;
Manglapus et al., 2004) in the latter, not the former (Figure 4C). While GBC-3 and 4 are clearly
GBCs based on the expression of several GBC markers (e.g. Neurog1 and Neurod1), they also
express iOSN markers (e.g. Gng8 and Gap43 [Iwema and Schwob, 2003; Figure 4C]), consistent
with GBC-3 and -4 being iOSN precursors and hence advanced GBCs. iOSNs also segregated into
several cell sub-clusters that each express unique genes (Figure 4D). These iOSN sub-clusters follow
Tan et al. eLife 2020;9:e57525. DOI: https://doi.org/10.7554/eLife.57525 9 of 29Research article Developmental Biology Neuroscience
Figure 4. HBC, GBC, iOSN and mOSN heterogeneity. (A) Violin plots showing the expression of selective gene markers in the four indicated HBC sub-
clusters in WT mice. (B) Monocle trajectory analysis of the HBC and GBC sub-clusters we identified. The arrow indicates the inferred direction of
differentiation. (C–E) Violin plots showing the expression of selective gene markers in the indicated GBC, iOSN, and mOSN sub-clusters in WT mice. (F)
The most statistically enriched signaling pathways in the mOSN-1,–2, and 3 sub-clusters.
a ‘linear’ pattern as depicted by the UMAP algorithm (Figure 3D), consistent with them representing
sequential developmental states, each with unique transcriptomes.
Most WT mOSNs segregated into three different cell clusters (Figure 3D), each of which prefer-
entially express different genes (Figure 4E). GO and KEGG signaling pathway analyses indicated
that these three mOSN sub-clusters are enriched for different functions and signaling pathways,
respectively (Figure 4F; Supplementary file 4).
OSN molecular pathways
Monocle pseudotime analysis of the OSN precursor/OSN cell clusters indicated that they follow a
HBC!GBC!iOSN!mOSN trajectory (Figure 5A), consistent with previous studies (Fletcher et al.,
2017; Schwob et al., 2017; Tepe et al., 2018). To define candidate molecular events occurring dur-
ing OSN development, we identified genes whose expression is statistically enriched along this
Tan et al. eLife 2020;9:e57525. DOI: https://doi.org/10.7554/eLife.57525 10 of 29Research article Developmental Biology Neuroscience Figure 5. Gene groups exhibiting distinct expression dynamics during OSN development. (A) Monocle pseudotime trajectory analysis of the indicated cell clusters and sub-clusters from WT mice defined in Figure 3B (top) and Figure 3D (bottom), respectively. (B) Heatmap depicting the expression pattern of the four gene groups we defined, each with a unique expression pattern, as defined by the trajectory timeline shown in (A), upper. Top: pseudotime directions; right: the number of differentially expressed genes in each group and representative biological processes and P-values. (C) The most statistically enriched signaling pathways corresponding to each of the four gene groups defined in (B). (D) Dot plot showing genes related to the Hippo signaling pathway are primarily expressed in HBCs. (E) Transcription factor genes exhibiting the most statistically enriched expression in each gene group defined in (B). Target sequences predicted by the ENCODE database are indicated. Tan et al. eLife 2020;9:e57525. DOI: https://doi.org/10.7554/eLife.57525 11 of 29
Research article                                                                             Developmental Biology Neuroscience

                                    pseudotime trajectory (Supplementary file 4). This analysis identified 4 distinct patterns of gene
                                    expression dynamics that we named groups 1 to 4 (Figure 5B). Group-1 genes are dominated by
                                    genes expressed transiently in HBCs, including the previously defined HBC-marker genes Trp63,
                                    Krt5, and Krt14. Group-1 genes are statistically enriched for ‘signal transduction’ and various ‘devel-
                                    opment’ categories (Figure 5B). Group-2 genes contain GBC genes; indeed the GBC markers Ascl1,
                                    Neurod1, and Lgr5 are enriched in group 2. ‘Cell cycle process’ is statistically enriched (Figure 5B),
                                    consistent with the fact that GBCs undergo self-renewal and proliferative expansion. Group-3 genes
                                    are mainly expressed in iOSNs, include the well-established iOSN marker genes Lhx2, Ncam1, and
                                    Gap43. ‘Neuron development’ is enriched in group 3 (Figure 5B), consistent with the fact that iOSNs
                                    are undergoing the final stages of development prior to becoming mature neurons. Group-4 genes
                                    are mainly expressed in mOSNs; enriched GO categories include ‘mitochondrion organization,’
                                    ‘metabolism,’ and ‘cellular respiration’.
                                       KEGG signaling pathway analysis revealed that genes involved in different signaling pathways are
                                    enriched in each of the 4 groups (Figure 5C). For example, Hippo pathway genes are enriched in
                                    group 1 (Figure 5D), raising the possibility this signaling pathway may be important for maintaining
                                    HBC stem cells in the quiescent state or eliciting their activation in response to insults.
                                       We also screened for transcription factors preferentially expressed at different stages of OSN
                                    development. We identified 209, 178, 169, and 135 transcription factor genes exhibiting enriched
                                    expression in groups 1, 2, 3 and 4, respectively (Supplementary file 4). The top 3 transcription fac-
                                    tors in each group and their DNA-binding specificity are shown in Figure 5E.

                                    UPF3B impacts HBCs and mOSNs
                                    The array of UPF3B-dependent NMD targets we identified in mOSNs (Figure 2) raised the possibility
                                    that UPF3B has roles in mOSNs and possibly OSN precursors. To assess this, we first determined
                                    whether loss of UPF3B impacts the frequency of HBCs, GBCs, iOSNs, and mOSNs. scRNA-seq analy-
                                    sis revealed that there was a significant reduction in the frequency of HBCs in Upf3b-null mice rela-
                                    tive to WT mice, when compared to either all OSN precursors/OSNs or all OE cells (p
Research article Developmental Biology Neuroscience Figure 6. UPF3B shapes olfactory neurogenesis. (A) The fraction of HBCs per all OSN precursors/OSNs (HBCs, GBCs, iOSNs and mOSNs) (left) or all OE cells (right), in Upf3b-null (KO) and WT mice, as determined by scRNA-seq analysis. *, p
Research article                                                                                     Developmental Biology Neuroscience

Figure 6 continued
express Olfr genes. Left, all known Olfr genes. Right, the 78 Olfr genes significantly downregulated in Upf3b-null mice, based on RNAseq analysis
(Figure 1C). *, p
Research article                                                                             Developmental Biology Neuroscience

                                    selection of these 78 Olfr genes to be the dominant Olfr gene expressed in individual mOSNs, a
                                    model we elaborate on in the Discussion.

                                    Discussion
                                    NMD factors have been shown to have numerous roles in the development and function of neurons
                                    (Jaffrey and Wilkinson, 2018). As described in the Introduction, the NMD factor examined in our
                                    study – UPF3B – has been shown to be necessary for normal cognition in humans and its loss is asso-
                                    ciated with several neuro-developmental disorders (Nguyen et al., 2014; Tarpey et al., 2007).
                                    While the precise roles of UPF3B in behaviors is not known, it has been shown that UPF3B is critical
                                    for both neural differentiation and mature neuronal functions (Alrahbeni et al., 2015; Huang et al.,
                                    2018; Jolly et al., 2013). In addition to UPF3B, other NMD genes are likely to have roles in the ner-
                                    vous system (Jaffrey and Wilkinson, 2018). For example, copy-number gain and loss of several
                                    genes encoding proteins involved in NMD—including UPF2, UPF3A, SMG6, RBM8A, EIF4A3, and
                                    RNPS1—are statistically significantly associated with neural-developmental disorders in humans
                                    (Nguyen et al., 2013). Mutations in RBM8A have been shown to cause TAR syndrome, which can
                                    cause cognitive dysfunction (Jaffrey and Wilkinson, 2018). In mice, loss of a single copy of Rbm8a
                                    or other EJC genes (Magoh or Eif4e) causes microcephaly and severe neural defects (Mao et al.,
                                    2017). In worms, flies and mice, genetic perturbation of other NMD genes causes neural defects,
                                    including synaptic and axon guidance defects (Colak et al., 2013; Giorgi et al., 2007; Long et al.,
                                    2010; Zheng et al., 2012). Two recent studies revealed that conditional loss of the NMD gene,
                                    Upf2, in specific neural populations in mice causes a variety of intriguing defects, including aberrant
                                    behavior, spine density, and synaptic plasticity (Johnson et al., 2019; Notaras et al., 2019).
                                    Together, these studies make a strong case that NMD has roles in the CNS.
                                       Here, we report the first investigation of the role of NMD in the olfactory system. One of our
                                    major findings was that Upf3b loss causes shifts in gene expression in OSNs. One major class of
                                    genes impacted by Upf3b is the Olfr genes. These genes have evolved to allow recognition of the
                                    large array of odors encountered by higher organisms. In mice, there are >1000 Olfr genes, each of
                                    which encode a G-coupled receptor that binds to a restricted set of odorants (Godfrey et al., 2004;
                                    Zhang and Firestein, 2002). In order to interpret the information from a given odor, it is critical that
                                    only a single OLFR be expressed in each mOSN. This is accomplished by a novel gene regulatory
                                    mechanism that selects only a single Olfr gene to be expressed in any given mOSN (Chess et al.,
                                    1994; Malnic et al., 1999; Serizawa et al., 2003). While the underlying mechanism for this
                                    ‘one-neuron-one-receptor’ rule is not fully understood, a prevailing model is that a stochastic mecha-
                                    nism drives a single Olfr to become dominate transcriptionally, a decision that is reinforced by feed-
                                    back mechanisms (Dalton et al., 2013; Lewcock and Reed, 2004; Serizawa et al., 2004;
                                    Serizawa et al., 2005).
                                       The first indication that UPF3B might have a role in the selection of Olfr genes came from our
                                    RNA-seq analysis, which revealed that the majority of genes expressed at lower level in Upf3b-null
                                    mOSNs are Olfr genes. In total, we found that 78 Olfr genes are statistically downregulated in
                                    Upf3b-null mOSN. To address mechanism, we performed scRNA-seq analysis and found that these
                                    78 Olfr genes are rarely represented as the dominant genes in individual mOSNs in Upf3b-null mice.
                                    This defect was also present at the iOSN stage, suggesting that Upf3b is involved directly or indi-
                                    rectly in determining which Olfr gene are selected for dominant expression during OSN
                                    development.
                                       A caveat is the OE contains zones enriched for mOSNs expressing particular sets of OLFRs
                                    (Miyamichi et al., 2005; Ressler et al., 1994), and thus even though we made an effort to dissect
                                    the entire OE for RNA-seq analysis, it is possible that there is zonal heterogeneity in the samples we
                                    analyzed. To reduce this potential bias, we pooled dissociated OE cells from 3 mice for FACS sort-
                                    ing. Confidence that the 78 Olfr genes are regulated by Upf3b comes from the reproducibility of the
                                    regulation in independent samples (Figure 1C) and validation by qPCR (Figure 1—figure supple-
                                    ment 2B). Furthermore, our single-cell RNA-seq analysis (which analyzed samples different from
                                    those analyzed by RNA-seq) verified the regulation of these 78 Olfr genes (Figure 6H).
                                       How might Upf3b influence the selection of this particular set of Olfr genes? Given that UPF3B is
                                    a NMD factor, it could promote the decay of an mRNA encoding a repressor that acts to regulate
                                    the selection of these 78 Olfr genes for dominant expression. To test this model, we screened genes

Tan et al. eLife 2020;9:e57525. DOI: https://doi.org/10.7554/eLife.57525                                                            15 of 29
Research article Developmental Biology Neuroscience
exhibiting significantly upregulated expression in Upf3b-null OSNs for those that encode factors
known to regulate Olfr gene expression or have binding sites in Olfr promoters (Clowney et al.,
2011; Dalton et al., 2013; Hirota and Mombaerts, 2004; Markenscoff-Papadimitriou et al., 2014;
McIntyre et al., 2008; Michaloski et al., 2006; Wang et al., 1997). This screen identified two
genes—Mafg and Irf8—that fulfilled this criteria. Both encode transcriptional repressors
(Igarashi et al., 1994; Salem et al., 2014) that bind O/E consensus sites found in Olfr gene pro-
moters (Michaloski et al., 2006). Thus, Mafg and Irf8 are candidates to act directly downstream of
NMD in a regulatory circuit that suppresses the transcription of these 78 Olfr genes. Mafg is a mem-
ber of the Maf subfamily of basic leucine-zipper transcription factor genes that encode small proteins
containing a B-ZAP DNA-binding domain, but lack a transactivation domain, and thus members of
this family dimerize to form transcriptional repressors (Igarashi et al., 1994). MAFG is best known
for its ability to regulate globin transcription in erythroid cells; our results raise the possibility that
MAFG also functions in OSNs to regulates Olfr genes. IRF8 regulates the development hematopoi-
etic cells; its expression in OSNs raises the possibility that this transcription factor also functions in
OSNs.
Our findings support a model in which IRF8 and MAFG normally subtly repress the transcription
of a subset of Olfr genes in OSNs to fine-tune their expression. Our evidence suggests that IRF8 and
MAFG are encoded by NMD target mRNAs, so when NMD is disrupted, these transcriptional
repressors are overexpressed, leading to reduced expression of their Olfr gene targets in develop-
ing OSNs. Thus, NMD deficiency would be expected to reduce the probability that these particular
Olfr genes will be chosen to be the ‘dominant Olfr gene’ in individual mOSNs, which is precisely
what we observed in Upf3b-null mice.
A non-mutually exclusive possibility is that Upf3b dictates the selection of Olfr genes by influenc-
ing OSN development. In support, several of the genes we found were regulated by Upf3b have
been reported to play essential roles in neurogenesis, including Lrp2, Hk2, Notch2, Gdf11, Fos,
Ptch1, Spry2, and Cwc22. Upf3b could also indirectly influence the Olfr repertoire by differentially
affecting the survival of OSNs harboring different OLFRs. In support, we found that Upf3b loss upre-
gulates Fos, which is associated with OSN apoptosis (Michel et al., 1994).
The other major class of genes regulated by Upf3b in OSNs is antimicrobial genes. This finding,
coupled with our finding that OSNs constitutively express these anti-microbial genes (albeit at low
levels), suggests that OSNs function not only in olfaction but also in defense against microbes in the
bronchial airways. In support, a recent study showed that inflammation causes OSNs to switch from
a role in olfaction to immune defense (Chen et al., 2019). This raises the interesting possibility that
loss of Upf3b triggers OE inflammation, which, in turn, diverts OSNs from functioning in olfaction to
immune defense, thereby causing deficient olfaction. In support, another recent study reported that
NMD disruption causes neuro-inflammation in the central nervous system (Johnson et al., 2019). In
particular, this study found that Upf2 conditional knockout in the murine forebrain leads to immune
infiltration, coupled with deficits in memory, synaptic plasticity, social, and vocal communication
(Johnson et al., 2019). Importantly, they found that anti-inflammatory agents partially rescued many
of these deficits, indicating that the inflammation is at least partially responsible for the neural
defects in these Upf2-conditional knockout mice. It will be intriguing to determine whether humans
with UPF3B mutations also suffer from neuro-inflammation and whether this is responsible for their
intellectual disability.
Our finding that loss of UPF3B upregulates a very large number of immune-related genes in
OSNs, over half of which encode mRNAs that have NIFs and thus may be direct NMD targets
(Supplementary file 5), raises the possibility that this ‘immune induction’ response to NMD inhibi-
tion is physiologically important. In this regard, it is notable that some viruses have been shown to
inhibit NMD, and, in turn, NMD can inhibit viral infection (Wachter and Hartmann, 2014;
Wada et al., 2018). Coupled with our data, these findings raise the intriguing possibility that the
reason that OSNs express high levels of antimicrobial genes in response to NMD inhibition is
because this provides a means to cope with infectious agents, particularly those that inhibit NMD as
a means to avoid the antiviral actions of NMD.
In addition to NMD inhibition directly upregulating mRNAs encoding immune factors in OSNs,
we identified candidate intermediary factors that may act in a circuit to achieve the same aim. In par-
ticular, we identified three mRNAs—Notch2, Bhlhe40, and Rac2—which are high-confidence NMD
targets in mOSNs (Table 1) that encode factors previously shown to regulate the expression of
Tan et al. eLife 2020;9:e57525. DOI: https://doi.org/10.7554/eLife.57525 16 of 29Research article Developmental Biology Neuroscience
many genes encoding inflammatory mediators and antimicrobial proteins (Dooley et al., 2009;
Jarjour et al., 2019; Shang et al., 2016).
Our scRNA-seq analysis indicated that Upf3b impacts the steady-state frequency of specific OSN
precursor and OSN cell subsets. We found that Upf3b-null mice have decreased numbers of HBCs,
suggesting that UPF3B promotes the maintenance of these reserve stem cells. This effect appeared
to be specific, as we observed no significant effects on GBCs, which also serve as olfactory stem
cells, but unlike HBCs, function to generate new mOSNs constitutively (Schwob et al., 2017). We
also observed that Upf3b-null mice acquired a specific group of mOSNs harboring a unique tran-
scriptome that are hardly present in WT mice. This mOSN-4 sub-cluster is enriched for many genes,
such as Tuba1a, Nsg1, Chchd10, Eml2, Ubb, and Gldc, which suggests that Upf3b normally
represses these genes. It remains to be determined whether the aberrant over-expression of these
genes causes aberrant mOSN function. We also found that Upf3b-null mice largely lack a mOSN
sub-cluster—mOSN-2—that we found contained large numbers of cells in most WT mice. The
mOSN-2 sub-cluster is likely to be functional, as genes enriched in this sub-cluster include Pten,
App, Cnga2, Nrp2, Ncam1, Adcy3, Gnal, Atf5, and Gfy (Supplementary file 4), all of which are
known to be essential for olfactory epithelium development and/or olfaction. This reciprocal shift in
these two mOSN sub-clusters in Upf3b-null mice raises the possibility that UPF3B loss converts the
mOSN-2 sub-cluster into the mOSN-4 sub-cluster. This remains to be determined, as does the physi-
ological consequences of these shifts in mOSN sub-populations. Another important area for future
investigation is to determine whether these cell-subset alterations in Upf3b-null mice are cell autono-
mous or non-cell autonomous.
As described in the Introduction, few direct NMD target RNAs have previously been defined in
vivo. Our study fills this gap by identifying high-confidence NMD target mRNAs in mOSNs in vivo.
Many of the NMD targets we identified in mOSNs have long 3’UTRs, raising the possibility that
mOSNs have a predilection for degrading mRNAs with this particular NIF. By analogy, evidence sug-
gests that mRNAs harboring long 3’UTRs are also preferentially targeted for destruction by NMD in
male germ cells (Bao et al., 2016). Several of the NMD target mRNAs that we identified in mOSNs
are good candidates to have roles in OSN development. For example, Gdf11 functions in negative-
feedback control of OE neurogenesis; Lrp2 promotes the proliferation of neural precursor cells in
the subependymal zone of the olfactory bulb; and Notch2 is required for maintaining sustentacular
cell function in the OE (Gajera et al., 2010; Kawauchi et al., 2009; Rodriguez et al., 2008). Other
NMD target mRNAs that we identified, including Ptch1 and Hk2, encode proteins known to be
important for the development of neurons outside of the olfactory system (Iulianella and Stanton-
Turcotte, 2019; Zheng et al., 2016).
Our study provides a useful resource for the olfactory field. For example, our scRNA-seq analysis
identified putative new OSN precursor and OSN cell subsets. While we do not know the significance
of this heterogeneity, the genes differentially expressed by the sub-clusters we identified suggests
functional relevance. For example, the genes differentially expressed by the 4 cell-sub clusters we
identified for both GBCs and iOSNs suggested that these sub-clusters represent distinct develop-
mental stages. Our results are consistent with Fletcher et al., who demonstrated that that the 1 GBC
and 4 INP/iOSN sub-clusters they identified follow a linear developmental pattern (Fletcher et al.,
2017). Our genome-wide determination of mOSN mRNA expression levels and ribosome occupancy
(i.e. translation rates) will be useful for future studies to determine how transcription, translation, and
other post-transcriptional processes coordinate to regulate the expression of large sets of genes in
mature neurons in vivo. We divided mOSN-expressed mRNAs into nine categories based on steady-
state mRNA level and ribosome occupancy, allowing dissection of common functions encoded by
similarly regulated mRNAs. Given that translation is a highly energy-consuming process (Lynch and
Marinov, 2015), it is likely that there has been strong selection pressure for many mRNAs to be
translated inefficiently. Indeed, we found that modestly translated mRNAs encode many key mOSN
proteins, including receptors, signaling factors, and developmental regulators.
In conclusion, our study provides an invaluable set of resources for the olfactory field and identi-
fies a post-transcriptional regulatory pathway that impacts OSNs.
Tan et al. eLife 2020;9:e57525. DOI: https://doi.org/10.7554/eLife.57525 17 of 29Research article Developmental Biology Neuroscience
Materials and methods
Key resources table
Reagent type Additional
(species) or resource Designation Source or reference Identifiers information
Gene Upf3b GenBank Gene ID: 68134
(Mus musculus)
Genetic reagent C57BL/6J Jackson Laboratory Stock #: 000664
(Mus. musculus) RRID:MGI:3028467
Genetic reagent Upf3b-null mice PMID:21925383 RRID:MGI:6110148 Miles Wilkinson lab
(Mus. musculus)
Genetic reagent R26-eYFP mice PMID:11299042 Obtained from
(Mus. musculus) Dr. Maike Sander
(UCSD)
Genetic reagent Omp-Cre mice PMID:22057188 Obtained from
(Mus. musculus) Dr. Haiqing Zhao
(Johns Hopkins
University)
Genetic reagent RiboTag mice PMID:19666516 Obtained from
(Mus. musculus) Dr. Paul Ameiux
(University of
Washington)
Antibody Rabbit monoclonal Abcam Cat# ab183947 IF (1:400),
anti-OMP (EPR19190) RRID:AB_2858281 WB (1:2000)
Antibody Goat polyclonal FUJIFILM Wako Cat# 544–10001-WAKO IF (1:200)
anti-OMP Chemicals RRID:AB_2315007
Antibody Rabbit polyclonal Generated by PMID:11442754 IF (1:200)
anti-CAMP Richard L. Gallo
laboratory
Antibody Rabbit polyclonal Proteintech Cat#: 18660–1-AP IF (1:200)
anti-FUT10 RRID:AB_10641997
Antibody Donkey anti-Goat IgG Thermo Fisher Cat#: A-11055 IF (1:1000)
(H+L) Cross-Adsorbed Scientific RRID:AB_2534102
Secondary Antibody,
Alexa Fluor 488
Antibody Donkey anti-Rabbit IgG Thermo Fisher Cat#: A-31572 IF (1:1000)
(H+L) Highly Cross- Scientific RRID:AB_162543
Adsorbed Secondary
Antibody, Alexa Fluor 555
Sequence- Fosl2_F This paper PCR primers CCGCAGAAGGAGAGATGAG
based reagent (from IDT)
Sequenced- Fosl2_R This paper PCR primers GCAGCTTCTCTGTCAGCTC
based reagent (from IDT)
Sequence- Ptger2_F This paper PCR primers TGCTCCTTGCCTTTCACAATC
based reagent (from IDT)
Sequenced- Ptger2_R This paper PCR primers CCTAAGTATGGCAAAGACCCAAG
based reagent (from IDT)
Sequence- Adcy6_F This paper PCR primers TTCCTGACCGTGCCTTCTC
based reagent (from IDT)
Sequenced- Adcy6_R This paper PCR primers CACCCCGGTTGTCTTTGC
based reagent (from IDT)
Sequence- Ptch1_F This paper PCR primers ACCTCCTAGGTAAGCCTCC
based reagent (from IDT)
Sequenced- Ptch1_R This paper PCR primers CACCCACAATCAACTCCTCC
based reagent (from IDT)
Sequence- Cwc22_F This paper PCR primers CAGAAGACAGATACACAGAGCAAG
based reagent (from IDT)
Continued on next page
Tan et al. eLife 2020;9:e57525. DOI: https://doi.org/10.7554/eLife.57525 18 of 29Research article Developmental Biology Neuroscience
Continued
Reagent type Additional
(species) or resource Designation Source or reference Identifiers information
Sequenced- Cwc22_R This paper PCR primers CTCTCTCTCTCTCTCTGCGTTT
based reagent (from IDT)
Sequence- Fut10_F This paper PCR primers CCAGGGCCTTCCTATTCTACG
based reagent (from IDT)
Sequenced- Fut10_R This paper PCR primers CTGAATGTGGCCGTATGGTTG
based reagent (from IDT)
Sequence- Gdpd3_F This paper PCR primers TGATCCGACACTTGCAGGAC
based reagent (from IDT)
Sequenced- Gdpd3_R This paper PCR primers GCTGTGGGGTAATCGGTCAT
based reagent (from IDT)
Sequence- Olfr827_F This paper PCR primers TGGGATGGTTCTTCTGGGAA
based reagent (from IDT)
Sequenced- Olfr827_R This paper PCR primers ACCGTGGAGTAGGAGAGGTC
based reagent (from IDT)
Sequence- Rpl19_F This paper PCR primers CCTGAAGGTCAAAGGGAATGTG
based reagent (from IDT)
Sequenced- Rpl19_R This paper PCR primers CTTTCGTGCTTCCTTGGTCTT
based reagent (from IDT)
Commercial Chromium Single 10X Genomics Cat# 120237
assay or kit Cell 3’ Library and
Gel Bead Kit
Commercial iScript cDNA BioRad Cat# 170–8891
assay or kit synthesis Kit
Commercial SsoAdvanceD BioRad Cat# 172–5274
assay or kit Universal SYBR
Green Supermix
Commercial RNeasy Mini Kit Qiagen Cat# 74104
assay or kit
Software, algorithm Cell Ranger 10x genomics Cell Ranger
Version 2.1.1 Version 2.1.1
Software, algorithm Seurat (v3.1.5) Designed by Rahul PMID:31178118
Satija laboratory
Software, algorithm Monocle (v2.16.0) Designed by Cole PMID:28114287
Trapnell laboratory
Software, algorithm NIH ImageJ NIH Version 1.8.0
(v1.8.0)
Mice
This study was carried out in strict accordance with the Guidelines of the Institutional Animal Care
and Use Committee (IACUC) at the University of California, San Diego. The protocol was approved
by the IACUC at the University of California, San Diego (permit number: S09160). All studies were
conducted on adult male mice housed under a 12 hr light:12 hr dark cycle and provided with food
and water ad libitum. Of note, we only performed analyses on male mice. Since Upf3b is X-linked
gene, we analyzed Upf3b+/y (WT) and Upf3-/y (KO) mice. All mouse strains used for analysis were
backcrossed to C57BL/6J for at least eight passages.
Behavioral and weight analyses
To assess the effect of UPF3B loss on mouse weight, 19male pups (nine Upf3b-null and ten WT
mice) from Upf3b+/- WT breeders (6 litters) were assessed, performed as described previously
(Tan et al., 2016). For pre-weaning pups, to reduce stress, forceps and gloves were changed fre-
quently between cages.
For the coyote/bobcat urine experiment, 10 male mice (10- to 16 weeks of age) from each geno-
type were analyzed. Each mouse was placed into a cage for 10 min to acclimatize, a strip of filter
Tan et al. eLife 2020;9:e57525. DOI: https://doi.org/10.7554/eLife.57525 19 of 29Research article Developmental Biology Neuroscience
paper soaked with coyote urine (Snow Joe) or bobcat urine (Predator Pee) was placed into the cage
for 5 min, and the amount of time the mouse was in the vicinity of the filter paper was determined
by video recording. Each mouse was tested separately in the absence of humans or other mice in
the room.
RNA-seq analysis
For each mOSN sample analyzed, 3 C57BL/6J male mice (8- to 9-weeks old) were pooled. Four repli-
cate samples were analyzed per genotype (Upf3b+/y; Omp-Cre; R26-eYFP and Upf3b-/y; Omp-Cre;
R26-eYFP). Cell sorting experiments were performed on two separate days, with two samples sorted
per day. The OE was dissected as described (Gong, 2012) and dissociated using the Papain Dissoci-
ation System (Worthington) at 37˚C for 15 min, followed by extensive trituration. Cells were filtered
using a 40-mm strainer (Falcon). After spinning at 200 g for 5 min, cells were resuspended in Hanks’
balanced salt solution (HBSS) containing 3% FBS (Gibco) but without Ca2+ and Mg2+. The
cell suspension was mixed with propidium iodide (final concentration of 1 mg/ml) and the OMP-
eYFP+ cells were sorted by flow-cytometry. RNA was isolated from the OMP-eYFP+ cells using Tri-
ZOL (Life Technologies), followed by a secondary purification step using a RNeasy column (Qiagen).
Total RNA was assessed for quality using an Agilent Bioanalyzer, and samples determined to have
an RNA Integrity Number (RIN) of at least 8 or greater were used to generate RNA libraries using
Illumina’s TruSeq RNA Sample Prep Kit, following the manufacturer’s specifications, with the RNA
fragmentation time adjusted to 5 min. RNA-seq was performed at the Institute of Genomic Medicine
at UCSD. RNA libraries were multiplexed and sequenced with 100 base pair (bp) pair end reads on
an Illumina HiSeq4000. The average number of reads per sample ranged from approximately 15 to
22 million reads. Reads were filtered for quality and aligned with STAR (2.5.2b) against Mus muscu-
lus release-90, Ensembl genome (GRCm38). The exon counts were aggregated for each gene to
build a read count table using SubRead function featureCounts (Liao et al., 2014). Using the exon
start/end positions, we extracted the exon sequences from the mm10 mouse genome, and ligated
them together in silico for each transcript. For each entry, the entire transcript sequence was sub-
tracted from the known CDS sequence (obtained as above) to identify 3’UTR length. DEGs were
defined using DESeq2 (Love et al., 2014) using a threshold q-val ofResearch article Developmental Biology Neuroscience
manufacturer’s instructions. Single cells were resuspended in 0.04% BSA in PBS (w/v) and loaded on
the 10x Chromium chip. Cell capturing, and library preparation was carried as per kit instructions
(Chromium Single Cell Kit [v2 chemistry]). The resultant libraries were size selected, pooled, and
sequenced using 2 100 paired-end sequencing protocol on an Illumina HiSeq 4000 instrument.
The libraries initially underwent shallow sequencing to access quality and to adjust subsequent
sequencing depth based on the capture rate and unique molecular indices (UMI) detected. All
sequencing analyses were performed at the Institute of Genomic Medicine at UCSD.
As described previously (Sohni et al., 2019; Tan et al., 2020b; Tan et al., 2020a), de-multiplexed
raw sequencing reads were processed and mapped to the mouse genome (mm10) using Cell Ranger
software (v2.0) with default parameters. We filtered raw count matrices by excluding cells expressing
less than 200 detectably expressed genes and genes expressed in less than 3 cells. Each library was
tagged with a library batch ID and combined across independent experiments using the Seurat
package (Butler et al., 2018) in R. To check the quality of the single-cell data and to remove multip-
lets, we performed Seurat-based filtering of cells based on three criteria: number of detected fea-
tures (nFeature_RNA) per cell, number of UMIs expressed per cell (nCount_RNA) and mitochondrial
content, using the following threshold parameters: nFeature_RNA (>500), nCount_RNA (>1,500),
and percentage of mitochondrial genes expressed (= 0.01; dispersion_empiri-
cal >= 1). The discriminative dimensionality reduction with trees (DDRTree) method was used to
reduce data to two dimensions. Differentially expressed genes were identified and used for dynamic
trajectory analysis (NO discovery rate [FDR]You can also read