ACCELERATING WITH FLYBRAINLAB THE DISCOVERY OF THE FUNCTIONAL LOGIC OF THE DROSOPHILA BRAIN IN THE CONNECTOMIC AND SYNAPTOMIC ERA - ELIFE
←
→
Page content transcription
If your browser does not render page correctly, please read the page content below
TOOLS AND RESOURCES

                                    Accelerating with FlyBrainLab the
                                    discovery of the functional logic of the
                                    Drosophila brain in the connectomic and
                                    synaptomic era
                                    Aurel A Lazar†*, Tingkai Liu†, Mehmet Kerem Turkcan†, Yiyin Zhou†

                                    Department of Electrical Engineering, Columbia University, New York, United
                                    States

                                    Abstract In recent years, a wealth of Drosophila neuroscience data have become available
                                    including cell type and connectome/synaptome datasets for both the larva and adult fly. To
                                    facilitate integration across data modalities and to accelerate the understanding of the functional
                                    logic of the fruit fly brain, we have developed FlyBrainLab, a unique open-source computing
                                    platform that integrates 3D exploration and visualization of diverse datasets with interactive
                                    exploration of the functional logic of modeled executable brain circuits. FlyBrainLab’s User
                                    Interface, Utilities Libraries and Circuit Libraries bring together neuroanatomical, neurogenetic and
                                    electrophysiological datasets with computational models of different researchers for validation and
                                    comparison within the same platform. Seeking to transcend the limitations of the connectome/
                                    synaptome, FlyBrainLab also provides libraries for molecular transduction arising in sensory coding
                                    in vision/olfaction. Together with sensory neuron activity data, these libraries serve as entry points
                                    for the exploration, analysis, comparison, and evaluation of circuit functions of the fruit fly brain.

*For correspondence:
aurel@ee.columbia.edu
†
 The authors’ names are listed in
                                    Introduction
alphabetical order.                 The era of connectomics/synaptomics ushered in the advent of large-scale availability of highly com-
                                    plex fruit fly brain data (Chiang et al., 2011; Berck et al., 2016; Takemura et al., 2017a;
Competing interests: The
                                    Scheffer et al., 2020), while simultaneously highlighting the dearth of computational tools with the
authors declare that no
                                    speed and scale that can be effectively deployed to uncover the functional logic of fly brain circuits.
competing interests exist.
                                    In the early 2000’s, automation tools introduced in computational genomics significantly accelerated
Funding: See page 25                the pace of gene discovery from the large amounts of genomic data. Likewise, there is a need to
Received: 22 August 2020            develop tightly integrated computing tools that automate the process of 3D exploration and visuali-
Accepted: 21 February 2021          zation of fruit fly brain data with the interactive exploration of executable circuits. The fruit fly brain
Published: 22 February 2021         data considered here includes neuroanatomy, genetics, and neurophysiology datasets. Due to space
                                    limitations, we mostly focus here on exploring, analyzing, comparing, and evaluating executable cir-
Reviewing editor: Upinder
Singh Bhalla, Tata Institute of
                                    cuits informed by wiring diagrams derived from neuroanatomy datasets currently available in public
Fundamental Research, India         domain.
                                        To meet this challenge, we have built an open-source interactive computing platform called Fly-
   Copyright Lazar et al. This
                                    BrainLab. FlyBrainLab is uniquely positioned to accelerate the discovery of the functional logic of the
article is distributed under the
                                    Drosophila brain. It is designed with three main capabilities in mind: (1) 3D exploration and visualiza-
terms of the Creative Commons
Attribution License, which          tion of fruit fly brain data, (2) creation of executable circuits directly from the explored and visualized
permits unrestricted use and        fly brain data in step (1), and (3) interactive exploration of the functional logic of the executable cir-
redistribution provided that the    cuits devised in step (2) (see Figure 1).
original author and source are          To achieve tight integration of the three main capabilities sketched in Figure 1 into a single work-
credited.                           ing environment, FlyBrainLab integrates fly brain data in the NeuroArch Database (Givon et al.,

Lazar et al. eLife 2021;10:e62362. DOI: https://doi.org/10.7554/eLife.62362                                                             1 of 49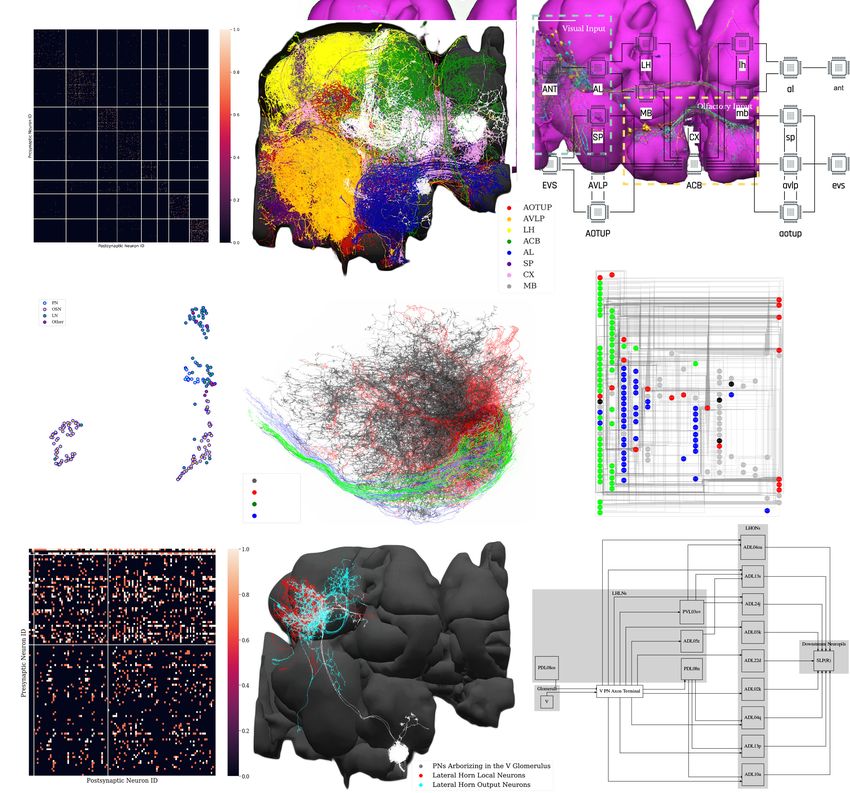
Tools and resources Neuroscience
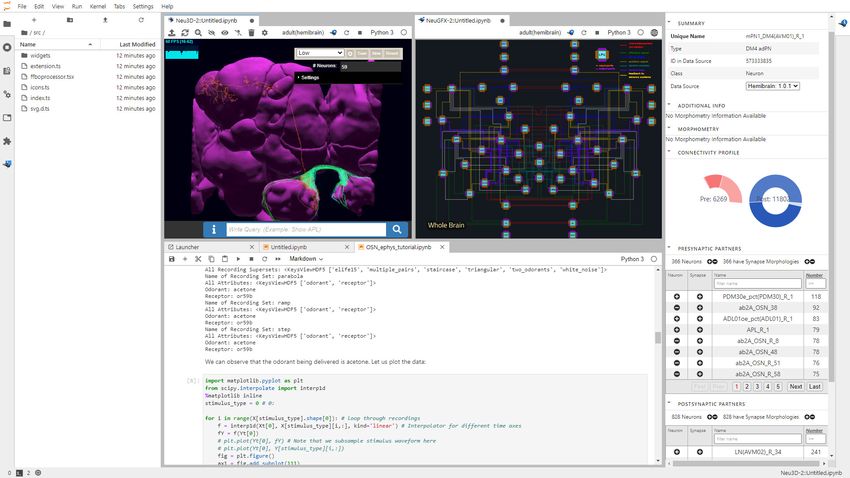
Figure 1. FlyBrainLab provides, within a single working environment, (left) 3D exploration and visualization of fruit fly brain data, and (right) creation of
executable circuit diagrams from the explored and visualized circuit on the left followed by an interactive exploration of the functional logic of
executable circuits.
2015) and provides circuit execution with the Neurokernel Execution Engine (Givon and Lazar,
2016) (see Figure 2a). The NeuroArch Database stores neuroanatomy datasets provided by
for example, FlyCircuit (Chiang et al., 2011), Larva L1EM (Ohyama et al., 2015), the Medulla 7 Col-
umn (Takemura et al., 2017a) and Hemibrain (Scheffer et al., 2020), genetics datasets published
by for example, FlightLight (Jenett et al., 2012) and FlyCircuit (Chiang et al., 2011), and neurophys-
iology datasets including the DoOR (Münch and Galizia, 2016) and our own in vivo recordings
(Lazar and Yeh, 2020; Kim et al., 2011; Kim et al., 2015). The Neurokernel Execution Engine (see
Figure 2a) supports the execution of fruit fly brain circuits on GPUs. Finally, the NeuroMynerva
front-end exhibits an integrated 3D graphics user interface (GUI) and provides the user a unified
view of data integration and computation (see Figure 2a (top) and Figure 2b). The FlyBrainLab soft-
ware architecture is depicted in the Appendix 1—figure 1.
To accelerate the generation of executable circuits from fruit fly brain data, NeuroMynerva sup-
ports the following workflow.
First, the 3D GUI, called the NeuroNLP window (see Figure 2b, top middle-left), supports the
visual exploration of fly brain data, including neuron morphology, synaptome, and connectome from
all available data sources, stored in the NeuroArch Database (Givon et al., 2015). With plain English
queries (see Figure 2b, top middle-left), a layperson can perform sophisticated database queries
with only knowledge of fly brain neuroanatomy (Ukani et al., 2019).
Second, the circuit diagram GUI, called the NeuroGFX window (see Figure 2b, top middle-right)
enables the interactive exploration of executable circuits stored in the NeuroArch Database. By
retrieving tightly integrated biological data and executable circuit models from the NeuroArch Data-
base, NeuroMynerva supports the interaction and interoperability between the biological circuit (or
pathway for short) built for morphological visualization and the executable circuit created and repre-
sented as an interactive circuit diagram, and allows them to build on each other. This helps circuit
developers to more readily identify the modeling assumptions and the relationship between neuro-
anatomy, neurocircuitry, and neurocomputation.
Third, the GUIs can operate in tandem with command execution in Jupyter notebooks (see also
Figure 2b, bottom center). Consequently, fly brain pathways and circuit diagrams can be equiva-
lently processed using API calls from Python, thereby ensuring the reproducibility of the exploration
of similar datasets with minimal modifications. The Neurokernel Execution Engine (Givon and Lazar,
Lazar et al. eLife 2021;10:e62362. DOI: https://doi.org/10.7554/eLife.62362 2 of 49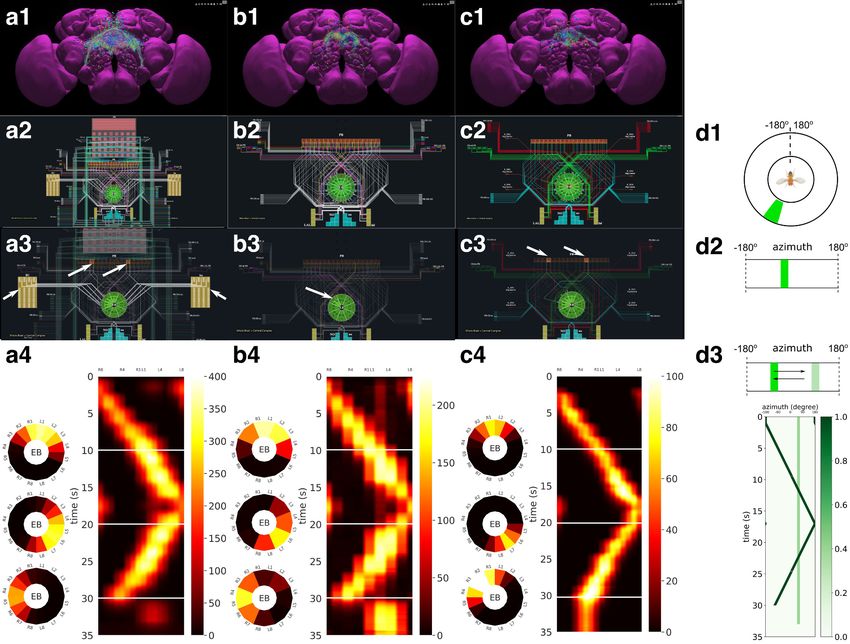
Tools and resources                                                                                                              Neuroscience

   (b)                                                NeuroMynerva User Interface

                                                                      NeuroMynerva

   (a)
                                                                     NeuroMynerva
                                                 Morphology                               Circuit
                                                 Visualization                         Visualization

                                                                    Program Execution

                         User
                        Server

                                              Connectomics
                                                                                            Execution of
                                           FlyCircuit, Hemibrain,                         Fly Brain Circuits
                                       Larva L1EM, Medulla 7 Column

                                                 Genetics                               Circuit Execution with
                                             FlyLight, FlyCircuit                           GPU-support

                                             Neurophysiology
                                      DoOR, in vivo Antenna Recordings

                                                                                        Neurokernel
                                         NeuroArch Database                           Execution Engine
                                           NeuroArch Server                          Neurokernel Server

Figure 2. The software architecture and the user interface of FlyBrainLab. (a) The main components of the architecture of FlyBrainLab: (top)
NeuroMynerva user-side frontend, (bottom left) NeuroArch Database for storage of fruit fly brain data and executable circuits, (bottom right)
Neurokernel Execution Engine for execution of fruit fly brain circuits on GPUs (see also Appendix 1—figure 1 for a schematic diagram of the
FlyBrainLab software architecture). (b) NeuroMynerva User Interface. The UI typically consists five blocks, including a (1) NeuroNLP 3D Visualization
Figure 2 continued on next page

Lazar et al. eLife 2021;10:e62362. DOI: https://doi.org/10.7554/eLife.62362                                                                        3 of 49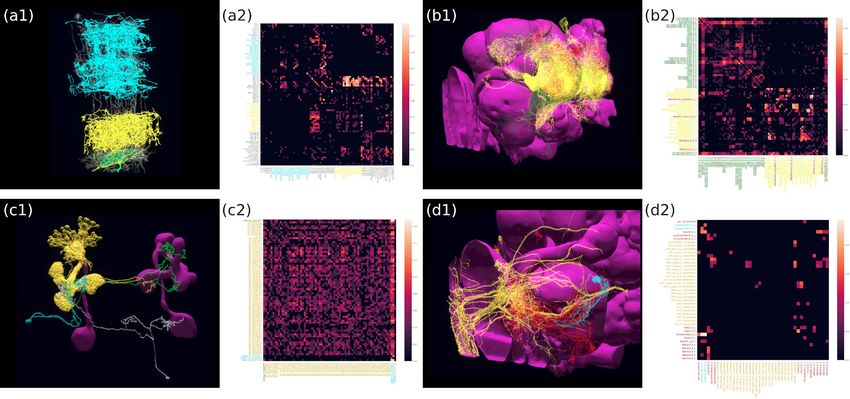
Tools and resources                                                                                                                Neuroscience

Figure 2 continued
Window with a search bar for NLP queries, providing capabilities for displaying and interacting with fly brain data such as the morphology of neurons
and position of synapses. (2) NeuroGFX Executable Circuits Window, for exploring executable neural circuits with interactive circuit diagrams. (3)
Program Execution Window with a built-in Jupyter notebook, executing any Python code including calls to the FlyBrainLab Client (see also Appendix
1.2), for direct access to database queries, visualization, and circuit execution, (4) Info Panel displaying details of highlighted neurons including the
origin of data, genetic information, morphometric statistics and synaptic partners, etc. (5) Local File Access Panel with a built-in Jupyter file browser for
accessing local files.

                                      2016) provides circuit execution on multiple computing nodes/GPUs. The tight integration in the
                                      database also allows the execution engine to fetch executable circuits directly from the NeuroArch
                                      Database. The tight integration between NeuroArch and Neurokernel is reinforced and made user
                                      transparent by NeuroMynerva.
                                         Exploration, analysis, execution, comparison, and evaluation of circuit models, either among ver-
                                      sions developed by one’s own, or among those published in literature, are often critical steps toward
                                      discovering the functional logic of brain circuits. Six types of explorations, analyses, comparisons,
                                      and evaluations are of particular interest. First, build and explore the structure of fly brain circuits
                                      with English queries (Use Case 1). Second, explore the structure and function of yet to be discovered
                                      brain circuits (Use Case 2). Third, interactively explore executable circuit models (Use Case 3).
                                      Fourth, starting from a given dataset and after implementing a number of circuit models published
                                      in the literature, analyze and compare these under the same evaluation criteria (Use Case 4). Fifth,
                                      automate the construction of executable circuit models from datasets gathered by different labs and
                                      analyze, compare, and evaluate the different circuit realizations (Use Case 5). Sixth, analyze, com-
                                      pare, and evaluate fruit fly brain circuit models at different developmental stages (Use Case 6).
                                         In what follows, we present results, supported by the FlyBrainLab Circuits Libraries (see Materials
                                      and methods), demonstrating the comprehensive exploration, execution, analysis, comparison, and
                                      evaluation capability of FlyBrainLab. While our emphasis here is on building executable circuit mod-
                                      els informed by the connectome/synaptome of the fruit fly brain, these libraries together with sen-
                                      sory neuron activity data serve as entry points for an in-depth exploration, execution, analysis,
                                      comparison, and evaluation of the functional logic of the fruit fly brain.

                                      Results
                                      Use Case 1: building fly brain circuits with english queries
                                      FlyBrainLab is equipped with a powerful and versatile user interface to build fruit fly brain circuits
                                      from connectome and synaptome datasets. The interface is designed to accommodate users with
                                      widely different expertise, such as neurobiologists, computational neuroscientists or even college or
                                      high school students. Knowledge of the nomenclature of the fruit fly brain is assumed.
                                         The simplest way to build a fly brain circuit is via the NeuroNLP natural language query interface
                                      (Ukani et al., 2019). By specifying in plain English cell types, synaptic distribution, pre- and post-syn-
                                      aptic partners, neurotransmitter types, etc, neurons and synapses can be visualized in the NeuroNLP
                                      window (see also Figure 2b).
                                         The motion detection pathway in the fruit fly Medulla has been, in part, mapped out thanks to
                                      the Medulla 7 Column dataset (Takemura et al., 2015). While much research has focussed on the
                                      direct, feedforward pathway feeding into the motion sensitive T4 neurons (Takemura et al., 2017b;
                                      Haag et al., 2017), the contribution of the feedback pathways and the neighboring columnar neu-
                                      rons to the motion detection circuit has largely been ignored. To study the circuit that mediates the
                                      lateral feedback into the motion detection pathway, we used English queries to quickly visualize the
                                      neurons involved. Starting from a T4a neuron in the ‘home’ column that is sensitive to front-to-back-
                                      motion (Maisak et al., 2013 ‘show T4a in column home’; ‘color lime’), we queried its presynaptic
                                      neurons (‘add presynaptic neurons’; ‘color gray’) as well as their presynaptic neurons that are non-
                                      columnar, in particular, the Dm and Pm cells (Fischbach and Dittrich, 1989) (‘add presynaptic $Dm$
                                      neurons with at least five synapses’; ‘color cyan’; ‘add presynaptic $Pm$ neurons with at least five
                                      synapses’; ‘color yellow’). The resulting visualization of the circuit is depicted in Figure 3 (a1), with

Lazar et al. eLife 2021;10:e62362. DOI: https://doi.org/10.7554/eLife.62362                                                                            4 of 49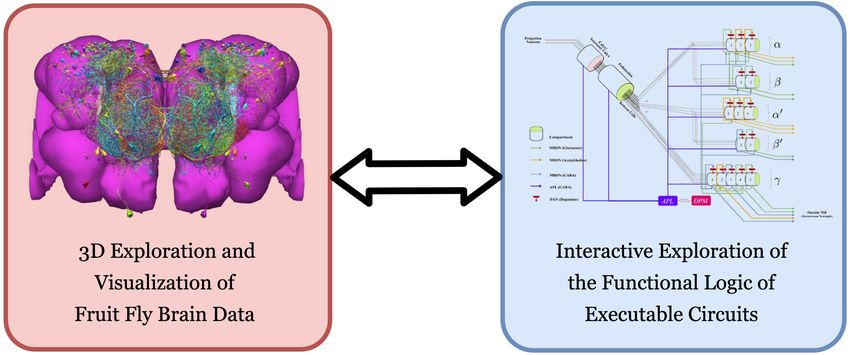
Tools and resources                                                                                                            Neuroscience

Figure 3. Building fly brain circuits with English queries. (a1) Lateral feedback pathways in the visual motion detection circuit. (green) a T4a neuron,
(gray) neurons presynaptic to the T4a neuron, (cyan) glutamatergic and GABAergic Dm neurons that are presynaptic to the neurons in gray, (yellow) Pm
neurons that are presynaptic to the neurons in gray. (a2) Connectivity matrix of the pathways in (a1). (b1) Pathways between MBONs and neurons
innervating FB layer 3. (yellow) MBONs that are presynaptic to neurons that have outputs in FB layer 3. (green) Neurons that have outputs in FB layer 3
that are postsynaptic to the MBONs in yellow. (red) MBONs postsynaptic to neurons in green. (b2) Connectivity matrix of the pathways in (b1). (c1) The
pathways of the g compartment of the larva fruit fly. (cyan) g compartment MBONs, (yellow) KCs presynaptic to the g compartment MBONs, (green) a
DAN presynaptic to the g compartment MBONs, (white) an OAN presynaptic to the g compartment MBONs, (c2) Connectivity matrix of the pathways
in (c1). (d1) Pathways between LPTCs and a potential translational motion-sensitive neuron GLN. (yellow) LPTCs, (cyan) GLNs, (red) neurons that form
the path between LPTCs to GLNs. (d2) Connectivity matrix of the pathways in (d1). color bar in a2, b2, c2, and d2: log10 ðN þ 1Þ, where N is the number
of synapses between 2 neurons. (a1)–(d1) are screenshots downloaded from the NeuroNLP Window. The sequence of queries that generates these
visualizations is listed in Materials and methods Use Case 1.

                                     neurons mediating cross-columnar interaction highlighted. The retrieved connectivity matrix is shown
                                     in Figure 3 (a2) (see also Materials and methods, Use Case 1).
                                        The mushroom body (MB) has been known to be an associative olfactory memory center
                                     (Modi et al., 2020), whereas the fan-shaped body (FB) shown to be involved in visual pattern mem-
                                     ory (Liu et al., 2006). Recently, it has been shown that the Kenyon cells in the MB also receive visual
                                     inputs (Li et al., 2020a), and that the MB and FB are interconnected (Li et al., 2020b). The pathway
                                     between the MB and the FB, or a particular layer in the FB can be easily visualized using NeuroNLP.
                                     We used English queries to establish and visualize the circuit that directly connects the MB with the
                                     layer 3 of the FB in the Hemibrain dataset, as depicted in Figure 3 (b1). The connectivity matrix is
                                     shown in Figure 3 (b2) (see also Materials and methods, Use Case 1, for the sequence of queries
                                     that created this visualization).
                                        Natural language queries supplemented by the NeuroNLP 3D interface and the Info Panel (see
                                     also Figure 2b) enable us to inspect, add and remove neurons/synapses. For example, in
                                     Figure 3 (c1), we built a simple circuit around the g compartment of the mushroom body
                                     (Saumweber et al., 2018) of the Larva L1EM dataset (Ohyama et al., 2015) starting from the
                                     MBONs that innervate it. We then inspected these MBONs in the Info Panel and added all KCs pre-
                                     synaptic to each of them by filtering the name ‘KC’ in the presynaptic partner list. Similarly, we
                                     added the dopaminergic neurons (DANs) and octopaminergic neurons (OANs) presynaptic to these
                                     MBONs. Figure 3 (c2) depicts the connectivity matrix of this MB circuit (see also Materials and
                                     methods, Use Case 1, for the full sequence of queries/operations that created this visualization).

Lazar et al. eLife 2021;10:e62362. DOI: https://doi.org/10.7554/eLife.62362                                                                      5 of 49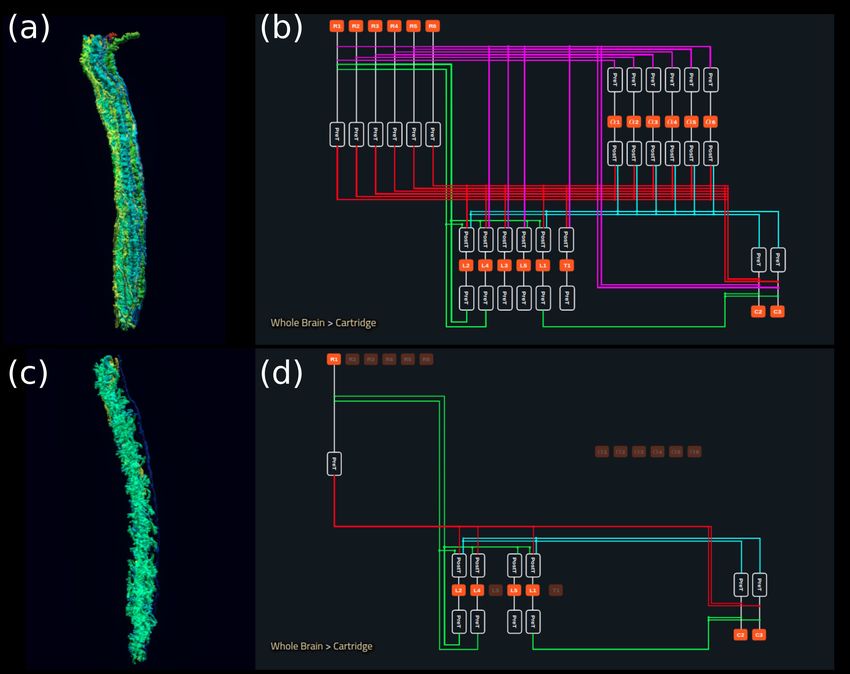
Tools and resources Neuroscience
The FlyBrainLab UI provides users a powerful yet intuitive tool for building fly brain circuits at any
scale, requiring no knowledge of programming or the data model of the underlying NeuroArch
Database. For more advanced users, FlyBrainLab also exposes the full power of NeuroArch API for
directly querying the NeuroArch database using the NeuroArch JSON format. Utilizing this capabil-
ity, we built a circuit pathway that potentially carries translational visual motion information into the
Noduli (NO) in Figure 3 (d1). The search for this circuit was motivated by a type of cells in honey
bees, called TN neurons, that are sensitive to translational visual motion and provide inputs to the
NO (Stone et al., 2017). In the Hemibrain dataset, a cell type ‘GLN’ resembles the TN neurons in
the honey bee and is potentially a homolog in the fruit fly. We therefore asked if there exists a path-
way to these neurons from visual output neurons that are sensitive to wide-field motion, in particular,
the lobula plate tangential cells (LPTCs). Using a NeuroArch query, we found all paths between
LPTCs and GLNs that are less than three hops and have at least five synapses in each hop (see also
Materials and methods), Use Case 1, for the complete listing of the invoked NeuroArch JSON query.
Only the HS cells and H2 cells, but not CH and VS cells (Hausen, 1984) have robust paths to the
GLNs. The connectivity of this circuit is shown in Figure 3(d2) (see also Materials and methods, Use
Case 1).
Use Case 2: exploring the structure and function of yet to be
discovered brain circuits
Here, we further demonstrate the capabilities of FlyBrainLab in the quest of exploring the structure
and function of yet to be discovered fly brain circuits. In particular, we demonstrate several use cases
of the Utility Libraries (see Appendix 2) and their interaction with the rest of the FlyBrainLab
components.
In the first example, we explore the structure of densely-connected brain circuits in the Hemibrain
dataset. Such an exploration is often the starting point in the quest of understanding the function of
a brain circuit without any prior knowledge of neuropil boundaries, or the identity of each neuron
(see also Materials and methods, Use Case 2). By invoking the NeuroGraph Library on the Hemibrain
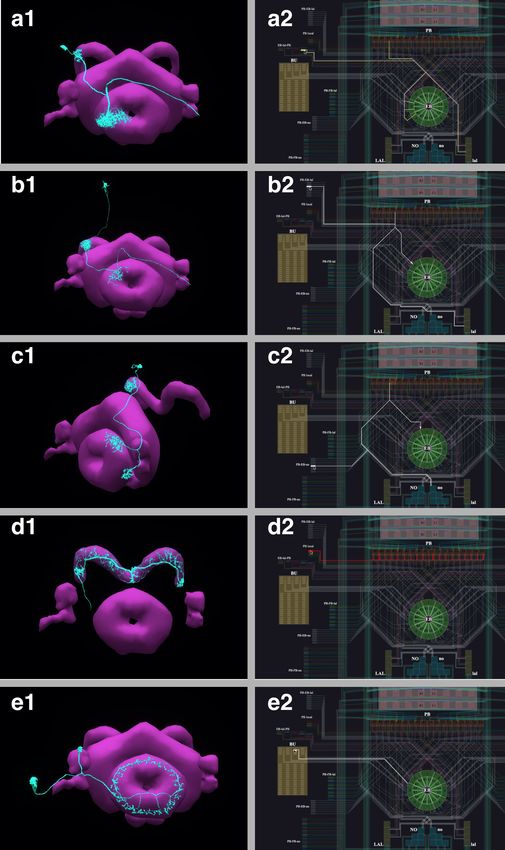
dataset (see Appendix 2), we extracted eight densely connected neuron groups, as shown in
Figure 4a. We then visualized subsets of neurons pseudocolored by group membership as shown in
Figure 4b and assigned six of the eight groups to several known brain regions/neuropils. These neu-
ropils include the AL, the MB, the lateral horn (LH), the central complex (CX), the anterior ventrolat-
eral protocerebrum (AVLP), and the superior protocerebrum (SP). The remaining two brain regions
correspond to the anterior optic tubercle with additional neurons of the posterior brain (AOTUP)
and the anterior central brain (ACB). A circuit diagram depicting the connections between these
groups of neurons is shown in Figure 4c.
In the second example, we sought to define cell types not just by visually inspecting the morphol-
ogy of the neurons, but also by taking into account the underlying graph structure of the circuit
pathways. This is useful when a new dataset is released without explicit definitions of cell types and/
or when there is a need for refining such definitions. Here, to automatically analyze neuron cell types
in the VA1v glomerulus dataset (Horne et al., 2018), we applied the Adjacency Spectral Embedding
algorithm (Sussman et al., 2012) of the NeuroGraph library (see Appendix 2 and Materials and
methods, Use Case 2). The embedding is visualized using UMAP (McInnes et al., 2018) and
depicted in Figure 4d, and it is validated by annotations from the original dataset. We note that the
overlap between PNs and some LNs is due to the restricted volume of the traced tissue. For an addi-
tional adjustment of their cell-type assignment, the resulting clusters of neurons can be further visu-
ally inspected as shown in Figure 4e. Outliers that lie far away from their clusters may guide future
inquiries into cell types that have not been previously described or provide new descriptions for
existing cell types contingent on their connectivity. Finding new neuron subtypes, for example, LNs
that cluster with OSNs or neurons that cluster with LNs can be further investigated. Finally, a circuit
diagram can be automatically generated using the NeuroGraph Library, as shown in Figure 4f.
Lastly, we demonstrate the process of automatic circuit diagram generation of explored brain cir-
cuits. Here, we explored the lateral horn subcircuit downstream of the V glomerulus projection neu-
rons, as well as the neuropils that the lateral horn output neurons (LHONs) project to Varela et al.,
2019. The circuit can be easily specified and visualized by NeuroNLP queries (see Materials and
methods, Use Case 2), and individual neurons can be further added/removed from the GUI. The
resulting circuit is depicted in Figure 4h. We then inspected the innervation pattern of each neuron,
Lazar et al. eLife 2021;10:e62362. DOI: https://doi.org/10.7554/eLife.62362 6 of 49
Tools and resources                                                                                                               Neuroscience

Figure 4. Exploratory analysis of the fly brain circuits. (a) Louvain algorithm applied to all neurons in the Hemibrain dataset showing eight groups of
densely connected neurons. Color indicates the value of log10 ðn þ 1Þ, where n is the number of synapses; values larger than one are shown in the same
color as value 1. AOTUP: anterior optic tubercle with additional neurons of the posterior brain, AVLP: anterior ventrolateral protocerebrum, LH: lateral
horn, ACB: neurons in the anterior central brain, AL: antennal lobe, SP: superior protocerebrum, CX: central complex, MB: mushroom body. Labels
were added after visually inspecting the neurons in each group of neurons in (b). (b) A subset of neurons pseudo-colored according to the group they
belong to in (a). (c) A brain-level circuit diagram created by hand according to the grouping of neurons and the inter-group edge information obtained
in (a). Visual and olfactory inputs from, respectively, the early visual system (EVS) and antenna (ANT) were added. Groups in the left hemisphere were
added by symmetry. (d) Adjacency Spectral Embedding algorithm applied to the VA1v connectome dataset using the NeuroGraph library. The color of
each circle indicates the cell-type labeling from the original dataset. Groups of neurons labeled by dashed circles are based on validated cell types. (e)
Visualization of neurons analyzed in (d). Neuron colors were assigned according to the groups in (d). (f) A circuit diagram of the VA1v circuit analyzed in
(d) automatically generated by the NeuroGraph Library. (g) Connectivity matrix of the lateral horn neurons downstream the V glomerulus projection
neurons of the antennal lobe. Colorbar configured in the same way as in (a). (h) Morphology of the neurons in (g). (white) PNs arborizing in the V
Figure 4 continued on next page

Lazar et al. eLife 2021;10:e62362. DOI: https://doi.org/10.7554/eLife.62362                                                                         7 of 49
Tools and resources                                                                                                               Neuroscience

Figure 4 continued
glomerulus, (red) LHLNs, (cyan) LHONs. (i) A circuit diagram automatically generated by the circuit visualization utilities of NeuroGraph starting with the
circuit in (g) and (h), and the superior lateral protocerebrum (SLP), the primary neuropil that the LHONs project to.

                                      either visually, or by querying its arborization data from the NeuroArch Database, and classified it
                                      either as a lateral horn local neuron (LHLN) or a LHON. The connectivity of neurons of the resulting
                                      circuit is shown in Figure 4g, where the rows and columns are grouped by neuron type. Using this
                                      collection of information, we invoked the NeuroGraph Library to create the circuit diagram shown in
                                      Figure 4i (see also Materials and methods, Use Case 2). The circuit diagram can then be used for
                                      computational studies as outlined in the previous examples.

                                      Use Case 3: interactive exploration of executable fruit fly brain circuit
                                      models
                                      Beyond exploring the structure of fruit fly brain circuits, a primary objective supported by FlyBrain-
                                      Lab is the study of the function of executable circuits constructed from fly brain data. FlyBrainLab
                                      provides users with rapid access to executable circuits stored on the NeuroArch Database. During
                                      program execution, these circuits can also be directly accessed by the Neurokernel Execution
                                      Engine.
                                          In Figure 5a, we depict the pathways of a cartridge of the Lamina neuropil (Rivera-Alba et al.,
                                      2011) visualized in the NeuroNLP window. The circuit diagram modeling the cartridge visualized in
                                      the NeuroGFX window is shown in Figure 5b. With proper labels assigned to blocks/lines represent-
                                      ing the neurons and synapses, we made the circuit diagram interactive. For example, by clicking on
                                      the block representing a neuron, the neuron can be inactivated, an operation corresponding to the
                                      silencing/ablating a neuron in the fly brain. Figure 5d depicts a modified cartridge circuit in which
                                      several neurons have been silenced. As a result, the visualized neural pathways in the NeuroNLP win-
                                      dow automatically reflect these changes, as shown in Figure 5c. The circuit components can also be
                                      disabled/reenabled by selecting through hiding/displaying visualized neurons in the NeuroNLP
                                      window.
                                          In the same interactive diagram, models of the circuit components and their parameters can be
                                      viewed/specified from a Model Library with all the available model implementations in the Neuroker-
                                      nel Execution Engine. In addition to these simple interactive operations further detailed in Materials
                                      and methods, Use Case 3, FlyBrainLab APIs support bulk operations such as updating models and
                                      parameters of an arbitrary number of circuit components (see also Appendix 4).

                                      Use Case 4: analyzing, evaluating, and comparing circuit models of the
                                      fruit fly central complex
                                      We first demonstrate the workflow supported by FlyBrainLab for analyzing, evaluating and compar-
                                      ing circuit models of the fruit fly Central Complex (CX) based on the FlyCircuit dataset
                                      (Chiang et al., 2011). The circuit connecting the ellipsoid body (EB) and the protocerebral bridge
                                      (PB) in the CX has been shown to exhibit ring attractor dynamics (Seelig and Jayaraman, 2015;
                                      Kim et al., 2017; Skaggs et al., 1995). Recently, a number of researchers investigated circuit mech-
                                      anisms underlying these dynamics. Here, we developed a CXcircuits Library for analyzing, evaluating
                                      and comparing various CX circuit realizations. Specifically, we implemented three of the circuit mod-
                                      els published in the literature, called here model A (Givon et al., 2017), model B (Kakaria and de
                                      Bivort, 2017), and model C (Su et al., 2017), and compared them in the same FlyBrainLab program-
                                      ming environment.
                                         In Figure 6 (a1, b1, c1), the anatomy of the neuronal circuits considered in models A, B, and C is
                                      depicted, respectively. The corresponding interactive circuit diagram is shown in Figure 6 (a2, b2,
                                      c2). Here, model A provides the most complete interactive CX circuit, including the core subcircuits
                                      for characterizing the PB-EB interaction with the EB-LAL-PB, PB-EB-LAL, PB-EB-NO, PB local, and EB
                                      ring neurons (see Materials and methods, Use Case 4, and Givon et al., 2017 for commonly used
                                      synonyms). Models B and C exhibit different subsets of the core PB-EB interaction circuit in model
                                      A. While no ring neurons are modeled in model B, PB local neurons are omitted in model C. They,

Lazar et al. eLife 2021;10:e62362. DOI: https://doi.org/10.7554/eLife.62362                                                                         8 of 49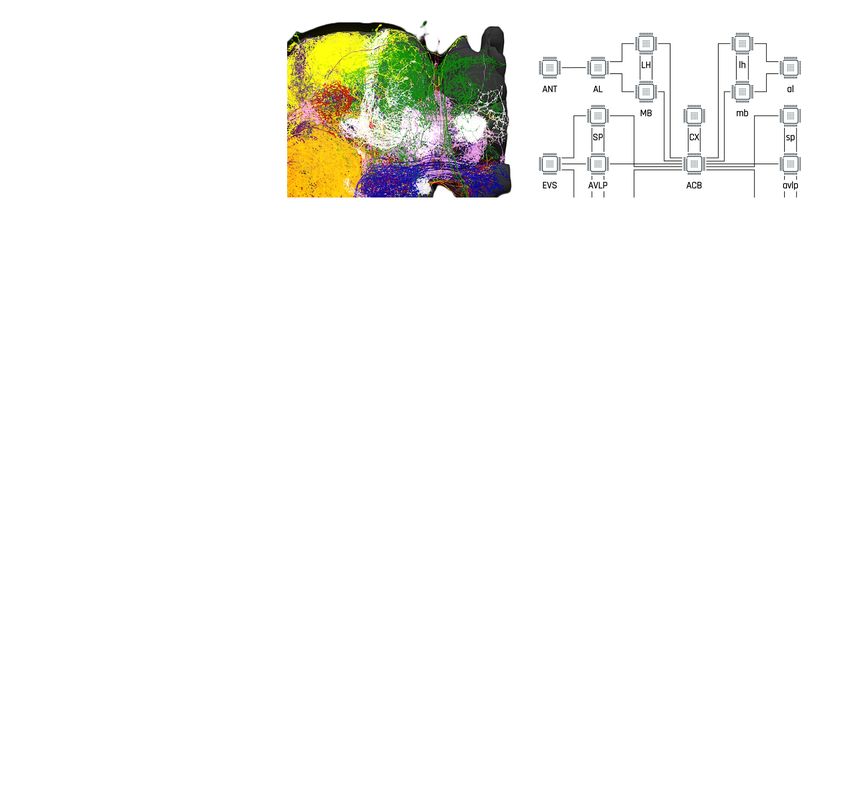
Tools and resources                                                                                                             Neuroscience

Figure 5. Interactive exploration of executable circuit models. (a) The pathways of a Lamina cartridge visualized in the NeuroNLP window. (b) A circuit
diagram of the cartridge in (a) displayed in NeuroGFX window. (c) The cartridge pathways modified interactively using the circuit diagram in (b) that
results in the circuit diagram in (d). (d) The circuit diagram modeling the chosen pathways in (c).

                                     however, do not model other neurons in the CX, for example, those that innervate the Fan-shaped
                                     Body (FB).
                                        In Video 1, we demonstrate the interactive capabilities of the three models side-by-side, includ-
                                     ing the visualization of the morphology of CX neurons and the corresponding executable circuits,
                                     user interaction with the circuit diagram revealing connectivity pattern, and the execution of the cir-
                                     cuit. In the video, the visual stimulus depicted in Figure 6 (d3) was presented to three models (see
                                     Materials and methods, Use Case 4, for the details of generating the input stimulus for each model).
                                     The responses, measured as the mean firing rate of EB-LAL-PB neurons within contiguous EB
                                     wedges, are shown in Figure 6 (a4, b4, c4), respectively. Insets depict the responses at 10, 20, and
                                     30 s. During the first second, a moving bar in its fixed initial position and a static bar are presented.
                                     The moving bar displays a higher brightness than the static bar. All three models exhibited a single-
                                     bump (slightly delayed) response tracking the position of the moving bar. The widths of the bumps
                                     were different, however. After 30 s, the moving bar disappeared and models A and B shifted to
                                     track the location of the static bar, whereas the bump in model C persisted in the same position

Lazar et al. eLife 2021;10:e62362. DOI: https://doi.org/10.7554/eLife.62362                                                                       9 of 49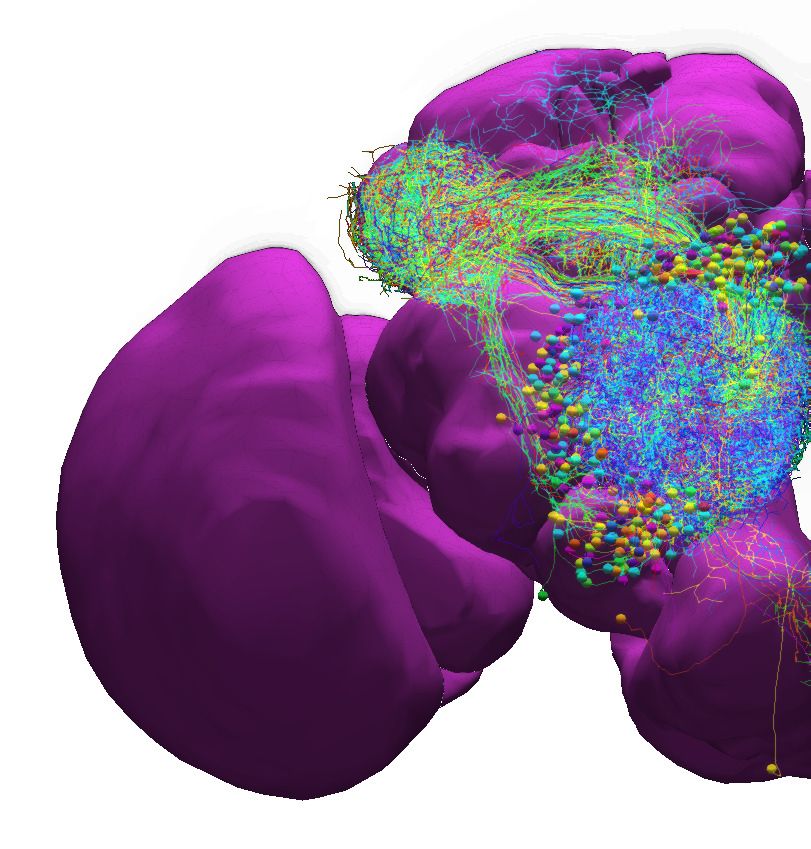
Tools and resources                                                                                                               Neuroscience

Figure 6. Analysis, evaluation and comparison of three models of CX published in the literature. (a1–a4) Model A (Givon et al., 2017), (b1–b4) Model B
(Kakaria and de Bivort, 2017), (c1–c4) Model C (Su et al., 2017). (a1, b1, c1) Morphology of the neurons visualized in the NeuroNLP window (see
Figure 2b). Displayed number of neurons in: (a1) 366, (a2) 87, (a3) 54. (a2, b2, c2) Neuronal circuits in the NeuroNLP window depicted in the NeuroGFX
window (see Figure 2b) as abstract interactive circuit diagrams. The naming of the ring neurons in (c2) follows Su et al., 2017. Number of neurons in
the diagram: (b1) 348, (b2) 60, (b3) 56. As the FlyCircuit dataset contains duplicates, some neurons in the diagrams may correspond to multiple neurons
in the dataset and some do not have correspondences due to the lack of morphology data. (a3, b3, c3) When a single vertical bar is presented in the
visual field (d1/d2), different sets of neurons/subregions (highlighted) in each of the models, respectively, receive either current injections or external
spike inputs. (a4, b4, c4) The mean firing rates of the EB-LAL-PB neurons innervating each of the EB wedges of the three models (see Materials and
methods, Use Case 4), in response to the stimulus shown in (d3). Insets show the rates at 10, 20, and 30 s, respectively, overlaid onto the EB ring. (d1) A
schematic of the visual field surrounding the fly. (d2) The visual field flattened. (d3) Input stimulus consisting of a bar moving back and forth across the
screen, and a second fixed bar at 60 and with lower brightness.

                                      where the moving bar disappeared. Furthermore, for models B and C but not for model A, the
                                      bumps persisted after the removal of the visual stimulus (after 33 s), as previously observed in vivo
                                      (Seelig and Jayaraman, 2015; Kim et al., 2017).
                                          By comparing these circuit models, we notice that, to achieve the ring attractor dynamics, it is
                                      critical to include global inhibitory neurons, for example, PB local neurons in models A and B, and
                                      ring neurons in models A and C. The model A ring neurons featuring a different receptive field and
                                      the ring neurons in model C receiving spike train input play a similar functional role. However, to
                                      achieve the ring attractor dynamics characterized by a single bump response to multiple bars and

Lazar et al. eLife 2021;10:e62362. DOI: https://doi.org/10.7554/eLife.62362                                                                        10 of 49
Tools and resources Neuroscience
persistent bump activity after the removal of the
vertical bar, model C only required three out of
the five core neuron types (see Materials and
methods, Use Case 4), whereas model B requires
all four neuron types included.
Use Case 5: analyzing, evaluating,
and comparing adult antenna and
antennal lobe circuit models based
upon the FlyCircuit and hemibrain
datasets
Video 1. Running three CX executable circuits in the
In the second example, we demonstrate the
FlyBrainLab. (left) Model A (Figure 6a). (middle) Model
B (Figure 6b). (right) Model C (Figure 6c).
effect on modeling the antenna and antennal
https://elifesciences.org/articles/62362#video1
lobe circuits due to, respectively, the FlyCircuit
(Chiang et al., 2011) and the Hemibrain
(Scheffer et al., 2020) datasets (see also Materi-
als and methods, Use Case 5).
We start by exploring and analyzing the morphology and connectome of the olfactory sensory
neurons (OSNs), antennal lobe projection neurons (PNs), and local neurons (LNs) of the FlyCircuit
(Chiang et al., 2011) and the Hemibrain (Scheffer et al., 2020) datasets (see Figure 7a). Compared
with the antennal lobe data in the FlyCircuit dataset, the Hemibrain dataset reveals additional con-
nectivity details between OSNs, PNs, and LNs that we took into account when modeling the anten-
nal lobe circuit (see Materials and methods, Use Case 5). Following (Lazar et al., 2020a), we first
constructed the two layer circuit based on the FlyCircuit dataset shown in Figure 7b (left) and then
constructed a more extensive connectome/synaptome model of the adult antennal lobe based on
the Hemibrain dataset as shown in Figure 7b (right).
Execution of and comparison of the results of these two circuit models show quantitatively differ-
ent PN output activity in steady-state (Figure 7c) and for transients (Figure 7d). A prediction
(Lazar and Yeh, 2019; Lazar et al., 2020a) made by the antenna and antennal lobe circuit shown in
Figure 7b (left) using the FlyCircuit data has been that the PN activity, bundled according to the
source glomerulus, is proportional to the vector characterizing the affinity of the odorant-receptor
pairs (Figure 7c, left column).
The transient and the steady state activity response are further highlighted in Figure 7d for differ-
ent amplitudes of the odorant stimulus waveforms. The initial results show that the circuit on the
right detects with added emphasis the beginning and the end of the odorant waveforms.
The complex connectivity between OSNs, LNs, and PNs revealed by the Hemibrain dataset sug-
gests that the adult antennal lobe circuit encodes additional odorant representation features
(Scheffer et al., 2020).
Use Case 6: analyzing, evaluating, and comparing early olfactory circuit
models of the larva and the adult fruit flies
In the third example, we investigate the difference in odorant encoding and processing in the Dro-
sophila Early Olfactory System (EOS) at two different developmental stages, the adult and larva (see
also Materials and methods, Use Case 6).
We start by exploring and analyzing the morphology and connectome for the Olfactory Sensory
Neurons (OSNs), Antennal Lobe Projection Neurons (PNs) and Local Neurons (LNs) of the adult
Hemibrain (Scheffer et al., 2020) dataset and the LarvaEM (Berck et al., 2016) dataset (see
Figure 8a).
Detailed connectivity data informed the construction of the model for both the adult and larva
EOS, that we developed based on parameterized versions of the previous literature (Lazar et al.,
2020a). In particular, the larval model includes fewer number of OSNs, PNs, and LNs in Antenna and
Antennal Lobe circuit as shown in Figure 8b right.
The adult and larval EOS models were simultaneously evaluated on a collection of mono-molecu-
lar odorants whose binding affinities to odorant receptors have been estimated from physiological
recordings (see also Materials and methods Use Case 6). In Figure 8c (left), the affinity values are
Lazar et al. eLife 2021;10:e62362. DOI: https://doi.org/10.7554/eLife.62362 11 of 49Tools and resources Neuroscience
FlyCircuit-Connectome Model Hemibrain-Connectome Model
a)
(a)
FlyCircuit-Connectome Model Hemibrain-Connectome Model
(b)
(c)
(d)
Figure 7. Analysis, evaluation, and comparison between two models of the antenna and antennal lobe circuit of the adult fly based on the FlyCircuit
(left) dataset (Chiang et al., 2011) and an exploratory model based on the Hemibrain (right) dataset (Scheffer et al., 2020). (a) Morphology of olfactory
sensory neurons, local neurons, and projection neurons in the antennal lobe for the two datasets. The axons of the projection neurons and their
projections to the mushroom body and lateral horn are also visible. (b) Circuit diagrams depicting the antenna and antennal lobe circuit motifs derived
Figure 7 continued on next page
Lazar et al. eLife 2021;10:e62362. DOI: https://doi.org/10.7554/eLife.62362 12 of 49Tools and resources Neuroscience
Figure 7 continued
from the two datasets. (c) Response of the antenna/antennal lobe circuit to a constant ammonium hydroxide step input applied between 1 s and 3 s of
a 5 s simulation; (left) the interaction between the odorant and 23 olfactory receptors is captured as the vector of affinity values; (middle and right) a
heatmap of the uniglomerular PN PSTH values (spikes/second) grouped by glomerulus for the two circuit models. (d) The PN response transients of the
two circuit models for uniform noise input with a minimum of 0ppm and a maximum of 100 ppm preprocessed with a 30 Hz low-pass filter (Kim et al.,
2011) and delivered between 1 s and 3 s.
shown for the odorant receptors that are only in the adult fruit fly (top panel), that appear in both
the adult and the larva (middle panel) and, finally, that are only in the larva. The steady-state
responses of the Antenna and Antennal Lobe circuit for both models are computed and shown in
Figure 8c (middle and right, respectively). Visualized in juxtaposition alongside the corresponding
affinity vectors, we observe a stark contrast in odorant representation at all layers of the circuit
between adult and larva, raising the question of how downstream circuits can process differently
represented odorant identities and instruct similar olfactory behavior across development. Settling
such questions requires additional physiological recordings, that may improve the accuracy of the
current FlyBrainLab EOS circuit models.
Discussion
Historically, a large number of visualization and computational tools have been developed primarily
designed for either neurobiological studies (see Figure 1 (left)) or computational studies (see Fig-
ure 1 (right)). These are briefly discussed below.
The computational neuroscience community has invested a significant amount of effort in devel-
oping tools for analyzing and evaluating model neural circuits. A number of simulation engines have
been developed, including general simulators such as NEURON (Hines and Carnevale, 1997), NEST
(Gewaltig and Diesmann, 2007), Brian (Stimberg et al., 2019), Nengo (Bekolay et al., 2014), Neu-
rokernel (Givon and Lazar, 2016), DynaSim (Sherfey et al., 2018), and the ones that specialize in
multi-scale simulation, for example MOOSE (Ray and Bhalla, 2008), in compartmental models,
for example ARBOR (Akar et al., 2019), and in fMRI-scale simulation for example The Virtual Brain
(Sanz Leon et al., 2013; Melozzi et al., 2017). Other tools improve the accessibility to these simula-
tors by (i) facilitating the creation of large-scale neural networks, for example BMTK (Dai et al.,
2020a) and NetPyNE (Dura-Bernal et al., 2019), and by (ii) providing a common interface, simplify-
ing the simulation workflow and streamlining parallelization of simulation, for example PyNN
(Davison et al., 2008), Arachne (Aleksin et al., 2017), and NeuroManager (Stockton and Santama-
ria, 2015). To facilitate access and exchange of neurobiological data worldwide, a number of model
specification standards have been worked upon in parallel including MorphML (Crook et al., 2007),
NeuroML (Gleeson et al., 2010), SpineML (Tomkins et al., 2016), and SONATA (Dai et al., 2020b).
Even with the help of these computational tools, it still takes a substantial amount of manual
effort to build executable circuits from real data provided, for example, by model databases such as
ModelDB/NeuronDB (Hines et al., 2004) and NeuroArch (Givon et al., 2015). Moreover, with the
ever expanding size of the fruit fly brain datasets, it has become more difficult to meet the demand
of creating executable circuits that can be evaluated with different datasets. In addition, with very
few exceptions, comparisons of circuit models, a standard process in the computer science commu-
nity, are rarely available in the computational neuroscience literature.
Substantial efforts by the system neuroscience community went into developing tools for visualiz-
ing the anatomy of the brain. A number of tools have been developed to provide interactive, web-
based interfaces for exploring, visualizing and analyzing fruit fly brain and ventral nerve cord data-
sets, for both the adult (Chiang et al., 2011; Scheffer et al., 2020) and the larva (Ohyama et al.,
2015). These include the FlyCircuit (Chiang et al., 2011), the Fruit Fly Brain Observatory (FFBO/
NeuroNLP) (Ukani et al., 2019), Virtual Fly Brain (Milyaev et al., 2012), neuPrintExplorer
(Clements et al., 2020), FlyWire (Dorkenwald et al., 2020), and CATMAID (Saalfeld et al., 2009).
Similar tools have been developed for other model organisms, such as the Allen Mouse Brain Con-
nectivity Atlas (Oh et al., 2014), the WormAtlas for C. elegans (https://www.wormatlas.org) and the
Z Brain for zebra fish (Randlett et al., 2015). A number of projects, for example (Bates et al., 2020),
offer a more specialized capability for visualizing and analyzing neuroanatomy data.
Lazar et al. eLife 2021;10:e62362. DOI: https://doi.org/10.7554/eLife.62362 13 of 49Tools and resources Neuroscience
(a)
(b)
(c) $I¿QLWy Vector OSN 5HVSRQVHV PN 5HVSRQVHV
Adult OR
Legend
OSN Spike Rate (Hz)
Larva OR
Adult &
$I¿QLWy Value
Spike Rate (A.U)
PN Normalized
Larva OR
Figure 8. Evaluation and Comparison of two Drosophila Early Olfactory System (EOS) models describing adult (left, developed based on Hemibrain
dataset) and larval (right, developed based on LarvaEM dataset) circuits. (a) Morphology of Olfactory Sensory Neurons (OSNs) in the Antenna (ANT),
Local Neurons (LNs) in the Antennal Lobe (AL) and Projection Neurons in the AL. (b) Circuit diagrams depicting the Antenna and Antennal Lobe circuit
motifs. (c) (left) Interaction between 13 odorants and 37 odorant receptors (ORs) characterized by affinity values. The ORs expressed only in the adult
fruit flies are grouped in the top panel; the ones that are expressed in both the adult and the larva are grouped in the middle panel; and those
expressed only in the larva are shown in the bottom panel. Steady-state outputs of the EOS models to a step concentration waveform of 100 ppm are
used to characterize combinatorial codes of odorant identities at the OSN level (middle) and the PN level (right).
Lazar et al. eLife 2021;10:e62362. DOI: https://doi.org/10.7554/eLife.62362 14 of 49Tools and resources Neuroscience
While these tools have significantly improved the access to and exploration of brain data a num-
ber of recent efforts started to bridge the gap between neurobiological data and computational
modeling including the Geppetto (Cantarelli et al., 2018), the OpenWorm (Szigeti et al., 2014)
and the Open Source Brain (Gleeson et al., 2019) initiatives and the Brain Simulation Platform of
the Human Brain Project (Einevoll et al., 2019). However, without information linking circuit activity/
computation to the structure of the underlying neuronal circuits, understanding the function of brain
circuits remains elusive. Lacking a systematic method of automating the process of creating and
exploring the function of executable circuits at the brain or system scale levels hinders the applica-
tion of these tools when composing more complex circuits. Furthermore, these tools fall short of
offering the capability of generating static circuit diagrams, let alone interactive ones. The experi-
ence of VLSI design, analysis, and evaluation of computer circuits might be instructive here. An elec-
tronic circuit engineer reads a circuit diagram of a chip, rather than the 3D structure of the tape-out,
to understand its function, although the latter ultimately realizes it. Similarly, visualization of a bio-
logical circuit alone, while powerful and intuitive for building a neural circuit, provides little insights
into the function of the circuit. While simulations can be done without a circuit diagram, understand-
ing how an executable circuit leads to its function remains elusive.
The tools discussed above all fall short of offering an integrated infrastructure that can effectively
leverage the ever expanding neuroanatomy, genetic and neurophysiology data for creating and
exploring executable fly brain circuits. Creating circuit simulations from visualized data remains a
major challenge and requires extraordinary effort in practice as amply demonstrated by the Allen
Brain Observatory (de Vries et al., 2020). The need to accelerate the pace of discovery of the func-
tional logic of the brain of model organisms has entered a center stage in brain research.
FlyBrainLab is uniquely positioned to accelerate the discovery of the functional logic of the Dro-
sophila brain. Its interactive architecture seamlessly integrates and brings together computational
models with neuroanatomical, neurogenetic, and neurophysiological data, changing the organization
of fruit fly brain data from a group of independently created datasets, arrays, and tables, into a well-
structured data and executable circuit repository, with a simple API for accessing data in different
datasets. Current data integration extensively focuses on connectomics/synaptomics datasets that,
as demonstrated, strongly inform the construction of executable circuit models. We will continue to
expand the capabilities of the NeuroArch database with genetic Gal4 lines (https://gene.neuronlp.
fruitflybrain.org) and neurophysiology recordings including our own (http://antenna.neuronlp.fruitfly-
brain.org/). How to construct executable models of brain circuits using genetic and neurophysiology
data sets is not the object of this publication and will be discussed elsewhere. Pointers to our initial
work are given below.
As detailed here, the FlyBrainLab UI supports a highly intuitive and automated workflow that
streamlines the 3D exploration and visualization of fly brain circuits, and the interactive exploration
of the functional logic of executable circuits created directly from the analyzed fly brain data. In con-
junction with the capability of visually constructing circuits, speeding up the process of creating
interactive executable circuit diagrams can substantially reduce the exploratory development cycle.
The FlyBrainLab Utility and Circuit Libraries accelerate the creation of models of executable cir-
cuits. The Utility Libraries (detailed in the Appendix 2) help untangle the graph structure of neural
circuits from raw connectome and synaptome data. The Circuit Libraries (detailed in the Appendix 3)
facilitate the exploration of neural circuits of the neuropils of the central complex and, the develop-
ment and implementation of models of the adult and larva fruit fly early olfactory system.
Importantly, to transcend the limitations of the connectome, FlyBrainLab is providing Circuit
Libraries for molecular transduction in sensory coding (detailed in the Appendix 3), including models
of sensory transduction and neuron activity data (Lazar et al., 2015a; Lazar et al., 2015b;
Lazar and Yeh, 2020). These libraries serve as entry points for discovery of circuit function in the
sensory systems of the fruit fly (Lazar and Yeh, 2019; Lazar et al., 2020a). They also enable the bio-
logical validation of developed executable circuits within the same platform.
The modular software architecture underlying FlyBrainLab provides substantial flexibility and scal-
ability for the study of the larva and adult fruit fly brain. As more data becomes available, we envi-
sion that the entire central nervous system of the fruit fly can be readily explored with FlyBrainLab.
Furthermore, the core of the software and the workflow enabled by the FlyBrainLab for accelerating
discovery of Drosophila brain functions can be adapted in the near term to other model organisms
including the zebrafish and bee.
Lazar et al. eLife 2021;10:e62362. DOI: https://doi.org/10.7554/eLife.62362 15 of 49Tools and resources Neuroscience
Materials and methods
The FlyBrainLab interactive computing platform tightly integrates tools enabling the morphological
visualization and exploration of large connectomics/synaptomics datasets, interactive circuit con-
struction and visualization and multi-GPU execution of neural circuit models for in silico experimenta-
tion. The tight integration is achieved with a comprehensive open software architecture and libraries
to aid data analysis, creation of executable circuits and exploration of their functional logic.
Architecture of FlyBrainLab
FlyBrainLab exhibits a highly extensible, modularized architecture consisting of a number of intercon-
nected server-side and user-side components (see Appendix 1—figure 1) including the NeuroArch
Database, the Neurokernel Execution Engine and the NeuroMinerva front-end. The architecture of
FlyBrainLab and the associated components are described in detail in Appendix 1.
FlyBrainLab Utilities Libraries
FlyBrainLab offers a number of utility libraries to untangle the graph structure of neural circuits from
raw connectome and synaptome data. These libraries provide a large number of tools including high
level connectivity queries and analysis, algorithms for discovery of connectivity patterns, circuit visu-
alization in 2D or 3D and morphometric measurements of neurons. These utility libraries are
described in detail in Appendix 2.
FlyBrainLab Circuit Libraries
FlyBrainLab provides a number of libraries for analysis, evaluation and comparison of fruit fly brain
circuits. The initial release of FlyBrainLab offers libraries for exploring neuronal circuits of the central
complex, early olfactory system, and implementations of olfactory and visual transduction models.
These circuit libraries are described in detail in Appendix 3.
Loading publicly available datasets into NeuroArch Database
All datasets are loaded into the NeuroArch database (Givon et al., 2015; Givon et al., 2014) using
the NeuroArch API (https://github.com/fruitflybrain/neuroarch).
For the FlyCircuit dataset (Chiang et al., 2011) version 1.2, all 22,828 female Drosophila neurons
were loaded, including their morphology, putative neurotransmitter type, and other available meta-
data. The original name of the neurons was used. These names also serve as the ‘referenceId’ point-
ing to the record in the original dataset. Connectivity between neurons was inferred according to
Huang et al., 2018 and loaded as a different, inferred class of synapses, totaling 4,538,280 connec-
tions between pairs of neurons. The metadata was provided by the authors (Huang et al., 2018).
For the Hemibrain dataset (Scheffer et al., 2020), release 1.0.1. Attributes of the neurons, synap-
ses and connections were obtained from the Neuprint database dump available at (https://storage.
cloud.google.com/hemibrain-release/neuprint/hemibrain_v1.0.1_neo4j_inputs.zip). The neuropil
boundary mesh and neuron morphology were obtained by invoking the neuprint-python API
(Clements et al., 2020) of the database server publicly hosted by the original dataset provider. The
former was post-processed to simplify the mesh object in MeshLab (https://www.meshlab.net) using
quadric edge collapse decimation with a percentage of 0.05. All coordinates were scaled by 0.008
to a [mm] unit. It included a total of 24,770 neurons that were designated in the Neuprint database
as ‘Traced’, ‘Roughly Traced’, as well as the neurons that were assigned a name or a cell type. Cell
type and neuron name follow the ‘type’ and ‘instance’ attributes, respectively, in the original data-
set. To create a unique name for each neuron, neurons with the same instance names were padded
with a sequential number. The BodyIDs of neurons in the original dataset use the ‘referenceId’. A
total of 3,604,708 connections between pairs of neurons were loaded, and included the positions of
14,318,675 synapses.
At the time of publication, the Hemibrain dataset release 1.2 (https://storage.cloud.google.com/
hemibrain-release/neuprint/hemibrain_v1.2_neo4j_inputs.zip) was also loaded into the NeuroArch
Database. It included a total of 25,842 neurons, 3,817,700 connections between pairs of these neu-
rons and the positions of 15,337,617 synapses.
For the Larva L1EM dataset (Ohyama et al., 2015), a total of 1,051 neurons characterized by their
morphology and metadata were loaded from the publicly served database server at https://l1em.
Lazar et al. eLife 2021;10:e62362. DOI: https://doi.org/10.7554/eLife.62362 16 of 49Tools and resources Neuroscience
catmaid.virtualflybrain.org. The IDs of neurons in the original dataset were used as ‘referenceId’. A
total of 30,350 connections between pairs of neurons were loaded, including the position of 121,112
synapses. All coordinates were scaled by 0.001 to a [m] unit.
For the Medulla 7 Column dataset (Takemura et al., 2015), the attributes of the neurons, synap-
ses and connections were obtained from the Neuprint database server export available at https://
storage.cloud.google.com/hemibrain-release/neuprint/fib25_neo4j_inputs.zip. Neuron morphology
was obtained from https://github.com/janelia-flyem/ConnectomeHackathon2015 commit 81e94a9.
Neurons without a morphology were omitted during loading. The rest of the procedure is the same
as for loading the Hemibrain dataset. A total of 2365 neurons, 42,279 connections between pairs of
neurons, and the positions of 130,203 synapses were loaded. Neurotransmitter data was obtained
from the Gene Expression Omnibus accession GSE116969 of the transcriptome study published in
Davis et al., 2020.
Extra annotations were avoided as much as possible when loading these datasets to the Neuro-
Arch database for public download. If any, they were used to comply with the NeuroArch data
model. The complete loading scripts are available at https://github.com/FlyBrainLab/datasets.
Use Case 1: building fly brain circuits with English queries
The circuit in Figure 3 (a1) was built using the Medulla 7 Column dataset. The following English
queries were used to construct the circuit: (1) ‘show T4a in column home’, (2) ‘color lime’, (3) ‘add
presynaptic neurons’, (4) ‘color gray’, (5) ‘add presynaptic $Dm$ neurons with more than five synap-
ses’, (6) ‘color cyan’, (7) ‘add presynaptic $Pm$ neurons with more than five synapses’, (8) ‘color yel-
low’, (9) ‘pin T4a in column home’, (10) ‘pin $Dm$’, (11) ‘pin $Pm$’.
The circuit in Figure 3 (b1) was built using the Hemibrain dataset release 1.2. The following
English queries were used to construct the circuit: (1) ‘show MBON presynaptic to neurons that has
outputs in FB layer 3 with at least 10 synapses’, (2) ‘color mbon yellow’, (3) ‘add postsynaptic neu-
rons with at least 10 synapses that has output in FB layer 3’, (4) ‘color forest green’, (5) ‘add mbon
postsynaptic to neurons that have input in FB layer 3 with at least 10 synapses’, (6) ‘color red’.
The circuit in Figure 3 (c1) was built using the Larva L1EM dataset. We first query the neuron
MBON that innervate the g compartment by ‘show $MBON-g$ in right mb’. The Information Panel
in the FlyBrainLab UI provides a list of presynaptic partners and a list of postsynaptic partners of the
neuron selected. After filtering the list by name and by the number of synapses, each neuron and
the synapses to/from the neuron can be added to the NeuroNLP window for visualization. Finally,
the collection of all filtered results can be added to the NeuroNLP window for visualization by click-
ing a single button. The circuit in Figure 3 (c1) was constructed by leveraging this capability.
The circuit in Figure 3 (d1) was built using the Hemibrain dataset release 1.2. First, the LPTCs
and GLNs in the right hemisphere were added with the NLP queries ‘show LPTC’ and ‘add /rGLN(.*)
R(.*)/r’. Second, to obtain the pathway between the two neuron types, the following query was
invoked:
# query for LPTC
res1 = client.executeNLPquery("show LPTC")
# color the neurons in the previous query
_ = client.executeNLPquery('color orange')
# query for GLN on the right hemisphere using regular expression
res2 = client.executeNLPquery("add /rGLN(.*)R(.*)/r")
Lazar et al. eLife 2021;10:e62362. DOI: https://doi.org/10.7554/eLife.62362 17 of 49You can also read