Deliverable D3.2 Report on Channel Modelling and Positioning for 5G V2X
←
→
Page content transcription
If your browser does not render page correctly, please read the page content below
Fifth Generation Communication Automotive Research and innovation

 Deliverable D3.2
 Report on Channel Modelling and
 Positioning for 5G V2X
 Version: v1.0

 2018-11-30

This project has received funding from the European Union’s Horizon 2020 research and innovation programme
under grant agreement No 761510. Any 5GCAR results reflects only the authors’ view and the Commission is
thereby not responsible for any use that may be made of the information it contains.

 http://www.5g-ppp.eu
Deliverable D3.2
 Report on Channel Modelling and
 Positioning for 5G V2X
Grant Agreement Number: 761510

Project Name: Fifth Generation Communication Automotive Research and
 innovation

Project Acronym: 5GCAR

Document Number: 5GCAR/D3.2

Document Title: Report on Channel Modelling and Positioning for 5G V2X

Version: v1.0

Delivery Date: 2018-11-30

Editors: Stephan Saur (Nokia), Mate Boban (Huawei)

Authors: Nil Garcia, Henk Wymeersch, Fuxi Wen (Chalmers), Hieu
 Do (Ericsson), Mate Boban, Anastasios Kakkavas, Qi
 Wang (Huawei), Giuseppe Destino, Toktam Mahmoodi
 (KCL), Silvio Mandelli, Stephan Saur, Stefan Wesemann
 (Nokia), Dinh-Thuy Phan-Huy (Orange), Efstathios
 Katranaras (Sequans), Taimoor Abbas (Volvo Cars)

Keywords: 5GCAR, 5G, New Radio, V2X, channel modelling, channel
 measurements, positioning

Status: Final

Dissemination level: Public

Disclaimer: This 5GCAR D3.2 deliverable is not yet approved nor rejected, neither financially
nor content-wise by the European Commission. The approval/rejection decision of work and
resources will take place at the next Review Meeting, after the monitoring process involving
experts has come to an end.

 2

Abstract
5GCAR has identified the most important use cases for future V2X communications together
with their key performance indicators and respective requirements. One outcome of this study is
that accurate positioning is important for all these use cases, however with different level of
accuracy. In this deliverable we summarize existing solutions for positioning of road users and
justify that they are not sufficient to achieve the required performance always and everywhere.
Therefore, we propose a set of solutions for different scenarios (urban and highway) and
different frequency bands (below and above 6 GHz). Furthermore, we link these new technical
concepts with the ongoing standardization of 3GPP New Radio Rel-16.
An important prerequisite for this work is the availability of appropriate channel models. For that
reason, we place in front a discussion of existing channel models for V2X, including the sidelink
between two road users, their gaps, as well as our 5GCAR contributions beyond the state of the
art. This is complemented with results from related channel measurement campaigns.

 3
Document: 5GCAR/D3.2 Status: Final
 Version: v1.0 Dissemination level: Public
 Date: 2018-11-30

Executive summary
In this deliverable we present results obtained in 5GCAR for two important topics related to
V2X: channel modelling and positioning. Section 2 deals with channel modelling. First, the state-
of-the-art channel models for V2X communications are described, including their most relevant
components: LOS blockage analysis, path loss and shadow fading modelling, and fast fading
modelling. Based on the existing work, Section 2 describes the gap in terms of the key missing
components required for complete solution for V2X channel modelling. Based on the gap and
beyond prior art, Section 2 describes:
• New V2V measurements and characterization of channels above 6 GHz
• Multi-link shadowing model based on measurements below 6 GHz
• Channel measurements for massive MIMO adaptive beamforming.

In terms of positioning, Section 3 firstly summarizes existing solutions for positioning and their
limitations, including both non-radio and radio-based techniques. As part of the 5GCAR
contributions, Section 3 describes the following technology components that are essential for a
positioning solution needed to enable 5G V2X use cases:
• Trajectory prediction with channel bias compensation and tracking
• Beam-based V2X positioning
• Multi-array V2V relative positioning
• Tracking of a vehicle’s position and orientation with a single base station in the downlink
• Harnessing data communication for low latency positioning
• Enhanced assistance messaging scheme for GPS and OTDOA positioning.

For both channel modelling and positioning, this deliverable analyzes the compliance of 5GCAR
solutions with existing standards and provides an overview of ongoing standardization with
focus on 3GPP New Radio Rel-16.
In a nutshell we claim:
• Very good alignment between 5GCAR activities and ongoing 3GPP NR standardization for
 both channel modelling and positioning. In particular our channel modelling activities led to
 agreements in 3GPP meetings and results achieved in 5GCAR are reflected in 3GPP V2X
 channel models.
• While positioning in LTE is based on time measurements only, most 5GCAR approaches
 integrate enhanced time measurements with angle measurements. This becomes possible
 through smaller antenna array sizes in the frequency range above 6 GHz. In this deliverable
 we show that the desired accuracy below one meter is in principle achievable. By rule of
 thumb this corresponds to an improvement of one order of magnitude with respect to the
 reference cases LTE and GPS.

 4
Document: 5GCAR/D3.2 Status: Final
 Version: v1.0 Dissemination level: Public
 Date: 2018-11-30

Contents
1 Introduction ......................................................................................................................... 9
 1.1 Objective of the Document ........................................................................................... 9
 1.2 Structure of the Document ........................................................................................... 9
2 Channel Modelling .............................................................................................................10
 2.1 V2X Environments and Link Types .............................................................................10
 2.2 State of the Art Channel Models for V2X.....................................................................11
 2.2.1 Channel Modelling Framework and Gap Analysis ................................................11
 2.2.2 Path Loss Models ................................................................................................17
 2.2.3 Shadow Fading Models .......................................................................................20
 2.2.4 Fast-Fading Parameters ......................................................................................22
 2.2.5 Summary .............................................................................................................22
 2.3 Contributions in 5GCAR Beyond State of the Art ........................................................24
 2.3.1 V2V Measurements in cmWave and mmWave ....................................................24
 2.3.2 mmWave V2V (Sidelink) Channel Modelling ........................................................29
 2.3.3 Multi-Link Shadowing Extensions.........................................................................32
 2.4 New Channel Measurements for Predictor Antenna for M-MIMO Adaptive
 Beamforming .........................................................................................................................35
 2.5 Status of Standardization and Contributions of 5GCAR ..............................................40
3 Positioning .........................................................................................................................45
 3.1 Review of Existing Solutions .......................................................................................45
 3.1.1 Positioning with GNSS .........................................................................................45
 3.1.2 Positioning in IEEE 802.11p Vehicular Ad-Hoc Networks (VANET) .....................47
 3.1.3 Positioning with Cellular Radio Access Technologies ..........................................48
 3.2 5GCAR Technology Components ...............................................................................49
 3.2.1 Trajectory Prediction with Channel Bias Compensation and Tracking ..................51
 3.2.2 Beam-Based V2X Positioning ..............................................................................55
 3.2.3 Tracking of a Vehicle’s Position and Orientation with Single Base Station in the
 Downlink ............................................................................................................................57
 3.2.4 Harnessing Data Communication for Low-Latency Positioning ............................60
 3.2.5 Enhanced Assistance Messaging Scheme for GNSS and OTDOA Positioning ....63
 3.2.6 Multi-Array V2V Relative Positioning: Performance Bounds.................................69

 5
Document: 5GCAR/D3.2 Status: Final
 Version: v1.0 Dissemination level: Public
 Date: 2018-11-30

 3.3 Status of Standardization ............................................................................................73
4 Conclusions .......................................................................................................................77
5 References ........................................................................................................................79
A Simulation Assumptions .....................................................................................................85
 A.1 System-Level Simulation Assumptions .......................................................................85
 A.1.1 Deployment Scenarios for Base Stations .............................................................85
 A.1.2 Deployment Scenarios for Road Sign Units .........................................................86
 A.1.3 Deployment Scenarios for UEs ............................................................................87
 A.1.4 User Deployment and Mobility .............................................................................88
 A.1.5 Data Traffic Models ..............................................................................................89
 A.1.6 In-Band Emission Model ......................................................................................90
 A.1.7 Performance Metrics ............................................................................................90
 A.2 Link-level Simulation Assumptions ..............................................................................91

 6

Document: 5GCAR/D3.2 Status: Final
 Version: v1.0 Dissemination level: Public
 Date: 2018-11-30

List of Abbreviations and Acronyms
3GPP Third Generation Partnership FF Fast Fading
 Project FR Frequency Range
5G-PPP 5G Private Public Partnership FTM Fine-Time Measurement
ABG Alpha Beta Gamma GBS Geometry Based Stochastic
AGC Automatic Gain Control GDOP Geometric Dilution of Precision
AI Artificial Intelligence GNSS Global Navigation Satellite System
AOA Angle of Arrival GPS Global Positioning Signal
AOD Angle of Departure IMU Inertial Measurement Unit
AS Angular Spread ISD Inter Site Distance
ASA Spread of AOA ITS Intelligent Transportation Systems
ASD Spread of AOD ITU International Telecommunication
B2P Base Station-to-Pedestrian (-UE) Union
B2R Base Station-to-Roadside Unit KPI Key Performance Indicator
B2V Base Station-to-Vehicle LOS Line of Sight
BLADE Blind Learning Algorithm for the LPP LTE Positioning Protocol
 channel bias Distribution Estimation LR Linear Regression
BS Base Station LS Location Server
CA Carrier Aggregation LTE-A LTE Advanced
CDF Cumulative Density Function MAP Maximum-A-Posteriori
CP Control Plane / Cyclic Prefix MEC Mobile Edge Computing
CRB Cramér-Rao Bound MIMO Multiple Input Multiple Output
CTRV Constant Turn Rate and Velocity M-MIMO Massive MIMO
CV Constant Velocity mMTC Massive Machine Type
D2D Device-to-Device Communications
DGNSS Differential Global Navigation MRT Maximum Ratio Transmission
 Satellite System MSE Mean Squared Error
DL Downlink NAS Non-Access Stratum
DMRS Demodulation Reference Signal NB-IOT Narrow-Band Internet of Things
DS Delay Spread NLOS Non-Light of Sight
DSRC Dedicated Short Range NLOSb NLOS due to buildings
 Communication
 NLOSv NLOS due to vehicles
efeMTC even further enhanced Machine
 Type Communications NMSE Normalized Mean Squared Error
eMBB extreme Mobile Broadband NR New Radio
EVM Error Vector Magnitude OEB Orientation Error Bound
eVTX enhanced Vehicle-to-Everything OFDM Orthogonal Frequency Division
 Multiplexing

 7
Document: 5GCAR/D3.2 Status: Final
 Version: v1.0 Dissemination level: Public
 Date: 2018-11-30

OLOS Obstructed Line of Sight SUPL Secure User Plane Location
OMA Open Mobile Alliance SUV Sport Utility Vehicle
OSM Open Street Map TDD Time Division Duplex
OTDOA (Downlink) Observed Time TDOA Time Difference of Arrival
 Difference of Arrival TOA Time of Arrival
P2B Pedestrian (-UE)-to-Base Station TRP Transmit Receive Point
P2P Pedestrian-to-Pedestrian TX Transmit
PDF Probability Density Function UE User Equipment
PDP Power Delay Profile UKF Unscented Kalman Filter
PEB Position Error Bound UL Uplink
PF Particle Filter ULA Uniform Linear Array
PL Path Loss UMa Urban Macro
PRR Packet Reception Ratio UMi Urban Micro
PRS Positioning Reference Signal UP User Plane
R2R Roadside Unit-to-Roadside Unit UTDOA Uplink (Observed) Time Difference
RAN Radio Access Network of Arrival
RAT Radio Access Technology V2B Vehicle-to-Base Station
RMa Rural Macro V2I Vehicle-to-Infrastructure
RSS Received Signal Strength V2P Vehicle-to-Pedestrian
RSTD Received Signal Time Difference V2R Vehicle-to-Roadside Unit
RSU Roadside Unit V2V Vehicle-to-Vehicle
RTK Real-Time Kinematic V2X Vehicle-to-Everything
RX Receive VA Virtual Anchor
SF Shadow Fading VANET Vehicular Ad Hoc Network
SI Study Item V-UE Vehicular User Equipment
SIB System Information Block VRU Vulnerable Road User
SISO Single Input Single Output WI Work Item
SL Sidelink ZOA Zenith of Arrival
SNR Signal-to-Noise Ratio ZOD Zenith of Departure
SOTA State of the Art ZSA Spread of ZOA
SRS Sounding Reference Signal ZSD Spread of ZOD
SUMO Simulation of Urban Mobility

 8
Document: 5GCAR/D3.2 Status: Final
 Version: v1.0 Dissemination level: Public
 Date: 2018-11-30

1 Introduction
1.1 Objective of the Document
This deliverable summarizes 5GCAR activities concerning channel modelling and positioning. It
is inspired from the public deliverable of 5GCAR about scenarios, use cases, requirements and
Key Performance Indicators (KPIs) [5GC17-D21]. All identified use cases in 5GCAR need
accurate, ubiquitous and real-time positioning, a requirement that cannot be fulfilled with
existing technologies which are mainly based on cameras, radar, Global Navigation and
Satellite Systems (GNSS), such as the Global Positioning System (GPS), as well as vehicle
sensors. It is envisaged to complement these existing systems to fill gaps, e.g. in tunnels, and to
enhance the overall reliability. This deliverable also reflects recent results and agreements from
V2X radio design [5GC18-D31] and V2X system level architecture [5GC18-D41] aiming at an
overall 5G-based V2X solution with accurate positioning as one of the fundamental features.
The availability of appropriate channel models for V2X communications are an imperative
prerequisite for the air interface design activities in 5GCAR. Existing models do not yet consider
the full range of V2X-specific scenarios, such as the direct communication between two moving
vehicles in a dense urban environment, or the characteristics of V2X-specific network elements
like Roadside Units (RSUs). In particular, there are still significant gaps in the frequency range
above 6 GHz. We aim to derive extended channel models based on the measurement
campaigns presented in this deliverable.
In addition, we link the research activities in 5GCAR with the ongoing standardization in 3GPP.

1.2 Structure of the Document
This deliverable is organized as follows: Section 2 is dedicated to channel modelling and
channel measurements. After an introduction of the scenarios and link types we consider in
5GCAR, we give an overview of existing channel models and a gap analysis. Important aspects
are Line-of-Sight (LOS) probability and path loss, shadowing and fast fading. Next, we present
the activities in 5GCAR beyond prior art. Important components are measurement campaigns in
different frequency bands, scenarios, link types and antenna configurations. Based on that,
extended channel model parameters for different frequencies are discussed. We conclude this
first part of the deliverable with a status update of the ongoing standardization in 3GPP.
The topic of Section 3 is positioning. First, we briefly summarize the capabilities of common
positioning methods used for Vehicle-to-Everything (V2X) Communications today. Afterwards,
we introduce the ongoing research activities in 5GCAR concerning positioning and present the
current status of the performance evaluation. Again, we consider different frequency bands and
scenarios. Finally, we summarize recent agreements in the related 3GPP Rel-16 Study Item.

 9

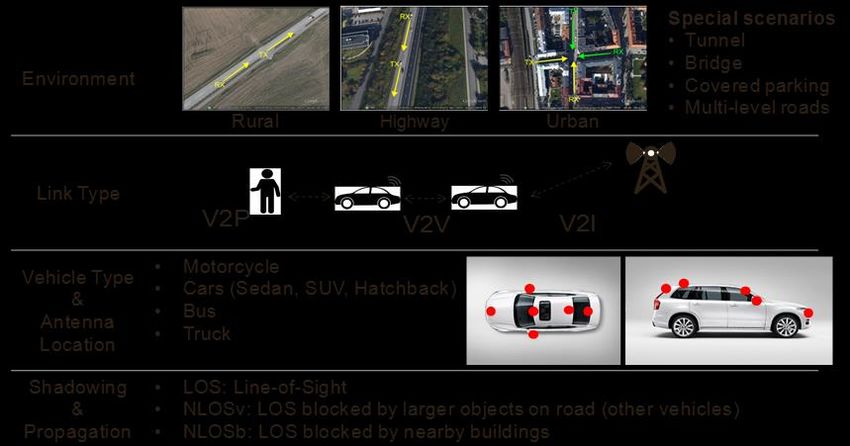
Document: 5GCAR/D3.2 Status: Final
 Version: v1.0 Dissemination level: Public
 Date: 2018-11-30

2 Channel Modelling
This section covers the relevant state of the art channel models for V2X communication, along
with describing the work done beyond state of the art in the 5GCAR project. First, the section
describes environments relevant for V2X communication, together with link types subsumed
under the term “V2X”. Next, we describe state of the art channel models, including their most
relevant components: LOS blockage analysis, path loss and shadow fading modelling, and fast
fading modelling. The contributions beyond state of art pertain to: i) new Vehicle-to-Vehicle
(V2V) measurements and characterization of channels above 6 GHz; ii) multi-link shadowing
model based on measurements below 6 GHz; and iii) channel measurements for massive
MIMO adaptive beamforming. Finally, the section concludes by analyzing the compliance of
5GCAR channels with existing standards and providing possible recommendations from
5GCAR to standardization bodies.

2.1 V2X Environments and Link Types
Radio propagation is influenced by the type of objects found in the environment where the
communication occurs. In case of V2X communications, the most important objects that
influence the propagation are buildings, vehicles (both static and mobile), and different types of
vegetation (e.g., trees, shrubbery, etc.). Relevant scenarios for V2X channel modelling, link
types, vehicle types, and main propagation states are described in Figure 2.1 below.
Environments can be divided qualitatively into highway, rural, and (sub)urban, with a word of
caution: the division between environments is not an exact one, and the differences in certain
cases might be hard to define. For example, rural and highway scenario differ in the number of
lanes (typically larger in case of highways) and surroundings (typically more foliage in rural,
guard rails more often existent in highways), but the two environments can also share a lot of
characteristics. Furthermore, the impact of foliage cannot be neglected in any of the
environments, as shown in measurements studies [ABV+16; BBT14].

 Figure 2.1: Environments, link types, and specific considerations for V2X channel
 modelling.

 10
Document: 5GCAR/D3.2 Status: Final
 Version: v1.0 Dissemination level: Public
 Date: 2018-11-30

2.2 State of the Art Channel Models for V2X
The goal of this section is to define the most relevant state of art models available for use in the
simulations across the 5GCAR project. Below we list the relevant channel modelling
components.

2.2.1 Channel Modelling Framework and Gap Analysis
The technical report 3GPP TR 38.901: “Study on channel model for frequencies from 0.5 to 100
GHz” [3GPP17-38901] defines a Geometry-Based Stochastic (GBS) framework for channel
modelling from 0.5 GHz to 100 GHz. It Specifies parameters for LOS probability, Path Loss
(PL), Shadow Fading (SF), and Fast Fading (FF) and covers several scenarios: Urban Macro
(UMa), Urban Micro (UMi), Indoor Office, and Rural Macro (RMa). The report is focused on BS-
to-UE communication and does not explicitly address V2X channels. Specifically, the following
components important for V2X are not covered:
• No dual mobility (V2V)
• No V2X-specific scenarios (RSU-Vehicle, V2V)
• No V2X antenna considerations
• No V2X-specific parameterization (especially for V2V)
• No PL, SF, FF for V2V
• No LOS probability and blockage evolution for V2V and V2P channels.

Components above are crucial for realistic modelling of vehicular channels. To enhance the
3GPP framework, this deliverable attempts at filling as many gaps as possible by using state of
art literature on V2X channels and by also providing new channel parameterization based on
recent measurements. In sections 2.2.2 to 2.2.4 we elaborate on specific components of V2X
channel model, predominantly focusing on V2V case, since [3GPP17-38901] covers the
Vehicle-to-Infrastructure (V2I) channels comprehensively (particularly the vehicle-to-base
station case). More specifically, we describe the parameters to be included in [3GPP17-38901],
as depicted in Figure 2.2 ranging from selecting the correct scenario (block 1) to LOS
propagation condition (block 2), path loss (block 3), etc. In summary, we propose to use the
framework in [3GPP17-38901] for all channel generations, whereas for specific components of
the process, to use the parameters and models listed in sections 2.2.2 to 2.2.4.

 11
Document: 5GCAR/D3.2 Status: Final
 Version: v1.0 Dissemination level: Public
 Date: 2018-11-30

 Figure 2.2: Channel Coefficient Generation Process based on [3GPP17-38901].

 Table 2.1: Summary of the availability of V2X channel modelling aspects.

Legend: “+”: the model exists in the literature; “-“:the model does not exist in the literature

 12
Document: 5GCAR/D3.2 Status: Final
 Version: v1.0 Dissemination level: Public
 Date: 2018-11-30

Table 2.1 provides a summary of the availability in the existing literature of models for specific
propagation effect, along with desirable properties of the models. While it is difficult to provide a
comprehensive summary, we attempt to identify which components of V2X channel modelling
are available in well-defined, feasible channel models available in the literature.

Assigning propagation condition for V2V channels – LOS blockage and evolution
model
In relation to defining LOS/NLOS conditions in the different scenarios, there exists a need to
model the transitions between different LOS states as described in [BGX16]. Realistic LOS
blockage realization is required in order to assign the appropriate path loss, shadowing, small-
scale, and large-scale parameters over time and space. LOS blockage modelling is particularly
important for V2X communication, because of:
• High mobility, possibly on both sides of the link (e.g., in the case of V2V communication),
 resulting in more dynamic LOS blockage
• Have low antenna heights, resulting in more frequent LOS blockage
• V2X communication will be used for applications related to safety, either directly (e.g.,
 emergency braking, intersection collision avoidance application, etc.) or indirectly (e.g.,
 platooning, lane-change maneuvers, etc.). LOS blockage is critical for safety related
 applications because the reliability of the communication link suffers from sudden
 fluctuations of the received signal.

The work described in [BGX16] designs a time and space consistent model for LOS blockage of
V2V channels. It models the evolution of states using Markov chain as shown in Figure 2.3. The
three-state discrete-time Markov chain was used, comprised of the following states: i) Line-of-
Sight (LOS), ii) Non-Line-of-Sight (NLOS) due to static objects, e.g., buildings, trees, etc.
(NLOSb) and iii) non-LOS due to mobile objects (vehicles) (NLOSv). If the LOS is blocked by
both a static object and a vehicle at the same time, we assume the static object (e.g., building)
is the dominant one and categorize the channel as NLOSb. Results presented in [BGX16]
showed significant difference compared to standard cellular models for LOS blockage, thus
emphasizing the need for bespoke modelling of blockage for V2V links.

 Figure 2.3: Markov chain for modelling the time evolution of V2V links [BGX16].

LOS probability and transition probability curves
Based on the extensive ray-tracing simulations in real cities (combined Rome, New York,
Munich, Tokyo, and London) with real road layout and realistic vehicle mobility simulation
explained in [BGX16], Figure 2.4, Figure 2.5, Figure 2.6, and Figure 2.7 (all from [BGX16]),
which show the extracted LOS probability and transition probability curves for the Markov model
shown in Figure 2.3 depending on the distance between transmitting and receiving vehicle.

 13
Document: 5GCAR/D3.2 Status: Final
 Version: v1.0 Dissemination level: Public
 Date: 2018-11-30

 Figure 2.4: LOS probabilities in urban environment, medium density.

 Figure 2.5: LOS probabilities on highway, medium density.

Figure 2.6: Transition probabilities in urban environment, medium density.

 14
Document: 5GCAR/D3.2 Status: Final
 Version: v1.0 Dissemination level: Public
 Date: 2018-11-30

 Figure 2.7: Transition probabilities on A6 highway, medium density.

As key take-away from these results, we derived a tractable model for the generation of time-
evolved V2V links through curve fitting for LOS (Figure 2.4, Figure 2.5) and transition (Figure
2.6, Figure 2.7) probabilities. This resulted in two sets of equations, one from LOS probabilities
curves (Table 2.2, from [BGX16]) and the second set for transition probabilities (Table III in
[BGX16]).
 Table 2.2: LOS probability equations for highway and urban environment, medium
 density.

 15
Document: 5GCAR/D3.2 Status: Final Version: v1.0 Dissemination level: Public Date: 2018-11-30 Since LOS, NLOS, and NLOSv states were shown to have distinct path loss, shadowing, large- scale, and small-scale parameters [BBT14], when transitioning between states, it is necessary to avoid hard transitions in the adjacent channel realizations resulting from different path loss and fast fading parameters. To circumvent such hard transitions between all three states, the optional “soft LOS” state from [3GPP17-38901] can be considered to determine the PL and the channel impulse responses containing characteristics of the preceding and following state. Path loss comparison of V2V LOS probability model with 3GPP/ITU Urban Micro (UMi) LOS probability model Since there are no comprehensive V2V link LOS blockage and transition probability models available in the literature, we compare the proposed model with the well-established 3GPP/ITU Urban Micro (UMi) LOS probability model, which is currently used by 3GPP for LOS probability of V2X and D2D linksDocument Title [3GPP17-38901]: Security Level d1 −d −d P(LOS)=min ,1× 1–e d2+e d2, d where d is distance between Tx and Rx, d1 is a parameter set to 18 meters, and d2 to 36 meters. For illustration purposes, we use the states generated by the two models to calculate the path loss for a Tx-Rx pair that moves apart at 1 m/s starting from 1 to 500 meters. We use the parameters for urban medium density. For LOS and NLOSb path loss parameters, we use the values based on measurements reported in [BBT14]. For NLOSv, we use the multiple knife- edge attenuation model described in [BBT14]. For clarity, we show path loss only (i.e., without additional log-normal distributed shadow fading). Figure 2.8 shows the path loss results for the proposed model and 3GPP UMi LOS probability model [3GPP17-38901]. Since UMi model does not model dependency on the previous LOS state, the number of transitions between the states is considerably higher than in the proposed model, particularly when the probability of LOS is close to 50% (i.e., between 50 and 100 meters). This is clearly an unrealistic behavior, since two vehicles will not move between LOS and NLOS states so rapidly. While Figure 2.8 shows a single realization of state changes and resulting path loss, we ran simulations for a large number (105) of V2V pairs with distances between 0 and 500 m. UMi model resulted in an average state change every 5 seconds, while the proposed model averaged one state change every 17 seconds. 16
Document: 5GCAR/D3.2 Status: Final
 Version: v1.0 Dissemination level: Public
 Date: 2018-11-30

 Figure 2.8: Comparison of path loss generated by proposed model and 3GPP UMi LOS
probability model for a single V2V link with Tx and Rx moving apart from 0 to 500 m with
 relative speed of 1 m/s [BGX16].

For reference, path loss for LOS, NLOSv, and NLOSb states is plotted Figure 2.8 also indicates
why models based on correlation distance for spatial consistency (e.g., model in Section 7.6.3 in
[3GPP17-38901] are not sufficient for modelling time- and space- evolved V2V links. Shadowing
decorrelation distance in urban and highway environment for V2V links is on the order of tens of
meters (e.g., [ASK+15] reports decorrelation distances of 5 m in urban and 30 m in highway
environment) and is assumed to be independent of the Tx-Rx distance. However, Figure 2.8
shows that a single decorrelation distance value cannot capture the changing behavior as Tx-Rx
distance changes: at low distances, the LOS decorrelation distance is high and decreases with
increasing Tx-Rx distance, whereas NLOSb decorrelation distance increases with increasing
Tx-Rx distance. By using distance-dependent transition probabilities, the proposed model is
capable of capturing this behavior.

2.2.2 Path Loss Models
Path loss for V2V LOS links

Free space path loss
The free space path loss model is the resulting loss in signal strength when the electromagnetic
wave traverses from TX to RX through free space, without any obstacles nearby that could
cause reflections or diffractions. The free space path loss FSPL is given by the equation

where d is the distance between the transmitter and receiver in meter, f is the carrier frequency
in Hz, GTx and GRx are the dimensionless gains of the transmitting and receiving antenna,
respectively. Free space is a theoretical model which by itself does not model well the path loss
for V2X channels since, at the very least, there are perturbations of the free space signal by the
reflections coming from the road on which the vehicles travel.

 17
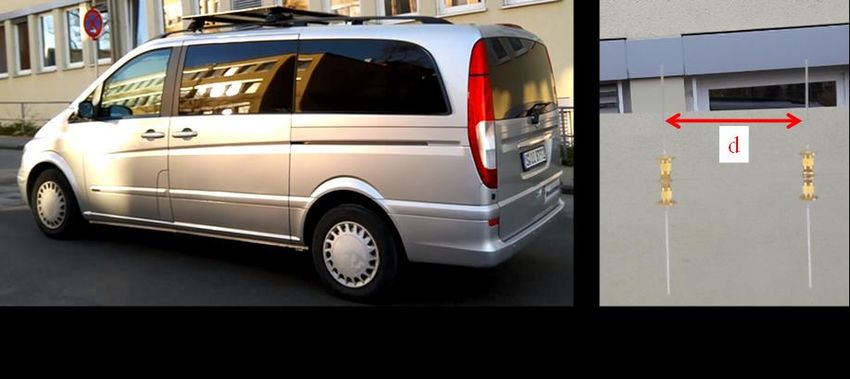
Document: 5GCAR/D3.2 Status: Final
 Version: v1.0 Dissemination level: Public
 Date: 2018-11-30

Two-ray ground reflection model
The free space propagation model assumes the existence of only the LOS ray. However, due to
the inherent structure of the environment where V2V communication occurs – over the face of
road surface – in case of LOS communication the propagation characteristics are most often
influenced by at least two dominant rays: LOS ray and ground-reflected ray. Two-way ground
reflection model with appropriately adjusted reflection coefficient was shown as a very good
path loss model for LOS V2V channels [KCP11; BVT13]. In this scenario, the LOS path
interferes with the ground reflected path. The two rays arrive at the receiver with a different
phase and a different power. The different phase leads to constructive and destructive
interference depending on the distance, d, between the receiver and the transmitter, as shown
in Figure 2.9. When increasing the distance between the transmitter and the receiver, the
alternating pattern of constructive and destructive interference stops at break point db. From this
distance onwards, the length difference between the two rays is smaller than half the
wavelength and the small Angle of Arrival (AOA) on the ground causes a phase shift of 180° for
the reflected wave, leading to destructive interference.

 Figure 2.9: The two-ray ground reflection model.

For these two rays and referring to Figure 2.9 the resulting E-field is equal to:
 E 0 d0 d E0 d0 dground
ETOT = ELOS + EGround = dLOS
 cos [ωc (t − LOS
 c
 )] + R Ground d cos [ωc (t − c
 )] , (1)
 ground

where EGround is the E-field of the ground-reflected ray, RGround is the ground reflection coefficient,
and dground is the propagation distance of the ground-reflected ray, where ht and hr is the height
of the transmitting and receiving antenna, respectively, and dLOS is the ground distance between
the antennas (d in Figure 2.9). Note that using the exact height of the antennas (ht and hr) is
important, since a small difference in terms of either ht or hr results in significantly different
interference relationship between the LOS and ground-reflected ray. When the originating
medium is free space, the reflection coefficient R is calculated as follows for vertical and
horizontal polarization respectively:
 − ϵr sin θi + √ϵr −cos2 θi
 R || = (2)
 ϵr sin θi + √ϵr −cos2 θi

and
 sin θi + √ϵr −cos2 θi
 R⟘ = (3)
 sin θi + √ϵr −cos2 θi

 18
Document: 5GCAR/D3.2 Status: Final
 Version: v1.0 Dissemination level: Public
 Date: 2018-11-30

where θi is the incident angle, and ϵr is the relative permittivity of the material. From E-fields in
eq.1, the ensuing received power Pr (in Watts) is calculated as follows (assuming unit antenna
gain at the receiver):
 |ETOT |2 λ2
 Pr = (4)
 4πη

where λ is the wavelength and η is the intrinsic impedance (η = 120 πΩ in free space).
Appropriate reflection coefficient needs to be used to match the measurements. To that end in
[BVT13] curve fitting of the above model to measurement data yielded ϵr value of 1.003 as the
best fit (note that remaining parameters in the calculation of reflection coefficient are dependent
on geometry only.

Path loss for V2V channels obstructed by vehicles: Vehicles-as-obstacles
When vehicles are causing the blockage to the LOS link, they induce additional attenuation.
Model for vehicles-as – obstacles is described in [BVF+11], where vehicles are modelled using
the (multiple) knife-edge diffraction. The model uses free space path loss model as the baseline,
with additional attenuation due to each of the vehicles blocking the LOS link. Attenuation (in dB)
due to a single knife-edge obstacle Ask is obtained using the following equation:

 (5)
where v =21/2H/rf , H is the difference between the height of the obstacle and the height of the
straight line that connects TX and RX, and rf is the Fresnel ellipsoid radius (as shown in Figure
2.10).

 Figure 2.10: Vehicles-as-obstacles path loss model (figure adapted from [BVF+11]).

To calculate the attenuation due to multiple vehicles, the model employs the ITU-R multiple-
knife diffraction method [ITU13]. Vehicles-as-obstacles model was validated experimentally and
was shown to model well the path loss of V2V channels obstructed by other vehicles [BBT14].

 19
Document: 5GCAR/D3.2 Status: Final
 Version: v1.0 Dissemination level: Public
 Date: 2018-11-30

Path loss for V2V channels obstructed by buildings and other objects: Log-
distance path loss model
Log-distance path loss is an extension of the free space path loss, where the path loss
exponent does not necessarily equal two (as is the case in free space propagation) but is a
function of the environment surrounding TX and RX.
Log-distance path loss model is formally expressed as:
 PL(d) = PL(d0) + 10γlog(d/d0) + Xσ
where PL is the total path loss measured in decibel (dB), PL(d0) is the path loss at the reference
distance d0, d is the distance between TX and RX, γ is the path loss exponent and Xσ describes
the random shadowing effects.
Finally, the received power Pr is calculated as
 Pr = Pt + Gt + Gr - PL(d)
where Pt is the transmit power and Gt and Gr are antenna gains in dBi. Log-distance path loss
with appropriate path loss exponent and shadowing deviation was experimentally shown to
model well the path loss for V2V links in non-LOS cases [BBT14]. For V2V links at 5.9GHz, the
following values can be used [BBT14]:
• d0 = 1 meter
• PL(d0) = 47.8649 dB
• γ= 2.5 (slight obstruction by building)
• γ= 3 (strong obstruction by building).

2.2.3 Shadow Fading Models
Single-link shadow fading for V2V and V2I channels
In log-distance path loss equation, the value of standard deviation σ of the shadow fading
variable Xσ(0, σ), can be adjusted so that it better describes a specific environment and the link
type. For V2V links, [BBT14] contains a detailed measurement-based analysis of σ for both
highway and urban environments for the 6 GHz band. Furthermore, the code implementing both
the path loss and shadow fading model is available at http://vehicle2x.net/. The values of σ are
shown in Table 2.3.
 Table 2.3: Shadow-fading parameter σ for V2V communication (6 GHz band).

 Environment Highway Urban
 Link type

 LOS 3.3 dB 5.2 dB

 NLOSv 3.8 dB 5.3 dB

 NLOSb 4.1 dB 6.8 dB

 20
Document: 5GCAR/D3.2 Status: Final
 Version: v1.0 Dissemination level: Public
 Date: 2018-11-30

Due to the differences in terms of antenna height, scatterer density, and relative speed, V2I
links exhibit different propagation characteristics compared to V2V links. Of particular
importance is a subset of V2I links where the infrastructure end of a link is a roadside unit
(RSU), since these links are distinguished compared to well-studied cellular V2I links. Aygun et
al. [ABV+16] used measurement data collected in urban environment of Bologna to evaluate the
shadow fading for four propagation conditions of RSUs V2I links: LOS, NLOS due to vehicles,
NLOS due to foliage, and NLOS due to buildings (i.e., the non-LOS due to static objects --
NLOSb link type -- further divided to blockage due to buildings and blockage due to foliage).
Assuming log-normal shadow fading process, the authors extract the resulting mean, minimum,
and maximum of σ, the standard deviation of the shadow fading process. The summarized
results are shown in Table 2.4, with following remarks: a) for highway environment, NLOSb
state is not applicable; b) for the lack of measurements in highway, LOS and NLOSv results for
urban environment are reused for highway as well.
Table 2.4: Shadow-fading parameter σ for Vehicle-to-Roadside Unit (V2R) communication
 (6GHz band).

 Environment Highway Urban
 Link type

 LOS 2.2dB 2.2dB

 NLOSv 2.6dB 2.6dB
 Buildings
 NLOSb N/A 3.3dB
 Foliage
 2.4dB

Multi-link shadow fading for V2V channels
Abbas et al. performed V2V measurements and showed that a single vehicle can incur more
than 10 dB attenuation, in line with previous results. Based on the measurements, the authors
designed a GBS propagation model for highway environments that incorporates vehicular
obstructions and determines the time duration that the link spends in LOS and NLOS states. By
extracting the probability distributions of each state from measurements, it uses a probabilistic
model based on Markov chains to transition between different LOS conditions. The model
demonstrates the importance of differentiating a LOS link from a NLOS link as well as energy
contributed from LOS and NLOS rays. However, this model was developed for a single link
communication and one important factor in VANET simulations, which is often neglected, is to
include the cross-correlation of the different communication links. This is important for the
wireless communication systems using multi-hop techniques to overcome the issue with
shadowed vehicles in V2V systems. Two models are presented [Nil17] of the cross-correlation
for a convoy scenario on a highway; one when using a joint path loss model for all
communication links between all vehicles, including LOS and Non-LOS due to vehicles (NLOSv)
cases (17), and another one when using a specific path loss model for each communication link,
as well LOS and NLOSv separately (18). The auto- and cross- correlations do not affect the

 21
Document: 5GCAR/D3.2 Status: Final
 Version: v1.0 Dissemination level: Public
 Date: 2018-11-30

average value of the received power if the data ensemble is big enough. However, the
correlations will cause the system to experience longer large-scale fading dip durations
compared to the uncorrelated case. This is especially important for VANET safety applications,
where the consecutive packet error rate is a critical factor. The findings in [Nil17] regarding path
loss models, autocorrelation behavior and the cross-correlation of the large-scale fading
processes stress the benefits of GBM for VANET simulators. It is important that the geometry-
based models distinguish between LOS and NLOSv communication and apply different path
loss models for the two cases. Otherwise the VANET simulator needs to consider the cross-
correlation between different communication links i.e., implementing (17), to achieve results
close to reality. On the other hand, when using a geometry-based model as an input to the
VANET simulator, the cross correlation can actually be neglected and the implementation of
(18) is not necessary. This is a very useful and practical result, since it makes it much easier to
implement VANET simulators for multi-link scenarios. The computational complexity could
easily become an issue if the cross-correlation between many links has to be considered.

2.2.4 Fast-Fading Parameters
For 6GHz, we propose to
use the shadow and fast fading parameters presented in Section 2.2.3 and in more detail in
[3GPP18-1802721].

2.2.5 Summary
Table 2.5 below summarizes which models to use for each of the V2X channel modelling
components as part of the channel modelling framework described in [3GPP17-38901]. By and
large, for V2I channels the components in [3GPP17-38901] itself are suitable for use. On the
other hand, LOS blockage, path loss, shadow fading, and fast fading in [3GPP17-38901] are not
suitable for V2V channels; therefore, alternative parameterization for those components is
proposed based on the existing literature. For any parameters not mentioned in Table 2.5, for
initial evaluations, the existing parameters in [3GPP17-38901] can be used, with the note that
some of the parameters (e.g., elevation angles) need to be revisited.

 22
Document: 5GCAR/D3.2 Status: Final
 Version: v1.0 Dissemination level: Public
 Date: 2018-11-30

Table 2.5: Summary of the channel modelling components to include into the framework
 in [3GPP17-38901].

 V2V

 Urban Highway

6 GHz

LOS_blockage [BGX16] [BGX16]

PL [3GPP18-1802720] [3GPP18-1802720]

SF [3GPP18-1802720] [3GPP18-1802720]

FF [3GPP18-1802721] [3GPP18-1802721]

 V2I (Vehicle-to-Base station: V2B)

 Urban Highway

V2B LOS NLOS LOS NLOS
 6GHz

V2R
> 6GHz

LOS_blockage

PL
 [3GPP17-38901]
SF

FF

 V2I (V2R)

 Urban Highway

V2R LOS NLOSv NLOSb LOS NLOSv NLOSb
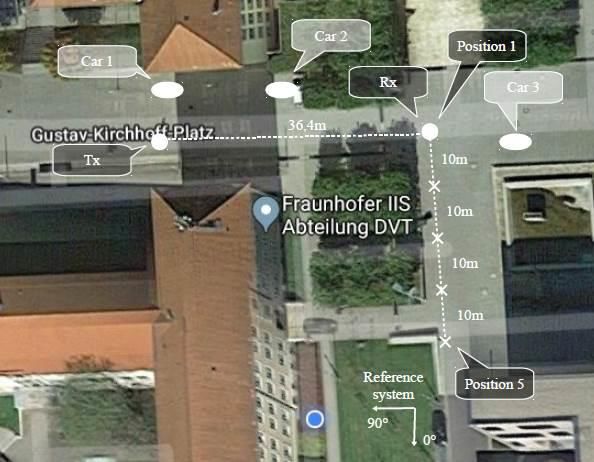
Document: 5GCAR/D3.2 Status: Final
 Version: v1.0 Dissemination level: Public
 Date: 2018-11-30

2.3 Contributions in 5GCAR Beyond State of the
 Art
2.3.1 V2V Measurements in cmWave and mmWave
Measurement Set-up and Scenarios
Six channel measurement campaigns (indicated as C1-C5, C7) related to vehicle blockage and
one (indicated as C6) related to building blockage have been carried out by the Electronic
Measurements and Signal Processing group of the Technische Universität Ilmenau, Germany
(TUIL) in the campus of the TUIL, at carrier frequencies of 6.75, 30 and 60 GHz. A dual-
polarized ultra-wideband multi-channel sounder was used, which offers after back to back
calibration a null-to-null bandwidth of 5.1 GHz. The spatial characterization of the environment
has been done by automatically rotating dual-polarized horn antennas with 30° HPBW in 30°
steps, covering the whole azimuth range at transmitter (Tx) and receiver (Rx). On the other
hand, a single elevation of 0° was measured at both sides. The scenario was a “T” intersection
in an urban environment with parked cars, multi-story buildings, and lampposts as shown in
Figure 2.11.
In C1-C3, two parked cars were present during the measurements to increase the scattering
effects. A third car, denominated blocking vehicle (labeled as obstructing car in Figure 2.11),
was located in 15 different positions (Position 1-15 as indicated in Figure 2.11.) emulating an
overtaking situation. Further, a Position 0 has been defined to indicate the case without the
presence of the third car (the blocking vehicle). All the measurements were performed in as
static scenario as possible by restricting the access of the streets. The Tx and Rx antennas
were 44 m apart, emulating two cars communicating to each other. The antennas were located
at two possible heights, emulating two possible antenna locations at cars: 1) Rooftop level
antennas (1.55 m for the 30 GHz and 60 GHz bands, and 1.66 m for the 6.75 GHz band); 2)
Bumper level antennas (0.75 m for the 30 GHz and 60 GHz bands, and 0.86 m for the 6.75 GHz
band). Further, two types of blockers were used: 1) Small blocker (A Volkswagen Sharan -
normal car); 2) Big blocker (a MB Sprinter - a delivery van). The following configurations have
been used in C1-C3: C1 – Rooftop antennas and small blocker; C2 - Rooftop antennas and big
blocker; C3 – Bumper antennas and small blocker.

 24
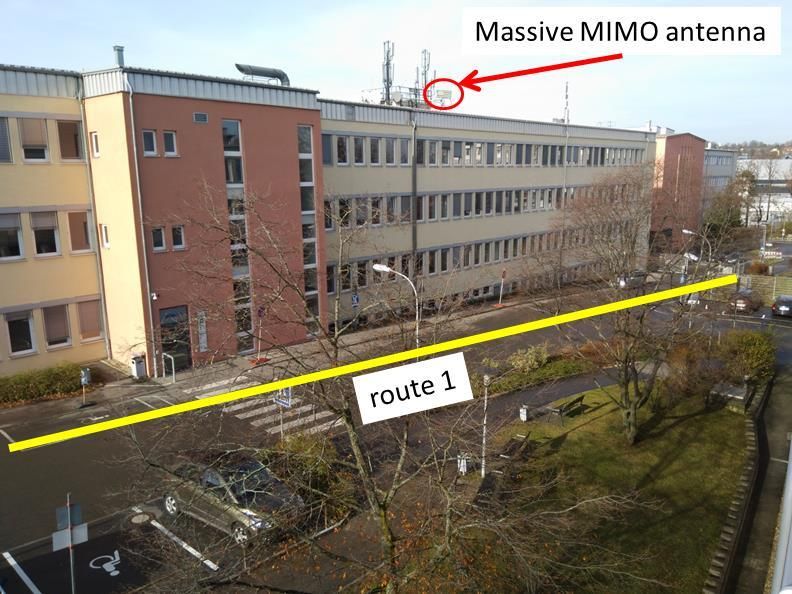
Document: 5GCAR/D3.2 Status: Final
 Version: v1.0 Dissemination level: Public
 Date: 2018-11-30

 Figure 2.11. Measurement scenario and set up of C1-C3 in the campus of TU Ilmenau.

The campaigns C4, C5, C6, and C7 use only rooftop antennas. Figure 2.12 shows the scenario
of C4, where the Tx was located in a fixed position and the Rx was moved away from 19 meter
to 44 meter in 5 meter steps. A big blocking vehicle is located between Tx and Rx, with a fixed
distance of 9.4 meter to the Tx. Two passenger cars are parked around the Tx. C7 is an
extended version of C4, where the Rx was moved from 17 meter to 57 meter in 5 meter steps.

 Figure 2.12. Measurement scenario and set up of C4 in the campus of TU Ilmenau.

Figure 2.13 shows the scenario of C5, where the Tx and Rx were located at fixed positions, with
a Tx-Rx distance of 76.9 meters. Three different measurements were performed: A direct LOS,
one blocking vehicle (big), two blocking vehicles (big and small). The distances of the first and
second blocking vehicles to the Tx are 10.5 meters and 14.9 meters, respectively. There were
also parked cars in the surrounding area.

 25
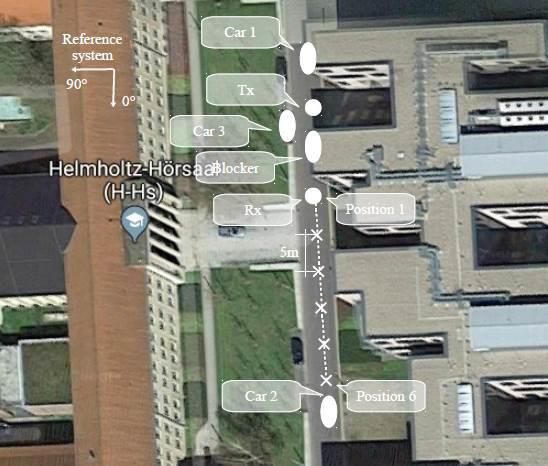
Document: 5GCAR/D3.2 Status: Final
 Version: v1.0 Dissemination level: Public
 Date: 2018-11-30

 Figure 2.13. Measurement scenario and set up of C5 in the campus of TU Ilmenau.

Figure 2.14 shows the scenario of C6, where the Tx and Rx were located around the corner of a
building. The Tx was fixed, while the Rx had different locations with 10 meter distance between
neighboring ones. Position 1 represents LOS, position 2 represents a NLOS (obstructed LOS)
by foliage, and position 3-5 NLOS by building. There were also two cars parked around the
corner.

 Figure 2.14. Measurement scenario and set up of C6 in the campus of TU Ilmenau.

 26
Document: 5GCAR/D3.2 Status: Final
 Version: v1.0 Dissemination level: Public
 Date: 2018-11-30

Measurement results

Power Delay Profile (PDP)
The synthetic omni-directional PDP of each band for the Position 1 (as indicated in Figure 2.11)
and Position 5 are plotted in Figure 2.15. All the plots normalized to the LOS component of the
case where no vehicles are present. The dynamic range threshold of 25 dB is also displayed in
dashed lines, which is used to identify the visible multipath components for a communication
receiver and to calculate the delay spread. From Figure 2.15, we can clearly see strong
multipath propagation. The actual scatterers in the environment (e.g. building A etc.) are
identified and indicated in Figure 2.15.

 Figure 2.15. Synthetic Omni-directional PDP for (a) Position 1, and (b) Position 5 in C1.

The effect of the blockage on LOS and scatterers in the PDP can be observed in Figure 2.16. In
Figure 2.16 (a), where the blocking vehicle is on the left-hand side of the Rx (Position 4), it can
be observed that the reflection from the building A is attenuated, while the parked car 2 is still
visible. In Figure 2.16 (b), where the blocking vehicle is in front of the Rx, i.e. blocking the LOS
(Position 5), it can be observed that the building A component appears again, while the
components of LOS, parked car 1, parked car 2, and lamppost 3 are attenuated.

Figure 2.16. Detailed synthetic Omni-directional PDP for (a) Position 4, and (b) Position 5
 in C1.

 27
Document: 5GCAR/D3.2 Status: Final
 Version: v1.0 Dissemination level: Public
 Date: 2018-11-30

Selected angular spread results
The marginal PAP of the positions 0 and 5 in C2 are shown in Figure 2.17 and Figure 2.18,
respectively. While position 0 represents the LOS scenario, position 5 represents the scenario
with vehicle blockage. Figure 2.19 (a) and (b) show the azimuth spread at the Rx and Tx of
each position, respectively. As can be seen from Figure 2.17, Figure 2.18 and Figure 2.19,
vehicle blockage causes increase in azimuth spread. Further, the closer the blockage vehicle is
to the Tx or Rx, the more increase the azimuth spread at the Tx or Rx will have, respectively.

 Figure 2.17. Marginal power azimuth profile at (a) Rx and (b) Tx for the Position 0 in C2.

 Figure 2.18. Marginal power azimuth profile at (a) Rx and (b) Tx for the Position 5 in C2.

 28
Document: 5GCAR/D3.2 Status: Final Version: v1.0 Dissemination level: Public Date: 2018-11-30 Figure 2.19. Azimuth spread at the (a) Rx and (b) Tx for the different positions and bands in C2. 2.3.2 mmWave V2V (Sidelink) Channel Modelling Directional Channel Characterization The above measurements can be used for directional channel characterization of mmWave V2V channels. Different scatterers were identified using the large resolution in the time domain and the different scans in the angular domain. The interpolated and normalized per position power bi-azimuthal profiles are shown for Position 0 (LOS) and Position 5 (NLOSv) in Figure 2.17 and Figure 2.18, respectively. In the Position 0 (Figure 2.17), the strongest scatterers are the LOS, building A, and a back reflection in the T intersection in building B. In the Position 5 (Figure 2.18), the LOS is completely blocked. The above results of directional characterizations show that NLOSv V2V propagation significantly increases the angular spread of MPCs at 60 GHz. Path loss The Alpha-Beta-Gamma (ABG) path loss (PL) model is applied in [3GPP18-1802720] for V2V channels in various urban and highway scenarios under LOS, and under building and vehicle blockage cases. Note that the ABG path loss model is currently used in the 3GPP 3D model [3GPP17-38901]. For the reason of aligning the V2Vpath loss modelling to [3GPP17-38901], we propose to use the path loss equations in [3GPP18-1802720]. The ABG PL model is given as: PLABG ( f , d )[dB] = 10 log10 (d ) + + 10 log10 ( f ) + X ABG where captures how the PL increase as the transmit-receive in distance (in meters) increases, is the floating offset value in dB, captures the PL variation over the frequency f in GHz, and X ABG is the SF term in dB. Formula above allows the fitting of the ABG path loss model for different environments. We note that that the models in [3GPP18-1802720] are multi-frequency models, with the parameters in the model extracted from measurements above-6GHz band (specifically, 6.75, 30, 60, and 73 GHz). 29
Document: 5GCAR/D3.2 Status: Final
 Version: v1.0 Dissemination level: Public
 Date: 2018-11-30

Table 2.6 presents the ABG model parameters at different scenarios for V2V links in LOS and
NLOSb case, whereas Table 2.7 presents the vehicle blockage effect model for V2V (i.e.,
NLOSv case). Further details are available in [3GPP18-1802720]. Note that values α
Document: 5GCAR/D3.2 Status: Final Version: v1.0 Dissemination level: Public Date: 2018-11-30 vehicle blockage in Position 4 to 12 compared to Position 0) is about 12 dB. For each of the states, Table 2.8 contains the parameters values extracted from the measurements explained in Section 2.3.1. and [3GPP18-1802721]. While the NLOSb state in urban environment is due to building blockage, in highway environment it is due to blocking by foliage. In Table 2.8, in the case of values in square brackets, parameters are taken from UMi model in [3GPP17-38901] (Table 7.5-6). In case when new measurement results do not contain a certain parameter for NLOSv, we reuse the value for NLOS state from UMi model in [3GPP17-38901] (Table 7.5-6) for both urban and highway scenario. Note again that UMi model parameters are used for a lack of better solution. To that end, some of the parameters (e.g., elevation angles) might need to be further investigated and updated, when appropriate measurements become available. Further details are available in [3GPP18-1802721]. Table 2.8: Fast fading parameters for V2V sidelink. Urban Highway Scenarios LOS NLOS NLOSv LOS NLOSv -0.2 log10(1+ -0.3 log10(1+ -0.4 log10(1+ Delay Spread (DS) lgDS -8.3 -8.3 fc) – 7.5 fc) – 7 fc) – 7 lgDS=log10(DS/1s) lgDS 0.1 0.28 0.1 0.2 0.3 -0.1 log10(1+ -0.08 log10(1+ -0.1 log10(1+ lgASD 1.4 1.5 AOD Spread (ASD) fc) + 1.6 fc) + 1.81 fc) + 1.7 lgASD=log10(ASD/1) 0.05 log10(1+ lgASD 0.1 0.1 0.1 0.1 fc) + 0.3 -0.1 log10(1+ -0.08 log10(1+ -0.1 log10(1+ lgASA 1.4 1.5 AOA Spread (ASA) fc) + 1.6 fc) + 1.81 fc) + 1.7 lgASA=log10(ASA/1) 0.05 log10(1+ lgASA 0.1 0.1 0.1 0.1 fc) + 0.3 -0.1 log10(1+ -0.04 log10(1+ -0.04 log10(1+ -0.1 log10(1+ -0.04 log10(1+ lgZSA ZOA Spread (ZSA) fc) + 0.73 fc) + 0.92 fc) + 0.92 fc) + 0.73 fc) + 0.92 lgZSA=log10(ZSA/1) -0.04 log10(1+ -0.07 log10(1+ -0.07 log10(1+ -0.04 log10(1+ -0.07 log10(1+ lgZSA fc) + 0.34 fc) + 0.41 fc) + 0.41 fc) + 0.34 fc) + 0.41 -0.1 log10(1+ -0.04 log10(1+ -0.04 log10(1+ -0.1 log10(1+ -0.04 log10(1+ lgZSD ZOD Spread (ZSD) fc) + 0.73 fc) + 0.92 fc) + 0.92 fc) + 0.73 fc) + 0.92 lgZSD=log10(ZSD/1) -0.04 log10(1+ -0.07 log10(1+ -0.07 log10(1+ -0.04 log10(1+ -0.07 log10(1+ lgZSD fc) + 0.34 fc) + 0.41 fc) + 0.41 fc) + 0.34 fc) + 0.41 K 3.48 N/A 0 9 0 K-factor (K) [dB] K 2 N/A 4.5 3.5 4.5 ASD vs 0 0.5 0.5 0.5 0.5 DS ASA vs 0.4 0.8 0.8 0.8 0.8 DS ASA vs -0.4 -0.4 -0.4 -0.4 -0.4 SF ASD vs 0 -0.5 -0.5 -0.5 -0.5 SF Cross-Correlations DS vs -0.7 -0.4 -0.4 -0.4 -0.4 SF ASD vs 0 0.4 0.4 0.4 0.4 ASA ASD vs N/A -0.2 -0.2 -0.2 -0.2 ASA vs N/A -0.3 -0.3 -0.3 -0.3 31
Document: 5GCAR/D3.2 Status: Final Version: v1.0 Dissemination level: Public Date: 2018-11-30 DS vs -0.7 N/A -0.7 -0.7 -0.7 SF vs 0.5 N/A 0.5 0.5 0.5 ZSD vs 0 0 0 0 0 SF ZSA vs 0 0 0 0 0 SF ZSD vs 0 N/A 0 0 0 K ZSA vs 0 N/A 0 0 0 K ZSD vs 0 -0.5 0 0 0 DS ZSA vs Cross-Correlations 0.2 0 0.2 0.2 0.2 DS ZSD vs 0.5 0.5 0.5 0.5 0.5 ASD ZSA vs 0.3 0.5 0.3 0.3 0.3 ASD ZSD vs 0 0 0 0 0 ASA ZSA vs 0 0.2 0 0 0 ASA ZSD vs 0 0 0 0 0 ZSA Delay scaling parameter r 3 2.1 2.1 3 2.1 XPR 9 8.0 8.0 9 8.0 XPR [dB] XPR 3 3 3 3 3 Number of clusters 12 19 19 12 19 Number of rays per cluster 20 20 20 20 20 Cluster DS ( ) in [ns] 5 11 11 5 11 Cluster ASD ( ) in [deg] 3 10 10 3 10 Cluster ASA ( ) in [deg] 17 22 22 17 22 Cluster ZSA ( ) in [deg] 7 7 7 7 7 Per cluster shadowing std [dB] 4 4 4 4 4 DS 7 10 10 7 10 ASD 8 10 10 8 10 ASA 8 9 9 8 9 Correlation distance in the SF 10 13 13 10 13 horizontal plane [m] K 15 N/A N/A 15 N/A ZSA 12 10 10 12 10 ZSD 12 10 10 12 10 fc is carrier frequency in GHz. Procedure for generating both ZOA and ZOD is the same and based on the ZOA procedure in 3GPP TR38.901. 2.3.3 Multi-Link Shadowing Extensions For realistic performance evaluation of V2V communication systems, it is crucial that the channel models used for system simulations are realistic and cover all important aspects of the NLOS case in urban intersections. In [NGA+18] path loss and fading parameters for vehicles of different kinds and sizes are provided, addressing multilink shadowing effects in urban intersections. As well, auto-correlation properties of a single link and cross-correlation properties of the large scale fading between different links are analyzed in [NGA+18]. A NLOS channel gain model which consider that a communication link can be obstructed by other vehicles (NLOSv) and which is reciprocal is described as 32
Document: 5GCAR/D3.2 Status: Final
 Version: v1.0 Dissemination level: Public
 Date: 2018-11-30

 where

and where the width of the streets at which the transmitting and receiving vehicles are located
are denoted by wt, wr, and dt, dr are the distances to the intersection center. The term Ψσ
represent the large-scale fading and is modeled as a non-zero mean Gaussian process (which
is not the common case) for each communication link and iteration (repetitive measurement
runs in the same intersection). The mean of Ψσ has a Gaussian distribution that represents the
differences in the particular traffic situation and gain of the involved antennas for the particular
communication link during that specific iteration. Estimated parameters of g1, g2, m, and σ for
two different intersections, Yngve (T-crossing with buildings in two corners) and Xerxes (X-
crossing with buildings in four corners) are presented in Table 2.9 and a schematic description
of the channel gain model is shown in the Figure 2.20.
 Table 2.9: Estimated parameters of the NLOS model.

 Figure 2.20: Description of the channel gain model for a typical NLOS communication
 link between vehicles in an urban intersection.

 33
You can also read