Large but decreasing effect of ozone on the European carbon sink
←
→
Page content transcription
If your browser does not render page correctly, please read the page content below
Biogeosciences, 15, 4245–4269, 2018
https://doi.org/10.5194/bg-15-4245-2018
© Author(s) 2018. This work is distributed under
the Creative Commons Attribution 4.0 License.

Large but decreasing effect of ozone on the European carbon sink
Rebecca J. Oliver1 , Lina M. Mercado1,2 , Stephen Sitch2 , David Simpson3,4 , Belinda E. Medlyn5 , Yan-Shih Lin5 , and
Gerd A. Folberth6
1 Centre for Ecology and Hydrology, Benson Lane, Wallingford, OX10 8BB, UK
2 College of Life and Environmental Sciences, University of Exeter, EX4 4RJ, Exeter, UK
3 EMEP MSC-W Norwegian Meteorological Institute, PB 43, NO-0313, Oslo, Norway
4 Dept. Space, Earth & Environment, Chalmers University of Technology, Gothenburg, SE-41296 Sweden
5 Hawkesbury Institute for the Environment, Western Sydney University, Locked Bag 1797, Penrith NSW 2751 Australia
6 Met Office Hadley Centre, Exeter, UK

Correspondence: Rebecca Oliver (rfu@ceh.ac.uk)

Received: 28 September 2017 – Discussion started: 11 October 2017
Revised: 17 June 2018 – Accepted: 1 July 2018 – Published: 13 July 2018

Abstract. The capacity of the terrestrial biosphere to se-       cal effects of elevated future CO2 (acting to reduce stomatal
quester carbon and mitigate climate change is governed by        opening) and reductions in O3 concentrations resulted in re-
the ability of vegetation to remove emissions of CO2 through     duced O3 damage in the future. This alleviation of O3 dam-
photosynthesis. Tropospheric O3 , a globally abundant and        age by CO2 -induced stomatal closure was around 1 to 2 %
potent greenhouse gas, is, however, known to damage plants,      for both land carbon and GPP, depending on plant sensitivity
causing reductions in primary productivity. Despite emission     to O3 . Reduced land carbon storage resulted from diminished
control policies across Europe, background concentrations of     soil carbon stocks consistent with the reduction in GPP. Re-
tropospheric O3 have risen significantly over the last decades   gional variations are identified with larger impacts shown for
due to hemispheric-scale increases in O3 and its precur-         temperate Europe (GPP reduced by 10 to 20 %) compared
sors. Therefore, plants are exposed to increasing background     to boreal regions (GPP reduced by 2 to 8 %). These results
concentrations, at levels currently causing chronic damage.      highlight that O3 damage needs to be considered when pre-
Studying the impact of O3 on European vegetation at the re-      dicting GPP and land carbon, and that the effects of O3 on
gional scale is important for gaining greater understanding      plant physiology need to be considered in regional land car-
of the impact of O3 on the land carbon sink at large spa-        bon cycle assessments.
tial scales. In this work we take a regional approach and up-
date the JULES land surface model using new measurements
specifically for European vegetation. Given the importance
of stomatal conductance in determining the flux of O3 into       1   Introduction
plants, we implement an alternative stomatal closure parame-
terisation and account for diurnal variations in O3 concentra-   The terrestrial biosphere absorbs around 30 % of anthro-
tion in our simulations. We conduct our analysis specifically    pogenic CO2 emissions and acts to mitigate climate change
for the European region to quantify the impact of the inter-     (Le Quéré et al., 2015). Early estimates of the European
active effects of tropospheric O3 and CO2 on gross primary       carbon balance suggest a terrestrial carbon sink of between
productivity (GPP) and land carbon storage across Europe. A      135 and 205 TgC yr−1 (Janssens et al., 2003). Schulze et
factorial set of model experiments showed that tropospheric      al. (2009) determined a larger carbon sink of 274 TgC yr−1 ,
O3 can suppress terrestrial carbon uptake across Europe over     and more recent estimates suggest a European terrestrial sink
the period 1901 to 2050. By 2050, simulated GPP was re-          of between 146 and 184 TgC yr−1 (Luyssaert et al., 2012).
duced by 4 to 9 % due to plant O3 damage and land carbon         The carbon sink capacity of land ecosystems is dominated
storage was reduced by 3 to 7 %. The combined physiologi-        by the ability of vegetation to sequester carbon through pho-
                                                                 tosynthesis and release it back to the atmosphere through res-

Published by Copernicus Publications on behalf of the European Geosciences Union.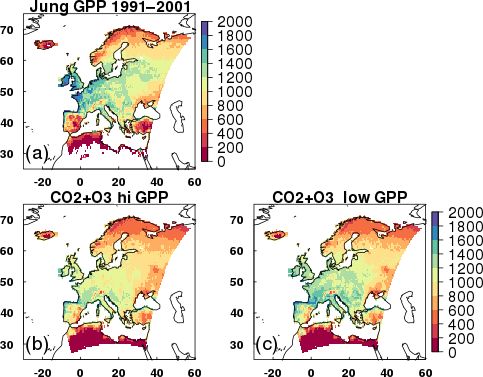
4246                                   R. J. Oliver et al.: Large but decreasing effect of ozone on the European carbon sink

piration. Therefore, any change in the balance of these fluxes      although not uniformly (Vingarzan, 2004). As a result of
will alter ecosystem source–sink behaviour.                         controls on precursor emissions in Europe and North Amer-
   In recent decades much attention has focussed on the ef-         ica, peak O3 concentrations in these regions have decreased
fects of rising atmospheric CO2 on vegetation productivity          or stabilised over recent decades (Cooper et al., 2014; Lo-
(Ceulemans and Mousseau, 1994; Norby et al., 1999, 2005;            gan et al., 2012; Parrish et al., 2012; Simpson et al., 2014b).
Saxe et al., 1998). The Norby et al. (2005) synthesis of Free-      Nevertheless, climate change may increase the frequency of
Air CO2 Enrichment (FACE) experiments suggests a me-                weather events conducive to peak O3 incidents in the fu-
dian stimulation (23 ± 2 %) of forest net primary produc-           ture (e.g. summer droughts and heatwaves; Sicard et al.,
tion (NPP) in response to a doubling of CO2 . Similar av-           2013), and may increase biogenic emissions of the O3 pre-
erage increases (20 %) were observed for C3 crops, although         cursors isoprene and NOx , although such impacts are sub-
this translated into smaller gains in biomass (17 %) and crop       ject to great uncertainty (Simpson et al., 2014b; Young et
yields (13 %) (Long et al., 2006). Little attention, however,       al., 2009, 2013). Intercontinental transport of air pollution
has been given to tropospheric ozone (O3 ), a globally abun-        from regions such as Asia are thought to contribute substan-
dant air pollutant recognised as one of the most damaging           tially to rising background O3 concentrations over the last
pollutants for forests (Karlsson et al., 2007; Royal-Society,       decades (Cooper et al., 2010; Verstraeten et al., 2015). North-
2008; Simpson et al., 2014b). Tropospheric O3 is a secondary        ern Hemisphere background concentrations of O3 are now
air pollutant formed by photochemical reactions involving           close to established levels for impacts on human health and
carbon monoxide (CO), volatile organic compounds (VOCs),            the terrestrial environment (Royal-Society, 2008). Therefore,
methane (CH4 ) and nitrogen oxides (NOx ) from both human-          although peak O3 concentrations are in decline across Eu-
made and natural sources, as well as downward transport             rope, plants are exposed to increasing background levels, at
from the stratosphere and lightning, which is a source of           levels currently causing chronic damage (Mills et al., 2011b).
NOx . The phytotoxic effects of O3 exposure are shown to            Intercontinental transport means future O3 concentrations in
decrease vegetation productivity and biomass, with conse-           Europe will be partly dependent on how O3 precursor emis-
quences for terrestrial carbon sequestration (Felzer et al.,        sions evolve globally (Auvray and Bey, 2005; Derwent et al.,
2004; Loya et al., 2003; Mills et al., 2011b; Sitch et al.,         2015).
2007). Few studies, however, consider the simultaneous ef-             Rising background O3 concentrations impact agricultural
fects of exposure to both gases, and few Earth system mod-          yields and nutritional quality of major crops (Ainsworth et
els (ESMs) currently explicitly consider the role of tropo-         al., 2012; Avnery et al., 2011), with consequences for global
spheric O3 in terrestrial carbon dynamics (IPCC, 2013), both        food security (Tai et al., 2014). Increasing background lev-
of which are important in understanding the carbon seques-          els of O3 are damaging to ecosystem health and reduce the
tration potential of the land surface and future carbon dynam-      global land carbon sink (Arneth et al., 2010; Sitch et al.,
ics regionally and globally (Le Quéré et al., 2016; Sitch et al.,   2007). Reduced uptake of carbon by plant photosynthesis
2015).                                                              due to O3 damage allows more CO2 to remain in the atmo-
   Due to increased anthropogenic precursor emissions over          sphere. This effect of O3 on plant physiology represents an
the industrial period, background concentrations of ground-         additional climate warming to the direct radiative forcing of
level O3 have risen (Vingarzan, 2004). Background O3 is             O3 , a potent greenhouse gas (Collins et al., 2010; Sitch et
generally defined as the O3 pollution present in a region that      al., 2007), the magnitude of which, however, remains highly
is not attributed to local anthropogenic sources (Vingarzan,        uncertain (IPCC, 2013).
2004). O3 levels at the start of the 20th century are estimated        Dry deposition of O3 to terrestrial surfaces, primarily up-
to be around 10 ppb for the Montsouris Observatory site near        take by stomata on plant foliage and deposition on external
Paris, data for Arkona on the Baltic coast increased from ca.       surfaces of vegetation (Fowler et al., 2001, 2009), is a large
15 ppb in the 1950s to 20–27 ppb by the early 1980s, and            sink for ground-level O3 (Wild, 2007; Young et al., 2013). On
the Irish coast site Mace Head shows around 40 ppb by the           entry to sub-stomatal spaces, O3 reacts with other molecules
year 2000 (Logan et al., 2012; Parrish et al., 2012). Present-      to form reactive oxygen species (ROS). Plants can tolerate a
day annual average background O3 concentrations reported            certain level of O3 depending on their capacity to scavenge
in the review of Vingarzan (2004) show O3 concentrations            and detoxify the ROS (Ainsworth et al., 2012). Above this
range between approximately 20 and 45 ppb, with the great-          critical level, long-term chronic O3 exposure reduces plant
est increase occurring since the 1950s. Trends vary from            photosynthesis and biomass accumulation (Ainsworth, 2008,
site to site though, even on a decadal basis (Logan et al.,         2012; Matyssek et al., 2010a; Wittig et al., 2007, 2009), ei-
2012; Simpson et al., 2014b), depending, for example, on lo-        ther directly through effects on photosynthetic machinery
cal/regional trends in precursor (especially NOx ) emissions,       such as reduced Rubisco content (Ainsworth et al., 2012;
elevation and exposure to long-range transport of O3 . Nev-         Wittig et al., 2009) and/or indirectly by reduced stomatal
ertheless, there is some indication that background O3 levels       conductance (gs ) (Kitao et al., 2009; Wittig et al., 2007), al-
over the mid-latitudes of the Northern Hemisphere have con-         ters carbon allocation to different pools (Grantz et al., 2006;
tinued to rise at a rate of approximately 0.5–2 % per year,         Wittig et al., 2009), accelerates leaf senescence (Ainsworth,

Biogeosciences, 15, 4245–4269, 2018                                                      www.biogeosciences.net/15/4245/2018/
R. J. Oliver et al.: Large but decreasing effect of ozone on the European carbon sink                                        4247

2008; Nunn et al., 2005; Wittig et al., 2009) and changes         tivity both within and among species (Karnosky et al., 2007;
plant susceptibility to biotic stress factors (Karnosky et al.,   Kubiske et al., 2007; Wittig et al., 2009). Additionally, other
2002; Percy et al., 2002).                                        environmental stresses that affect stomatal behaviour will af-
   The response of plants to O3 is very wide-ranging as re-       fect the rate of O3 uptake and therefore the response to O3
ported in the literature from different field studies. The Wit-   exposure, such as high temperature, drought and changing
tig et al. (2007) meta-analysis of temperate and boreal tree      concentrations of atmospheric CO2 (Mills et al., 2016; Fag-
species showed that raised O3 concentrations significantly        nano et al., 2009; Kitao et al., 2009; Löw et al., 2006). In-
reduced leaf-level light-saturated net photosynthetic uptake      creasing concentrations of atmospheric CO2 , for example,
(−19 %, range: −3 to −28 % at a mean O3 concentration             are suggested to provide some protection against O3 damage
of 85 ppb) and gs (−10 %, range: +5 to −23 % at a mean            by causing stomata to close (Harmens et al., 2007; Wittig et
O3 concentration of 91 ppb) in both broadleaf and needle-         al., 2007); however the long-term effects of CO2 fertilisation
leaf tree species. In the Feng et al. (2008) meta-analysis of     on plant growth and carbon storage remain uncertain (Baig et
wheat, O3 reduced aboveground biomass (−18 % at a mean            al., 2015; Ciais et al., 2013). Further, in some studies, stomata
O3 concentration of 70 ppb) photosynthetic rate (−20 % at         have been shown to respond sluggishly, losing their respon-
a mean O3 concentration of 73 ppb) and gs (−22 % at a             siveness to environmental stimuli with exposure to O3 , which
mean O3 concentration of 79 ppb). One of few long-term            can lead to higher O3 uptake, increased water loss and there-
field-based O3 exposure studies (AspenFACE) showed that           fore greater vulnerability to environmental stresses such as
after 11 years of exposing mature trees to O3 (mean O3            drought (Mills et al., 2009, 2016; Paoletti and Grulke, 2010;
concentration of 46 ppb), O3 decreased ecosystem carbon           Wilkinson and Davies, 2009).
content (−9 %) and decreased NPP (−10 %), although the               Given the critical role gs plays in the uptake of both CO2
O3 effect decreased through time (Talhelm et al., 2014).          and O3 , we use an alternative representation and parame-
Zak et al. (2011) showed this was partly due to a shift in        terisation of gs in JULES by implementing the Medlyn et
community structure as O3 -tolerant species, competitively        al. (2011) gs formulation. This model is based on the op-
inferior in low-O3 environments, outcompeted O3 -sensitive        timal theory of stomatal behaviour and has advantages over
species. Gross primary productivity (GPP) was reduced (−12        the current JULES gs formulation of Jacobs (1994) including
to −19 %) at two Mediterranean ecosystems exposed to O3           (i) a single parameter (g1 ) compared to two parameters in Ja-
(ranging between 20 and 72 ppb across sites and through the       cobs (1994), (ii) the g1 parameter is related to the water-use
year) studied by Fares et al. (2013). Biomass of mature beech     strategy of vegetation and is easier to parameterise with com-
trees was reduced (−44 %) after 8 years of exposure to O3         monly measured leaf- or canopy-level observations of photo-
(∼ 150 ppb) (Matyssek et al., 2010a). After 5 years of O3         synthesis, gs , and humidity, and (iii) values of g1 are avail-
exposure (ambient +20 to +40 ppb) in a semi-natural grass-        able for many different PFTs derived from a global dataset
land, annual biomass production was reduced (−23 %), and          of leaf-level measurements (Lin et al., 2015).
in a Mediterranean annual pasture O3 exposure significantly          The main objective of this work is to assess the impact
reduced total aboveground biomass (up to −25 %) (Calvete-         of historical and projected (1901 to 2050) changes in tropo-
Sogo et al., 2014). However, these were empirical studies at      spheric O3 and atmospheric CO2 concentration on predicted
individual sites, and these focus on O3 effects on plant phys-    GPP and the land carbon sink for Europe. These are the two
iology and productivity but do not quantify the impact on         greenhouse gases that directly affect plant photosynthesis
the land carbon sink. Modelling studies are needed to scale       and gs . We use a factorial suite of model experiments, using
site observations to the regional and global scales. Models       the Joint UK Land Environment Simulator (JULES) (Best et
generally suggest that plant productivity and carbon seques-      al., 2011; Clark et al., 2011) and the land surface model of the
tration will decrease with O3 pollution, though the magni-        UK Earth System Model (UKESM) (Collins et al., 2011) to
tudes vary. For example, based on a limited dataset to pa-        simulate plant O3 uptake and damage and to investigate the
rameterise plant O3 damage for a global set of plant func-        impact of both O3 and CO2 on plant water use and carbon
tional types (PFTs), Sitch et al. (2007) predicted a decline in   uptake. In this work, the JULES model is recalibrated using
global GPP of 14 to 23 % by 2100. A second study by Lom-          the latest observations of vegetation sensitivity to O3 , with
bardozzi et al. (2015) predicted a 10.8 % decrease in present-    the addition of a separate parameterisation for temperate and
day (2002–2009) GPP globally. Here we take a regional ap-         boreal regions versus the Mediterranean. The O3 sensitivity
proach and take advantage of the latest measurements show-        of each PFT in JULES was recalibrated for both a high and
ing changes in plant productivity with accumulated exposure       low sensitivity to account for uncertainty in the O3 response,
to O3 specifically for a range of European vegetation from        in part due to the observed variation in O3 sensitivity among
different regions (CLRTAP, 2017) with which to calibrate the      species. This includes O3 sensitivities for agricultural crops
JULES model for plant sensitivity to O3 , and we conduct our      (wheat – high sensitivity) versus natural grassland (low sen-
analysis specifically for the European region.                    sitivity), with separate sensitivities for Mediterranean grass-
   Understanding the response of plants to elevated tropo-        lands. For forests JULES is parameterised with O3 sensitiv-
spheric O3 is challenged by the large variation in O3 sensi-      ities for broadleaf and needleleaf trees (with a high and low

www.biogeosciences.net/15/4245/2018/                                                     Biogeosciences, 15, 4245–4269, 2018
4248 R. J. Oliver et al.: Large but decreasing effect of ozone on the European carbon sink
O3 sensitivity for both), with separate sensitivities (high and To simulate the effects of stomatal O3 deposition on veg-
low) for Mediterranean broadleaf species. We make a sepa- etation productivity and water use, JULES uses the flux-
rate distinction for the Mediterranean region where possible gradient approach of Sitch et al. (2007), modified to include
because the work of Büker et al. (2015) showed that the sen- non-stomatal deposition following Tuovinen et al. (2009). A
sitivity of dominant Mediterranean trees to O3 is different similar approach is taken by Franz et al. (2017) in the OCN
from temperate species. In addition, we introduce an alter- model; however plant O3 damage is a function of accumu-
native gs scheme into JULES as described above. JULES is lated O3 exposure over time. In JULES, plant O3 damage is
forced with spatially varying daily O3 concentrations from instantaneous because the impact of cumulative O3 exposure
a high-resolution atmospheric chemistry model for Europe on plant productivity has already been calibrated with obser-
that are disaggregated to hourly concentrations; therefore our vations (described below). JULES uses a coupled model of
simulations account for diurnal variations in O3 concentra- gs and photosynthesis; the potential net photosynthetic rate
tion and O3 responses, allowing for improved estimates of (Ap , mol CO2 m−2 s−1 ) is modified by an “O3 uptake” fac-
O3 uptake by vegetation. We do not attempt to make a full as- tor (F the fractional reduction in photosynthesis), so that the
sessment of the carbon cycle of Europe, instead we target O3 actual net photosynthesis (Anet , mol CO2 m−2 s−1 ) is given
damage, which is currently a missing component in earlier by Eq. (1) (Clark et al., 2011; Sitch et al., 2007). Because of
carbon cycle assessments (Le Quéré et al., 2018; Sitch et al., the relationship between these two fluxes, the direct effect of
2015). To this end, we prescribe changing O3 and CO2 con- O3 damage on photosynthetic rate also leads to a reduction
centrations from 1901 to 2050 but using a fixed pre-industrial in gs . An alternative approach was taken by Lombardozzi et
climate. We acknowledge the use of a “fixed” pre-industrial al. (2012) in the CLM model in which photosynthesis and
climate omits the additional uncertainty of the interaction be- gs are decoupled, so that O3 exposure affects carbon assim-
tween climate change and gs , which will affect the rate of O3 ilation and transpiration independently. In JULES, changes
uptake and therefore O3 concentrations. In addition, using in atmospheric CO2 concentration also affect photosynthetic
uncoupled chemistry and climate is a further source of uncer- rate and gs ; consequently the interactive effects of changing
tainty. To understand the impact of these complex feedback concentrations of both CO2 and O3 are allowed for.
mechanisms is an important area for future work, but in the
current study our aim is to isolate the physiological response Anet = Ap F (1)
of plants to both O3 and CO2 and determine the sensitivity The O3 uptake factor (F ) is defined as
of predicted GPP and the land carbon sink to this process, as
the impact of O3 on the land carbon sink currently remains F = 1 − a · max FO3 − FO3 crit , 0.0 . (2)
largely unknown at large spatial scales for Europe. FO3 is the instantaneous leaf uptake of O3 (nmol m−2 s−1 ),
FO3 crit is a PFT-specific threshold for O3 damage
2 Methods (nmol m−2 PLA s−1 , projected leaf area) and “a” is a PFT-
specific parameter representing the fractional reduction of
2.1 Representation of O3 effects in JULES photosynthesis with O3 uptake by leaves. Following Tuovi-
nen et al. (2009), the flux of O3 through stomata, FO3 crit , is
JULES calculates the land–atmosphere exchanges of heat, represented as follows:
energy, mass, momentum and carbon on a sub-daily time
gb KgOl
step, and includes a dynamic vegetation model (Best et al.,
2011; Clark et al., 2011; Cox, 2001). This work uses JULES FO3 = O3 3 . (3a)
version 3.3 (http://www.jchmr.org, last access: 10 September gb + KgOl + gext
3
2017) at a 0.5◦ × 0.5◦ spatial resolution and hourly model
O3 is the molar concentration of O3 at reference (canopy)
time step; the spatial domain is shown in Fig. S1 in the Sup-
level (nmol m−3 ), gb is the leaf-scale boundary layer con-
plement. JULES has a multilayer canopy radiation intercep-
ductance (m s−1 , Eq. 3b), gl is the leaf conductance for wa-
tion and photosynthesis scheme (10 layers in this instance)
ter (m s−1 ), KO3 accounts for the different diffusivity of
that accounts for direct and diffuse radiation, sun fleck pen-
ozone to water vapour and takes a value of 1.51 after Mass-
etration through the canopy, inhibition of leaf respiration in
man (1998), and gext is the leaf-scale non-stomatal deposi-
the light and change in photosynthetic capacity with depth
tion to external plant surfaces (m s−1 ), which takes a con-
into the canopy (Clark et al., 2011; Mercado et al., 2009).
stant value of 0.0004 m s−1 after Tuovinen et al. (2009). The
Soil water content also affects the rate of photosynthesis and
leaf-level boundary layer conductance (gb ) is calculated as in
gs . It is modelled using a dimensionless soil water stress fac-
Tuovinen et al. (2009).
tor, β, which is related to the mean soil water concentration
in the root zone, and the soil water contents at the critical and gb = αLd−1/2 U −1/2 (3b)
wilting points (Best et al., 2011).
α is a constant (0.0051 m s−1/2 ), Ld is the cross-wind leaf
dimension (m) defined per PFT as 0.05 for trees, 0.02 for
Biogeosciences, 15, 4245–4269, 2018 www.biogeosciences.net/15/4245/2018/R. J. Oliver et al.: Large but decreasing effect of ozone on the European carbon sink 4249
grasses (C3 and C4 ), and 0.04 for shrubs and U is wind speed brate each JULES PFT for sensitivity to O3 by reproducing
at canopy height (m s−1 ). The rate of O3 uptake is dependent the observation-based O3 dose–response relationships.
on gs , which is dependent on photosynthetic rate. Given gs Each PFT was calibrated for high and low plant O3 sen-
is a linear function of photosynthetic rate in JULES (Clark et sitivity to account for uncertainty in the sensitivity of dif-
al., 2011), from Eq. (1) it follows that ferent plant species to O3 , using the approach of Sitch et
al. (2007). Therefore, when using our results to assess the
gs = gl F. (4) impact of O3 at the land surface, we are able to provide a
range in our estimates to help address some of the uncer-
The O3 flux to stomata, FO3 , is calculated at leaf level and tainty in the O3 response of different vegetation types. In ad-
then scaled to each canopy layer differentiating sunlit and dition, where possible owing to available data, a distinction
shaded leaf photosynthesis, and is finally summed up to the was made for Mediterranean regions. This was because the
canopy level. Because the photosynthetic capacity, photosyn- work of Büker et al. (2015) showed that different O3 dose–
thesis and therefore gs decline with depth into the canopy, response relationships are needed to describe the O3 sensi-
this in turn affects O3 uptake, with the top leaf level con- tivity of dominant Mediterranean trees. For the C3 herba-
tributing most to the total O3 flux and the lowest level con- ceous PFT, the dominant land cover type across the Euro-
tributing least. pean domain in this study (Fig. S2), the high plant O3 sen-
sitivity was calibrated against observations for wheat to give
2.2 Calibration of O3 uptake model a representation of agricultural regions and wheat is one of
the most sensitive grasses to O3 (Fig. S3, Table S1). For
Here we use the latest literature on flux-based O3 dose– the low plant O3 sensitivity JULES was calibrated against
response relationships derived from observed field data the dose–response function for natural grassland to give a
across Europe (CLRTAP, 2017) to determine the key PFT- representation of natural grassland and this vegetation has a
specific O3 sensitivity parameters in JULES (a and FO3 crit ). much lower sensitivity to O3 damage; for the Mediterranean
Synthesis of information expressed as O3 flux-based dose– region we used a function for Mediterranean natural grass-
response relationships derived from field experiments is car- lands, all taken from CLRTAP (2017) (Fig. S3, Table S1 in
ried out by the United Nations Convention on Long-Range the Supplement). Tree–shrub PFTs were calibrated against
Transboundary Air Pollution (CLRTAP), this information is observed O3 dose–response functions for the high plant O3
then used as a policy tool to inform emission reduction strate- sensitivity: broadleaf trees (temperate–boreal): birch–beech
gies in Europe to improve air quality (CLRTAP, 2017; Mills dose–response relationship; broadleaf trees (Mediterranean):
et al., 2011a). Derivation of O3 flux-based dose–response re- deciduous oak dose–response relationship; needleleaf trees:
lationships for different vegetation types uses the accumu- Norway spruce dose–response relationship; shrubs: birch–
lated stomatal O3 flux above a threshold (often referred to as beech dose–response relationship; all from CLRTAP (2017)
the phytotoxic O3 dose above a threshold of “y” i.e. PODy ) (Fig. S3, Table S1). Data on O3 dose–response relationships
as the dose metric, and the percentage change in biomass as for different vegetation types is very limited; therefore for
the response metric (Emberson et al., 2007; Karlsson et al., the low plant O3 sensitivity calibration for trees–shrubs we
2007). We use these observation-based O3 dose–response re- assumed a 20 % decrease in sensitivity to O3 based on the dif-
lationships to calibrate each JULES PFT for sensitivity to O3 ference in sensitivity between high- and low-sensitivity tree
using available relationships for the closest matching vegeta- species in the Karlsson et al. (2007) study. Due to limita-
tion type. For JULES, FO3 crit is the threshold for O3 dam- tions in data availability, the shrub parameterisation uses the
age, and values for this parameter are taken from the O3 observed dose–response functions for broadleaf trees. Sim-
dose–response relationships as the PODy value (see CLR- ilarly, the parameterisation for C4 herbaceous uses the ob-
TAP, 2017, and Büker et al., 2015, for derivation of PODy served dose–responses for C3 herbaceous; however the frac-
values). The actual sensitivity to O3 is determined by the tional cover of C4 herbs across Europe is low (Fig. S2), so
slope of the O3 dose–response relationship, i.e. how much this assumption affects a very small percentage of land cover.
biomass changes with accumulated stomatal uptake of O3 To calibrate the JULES O3 uptake model, JULES was run
above the damage threshold; this relates to the parameter a across Europe forced using the WFDEI observational climate
in JULES. The parameter a is a PFT-specific parameter rep- dataset (Weedon, 2013) at 0.5◦ × 0.5◦ spatial and 3 h tempo-
resenting the fractional reduction of photosynthesis with O3 ral resolution. JULES uses interpolation to disaggregate the
uptake by leaves. Values for this parameter are found for each forcing data down from 3 h to an hourly model time step.
PFT by running JULES with different values of a, which al- The model was spun up over the period from 1979 to 1999
ter the instantaneous photosynthetic rate, but then calculat- with a fixed atmospheric CO2 concentration of 368.33 ppm
ing the accumulated stomatal flux of O3 and the change in (1999 value from Mauna Loa observations; Tans and Keel-
productivity until the slope of this relationship produced by ing, 2014). Zero tropospheric ozone concentration was as-
the JULES simulations matches that of the O3 dose–response sumed for the control simulation. For the simulations with
relationships derived from observations. Essentially we cali- O3 , spin-up used spatially explicit fields of present-day O3
www.biogeosciences.net/15/4245/2018/ Biogeosciences, 15, 4245–4269, 20184250 R. J. Oliver et al.: Large but decreasing effect of ozone on the European carbon sink
concentration produced using the UK Chemistry and Aerosol In this parameterisation, ci is unknown and in the default
(UKCA) model with standard chemistry from the run eval- JULES model is calculated as in Eq. (6), hereafter called
uated by O’Connor et al. (2014). A fixed land cover map JAC:
was used based on IGBP (International Geosphere-Biosphere
dq
Programme) land cover classes (IGBP-DIS). Therefore as the ci = (ca − c∗ ) f0 1 − + c∗ . (6)
vegetation distribution was fixed and the calibration was not dqcrit
looking at carbon stores, a short spin-up time was adequate β is a soil moisture stress factor, the factor 1.6 accounts for
to equilibrate soil temperature and soil moisture. JULES was gs being the conductance for water vapour rather than CO2 ,
then run for the year 2000 with a corresponding CO2 concen- R is the universal gas constant (J K−1 mol−1 ), Tl is the leaf
tration of 369.52 ppm (from Mauna Loa observations; Tans surface temperature (K), ca and ci (both Pa) are the leaf sur-
and Keeling, 2014) and monthly fields of spatially explicit face and internal CO2 partial pressures, respectively, c∗ (Pa)
tropospheric O3 (O’Connor et al., 2014) as necessary. is the CO2 photorespiration compensation point, dq is the hu-
Calibration was performed using four simulations: with midity deficit at the leaf surface (kg kg−1 ), dqcrit (kg kg−1 )
(i) zero tropospheric O3 concentration, as the control sim- and f0 are PFT-specific parameters representing the critical
ulation (control), (ii) tropospheric O3 at the current ambi- humidity deficit at the leaf surface, and the leaf internal-to-
ent concentration (O3 ), (iii) ambient +20 ppb (O3 + 20) and atmospheric CO2 ratio (ci /ca ) at the leaf specific humidity
(iv) ambient +40 ppb (O3 + 40). The different O3 simula- deficit (Best et al., 2011); values are shown in Table S1.
tions (i.e. O3 , O3 + 20 and O3 + 40) were used to capture the In this work, we replace Eq. (6) with the closure described
range of O3 conditions in the data used in the observation- in Medlyn et al. (2011), using the key PFT-specific model
based O3 dose–response relationships used in this study for parameter g1 (kPa0.5 ), and dq is expressed in kilopascals,
calibration. Often data were from experiments using artifi- shown in Eq. (7), hereafter called MED:
cially manipulated conditions of ambient +40 ppb O3 , for
example. For each JULES O3 simulation, the value of FO3 crit
g1
was taken from the vegetation-specific O3 dose–response re- ci = ca √ . (7)
g1 + dq
lationship as the threshold O3 concentration above which
damage to vegetation occurs. An initial estimate of the pa- PFT-specific values of the g1 parameter were derived for
rameter a was used. Then for each PFT and each simula- European vegetation from the database of Lin et al. (2015)
tion, hourly estimates of NPP (our proxy for biomass – al- and are shown in Table S1. The g1 parameter represents the
though not identical, they are related) and O3 uptake in ex- sensitivity of gs to the assimilation rate, i.e. plant water use
cess of FO3 crit were accumulated over a PFT-dependent accu- efficiency, and was derived as in Lin et al. (2015) by fitting
mulation period. The accumulation periods were ∼ 6 months the Medlyn et al. (2011) model to observations of gs , pho-
for broadleaf trees and shrubs, all year for needleleaf trees tosynthesis, and vapour pressure deficit (VPD), assuming an
and ∼ 3 months for herbaceous species, through the growing intercept of zero.
season, following guidelines in CLRTAP (2017). Addition- The impact of gs model formulation (JAC versus MED)
ally, in accordance with the methods used in CLRTAP (2017) on simulated water, O3 , carbon and energy fluxes is com-
that describe how the O3 dose–response relationships are de- pared for two contrasting grid points – wet (low soil mois-
rived from observations, we use the stomatal O3 flux per ture stress) and dry (high soil moisture stress) in the Euro-
projected leaf area to top canopy sunlit leaves. The percent- pean domain. JULES was spun up for 20 years (1979–1999)
age change in total NPP was calculated for each O3 simu- at two grid points in central Europe representing a wet (low
lation and plotted against the cumulative uptake of O3 over soil moisture stress; lat: 48.25, long: 5.25) and a dry site (high
the PFT-specific accumulation period. The linear regression soil moisture stress; lat: 38.25, long: −7.75). The modelled
of this relationship was calculated, and slope and intercept soil moisture stress factor (fsmc) at the wet site ranged from
were compared against the slope and intercept of the ob- 0.8 to 1.0 over the year 2000 (1.0 indicates no soil moisture
served dose–response relationships. Values of the parameter stress), and at the dry site fsmc steadily declined from 0.8
a were adjusted, and the procedure was repeated until the lin- at the start of the year to 0.25 by the end of the summer.
ear regression through the simulation points matched that of The WFDEI meteorological forcing dataset (Weedon, 2013),
the observations (Fig. S3, Table S1). along with atmospheric CO2 concentration for the year 1999
(368.33 ppm), was used and either no O3 (i.e. the O3 dam-
2.3 Representation of stomatal conductance and age model was switched off) for the control simulations or
site-level evaluation spatially explicit fields of present-day O3 concentration pro-
duced using the UK Chemistry and Aerosol (UKCA) model
In JULES, gs (m s−1 ) is represented following the closure from the run evaluated by O’Connor et al. (2014) for the
proposed by Jacobs (1994): simulations with O3 were used. Following the spin-up pe-
Anet β riod, JULES was run for 1 year (2000) with corresponding
gs = 1.6RTl . (5) atmospheric CO2 concentration, and tropospheric O3 con-
ca − ci
Biogeosciences, 15, 4245–4269, 2018 www.biogeosciences.net/15/4245/2018/R. J. Oliver et al.: Large but decreasing effect of ozone on the European carbon sink 4251
centrations as described above. The control and O3 simula-
tions were performed for both JAC and MED model formu-
lations. Land cover for the spin-up and main run was fixed
at 20 % for each PFT. For the simulations including O3 dam-
age, the high plant O3 sensitivity parameterisation was used.
The difference between these simulations was used to assess
the impact of gs model formulation on the leaf-level fluxes of
carbon and water. We calculate and report (results Sect. 3.1)
the difference in mean annual water use that results from the
above simulations using the different gs models. For each
day of the simulation we calculate the percentage difference
in water use between the two simulations; we then calculate
the mean and standard deviation over the year to give the an-
Figure 1. Regional time series of canopy height O3 (ppb) forcing
nual mean leaf-level water use. from EMEP (a–c) and (d) global atmospheric CO2 (ppm) concen-
Site-level evaluation of the two gs models compared to tration (this does not vary regionally; black dots show data points;
FLUXNET observations was carried out to evaluate the sea- the black line shows interpolated points). Each panel for the O3
sonal cycles of latent and sensible heat using the two gs forcing shows the regional annual average (woody PFTs, black solid
models JAC and MED compared to observations. Seven line; herbaceous PFTs, black dashed line) and the annual maximum
FLUXNET towers were selected to represent a range of land O3 concentration above: woody PFTs (red) and herbaceous PFTs
cover types as shown in Table S2. JULES was set up for (blue).
each site using observed site-level hourly meteorology, and
the vegetation cover was prescribed according to the frac-
tional covers of the different JULES surface types shown in such and not outcompeted by forests, for example, allow-
Table S2. Following a spin-up period, simulations were run ing for a more accurate representation of the land cover of
at each site for the years shown in Table S2. Europe in the model. No form of land management is sim-
ulated (i.e. no crop harvesting, ploughing, rotation or graz-
2.4 Model simulations for Europe ing); growth and leaf area index (LAI) are determined by re-
source availability and phenology. Outside of the agricultural
2.4.1 Forcing datasets mask, dynamic vegetation means that grid cell PFT coverage
and LAI are the result of resource availability, phenology and
We used the WATCH meteorological forcing dataset (Wee- simulated competition. Across the model domain, simulated
don et al., 2010, 2011) at 0.5◦ × 0.5◦ spatial and 3 h temporal mean annual LAI was dominantly within the range of 2 to
resolution for our JULES simulations. JULES interpolates 5 m2 m−2 (Figs. S4 and S5). Following a full spin-up period
this down to an hourly model time step. For this study, the (to ensure equilibrium vegetation, carbon and water states),
climate was kept constant by recycling over the period from there was no significant change in the fractional cover of each
1901 to 1920 to allow us to focus on the impact of O3 , CO2 PFT over the simulation period (1901–2050). By 2050, in-
and their interactive effects. creases in boreal forest cover occurred, but this was less than
JULES was run with prescribed annual mean atmo- 2 % and limited to very small areas; given this small change
spheric CO2 concentrations. Pre-industrial global CO2 con- we show just the land cover for 2050 in Fig. S2.
centrations for 1900 to 1960 were taken from Etheridge et Tropospheric O3 concentration was produced by the
al. (1996), for 1960 to 2002 were from Mauna Loa (Keel- EMEP MSC-W model at 0.5◦ × 0.5◦ resolution (Simpson et
ing and Whorf, 2004), as calculated by the Global Carbon al., 2012), driven with meteorology from the regional cli-
Project (Le Quéré et al., 2016), and for 2003–2050 were mate model RCA3 (Kjellström et al., 2011; Samuelsson et
based on the IPCC SRES A1B scenario and were linearly al., 2011), which provides a downscaling of ECHAM A1B-
interpolated to gap-fill missing years (Fig. 1). r3 (simulation 11 of Kjellström et al., 2011). This set-up
JULES was run including dynamic vegetation with a (EMEP + RCA3) is also used by Langner et al. (2012a),
land cover mask giving the fraction of agriculture in each Simpson et al. (2014a), Tuovinen et al. (2013), Franz et
0.5◦ × 0.5◦ grid cell based on the Hurtt et al. (2011) land al. (2017) and Engardt et al. (2017), in which further details
cover database for the year 2000. The agricultural mask is and model evaluation can be found. Unfortunately, the three-
fixed and does not change over the simulation period. This dimensional RCA3 data needed by the EMEP model were
means that whilst the model is allowed to evolve its own not available prior to 1960, but as in Engardt et al. (2017)
vegetation cover outside of the agricultural mask, within the the meteorology of 1900–1959 had to be approximated by
mask only C3 and C4 herbaceous PFTs are allowed to grow, assigning random years from 1960 to 1969. This procedure
with no competition from other PFTs. Therefore, through the introduces some uncertainty of course, although Langner et
simulation period, regions of agriculture are maintained as al. (2012b) show that for the period from 1990 to 2100 it
www.biogeosciences.net/15/4245/2018/ Biogeosciences, 15, 4245–4269, 20184252 R. J. Oliver et al.: Large but decreasing effect of ozone on the European carbon sink
is emissions change, rather than meteorological change, that ing over the past decades, however, attributed to changes in
drives modelled O3 concentrations. The emissions scenar- NOx and other emissions, as well as changes in transport pat-
ios for 1900–2050 merge data from the International Insti- terns (Parrish et al., 2013). These changes will likely con-
tute of Applied System Analysis (IIASA) for 2005–2050 tinue in the future as emissions and meteorological factors
(the so-called ECLIPSE 4a scenario), recently revised EMEP impact photochemical O3 production and transport patterns.
data for 1990 and a scaling back from 1990 to 1900 using Indeed, the O3 concentrations used in the simulations in this
data from Lamarque et al. (2013). The trend in emissions study show increased O3 levels in winter and in some regions
of the major O3 precursors NOx , non-methane volatile or- in autumn and spring in 2050 compared to present day, which
ganic compounds (NMVOCs) and isoprene are shown from may be due to reduced titration of O3 by NO as a result of
1900 to 2050 over Europe in Fig. S6. Isoprene emissions reduced NOx emissions in the future (Royal Society, 2008).
are not inputs to the EMEP model, but rather calculated at Summer O3 concentrations are lower in 2050, however, com-
each time step using temperature, radiation and land-cover- pared to 2001.
specific emission factors (Simpson et al., 2012). Changes
in the assumed background concentration of CH4 (from 2.4.2 Spin-up and factorial experiments
RCP6.0) (van Vuuren et al., 2011) are also shown in Fig. S6.
Engardt et al. (2017) show the trend in emissions of SO2 and JULES was spun up by recycling the climate from the early
NH3 from 1900 to 2050 over Europe. The EMEP model ac- part of the twentieth century (1901 to 1920) using atmo-
counts for changes in biogenic volatile organic compound spheric CO2 (296.1 ppm) and O3 concentrations from 1901
(BVOC) emissions as a result of predicted ambient tempera- (Figs. S7 and S8). Model spin-up was 2000 years by which
ture changes. point the carbon pools and fluxes were in steady state with
O3 concentrations from EMEP MSC-W were calculated zero mean net land–atmosphere CO2 flux. We performed the
at canopy height for two land cover categories: forest and following transient simulations for the period from 1901 to
grassland (Figs. S7 and S8), which are taken as surrogates for 2050 with continued recycling of the climate as used in the
high and low vegetation, respectively. These canopy-height- spin-up, for both high and low plant O3 sensitivities:
specific concentrations allow for the large gradients in O3 – run_O3 : fixed 1901 CO2 , varying O3 ;
concentration that can occur in the lowest tens of metres,
giving lower O3 for grasslands than seen at 20 m in a for- – run_CO2 : varying CO2 , fixed 1901 O3 ;
est canopy, for example (Gerosa et al., 2017; Simpson et al.,
– run_both_CO2 +O3 : varying CO2 , varying O3 .
2012; Tuovinen et al., 2009). These canopy-level O3 concen-
trations are used as input to JULES, using the EMEP O3 con- We use these simulations to investigate the direct effects of
centrations for forest for the forest JULES PFTs (broadleaf or changing atmospheric CO2 and O3 concentrations, individu-
needleleaf, tree and shrub), and the EMEP O3 concentrations ally and combined, on plant water use, GPP and the land C
for grassland for the grass–herbaceous JULES PFTs (C3 and sink through the twentieth century and into the future, specif-
C4 ). This study used daily mean values of tropospheric O3 ically over three time periods: historical (1901–2001), future
concentration from EMEP disaggregated down to the hourly (2001–2050) and over the full time series (1901–2050). For
JULES model time step. The daily mean O3 forcing was dis- each time period we calculate the difference between the
aggregated to follow a mean diurnal profile of O3 , which was decadal means calculated at the start and end of the anal-
generated from hourly O3 output from EMEP MSC-W for ysis period for each variable of interest. Therefore our re-
the two land cover categories (forest and grassland as de- sults report the change in GPP, for example, over the anal-
scribed above) across the same model domain. O3 concentra- ysis period. For each variable analysed (GPP, NPP, vegeta-
tions follow a diurnal cycle and peak during the day; there- tion carbon, soil carbon, total land carbon and gs ), we use
fore accounting for the diurnal variation in O3 concentrations the mean over 10 years to represent each time period, e.g.
allows for a more realistic estimation of O3 uptake. the mean over 2040 to 2050 is what we call 2050, and 1901
Figure 1 shows large increases in tropospheric O3 from to 1910 is what we refer to as 1901. The difference among
pre-industrial to present day (2001), which is in line with the simulations gives the effect of O3 and CO2 either sep-
modelling studies (Young et al., 2013) and site observations arately or in combination over the different time periods.
(Derwent et al., 2008; Logan et al., 2012; Parrish et al., We look at the percentage change due to either O3 at pre-
2012), and is predominantly a result of increasing anthro- industrial CO2 concentration (i.e. without the additional ef-
pogenic emissions (Young et al., 2013). Figures S7 and S8 fect of atmospheric CO2 on stomatal behaviour – run_O3 ),
show this large increase in ground-level O3 concentrations CO2 (at fixed pre-industrial O3 concentration, run_CO2 ) or
from 1901 to 2001 occurs in all seasons. Present-day O3 the combined effect of both gases (run_both_CO2 +O3 ), e.g.
concentration shows a strong seasonal cycle, with a spring– 100 · (varO3 [2050]–varO3 [1901])/varO3 [1901] gives the O3
summer peak in concentrations in the mid-latitudes of the effect (at fixed CO2 ) over the full experimental period. The
Northern Hemisphere (Derwent et al., 2008; Parrish et al., meteorological forcing is prescribed in these simulations and
2012; Vingarzan, 2004). Seasonal cycles have been chang- is therefore the same among the model runs. Other climate
Biogeosciences, 15, 4245–4269, 2018 www.biogeosciences.net/15/4245/2018/R. J. Oliver et al.: Large but decreasing effect of ozone on the European carbon sink 4253
factors, such as VPD, temperature and soil moisture avail- Site-level evaluation of the seasonal cycles of latent and
ability are accounted for in our simulations, but our analysis sensible heat with both JAC and MED models compared to
isolates the effects of O3 , CO2 and O3 + CO2 . We also use a FLUXNET observations showed in general the MED model
paired t test to determine statistically significant differences improved the seasonal cycle of both fluxes (lower RMSE),
between the different (high and low) plant O3 sensitivities. but the magnitude of this varied from site to site (Fig. S13).
At the deciduous broadleaf site, US-UMB, MED resulted in
2.4.3 Evaluation improvements of the simulated seasonal cycle particularly in
the summer months for both fluxes (RMSE decreased from
To evaluate our JULES simulations we compare mean GPP 42.7 and 31.5 to 38.5 and 28.0 W m−2 for latent and sensible
from 1991 to 2001 for each of the JULES scenarios and both heat, respectively). At the second deciduous broadleaf site
high and low plant O3 sensitivities against the observation- IT-CA1, however, there was almost no difference between
based globally extrapolated Flux Network model tree ensem- the two gs models. Both evergreen needleleaf forest sites (FI-
ble (MTE) (Jung et al., 2011). We use a paired t test to de- Hyy and DE-Tha) saw improvements in the simulated sea-
termine statistically significant differences in the mean re- sonal cycles of latent and sensible heat with the MED model,
sponses. primarily as a result of lower latent heat flux in the spring
and summer months and higher sensible heat flux over the
3 Results same period. At FI-Hyy, RMSE decreased from 10.1 and 7.4
to 6.7 and 6.7 W m−2 for latent and sensible heat, respec-
3.1 Impact of gs model formulation and site-level tively, and at DE-Tha, RMSE decreased from 16.0/11.9 to
evaluation 10.5/10.6 W m−2 for latent/sensible heat, respectively. With
the MED model the monthly mean latent heat flux was im-
The impact of the gs model on simulated gs is shown for proved at the C3 grass site (CH-Cha) as a result of increased
the site with low soil moisture stress (wet site, Fig. 2). For flux in the summer months (RMSE decreased from 15.7 to
the broadleaf tree and C3 herbaceous PFT, the MED model 13.8 W m−2 ); however there was no improvement in the sen-
simulates a larger conductance compared to the JAC model. sible heat flux and RMSE with MED was increased (from
In other words, with the MED model these two PFTs are 3.9 to 4.9 W m−2 ). At the C4 grass site (US-SRG), small im-
parameterised with a less conservative water use strategy, provements were made in the seasonal cycle of both latent
which, for the grid point shown in Fig. 2, increased the an- and sensible heat with the MED model. At the deciduous sa-
nual mean water use by 35 % (±29 %) and 45 % (±32 %), vannah site (CG-Tch), which included a high proportion of
respectively. In contrast, the needleleaf tree, C4 herbaceous shrub PFT in the land cover type used in the site simula-
and shrub PFTs are parameterised with a more conserva- tion, large improvements in the seasonal cycle of both fluxes
tive water use strategy with the MED model, and the mean were simulated with the MED model, as a result of a de-
annual gs was decreased by 13 % (±12 %), 27 % (±10 %) crease in the latent heat flux and an increase in the sensible
and 36 % (±13 %), respectively, compared to the JAC model. heat flux (RMSE decreased from 39.5 and 31.6 to 30.4 and
This comparison was also performed for a dry site (high soil 24.4 W m−2 for latent and sensible heat, respectively).
moisture stress), and similar results were found (Fig. S9).
The effect of gs formulation on simulated photosynthesis was 3.2 Evaluation of the JULES O3 model
much smaller because of the lower sensitivity of the limiting
rates of photosynthesis to changes in ci in the model com- For all JULES scenarios, similar spatial patterns of GPP
pared to the effect of the same change in ci on modelled gs are simulated compared to MTE (Figs. 3 and S14). MTE
(Figs. S10 and S11). Changes in gs impact the partitioning estimates a mean GPP for present day in Europe of
of simulated energy fluxes. In general, increased gs results in 938 gC m2 yr−1 (Fig. 3). JULES tends to under-predict GPP
increased latent heat and thus decreased sensible heat flux, relative to the MTE product. Estimates of GPP from JULES
and vice versa where gs is decreased (Figs. S10 and S11). with both transient CO2 and O3 (run_both_CO2 +O3 ) give a
Also shown is the effect of the MED model on O3 flux into mean across Europe of 813 gC m2 yr−1 (high plant O3 sen-
the leaf (Figs. S12 and S9 bottom panel). For the broadleaf sitivity) to 881 gC m2 yr−1 (low plant O3 sensitivity), both
tree and C3 herbaceous PFTs, the MED model simulates a of which are significantly different from the MTE prod-
larger conductance and therefore a greater flux of O3 through uct (t = 27, d.f. = 5750, p < 2.2e−16 (high); t = 4.3, d.f. =
stomata compared to JAC, and this is indicative of the poten- 5750, p < 1.5e−05 (low); Fig. 3). Forcing with CO2 alone
tial for greater reductions in photosynthesis (Figs. S10 and (run_CO2 ) gives a mean GPP across Europe of 900 to
S11 top row). The reverse is seen for the needleleaf tree, C4 923 gC m2 yr−1 (high and low plant O3 sensitivity, respec-
herbaceous and shrub PFTs. tively), and O3 alone (run_O3 – without the protective effect
of CO2 ) reduces estimated GPP to 732 to 799 gC m2 yr−1
(Fig. S14). At latitudes > 45◦ N JULES has a tendency to
under-predict MTE GPP, and at latitudes < 45◦ N JULES
www.biogeosciences.net/15/4245/2018/ Biogeosciences, 15, 4245–4269, 20184254 R. J. Oliver et al.: Large but decreasing effect of ozone on the European carbon sink
Figure 2. Comparison of simulated gs with MED (y axis) versus JAC (x axis) for all five JULES PFTs at one grid point (lat: 48.25, long:
5.25); shown are hourly values for the year 2000.
large areas of Europe, and up to 30 % in some Mediterranean
regions under the high plant O3 sensitivity. Some boreal and
Mediterranean regions show small increases in GPP over this
period, associated with O3 -induced stomatal closure enhanc-
ing water availability in these drier regions (Fig. 5). This al-
lows for greater stomatal conductance later in the year when
soil moisture may otherwise have been limiting to growth (up
to 10 %, Fig. 5), and therefore caused higher GPP, but these
regions comprise only a small area of the entire domain.
Indeed, over much of Europe, O3 -induced stomatal closure
led to reduced gs (up to 20 %) across large areas of temper-
ate Europe and the Mediterranean, and even greater reduc-
tions in some smaller regions of the southern Mediterranean
(Fig. 6), and these are not associated with notable increases in
soil moisture availability (Fig. 5), resulting in depressed GPP
over much of Europe as described above. Under the low plant
Figure 3. Mean GPP (g C m2 yr−1 ) from 1991 to 2001 for (a) the O3 sensitivity, similar spatial patterns occur, but the magni-
observationally based globally extrapolated Flux Network model tude of GPP change (up to −10 % across much of Europe)
tree ensemble (MTE) (Jung et al., 2011); (b, c) model simulations and gs change (−5 to −10 %) is lower compared to the high
with transient CO2 and transient O3 (run_both_CO2 +O3 ), with sensitivity. Over the twentieth century the land carbon sink is
high and low plant O3 sensitivities, respectively. suppressed (−2 to −6 %, Table 1). Large regional variation
is shown in Fig. 4, with temperate and Mediterranean Europe
seeing a large reduction in land carbon storage, particularly
tends to over-predict MTE GPP (Fig. S15). These regional under the high plant O3 sensitivity (up to −15 %).
differences are highlighted in Fig. S16, in which in the Combined, the physiological response to changing CO2
Mediterranean region, JULES tends to over-predict com- and O3 concentrations (run_both_CO2 +O3 ) results in a net
pared to MTE GPP, so simulations with O3 reduce the simu- loss of land carbon over the twentieth century under the
lated GPP, bringing it closer to MTE. In the temperate region high plant O3 sensitivity (−2 %, Table 1), dominated by loss
however, JULES tends to underestimate MTE GPP, so the of soil carbon (Table S3). This reflects the large increases
addition of O3 reduces simulated GPP further (Fig. S16). In in tropospheric O3 concentration observed over this period
the boreal region, JULES under-predicts GPP, but to a lesser (Fig. 1). Under low plant O3 sensitivity, the land carbon sink
extent than in the temperate region, and the addition of O3 has started to recover by 2001 (+1.5 %) owing to the recov-
has less impact on reducing the GPP further (Fig. S16). ery of the soil carbon pool beyond 1901 values over this pe-
riod (Table S3).
3.3 European simulations – historical period: To gain perspective on the magnitude of the O3 -induced
1901–2001 flux of carbon from the land to the atmosphere we relate
changes in total land carbon to carbon emissions from fos-
Over the historical period (1901–2001), run_O3 reduced
sil fuel combustion and cement production for the EU28-
GPP under both the low and high plant O3 sensitivity pa-
plus countries (EU-28 plus Albania, Bosnia and Herzegov-
rameterisations by −3 to −9 %, respectively (Table 1), and
ina, Iceland, Belarus, Serbia, Moldova, Norway, Turkey,
this difference in simulated GPP was significant (t = 102.2,
Ukraine, Switzerland and Macedonia) from the data of Bo-
d.f. = 6270, p < 2.2e−16 ). Figure 4 highlights regional vari-
den et al. (2013). We recognise that our simulation domain is
ations; simulated reductions in GPP are up to 20 % across
Biogeosciences, 15, 4245–4269, 2018 www.biogeosciences.net/15/4245/2018/R. J. Oliver et al.: Large but decreasing effect of ozone on the European carbon sink 4255
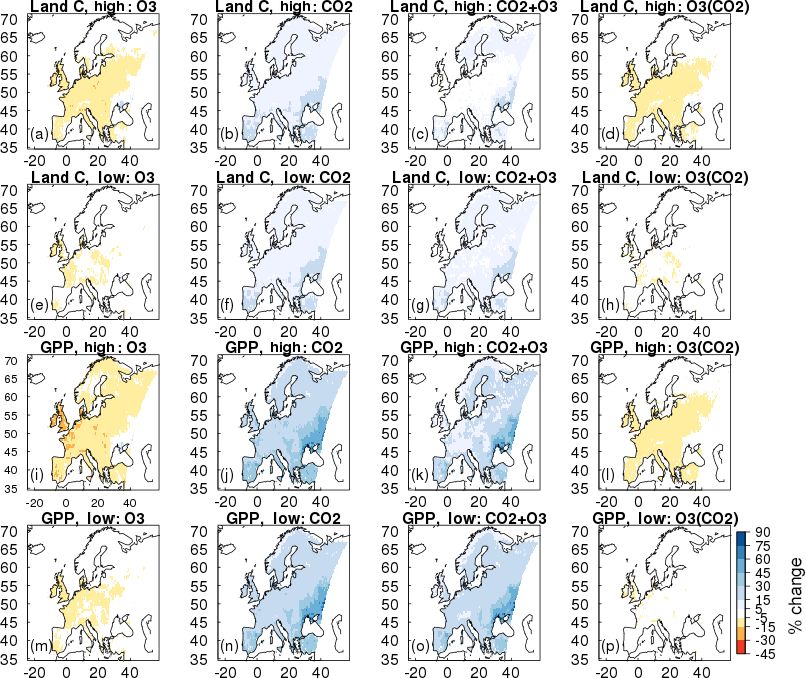
Figure 4. Simulated percentage change in total carbon stocks (Land C) and gross primary productivity (GPP) due to O3 effects at fixed
pre-industrial atmospheric CO2 concentration (run_O3 ). Changes are shown for the periods 1901 to 2001 and 2001 to 2050 for the high and
low plant O3 sensitivities.
duction in land carbon due to O3 has declined, but is still
equivalent to 2 to 4 % of the emissions of carbon from fossil
fuels and cement production for the EU28-plus countries (Ta-
ble 2). By comparison with one of the largest anthropogenic
emissions of carbon for Europe, we show here that the po-
tential effect of O3 on reducing the size of the European land
carbon sink is notable.
3.4 European simulations – future period: 2001–2050
Over the 2001 to 2050 period, region-wide GPP with O3 only
changing (run_O3 ) increased marginally (+0.1 to +0.2 %,
high and low plant O3 sensitivities; Table 1, with a significant
difference between the two plant O3 sensitivities; t = 57,
d.f. = 6270 p < 2.2e−16 ), although with large spatial vari-
Figure 5. Simulated percentage change in plant available soil mois- ability as discussed below (Fig. 4g and h). Figures S7 and S8
ture (fsmc) due to O3 effects at fixed pre-industrial atmospheric show that despite decreased tropospheric O3 concentrations
CO2 concentration (run_O3 ). Changes are shown for the periods by 2050 in summer compared to 2001 levels, all regions are
1901 to 2001 and 2001 to 2050 for the high and low plant O3 sen- exposed to an increase in O3 over the wintertime, and some
sitivities. regions of Europe, particularly temperate and Mediterranean
regions experience increases in O3 concentration in spring
and autumn. Therefore, although in the O3 simulation over-
slightly larger than the EU28-plus as it includes a small area all simulated GPP for Europe shows a small increase, large
of western Russia so direct comparisons cannot be made, but spatial variability is shown in Fig. 4g and h because of the
this still provides a useful measure of the size of the carbon variability in O3 concentration with region and season. In-
flux. For the period 1970 to 1979 the simulated loss of carbon creased GPP (dominantly 10, but up to 20 % in some areas)
from the European terrestrial biosphere due to O3 effects on on 2001 levels is simulated across areas of Europe; however,
vegetation physiology was on average 1.32 Pg C (high vege- decreases of up to 21 % are simulated in some areas of the
tation sensitivity) and 0.71 Pg C (low vegetation sensitivity) Mediterranean, up to 15 % in some areas of the boreal region
(Table 2). This O3 -induced reduced C uptake of the land sur- and up to 27 % in the temperate zone (Fig. 4g and h).
face is equivalent to around 8 to 16 % of the emissions of car- When O3 and CO2 effects are combined
bon from fossil fuel combustion and cement production over (run_both_CO2 +O3 ), simulated GPP increases (+15
the same period for the EU28-plus countries (Table 2). Cur- to +18 %, high and low plant O3 sensitivities, respectively,
rently the emissions data availability goes up to 2011. Over Table 1). This increase is greater than the enhancement
the last observable decade (2002 to 2011) the simulated re- simulated when CO2 affects plant growth independently
www.biogeosciences.net/15/4245/2018/ Biogeosciences, 15, 4245–4269, 2018You can also read


