The Luangwa Community Forests Project (LCFP) in Zambia - A review of the biggest REDD+ project in Africa financed by the Italian oil and gas ...
←
→
Page content transcription
If your browser does not render page correctly, please read the page content below
The Luangwa Community
Forests Project (LCFP)
in Zambia
A review of the biggest REDD+ project in Africa financed by the Italian oil
and gas company ENI
The Luangwa Community
  Forests Project (LCFP)
        in Zambia
          A review of the biggest REDD+ project
in Africa financed by the Italian oil and gas company ENI

                                         Author: Kelvin Mulungu

                                             Commissioned by:
                                              Greenpeace Italy
                                                    May 2021
INDEX
1. Introduction 4
1.1 Zambia and the Luangwa Community 4
1.2 Introduction to the review of Luangwa Community Forests Project (LCFP) 5
1.3 Mechanisms of the Luangwa Community Forests Project (LCFP) 7
2. Partners and Players in the LCFPs 11
3. Methodology 13
4. General Issue: Voluntary Carbon Markets (VCMs) 14
5. ENI’s Promise of Carbon Offsets in the LCFP 17
6. Issues with the LCFP 23
6.1 Choice of the reference area 23
6.2 Projected deforestation 25
6.2.1 Reported baseline deforestation rate 26
6.2.2 Choice of the baseline approach 27
6.2.3 Fire risk 28
6.2.4 Forests biomass 29
6.3 Other issues with the LCFP 30
6.4 Potential community problems of the LCFP 30
7. Conclusion 33
8. Appendix I: Lusaka and Eastern Provinces of Zambia 34
9. Appendix II: Questions posed to ENI S.p.A. 36
10. References 38
31. INTRODUCTION
This is a report commissioned by Greenpeace Italy to review the Luangwa Communi-
ty Forests Project (LCFP) in Zambia with a special interest in checking for any inconsi-
stencies in terms of assumptions, projected carbon credits to be generated, and any
unintended effects on the community. In the sections that will follow, we will provide
a background of Zambia and the project area of the Luangwa. We will also review the
carbon emissions reductions targets of the Italian oil and gas company ENI S.p.A. (major
player that committed to buy carbon credits from the LCFP for 20 years and until 2038),
with a special interest in their use of forest carbon offsets, before narrowing down on
one of their partner projects - the LCFP to check for the project’s environmental integrity.
1.1 ZAMBIA AND THE LUANGWA COMMUNITY
Zambia is a landlocked country found in the southern region of Africa. It has a land
surface area of 752,614 square kilometer (km2). The geography of Zambia is mostly high
plateau with some mountains. Zambia is surrounded by eight neighboring countries:
Democratic Republic of Congo to the north, Tanzania to the north-east, Malawi to the
east, Mozambique to the southeast, Zimbabwe and Botswana to the south, Namibia
to the southwest, and Angola to the west. Administratively, Zambia is divided into 10
Provinces namely Central Province, Copperbelt Province, Eastern Province, Luapula Pro-
vince, Lusaka Province, Muchinga Province, Northern Province, North-Western Province,
Western Province, and Southern Province. The population is concentrated mainly around
the capital city, Lusaka, in the south and the Copperbelt Province to the northwest. The
main economic activities are mining and agriculture.
Zambia lies in the tropics and its climate is modified by the altitude of the country. Ge-
nerally, the climate is favorable to human settlement and comfort. Zambia experiences
two main seasons; the rainy season (November-April) and the dry season, further divi-
ded as the cold dry season (May-August) and the hot dry season (September-October).
The marked seasonal pattern of precipitation is caused by the north and south move-
ment of the Intertropical Convergence Zone (ITCZ), which shifts with the Sun.
Zambia is endowed with vast amounts of natural resources such as minerals, wildlife,
and forestry, freshwater and arable land. Forests occupy a large area of the country. Ap-
proximately 459,433 km2 of Zambia is classified as forests (FAO, 2020) that is about 61%
of the total land area. Forests and woodlands provide the majority of the Zambian po-
pulation with various products, both timber and non-timber, for their livelihoods (Mu-
lenga et al., 2014), and are therefore of significant importance to Zambia’s social econo-
mic and cultural development. Open woodlands make up more than 94% of the forests,
with Miombo woodlands making up about 42% of this (Chidumayo, 2013). Miombo is
4the Swahili word for Brachystegia, one of many species found across this transboundary
ecosystem. The miombo ecosystem describes the vastest dry forest biome in southern
Africa, stretching over seven countries (Angola, Democratic Republic of Congo, Mala-
wi, Mozambique, Tanzania, Zambia and
Zimbabwe), covering more than 2.7
million km2. In Zambia, Miombo is the AFRICA
main land cover, with almost 42% of the
country covered by this woodland type.
1.2 INTRODUCTION TO
THE REVIEW OF LUANGWA
COMMUNITY FORESTS PROJECT
(LCFP)
The LCFP is one of the many Reducing
Emissions from Deforestation and fo-
rest Degradation (REDD+) projects in
developing countries. The premise for
REDD+ is straightforward: tropical fo-
rests store roughly 25% (250 billion
tons) of the planet’s terrestrial carbon1
- which combines with other gases to
produce greenhouse gasses (GHGs).
However, since 1990, more than 420 Figure 1. Map of Africa with Zambia highlighted in green.
million hectares2 of forests have been
deforested, releasing carbon dioxide
into the atmosphere and reducing the storage and sink capacity of the forests.
REDD+ proposes a solution to halt/reduce deforestation that relies, among other things,
on addressing the drivers of deforestation. The thinking behind is that economic growth
in developing countries inevitably depends on exploiting forests. Therefore, tropical
countries that reduce their emissions from forests relative to a calculated reference level
receive financial compensation thus creating an incentive to keep forests intact. It crea-
tes a financial value for the carbon stored in forests by offering incentives for developing
countries to reduce emissions from forested lands and invest in low-carbon paths to su-
stainable development. The main potential sources of finance for a future global REDD+
mechanism are international funds, compliance-based finance and voluntary carbon
markets. While the Clean Development Mechanism, which falls under the regulated or
compliance markets and is one of three flexible mechanisms under the Kyoto Protocol,
was targeted at countries and organizations with legally binding emission reductions
and focuses only on afforestation and reforestation projects, the voluntary carbon mar-
kets (VCM) were developed independently of governments and allows corporations,
non-governmental organizations, individuals, and others to voluntarily participate in
the business of offsetting their GHGs emissions (Exergia, 2007). Practically, this means as
part of compensating their emissions, corporations can help ‘save’ a tropical forest, and
claim the resulting carbon credits3 (the tons of carbon dioxide avoided as emissions).
To help save or conserve existing forest stocks, it is necessary to identify and address
the drivers of forest loss and forest degradation. These include direct drivers such as
1
Source: https://www.nature.com/articles/s41559-019-1090-0
2
Source: http://www.fao.org/state-of-forests/en
3
1 carbon credit = 1 tCO2e (ton of carbon dioxide equivalent).
51. INTRODUCTION
logging, large-scale forest conversion for agricultural expansion, firewood and charcoal
production, and subsistence agriculture by the rural poor and indirect drivers such as
poor governance, weak institutions and inadequate land tenure regimes. The assumed
reductions in emissions of carbon dioxide can then be sold on to different organizations
or individuals in the case of VCM. One such example is the LCFP, being implemented by
Biocarbon Partners (BCP). For corporations, motives for buying carbon credits include:
willingness to manage the effect of their activities on climate change by ‘offsetting’
their emissions; and potentially claim carbon neutrality;
an interest in philanthropy;
showing compliance with their stated intention to become carbon neutral (‘Net Zero’);
public relations or corporate social responsibility4.
This review focuses on the LCFP for mainly two reasons. First, LCFP is touted as the big-
gest REDD+ project in Africa by area and the biggest in the world by the number of be-
neficiaries (175,000)5. Second, we conducted a thorough search of the carbon registries
to check for carbon offset projects where ENI has been involved in any capacity. Betwe-
en September 2020 and January 2021, we consulted the following registries:
VERRA register (Verified Carbon Standard);
CDP (the world’s largest self-reported dataset for investors, companies, cities, states
and regions to manage their environmental impacts);
International Database on REDD+ projects and programs (IDRECCO);
FAO-Reddplus-Info;
Markit6;
Forest Trends;
Gold Standard7.
Despite public announcements in which ENI lists several countries where it is starting
REDD projects8, we found only the LCFP in Zambia as the project where ENI is currently
involved as a buyer.
Further, ENI announced, through a press release in November 2019, that it “has beco-
me an active member of the governance of the Luangwa Community Forests Project
(LCFP)”9, suggesting they are not only interested in buying the carbon credits generated
by the project but willing to take an active role in the governance of the project.
4
Source: https://exergia.gr/wp-content/uploads/voluntary-carbon-market-diagnosis.pdf
5
Source: http://blog.biocarbonpartners.com/africas-largest-redd-project-by-hectarage-verified-in-zambia/#:~:text=To%20the%20
best%20of%20our,beneficiaries%20of%20approximately%20175%2C000%20beneficiaries
6
Source: https://mer.markit.com/br-reg/public/index.jsp?entity=project&sort=project_name&dir=ASC&start=0&acronym=&
limit=15&name=&standardId
7
Source: https://registry.goldstandard.org/projects?q=&page=1
8
Source: https://www.repubblica.it/dossier/ambiente/virtual-circular-tour/2020/09/22/news/la_transizione_energetica_
passa_per_la_conservazione_delle_foreste-268210120/
9
Source: https://www.eni.com/en-IT/media/press-release/2019/11/eni-has-become-an-active-member-of-the-governance-
of-the-forest-conservation-redd-luangwa-community-forests-project-lcfp-in-zambia.html#:~:text=Sustainability-,Eni%20
has%20become%20an%20active%20member%20of%20the%20governance%20of,Forests%20Project%20(LCFP)%20
in%20Zambia&text=The%20Luangwa%20Community%20Forests%20Project%20started%20in%202014%20and%20
it,Zambian%20Government%20and%20local%20communities
61.3 MECHANISMS OF THE LUANGWA COMMUNITY FORESTS PROJECT (LCFP)
The LCFP is a large scale grouped REDD+ project implemented in Eastern and Lusa-
ka Provinces, Zambia, since 2014 with an initial project area of 943,646 hectares. The
project is being implemented on communal land in 12 chiefdoms falling within Game
Management Areas (GMA)10 and two private “game ranches” 11 offering safaris. Both com-
munities (including 69 village action groups in the chiefdoms) and the private ranches
are said to have given Free Prior Informed Consent12 through consultations that were
held before the project started and engaged through what the project calls “community
engagement” to ensure corrective action on some project activities13. Implementation
is in partnership with the traditional authorities and the government of the Republic of
Zambia. The project is expected to generate emission reductions through avoided defo-
restation, using the mitigation activities reported in the textbox below.
TEXTBOX 1: LCFP PLANNED ACTIVITIES
Direct conservation support - Forest monitoring will be done using remote sen-
sing, aerial and ground monitoring. Encroachment prevention will be accompli-
shed by training, funding, and helping to manage community scouts.
Engagement and capacity building with key Government and community sta-
keholders.
Performance-based payments to community stakeholders delivered through local
institutions.
Promoting alternative livelihood activities including: conservation agriculture,
non-timber forest product livelihoods, and sustainable enterprise development.
Figure 2. Source: LCFP Project description document (PD), file
name: 20190715_LCFP_PD (4).pdf - page 11 - Verra Registry.
The baseline scenario (i.e. the without-project scenario, defined further in section 6) is
unplanned deforestation driven primarily by the expansion of subsistence agriculture
according to the project document. Other direct drivers of deforestation not mentio-
ned in the project document include tobacco growing, urbanization, and infrastructure
development and fire, while indirect drivers that have been omitted include institutio-
nal, policy, and environmental such as climate change. A great emphasis is placed on
10
A Game Management Area (GMA) in Zambia is a buffer zone around a national park in which licensed safari and subsistence
hunting is permitted. It is a communal area in which people live by semi-subsistence agriculture, coexisting with wildlife
(Bandyopadhyay & Tembo, 2009).
11
Game ranching comprises the maintenance of wild animals in defined areas delineated by fences. It is a form of husbandry
similar to cattle ranching, the animals are managed on natural vegetation although the habitat may be manipulated to
improve production efficiency. The animals on the ranch are the property of the ranch owner for as long as they remain on
his ranch. Animals on ranches may be exploited for meat but most ranches aim for the added value of sport/trophy hunting,
live animal sales and ecotourism. Source: http://www.fao.org/3/w7540e/w7540e0e.htm
12
Free, Prior and Informed Consent (FPIC) is a specific right that pertains to indigenous peoples and is recognised in the United
Nations Declaration on the Rights of Indigenous Peoples (UNDRIP). It allows them to give or withhold consent to a project
that may affect them or their territories. Once they have given their consent, they can withdraw it at any stage. Furthermore,
FPIC enables them to negotiate the conditions under which the project will be designed, implemented, monitored and
evaluated. This is also embedded within the universal right to self-determination.
Source: http://www.fao.org/indigenous-peoples/our-pillars/fpic/en/
13
Source: Project description document (PD) - file name: 20190715_LCFP_PD (4).pdf - pag. 42 - https://registry.verra.org/app/
projectDetail/VCS/1775
71. INTRODUCTION
agricultural expansion, population growth, and proximity to roads. A summary of the
main drivers is presented in figure 3. Among the main drivers of deforestation related
to subsistence agriculture is the cultivation of tobacco14. Eastern province produces15
more tobacco than most provinces in Zambia. It is estimated that tobacco production
accounts for more deforestation than any other factor as tons of woodfuel is required in
the curing process (Gumbo et al., 2018).
FOREST COVER LOSS
MAIN DRIVERS
Agricoltural Infrastructure Wood extraction Fire
expansion development charcoal and uncontrolled set
shifting settlements, woodfuel fires, chitemene
cultivation or urban expansion production and agriculture and
agricultural end industry logging natural fires
extensification
UNDERLYING DRIVERS
Environmental Policy and legal Institutional Demography Socioeconomic
climate framework inconsistencies population powerty, low
variability, inconsistencies lack of funding, growth, employment,
topography, solis and weak transport and immigration, high insecure land
legislation political will, low rural population tenure and
staffing levels economic growth
and staff morale
Figure 3. Direct (main) and indirect drivers of
deforestation in Zambia. Source: Day et al., 2014.
The baseline scenario further assumes that communities remain poor because of their
dependence on subsistence agriculture (even though the reverse case can be argued
for, that poor households engage in subsistence agriculture and not the other way),
and that biodiversity declines due to habitat loss and increased poaching as community
members access the forest. Therefore, by implication, the with-project scenario would
reduce poverty and the decline in biodiversity.
The project’s community objective is poverty alleviation for at least 10,000 households,
specifically targeting vulnerable households and the poorest of the poor. The project
also aims to promote infrastructure development and water provision. The planned ac-
tivities are summarized in Textbox 1 (figure 2). The biodiversity objective is maintaining
a massive wildlife corridor between five national parks in the catchment of Zambia’s
4th largest river system (the Luangwa river) and conserving and maintaining vulnerable
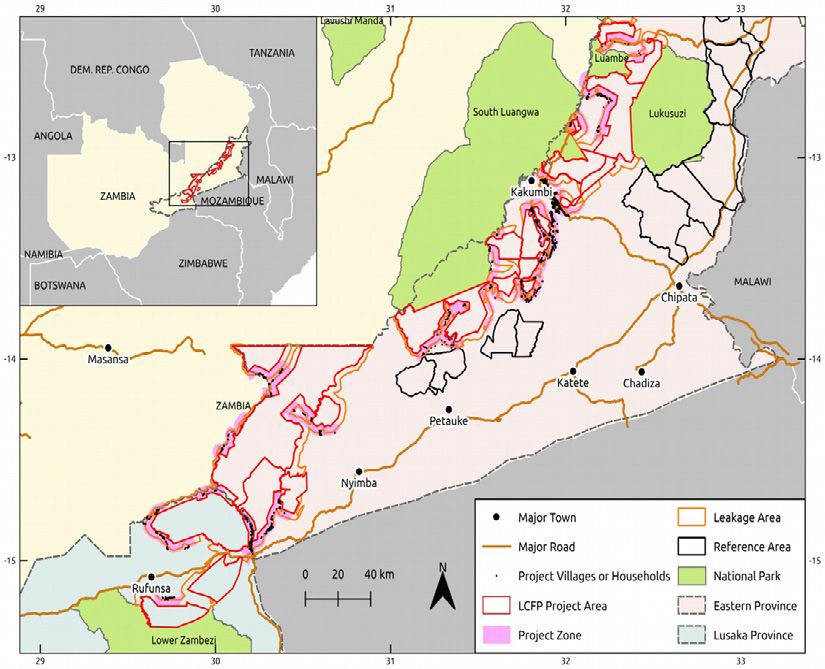
and endangered species through habitat protection and reduction in poaching. Figure
4 shows the location of the project.
14
Publicly-stated government policy continues to promote the narrative that tobacco growing is essential to the livelihoods
of smallholder farmers and a necessary element in poverty reduction but most tobacco farmers who have signed contracts
with leaf-buying companies to cultivate tobacco leaf are operating at a net loss. (Source: “The Economics of Tobacco Farming
in Zambia: Tobacco Farmers Survey Report 2019” University of Zambia and the American Cancer Society, 2019).
15
Source: https://globalizationandhealth.biomedcentral.com/articles/10.1186/s12992-018-0328-y
8to promote infrastructure development and water provision. The planned activities are
summarized in Textbox 1 (figure 2). The biodiversity objective is maintaining a massive
wildlife corridor between five national parks in the catchment of Zambia’s 4th largest river
system (the Luangwa river) and conserving and maintaining vulnerable and endangered species
through habitat protection and reduction in poaching. Figure 4 shows the location of the project.
Figure 4: Project areas of the LCFP in the Eastern province of Zambia. Source: LCFP Project description
document (PD), file name:
Figure 4. Project areas of(4).pdf
20190715_LCFP_PD
the LCFP- in the Eastern
page 20
province
-
of Zambia. Source: LCFP
Project description
https://registry.verra.org/app/projectDetail/VCS/1775 document (PD), file name: 20190715_LCFP_PD (4).pdf - page 20
- Verra Registry.
The climate objectives are to avoid deforestation in the project area and assist communities and
The climatewith
biodiversity objectives are to
climate change avoid deforestation
adaptation benefits through in the project
income area and
diversification, assist commu-
improved
nities and biodiversity with climate change adaptation benefits through income diversi-
fication, improved farming techniques, crop diversification, and maintenance of habitat
corridors. The project received a “Triple Gold” certification from the Climate,11 Community
& Biodiversity Alliance (CCBA) , a gold status for each impact on the community, climate
16
(through emission reductions), and impact on biodiversity - hence the triple gold. It is
also accredited to the VCS standard. The main challenge with the standards is that firms
that audit the projects to determine their eligibility into the standard are hired and paid
by the project developer. There is thus pressure on auditors to approve projects in order
to preserve their business relationships with the developers. This compromises the au-
ditors’ independence and neutrality. The auditor will need to be impartial, yet may want
to generously overlook issues and overestimate emission reductions in order to keep
the customer.
The estimated emission reductions for the 30 year project span is 83.6 millions tons of
carbon dioxide equivalent tCO2e17 (tCO2e) at an average of 2.8 millions tons of carbon
dioxide equivalent per year (tCO2e/yr)18 (when you divide the project total emission re-
16
Source: https://biocarbonpartners.com/impacts/luangwa-community-forests-project/
17
Detailed figure: 83,598,204 tCO2e - Source: LCFP Project description document (PD), file name: 20190715_LCFP_PD (4).pdf -
page 6 - https://registry.verra.org/app/projectDetail/VCS/1775
18
Detailed figure: 2,786,606 tons of carbon dioxide equivalent per year (tCO2e/yr).
91. INTRODUCTION
ductions by the number of years) even though the project states an average of 3 millions
tCO2e/year19. Because this is a voluntary carbon project, it ideally does not contribute to
Zambia or any Country’s20 intended nationally determined contributions (NDCs), except
by helping to sustainably manage the forests through community forests which is part
of Zambia’s sustainable forest management goal21. The LCFP project document states
that “the host country [Zambia] is not participating in any compliance mechanism and
credits will be sold on the voluntary market, there is thus no risk of double counting”.
However, in practice, it is possible that double counting could exist along the project life
span if Zambia starts to actively participate in any carbon market as Zambia’s Intended
Nationally Determined Contributions document does not explicitly state that credits ge-
nerated from the VCMs will be excluded from the NDCs calculation.
In the following sections, we will review some of the project assumptions, choice of the
reference area, and projections for carbon credits. Specifically, we also answer questions
related to the Italian oil company, ENI’s promise to offset its carbon emissions using the
LCFP. In section 2, we provide an overview of the different actors in the LCFP, section 3
briefly describes the methodology, while general issues with VCMs are given in section
4, ENI’s promise of carbon offsets in section 5 and specific issues with the LCFP are in
section 6. A conclusion is given in section 7.
19
Detailed figure: 2,985,650 tCO2e/year - Source: LCFP Project description document (PD), file name: 20190715_LCFP_PD (4).pdf
- page 11 - https://registry.verra.org/app/projectDetail/VCS/1775
20
Source: https://www.carbon-mechanisms.de/fileadmin/media/dokumente/Publikationen/Bericht/2020_11_19_cc_44_2020_
carbon_markets_paris_era.pdf
21
Source: https://www4.unfccc.int/sites/ndcstaging/PublishedDocuments/Zambia%20First/FINAL+ZAMBIA%27S+INDC_1.pdf
102. PARTNERS AND PLAYERS IN THE LCFPs
Voluntary carbon markets have a different implementation approach compared to
REDD+ activities that fall under the auspices of the UN and have to be undertaken at the
national or sub-national level. VCMs have several private players serving different roles.
Here, we list the key actors and their roles in the implementation of the LCFP.
Biocarbon Partners (BCP) - this is the project proponent for the LCFP. A project pro-
ponent is: “The individual or organization that has overall control and responsibili-
ty for the project, or an individual or organization that together with others, each of
which is also a project proponent, has overall control or responsibility for the project”
(CCB Standards Rules Version 3, 2016)22. BCP was founded in 2012 and started to work
in Zambia, first with the Lower Zambezi REDD+ project before adding the LCFP as
their second project. Their mission is “to address deforestation in wildlife-rich areas of
Zambia” 23.
Community Resources Boards (CRBs) and Village Action Groups (VAGs) - the
project description document also lists the 12 community resources boards as propo-
nent/implementing partners. These are groups that have legal backing from the Fo-
rest Act of 2015 in Zambia. They are made up of community members and with legally
recognized rights and responsibilities to manage community resources effectively.
Forestry Department - under the Ministry of Lands and Natural Resources, and De-
partment of National Parks Wildlife under the Ministry of Tourism and Arts are the
two key government departments listed under other entities/stakeholders that have
a legally recognized authority/mandates to manage resources within the forest (Fo-
restry Department) and Game Management Areas (DNPW) as the LCFP encompasses
some GMAs.
United States Agency for International Development (USAID) - is also listed as a
stakeholder as BCP received a grant in 2014 for the implementation of activities.
Verra - is the standards organization that runs both the VCS standard and the Climate,
Community, and Biodiversity (CCB) Triple Gold standard. The organization also appro-
ves the validation and verification reports carried out by third party auditors, though
this approval is automatic once the auditors have validated or verified the emission
reductions. Validation is to determine that the project design conforms to the Stan-
dards, in this case, both the Verified Carbon Standards (VCS) and the CCB standards
that the project is validated for24. Verification is to determine that the project has been
22
Source: https://verra.org/wp-content/uploads/2016/05/Rules_for_the_Use_of_the_CCB_Standards_December_2013_0.pdf
23
Source: https://biocarbonpartners.com/about/our-story-and-values/
24
Source: http://blog.biocarbonpartners.com/africas-largest-redd-project-by-hectarage-verified-in-zambia/
112. PARTNERS AND PLAYERS IN THE LCFPs
successfully implemented and whether it has generated or is on track for generating
net positive climate, social, and biodiversity benefits in accordance with its valida-
ted design. Verification also happens at the end of each monitoring round to verify
the carbon credits generated are truthful (Milne & Mahanty, 2019). “VCS is a private,
not-for-profit, non-governmental organization founded to provide quality assurance
in the certification of projects’ voluntary carbon emissions reductions25. The VCS is a
greenhouse gas accounting program used by projects around the world to verify and
issue carbon credits in voluntary and pre-compliance markets.”
Carbon credits buyers - these are not listed as part of the stakeholders, but they are
ultimately vital for the project to remain sustainable. The carbon credits or GHGs re-
movals need to be bought at the prevailing market price to allow the proponent to
implement activities that require funding. For the LCFP, various individuals and corpo-
rations have bought the carbon credits generated since 2015. One major player that
bought the verified carbon units in 2020 is ENI26. ENI further announced, through a
press release in November 2019, that it “has become an active member of the gover-
nance of the Luangwa Community Forests Project (LCFP)”27 and committed to buying
the carbon credits (not clear how many) from the LCFP for 20 years until 2038, 7 years
before the project end date for the LCFP. It is not clear what ENI joining the governan-
ce of the project means, as usually buyers are not involved in the governance of the
projects.
25
Source: https://www.intracen.org/WorkArea/DownloadAsset.aspx?id=58666
26
Source: https://www.eni.com/en-IT/media/press-release/2020/11/cs-eni-compensazione-emissioni.html/
27
Source: https://www.eni.com/en-IT/media/press-release/2019/11/eni-has-become-an-active-member-of-the-governance-
of-the-forest-conservation-redd-luangwa-community-forests-project-lcfp-in-zambia.html#:~:text=Sustainability-,Eni%20
has%20become%20an%20active%20member%20of%20the%20governance%20of,Forests%20Project%20(LCFP)%20
in%20Zambia&text=The%20Luangwa%20Community%20Forests%20Project%20started%20in%202014%20and%20
it,Zambian%20Government%20and%20local%20communities
123. METHODOLOGY
The approach used here is a systematic review of the project documents for the LCFP,
most of which can be found on the Verra registry at https://registry.verra.org/app/
projectDetail/VCS/1775. We reviewed all documents, from the project description do-
cument to the monitoring reports, to understand the design, theory of change, and
carbon credits generated in each monitoring round. In instances where two versions
of the document existed with the same information, we relied on the more recent ver-
sion. For example, two round 1 monitoring reports exist, MR1 and MR1.2. In this case,
for information available in both reports, we rely on the MR1.2, which is the updated
version of monitoring report 1. Further documents on guidance and standards for the
carbon projects were accessed from Verra, such as VM0009 Methodology for Avoided
Ecosystem Conversion version 3, and VM0015 Methodology for Avoided Unplanned De-
forestation. The LCFP project description document was compared against the laid-out
standards in these two documents.
We also rely on personal communication, mostly in the form of emails between diffe-
rent stakeholders and Greenpeace Italy. Among the organizations that were consulted
are the United Nations Development Programme, Verra, CDP, and BCP. Expert opinion
was also sought from experts in the carbon markets field and from academia. Further,
scientific literature that relates to the different aspects considered in this paper, such as
carbon dioxide removed per hectare, average deforestation rates, was reviewed to com-
pare and put what the LCFP used into context. Because project documents are many, we
cite them using their short titles while scientific literature is cited in the standard way.
134. GENERAL ISSUE: VOLUNTARY CARBON
MARKETS (VCMs)
There are two types of carbon markets in climate literature: the compliance markets and
the voluntary carbon markets (VCMs). The compliance market - which includes the now-
expired Clean Development Mechanism (CDM), the EU’s Emissions Trading System, and
the yet-to-formalized Sustainable Development Mechanism under the Paris Agreement
- is used by companies and governments that by law have to account for their GHG
emissions. It is regulated by mandatory national or regional carbon reduction regimes.
The CDM was until December 2020 the main regulatory market in developing countries.
On the voluntary market the trade of carbon credits is on a voluntary basis. The CDM28
does not include land use, land-use change, and forestry activities, except for afforesta-
tion and reforestation activities. Therefore, a separate program under the U.N. addressed
emissions coming from deforestation in developing countries, after massive lobbying
from different interests — Reducing Emission from Deforestation and forest Degradation
(REDD) or REDD+ (to include the role of conservation, sustainable management of fo-
rests and enhancement of forest carbon stocks’)29.
Voluntary carbon markets involve private firms and individuals who desire to offset
some or all of their emissions by buying carbon credits. Verified emission reductions are
transacted in the voluntary carbon market. Voluntary carbon markets, which emerged
in the mid-1990s, are self-regulated and exist separately from carbon markets set up by
governments in response to the 1997 Kyoto Protocol. Carbon credits are transacted over
the counter (trading that does not occur on a financial exchange which includes trades
in which participants are known to each other and trades that are mediated by a third
party, and in which counterparties remain anonymous), and often directly between the
project developer and buyer, verified and registered by third parties such as Verra. The
VCM is more disintegrated with different organizations setting voluntary standards that
differ. The voluntary market is largely unregulated by the State and was regarded initial-
ly as the ‘wild west’ of carbon markets (Dhanda & Murphy, 2011). As Seyller et al. (2016)
states: “Contrary to the CDM, there is no legal authority which controls and certifies car-
bon credits sold on the voluntary carbon market.” Broadly, they are still operating on
the fringes of government except for legal and institutional consultations. Major vo-
luntary standards, such as the Verified Carbon Standard (VCS), follow a rigorous asset
creation process resembling the one developed for the CDM. The VCM market is more
fragmented, confusing and has been accused of cheating in terms of overestimating
28
Note that the CDM ended in December 2020, even though requests for registering projects, renewing crediting periods, and
issuing credits are going on, but any approvals are provisional.
29
Source: https://www.unredd.net/about/what-is-redd-plus.html
14the carbon credits generated (Economist, 202030; Randalls, 2017). Frequently, there are
also problems in the communities in which these programs are implemented (Bayrak
& Marafa, 2016), including what has been termed ‘green grabbing’—the grabbing of
land and other resources from local communities for environmental concerns such as
conservation (Fairhead et al., 2012), even though standards such as the CCB have put in
safeguards to reduce the negative impacts on the communities.
In an article, the Economist magazine calls voluntary carbon credits “cheap cheats” be-
cause they allow big companies to buy carbon credits31, some of which are hard to verify,
at extremely low prices. For example, the average price in 2018 was $3 per ton of CO2
equivalent (tCO2e) compared to the E.U.’s cap-and-trade scheme https://www.econo-
mist.com/special-report/2020/09/17/cheap-cheats32 (a scheme that caps the emissions
from heavy-energy installations and allows them to trade emissions allowances) CO2
prices, which were eight times higher ($24)33. These prices tend to be much lower for
carbon credits from forests in developing countries compared to carbon credits from
other schemes mostly in developed countries. In a study, Conte and Kotchen (2010),
found that prices for forest carbon credits are lower than, for example, renewable ener-
gy by about 40% and that they are much lower in developing countries (lower by about
70%). In cases where the REDD+ project area is in a protected area, smallholders are by
law not allowed to deforest or degrade the forest and the project comes in to help enfor-
ce the law, which may include compensating the farmers as an incentive not to deforest.
In cases where households are financially compensated, it has been argued this com-
pensation is not sufficient (compensation is lower than the opportunity cost - Ickowitz
et al., 2017)34. For example, EasyJet spent a paltry 6% of its pre-tax profits to offset all its
carbon emissions, by buying carbon credits from developing countries35.
The second criticism is that the system is subject to abuse and cheating. Projects that
use avoided deforestation, such as the LCFP, are hard to prove that the deforestation
that has been avoided is certainly due to the project and that it would not have happe-
ned without the project—additionality. Leakage, which is the other main issue in these
projects, has also not been conclusively addressed. How do they ensure that people are
not engaging in other activities that harm the environment, such as the use of chemical
fertilizers or simply increasing deforestation in other parts of the country to meet, for
example, the national demand for charcoal which has been increasing in recent times
due to droughts and electricity blackouts in urban areas?36 A study published by the
European Commission in 2016 looking into one big carbon offset program found that
85% of the offsets had no net environmental benefits37. Other flaws of offset schemes
are in relation to:
a) Non-permanence: potential for carbon saving projects to revert to more emission-
intensive activity or to be destroyed by fire, weather events, or human disturbance.
Allocating some carbon credits to the “buffer” account is one solution that is being
implemented to reduce this risk, but as we will show, the risk is underestimated.
b) Procedural weaknesses in project verification and validation.
30
Source: https://www.economist.com/special-report/2020/09/17/cheap-cheats
31
Source: https://www.economist.com/special-report/2020/09/17/cheap-cheats
32
Source: https://ec.europa.eu/clima/policies/ets_en
33
Source: https://www.economist.com/special-report/2020/09/17/cheap-cheats
34
Source: https://www.sciencedirect.com/science/article/pii/S0305750X1531161X
35
Source: https://www.ft.com/content/7c953e0e-0a9c-11ea-b2d6-9bf4d1957a67
36
Source: https://forestsnews.cifor.org/64586/drought-fuels-charcoal-boom-in-zambia?fnl=
37
Source: https://ec.europa.eu/clima/sites/clima/files/ets/docs/clean_dev_mechanism_en.pdf
154. GENERAL ISSUE: VOLUNTARY CARBON MARKETS (VCMs)
For regulated markets, United Nations oversight is stretched, and verification is do-
minated by a few large companies in a highly competitive environment. However, for
the VCMs, there are multiple players that tend to have vested interests. For example,
U.N. spot checks and reviews have found many verification reports to be unsatisfac-
tory in terms of project additionality, monitoring and estimation of carbon saved,
and local consultation, as reported in a PricewaterhouseCoopers commissioned re-
port38. Even though verifiers are independent from project proponents, Seyller et al.
(2016, p. 234) argue that “project developers and verifying bodies have converging
interests to design a convenient baseline scenario of future deforestation in order to
increase their own income by generating and selling as many carbon credits as pos-
sible, knowing that the actual impact of their project on the drivers of deforestation
is likely to be limited due to factors beyond their control”.
38
Source: https://eprints.qut.edu.au/56096/1/Carbon_Fraud_Risk_PWC_Accepted.pdf
165. ENI’S PROMISE OF CARBON OFFSETS IN
THE LCFP
In its long-term strategy39 ENI has two goals, incrementally. First, they target to offset 6
million tCO2e (tons of CO2 equivalent) per year by 2024, and secondly to offset 40 mil-
lion tCO2e by 2050, using carbon forest offsets for both targets.
Further, in their plan for carbon neutrality40 in the long term, they state that they intend
to reduce GHGs both in absolute terms and intensity of emissions. The ambitions are
summarized in Textbox 2.
TEXTBOX 2: ENI LONG TERM CARBON NEUTRALITY TARGETS
Absolute – reduce net lifecycle emissions (Scope 1, 2 and 3): -30% in 2035; -80% in
2050 (vs 2018).
Relative – reduce net carbon intensity of energy production (Scope 1, 2 and 3):
-15% in 2035; -55% in 2050 (vs 2018).
Figure 5. Source: ENI, 2020 (plan for carbon neutrality41).
These numbers are summarized below in figure 6. In absolute terms, a net reduction
of 30% from the 2018 emissions means that ENI plans to be emitting about 376 million
tons of CO2 by 2035, with an intensity of 61 grams of CO2 (gCO2) per megajoule (MJ)
of energy produced (1 barrel of oil equivalent = 6,120 MJ of energy). By 2050, the ab-
solute net emissions are targeted to reduce to 107 million and an intensity of 32 gCO2/
MJ of energy produced. According to the respected industry analyzer, Carbon Tracker,
this means that ENI is not aiming for net zero, unlike other oil companies such as BP and
Repsol. They argue that for these numbers to result in net-zero requires absolute emis-
sions to fall at a rate faster than emissions per megajoule falls (relative goal), or relatively
production to fall42. However, ENI’s production grew by 1% from 2018 to 2019 and its
plan earlier in 2020 outlined a 3.5% annual growth from 2019 to 202543, which means
that intensity is only reducing through the addition of renewable energy sources such
as wind and solar, or other sources formally treated as zero emissions, such as biofuels.
This would mean the absolute emissions are never likely to be net zero.
39
ENI Long-Term Strategic Plan to 2050 and Action Plan 2021-2024, Source: https://www.eni.com/assets/documents/press-
release/migrated/2021-it/02/CS-strategy-2021-2024.pdf
40
Source: https://www.eni.com/assets/documents/eng/just-transition/2019/Eni-for-2019-Carbon-neutrality-in-the-long-term.pdf
41
Ibidem.
42
Source: https://carbontracker.org/eni-the-first-oil-company-to-lay-out-a-strategy-of-managed-decline/
43
Source: https://www.eni.com/assets/documents/investor/2020/eng/2019-full-year-results-strategy.pdf
17600
Absolute Net GHG emissions (Mt CO2e)
537
Intensity (gCO2e/MJ)
500
400 375.9
300
200
107.4
100 72 61.2
32.4
0
2018 2035 2050
Figure 6. ENI long term carbon neutrality targets. Source for the calculation is ENI’s
plan for carbon neutrality44.
Of the planned reductions in emissions, in its long-term strategic plan to 2050 (and ac-
tion plan 2021-2024)45 ENI promises to use carbon offset projects to offset about 40
million tons of CO2 per year by 2050. They target carbon offset projects in developing
countries. Their biggest partner project is the LCFP project. Not only have they promi-
sed to buy the resulting carbon credits from this project, but also joined its governance.
While buying carbon credits to offset emissions has become common, ENI’s promise is
a bold one for the reasons that will be stated below. Oil companies’ core business, by
default, results in huge emissions of GHGs.
To offset 40 million tons of CO2 per year, ENI would need more than 12,5 million hec-
tares46 of forest assuming that the forest type and emission reduction per hectare is
similar to the LCFP (i.e. 221 tCO2e for every hectare of avoided deforestation in a year).
This would require more than 13 projects similar to the LCFP, which is the largest forest
project in Africa (assuming the carbon credits produced in the LCFP are correct). Equiva-
lently, this would mean ENI helping to save a forest area bigger than Italy’s whole forest
area (about 11 million hectares47). This is a vast amount of forest to “save” from deforesta-
tion for any organization. But to demonstrate how predatory these schemes can be and
why they are “cheap cheats” for big corporations, ENI would manage to meet this target
using just 0.8% of its gross profit (using the 2019 profit of $22.587 billion48 and average
price of carbon credits in the LCFP of $4.5 per tCO2e).
This cost is far below the social cost of the emissions, which is the overall damage car-
bon emissions cause to society. In detail, carbon emissions cause devastating impacts:
extreme weather events like flooding and deadly storms; the spread of disease; sea level
rise; increased food insecurity; and other disasters. These impacts can cost businesses,
44
Reference year 2018. Figures refer to CO2eq. Source: https://www.eni.com/assets/documents/eng/just-transition/2019/Eni-for-
2019-Carbon-neutrality-in-the-long-term.pdf; https://www.eni.com/assets/documents/investor/2020/eng/Strategy-20-23-Sessio-
ne-Modello-GHG.pdf. During the Shareholders’ Meeting, 12th May 2021, ENI corrected the “Net GHG Lifecycle Emissions” for 2018
explaining why in the 2020 Annual Report (page 17) the “Net GHG Lifecycle Emissions” are 505 Mt instead of 537 Mt. Source “Answers
to questions submitted during Shareholders’ Meeting 2021 (only italian version)”: https://www.eni.com/assets/documents/eng/
governance/shareholders-meetings/2021/Answers-to-questions-submitted-during-Shareholders-Meeting-2021.pdf
45
ENI Long-Term Strategic Plan to 2050 and Action Plan 2021-2024, Source: https://www.eni.com/assets/documents/press-release/
migrated/2021-it/02/CS-strategy-2021-2024.pdf
46
Exact figure: 12,586,667 hectares of forests.
47
Exact figure: 10,900,000 hectares of forests.
48
Source: https://www.macrotrends.net/stocks/charts/E/eni-spa/gross-profit
18families, governments and taxpayers hundreds of billions of dollars through rising he-
alth care costs, destruction of property, increased food prices, and more49.
The social cost of carbon is a measure of the economic harm from those impacts, expres-
sed as the dollar value of the total damages from emitting one ton of carbon dioxide
into the atmosphere. Consensus amongst scientists is that the social cost of 1 tCO2e is
around $5050 in today’s dollars (Howard & Sylvan, 201551), compared to the current car-
bon market price of about $4-$6/ tCO2e.
At first, it was erroneously reported by the Financial Times52 (though there was an error
on the part of ENI on communication) that ENI would be planting 8.1 million hectares of
forests in Africa. However, this was clarified as referring to saving already existing forests
in Africa53. If this number still stands, it is overly ambitious to achieve considering that glo-
bally, about 10 million ha of forests per year are lost due to deforestation and forest degra-
dation, according to the Food and Agriculture Organisation’s 2020 Forest Resources Asses-
sment report (FAO, 2020). If this number was indeed erroneously mentioned, a target of 40
million tCO2e by 2050 is still too high to be feasible. For example, this would require about
thirteen projects of the LCFP size54. However, given the competition for carbon credits
that has risen in recent years (grew by 6% in 2019, and did extremely well even amid the
COVID-19 pandemic in 2020)55, and that supply of carbon credits is still not stable to meet
all demand (according to Gabriel Labbate, from the United Nations Environment Program
“there is not enough supply to meet that demand”56), and that most of the resulting credits
are questionable (Seyller et al., 2016; West et al., 2020), ENI will need to start new avoided
deforestation projects, which take time to have reasonable ’Emission Reductions’ (E.Rs,
equivalent to carbon credits) and independently evaluate their environmental integrity.
The LFCP in its first 3 years (2015-2018) was projected to have about 3.8 million tons of E.R.,
which was likely an overestimate as the first monitoring period reported just 528,534 tons
of CO2e for 2018 (the third year). Since ENI is planning new projects, for example, in the
Western province of Zambia and other African countries (ENI, 2020 Shareholders Question
and Answer)57, achieving 40 million tons of CO2e per year is highly ambitious and would
require investing in vast REDD+ projects that are few and with multiple buyers. Such huge
investments in carbon offset projects risks leading to land grabbing58 in the host country59.
Assuming ENI’s goal is to become carbon neutral and not carbon-free60 (which is ano-
49
Source: https://www.edf.org/true-cost-carbon-pollution#:~:text=The%20social%20cost%20of%20carbon%20is%20a%20
measure%20of%20the,per%20ton%20in%20today’s%20dollars
50
Source: https://www.nature.com/articles/d41586-021-00441-0?s=09
51
Source: https://www.edf.org/sites/default/files/expertconsensusreport.pdf
52
Source: https://www.ft.com/content/7c4d944e-470d-11e9-b168-96a37d002cd3
53
Source: https://www.bloomberg.com/news/articles/2019-05-03/eni-to-focus-on-saving-african-forests-to-offset-co2-emis-
sions#:~:text=The%20project%20is%20part%20of,from%20the%20atmosphere%20by%202030.&text=Eni%20will%20deve-
lop%20forestry%20projects,reduce%20emissions%20stemming%20from%20deforestation
54
This calculation is made assuming that ENI would join the project in the 4th year - 2019 - when emissions reductions
(carbon credits) would have gone up compared to the initial 3 years of the project.
55
Source: https://www.ecosystemmarketplace.com/articles/demand-for-voluntary-carbon-offsets-holds-strong-as-corpo-
rates-stick-with-climate-commitments/
56
Source: https://www.pri.org/stories/2021-01-29/global-demand-carbon-offsets-combat-emissions-growing-supply-unreliable
57
Source: https://www.eni.com/assets/documents/governance/2020/eng/minutes--shareholders-meeting-13-may-2020/Answers-
to-questions-submitted-during-Shareholders-Meeting-2020.pdf
58
For example, as conceptualized here, green grabbing is defined as the appropriation of land and resources for environmental ends
https://www.tandfonline.com/doi/full/10.1080/03066150.2012.671770
59
Practical example include in Uganda where smallholders were displaced (https://www.framtiden.no/english/other/co2lo-
nialism-in-uganda.html) or in Tanzania where studies have found REDD+ projects led to displacement, and resettlement
with little impact (https://www.tandfonline.com/doi/abs/10.1080/17531055.2017.1356622 - https://doi.org/10.1016/j.
worlddev.2016.08.005).
60
Carbon free means no carbon dioxide emissions. For ENI, this would mean no more fuels that have emissions. Carbon neutral
means that an organization or State is compensating as much carbon dioxide from the atmosphere as it’s putting in. The net
amount of carbon emissions is zero. This can in theory be achieved through carbon offsets like hypothetical carbon seque-
stration or planting trees or avoid deforestation.
195. ENI’S PROMISE OF CARBON OFFSETS IN THE LCFP
ther ethical challenge), it would need to be able to buy enough carbon credits to offset
its annual emissions that stand at 537 million tons per year61 (ENI Methodology for the
Assessment of GHGs). This task would be more daunting. This would require about 191
(equal to about 180 million hectares62) projects the size of the LCFP (the largest project
by area in Africa and largest in the world by the number of beneficiaries) or 4.4% of the
entire forest area in the world, or nine times the area of Italy or more than half the area
of the Amazon rainforest. However, if they invested in other more dense primary and
secondary forests such as those in the DRC and Ghana, this number would reduce but
not substantially.
Again, if all this was offset using forests in developing countries, it would cost ENI just
10.7% of their 2019 gross profit63.
Focusing on the countries that ENI has planned for carbon offset projects, and using the
carbon stock from literature, we show in Table 1 the project sizes that would be required
to meet ENI’s target. For Zambia, we still use carbon stock levels found in literature than
what is in the project document because the project figures are higher than what is in li-
Table 1: Hypothetical sizes of forests and REDD+ projects size that would be required for ENI to offset 40 million tons of
CO2 per year
Area to be
Above ground saved from Size of REDD+ project forest
Country ENI
Forest area (ha) carbon stock deforestation per needed (in ha) to avoid (column X)
plans to invest Major forest type
in the Country# (in tCO2e) per year (ha) to offset ha of annual deforestation given a
in64
hectare 40 million tCO2e deforestation rate of…
(column X)
0.6%* 1.5%**
Miombo and
Zambia 44,814,030 114 350,877 58,479,532 23,391,813
mopane woodlands
Miombo and
Mozambique 36,743,760 110 363,636 60,606,061 24,242,424
mopane woodlands
Tropical seasonal
Vietnam 14,643,090 324 123,457 20,576,132 8,230,453
forest
Ghana Savannah 7,985,710 188 212,766 35,460,993 14,184,397
Temperate
(coniferous, broad-
Mexico 65,692,080 121 330,579 55,096,419 22,038,567
leafed and cloud
forests)
Miombo (open
Angola 65,800,190 122 327,869 54,644,809 21,857,923
tropical)
# Source for all forest sizes is the FAO’s global forest resources assessment reports for 202065
*0.6 is the average deforestation rate for most countries in Africa.
**1.5% is used as an upper bound, borrowing from studies that show that if crop revenues increase to $100/ha, then deforestation would increase to about 1.5% (Busch
& Engelmann, 2017). All figures on above ground carbon stocks per hectare at the country level are calculated from Saatchi et al., (2011)66 who provide average carbon
stock rates per country by combining several studies including IPCC (2006).
61
See note 44.
62
Exact figure: 180,236,386 ha.
63
Using 2019 profit of $22.587 billion (source: https://www.macrotrends.net/stocks/charts/E/eni-spa/gross-profit ) and average
price of carbon credits in the LCFP of $4.5 per tCO2e, then the total cost would be $4.5*537 million = 2.4165 billion, which is
10.7% of the profit.
64
Source for the list of countries ENI plans to invest in: https://www.eni.com/assets/documents/governance/2020/eng/Notice-
of-Ordinary-Shareholders-Meeting-2020.pdf
65
Source: http://www.fao.org/forest-resources-assessment/fra-2020/country-reports/en/
66
Source: https://www.pnas.org/content/108/24/9899 - Only above ground figures are used to make the calculation compa-
rable with the LCFP that uses only above-ground carbon stocks to calculate the ERs.
20terature and questionable. I also assume lower deforestation rates, guided by literature,
than what is used in the LCFP project document.
As the table above (Table 1) shows, to offset 40 million tons of CO2 from carbon projects
in developing countries, ENI would require enormous forest areas covered by REDD+
projects to be saved considering forests’ current carbon stocks per hectare and the ave-
rage deforestation rates. For example, if the project encompasses 1 million ha, and given
that the annual deforestation rate in Zambia is 0.6% (a lower figure than that used in the
LCFP, but closer to what is reported in most studies as the average for Africa), it means
the project will save 6000 ha per year (assuming 100% efficacy). Assuming 114 tCO2/ha,
it will avoid emissions of 684,000 tCO2 each year.
CALCULATIONS BOX FOR TABLE 2
Area to saved is given as 40,000,000 tCO2e / carbon dioxide stock (after converting
the carbon stocks per hectare to carbon dioxide) per hectare, for example, for Zam-
bia it is given as 40,000,000/114 = 350,877.
Size of REDD+ project given a deforestation rate is calculated as,
REDD+ project size= area to be saved/ deforestation rate.
For example, for Zambia under 0.6% deforestation rate, the size of the REDD+ project
would need to be 350,877 ha/ 0.006= 58,479,532 ha. In short, if a REDD+ project en-
compassing about 58,479,532 ha in an area where the deforestation rate is 0.6% per
year needed to generate 40 million tCO2e, it would would save about 350,877 ha be
stopping this deforestation per year.
To reach the 40 M tCO2 target, ENI will need more than 58 projects of the size of the LCFP
(projects covering 58 million ha, more than the total forested land in Zambia).
However, using more dense forests with higher carbon stocks and in countries with hi-
gher deforestation rates, the size of the forests required to attain 40M tCO2 would re-
duce, though would remain high. Even with a higher hypothetical deforestation rate of
1.5%, and using Vietnamese and Angolan forests which have higher carbon stocks per
hectare and assuming all carbon stored is lost once forests are converted to other land
use, the size of the REDD+ project forests coverage required to offset 40 million tCO2e is
still large (8 million ha in Vietnam, which is about 56% of all the countries’ forest cover).
For example, Saatchi et al (2011) estimate that the carbon stocks for all African forests
is about 61 billion tons, or about 223 billion tons of carbon dioxide. At an annual defo-
restation rate of 0.6% for Africa, ENI target alone represents about 3% of the available
potential emission reductions for Africa.
A report done by Greenpeace United Kingdom (2021)67 shows that meeting targets set
by the Airlines and oil companies combined, through afforestation and/or reforestation
projects may be a huge challenge. This points to a lower likelihood that these targets
companies put forward can be genuinely met through forests.
67
Source: https://www.greenpeace.org.uk/wp-content/uploads/2021/01/Net-Expectations-Greenpeace-CDR-briefing.pdf
215. ENI’S PROMISE OF CARBON OFFSETS IN THE LCFP
Annual avoided emissions
5000000
Annual avoided emissions (tCO2e)
4000000
3000000
2000000
1000000
0
Year
19
20
21
22
23
24
25
26
27
28
29
30
31
32
33
34
35
36
37
38
39
40
41
42
43
44
45
20
20
20
20
20
20
20
20
20
20
20
20
20
20
20
20
20
20
20
20
20
20
20
20
20
20
20
Figure 7. Annual avoided emissions from the LCFP project.
Estimated emission reductions per year from the LCFP (figure 7), are 2,786,607 tCO2e
(83,598,204 tCO2e / 30 years) per year, but the projects end in 2045 and it’s not clear
what will happen with the forest then. So, on average, if ENI becomes the sole buyer of
all the LCFP carbon credits, it can use the biggest project in Africa to offset just about
7% of its annual target by 2050 showing that using forests to offset 40 million tCO2e is a
real challenge. To meet the 40 million tCO2e per year target, it would need about 13 of
such (LCFP) projects.
For example, in 2020, ENI managed to only purchase about 1.5 million tCO2e from the
LCFP, some of which were produced in much earlier years. According to a press release in
November 2020, ENI said that “thanks to forest conservation in Africa, Eni has offset GHG
emissions equivalent to 1.5 million tons of CO2” 68. Below, we show that indeed ENI has
bought the said number, even though these carbon credits were generated in various
years. For the sake of transparency, we would like to state that when we first checked in
September 2020, ENI was not listed as a buyer until December 2020 when we checked
the Verra registry once again.
Table 2: Carbon credits retired on behalf of ENI
Year Produced Quantity(tCO2e) Date bought by/retired for ENI
2015 252,765 0
2016 520,636 0
2017 644,420 0
2018 72,179 0
Total 1,490,000
Source: Verra registry (VCUs issued records)69.
68
Source: https://www.eni.com/en-IT/media/press-release/2020/11/cs-eni-compensazione-emissioni.html
69
Source: https://registry.verra.org/app/projectDetail/VCS/1775
22You can also read