A 2600-year high-resolution climate record from Lake Trichonida (SW Greece)
←
→
Page content transcription
If your browser does not render page correctly, please read the page content below
Research article
E&G Quaternary Sci. J., 69, 139–160, 2020
https://doi.org/10.5194/egqsj-69-139-2020
© Author(s) 2020. This work is distributed under
the Creative Commons Attribution 4.0 License.

A 2600-year high-resolution climate record from
Lake Trichonida (SW Greece)
Joana Seguin1 , Pavlos Avramidis2 , Walter Dörfler3 , Alexandros Emmanouilidis2 , and Ingmar Unkel1
1 Institute for Ecosystem Research, Christian-Albrechts-Universität, Olshausenstraße 75, 24118 Kiel, Germany
2 Department    of Geology, University of Patras, Rio, 26504 Patras, Greece
3 Institute of Pre- and Protohistoric Archaeology, Christian-Albrechts-Universität,

Johanna-Mestorf-Straße 2–6, 24118 Kiel, Germany

Correspondence:         Joana Seguin (jseguin@ecology.uni-kiel.de)

Relevant dates:         Received: 8 January 2020 – Revised: 30 June 2020 – Accepted: 28 July 2020 –
                        Published: 8 October 2020

How to cite:            Seguin, J., Avramidis, P., Dörfler, W., Emmanouilidis, A., and Unkel, I.: A 2600-year high-
                        resolution climate record from Lake Trichonida (SW Greece), E&G Quaternary Sci. J., 69, 139–160,
                        https://doi.org/10.5194/egqsj-69-139-2020, 2020.

Abstract:               This paper aims at reconstructing the palaeoclimatic changes during the last 2600 years in southern
                        Greece based on a proxy record from Lake Trichonida. For the first time, we provide a reliable age-
                        depth model and continuous geochemical data for the largest and deepest lake in Greece. We use
                        X-ray fluorescence (XRF) geochemical data supported by discrete mineral analysis based on X-ray
                        diffraction (XRD), grain size distribution, and organic matter content to investigate changes in the
                        lake sedimentary system and identify the major forcing mechanisms. A principal component analysis
                        based on the XRF geochemical composition identifies the variation between carbonate-rich material,
                        precipitating predominantly under drier and/or warmer conditions, and terrigenous sediment input,
                        with it being more prominent during wetter and/or colder conditions. The first principal component
                        (PC1) shows a very strong correlation with the weathering proxy log(Rb/Sr), and we interpret both
                        proxies as depicting fluctuations in the hydrological conditions. A cluster analysis, conducted on the
                        continuous geochemical and colour parameters, highlights the similarities in the sediment charac-
                        teristics deposited during wetter phases, notably during 1850–1750, 1500–1400, ca. 1100, and ca.
                        100 cal BP.
                           When comparing the PC1 Trichonida record to independent records from the Balkans, we find gen-
                        erally concurring patterns on a multi-decadal to centennial scale. We show that phases with wetter
                        conditions at Lake Trichonida coincide with a more negative North Atlantic Oscillation (NAO) in-
                        dex, suggesting that the precipitation variability in southern Greece is linked to changes in the NAO
                        atmospheric pattern, as one major driving force. The 2600-year-long sedimentary record of Lake Tri-
                        chonida contributes to a better understanding of Late Holocene palaeohydrological changes in an
                        important climatic transitional zone in the eastern Mediterranean.

Kurzfassung:            In diesem Artikel rekonstruieren wir paläoklimatische Veränderungen der vergangenen 2600 Jahre
                        in Südgriechenland anhand von Proxies aus dem See Trichonida. Erstmals stellen wir ein ver-
                        lässliches Alterstiefenmodell, sowie durchgängige, geochemische Daten für den größten griechis-

Published by Copernicus Publications on behalf of the Deutsche Quartärvereinigung (DEUQUA) e.V.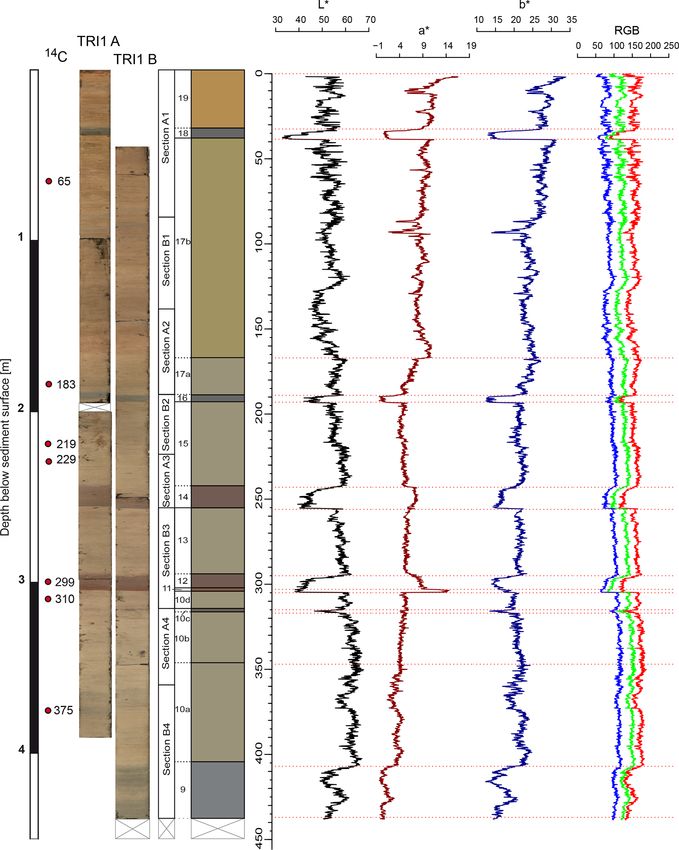
140                         J. Seguin et al.: A 2600-year high-resolution climate record from Lake Trichonida (SW Greece)

                         chen See zur Verfügung. Wir verwenden geochemische Daten aus Röntgenfluoreszenzanalyse (XRF),
                         unterstützt durch diskrete Röntgen-Diffraktometrie (XRD), Korngrößenverteilungen und Messun-
                         gen des Organikgehalts, um Änderungen im sedimentären System des Sees zu untersuchen und
                         deren Haupteinflussfaktoren zu ermitteln. Mittels einer Hauptkomponentenanalyse der geochemis-
                         chen Zusammensetzung, basierend auf den XRF Messungen, identifizieren wir als dominierenden
                         Prozess die Schwankungen zwischen Carbonaten auf der einen Seite, welche vorrangig während
                         trockener und/oder wärmerer Bedingungen ausfallen, und terrigenem Material auf der anderen Seite,
                         welches insbesondere in feuchteren und/oder kühleren Phasen eingetragen wird. Wir interpretieren
                         diese Schwankungen als Änderungen in den hydrologischen Gegebenheiten. Ein Vergleich der ersten
                         Hauptkomponente (PC1) mit dem Verwitterungsproxy log(Rb/Sr) weist hohe Übereinstimmungen
                         auf, und wir interpretieren beide als Proxies für Schwankungen in den hydrologischen Gegebenheiten.
                         Eine Clusteranalyse, basierend auf den kontinuierlichen geochemischen sowie Farbwerten, verdeut-
                         licht die Ähnlichkeiten in den Eigenschaften der Sedimente, welche während feuchterer Phasen abge-
                         lagert wurden, insbesondere in den Zeiträumen 1850–1750, 1500–1400, ca. 1100 und ca. 100 cal BP.
                            Der Vergleich des PC1 Trichonida Datensatzes mit unabhängigen Proxies anderer Studien aus der
                         Balkanregion zeigt grundsätzlich übereinstimmende Muster auf multidekadischen bis hundertjähri-
                         gen Zeitskalen. Wir zeigen, dass Phasen mit feuchteren Bedingungen im Einzugsgebiet des Sees Tri-
                         chonida mit einem negativen Index der Nordatlantischen Oszillation (NAO) zusammenfallen, woraus
                         sich schließen lässt, dass die Niederschlagsvariabilität in Südgriechenland zu einem Großteil von
                         Veränderungen im Muster der NAO geprägt ist. Der 2600 Jahre abdeckende Sedimentkern aus dem
                         See Trichonida trägt zu einem besseren Verständnis natürlicher, spätholozäner paläohydrologischer
                         Schwankungen in einer klimatisch wichtigen Übergangszone im östlichen Mittelmeer bei.

1   Introduction                                                     In southern Greece, high-resolution environmental
                                                                  archives completely covering the last 2600 years have been
Climatic changes and anthropogenic land use are two of            relatively sparse, have been often incomplete, or present
the most significant driving forces of hydrological and ge-       divergent results (Finné et al., 2011, 2019; Katrantsiotis
omorphological processes. As the interaction and connec-          et al., 2019; Luterbacher et al., 2012), but the number of
tivity between humans, climate, and environment are com-          studies has been increasing recently (Emmanouilidis et
plex, it is necessary – though challenging – to differentiate     al., 2018, 2019; Katrantsiotis et al., 2018, 2019; Seguin
anthropogenic from climatic impacts on landscape develop-         et al., 2019, 2020a). For the last 2600 years, a couple of
ment over long timescales. Due to the long history of human–      major climatic phases and events have been identified for
environment interaction in the Mediterranean, the region is       different regions across Europe, such as the Roman Warm
especially valuable for interdisciplinary studies on past cli-    Period (RWP, ca. 2200–1550 BP; Luterbacher et al., 2016;
mate variability and human activity (McCormick et al., 2012;      McCormick et al., 2012; Morellón et al., 2016; Wilson et al.,
Mercuri and Sadori, 2014; Roberts et al., 2011; Weiberg et        2016), the Late Antique Little Ice Age or Migration Period
al., 2016).                                                       (LALIA, ca. 1400–1600 BP; Büntgen et al., 2016; Helama
   Greece is located in a transitional zone between the           et al., 2017), the Medieval Climate Anomaly (MCA, ca.
temperate climate and the Mediterranean climate. Differ-          1000–700 BP; Christiansen and Ljungqvist, 2017; Keigwin,
ent large-scale atmospheric circulation patterns influence the    1996; Mangini et al., 2005), and the Little Ice Age (LIA, ca.
Greek and eastern Mediterranean climate, such as the North        700–100 BP; Christiansen and Ljungqvist, 2017; Keigwin,
Atlantic Oscillation (NAO), the Siberian High pressure sys-       1996; Kelly and Ó Grada, 2014). It seems however that their
tem, and the East Atlantic/West Russia (EA/WR) pattern,           manifestations were spatially and temporally very different
mainly in winter, as well as the South Asian monsoon in sum-      (Neukom et al., 2019), and local studies are needed to
mer (Barnston and Livezey, 1987; Xoplaki et al., 2003b, a).       investigate the partly diverging characteristics.
However, the rugged topography with its strong relief gra-           In this article, we present a new sedimentological archive
dients and different mountain ranges acting as orographic         from Lake Trichonida, the largest Greek lake. Our aims
boundaries lead to quite a heterogeneous modulation of these      are (1) to obtain a solid age-depth model, (2) to compile
large-scale teleconnection patterns on a local level, influenc-   high-resolution geochemical records for palaeoclimatic re-
ing for example the amount of mean annual precipitation           constructions from Lake Trichonida, and (3) to study cli-
(Koutsodendris et al., 2017; Xoplaki et al., 2003a).              matic trends in southern Greece and investigate major forc-

E&G Quaternary Sci. J., 69, 139–160, 2020                                         https://doi.org/10.5194/egqsj-69-139-2020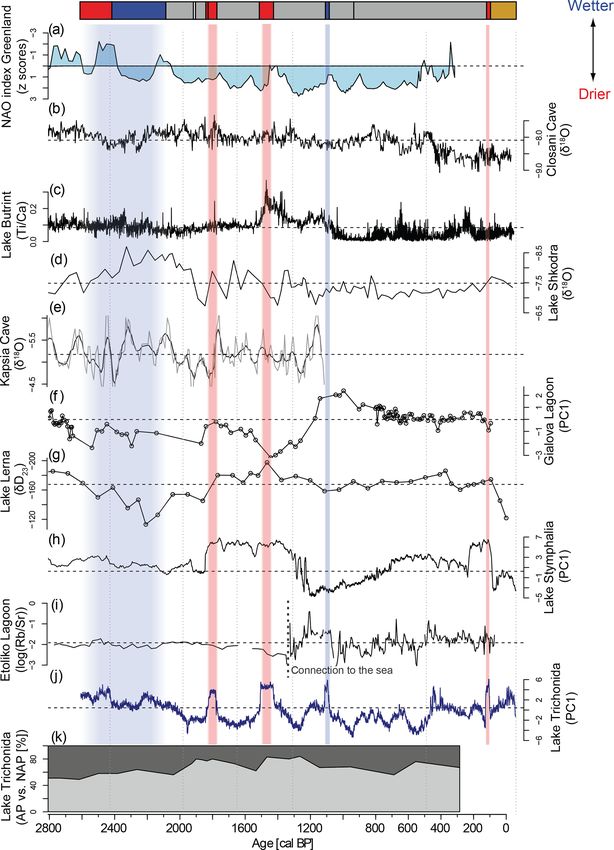
J. Seguin et al.: A 2600-year high-resolution climate record from Lake Trichonida (SW Greece)                                  141

ing mechanisms during the Late Holocene by comparing               winter (Tafas et al., 1997). During summer months the ther-
our results with independent palaeoclimate studies from the        mocline lies between 14 and 26 m (Overbeck et al., 1982).
Balkans and the eastern Mediterranean.                             With respect to its nutrient balance, Tafas et al. (1997) de-
                                                                   scribe it as oligotrophic with mesotrophic tendencies. This
                                                                   is in good agreement with the low amount of chlorophyll a
2   Regional setting                                               (2.3 mg m−3 ) reported by Zacharias et al. (2002), which in-
                                                                   dicates a low algal growth in the water body. Albrecht et
Lake Trichonida (                  , or in old Greek Trichonis)    al. (2009) found a high number of endemic molluscs in the
(38.56◦ N, 21.55◦ E) is the deepest and largest natural lake       lake, and Tafas and Economou-Amilli (1997) studied sea-
in Greece, located in the region Aetolia-Acarnania (Fig. 1).       sonal phytoplankton assemblages and also report endemic
The lake is up to 19 km long and 6 km wide, stretching ap-         diatoms.
prox. in W–E direction and covering approx. 97 km2 ; it has a         The catchment area is covered by pine, fir, oak, and Greek
maximum depth of 58 m and a mean depth of 30.5 m. (Tafas           maquis shrubland (Koussouris and Diapoulis, 1982). The
et al., 1997). Inter-annual water level fluctuation in the lake    flat shore area is intensively used for agricultural purposes.
is about 1 m (Tafas et al., 1997).                                 For present aquatic vegetation refer to Koussouris and Di-
   The lake has been studied irregularly since the 1970s           apoulis (1982). A pollen study by Bottema (1982) provides
with a focus on different limnological or biological aspects       some indication on vegetation transformation during the Late
(Albrecht et al., 2009; Bottema, 1982; Creer et al., 1981;         Holocene. The continuous presence of anthropogenic indi-
Koussouris and Diapoulis, 1982; Krüger and Damrath, 2020;          cators (e.g. viticulture) indicates human influence upon the
Tafas et al., 1997; Zacharias and Ferentinos, 1997; Zotos et       vegetation in the area for the complete investigated period.
al., 2006; and references herein).                                 Nowadays, the lake area is part of the Natura 2000 environ-
   According to the Köppen classification, the lake is located     mental protection network as a habitats directive site, as it
in a Csa climate zone, indicating a temperate climate with hot     conserves endangered or protected flora and fauna and serves
and dry summers and mild and humid winters (coldest month          as a resting area for migratory water birds (European Envi-
mean temperature > 10 ◦ C, warmest month mean tempera-             ronment Agency, 2020; Dimitriou and Zacharias, 2006).
ture > 22 ◦ C; rainfall during dry period < 30 mm) (Köppen,
1936; Tafas et al., 1997). According to Koussouris and Di-
apoulis (1982) the area is dominated by westerly winds. Pre-       3     Material and methods
cipitation, which mainly falls in winter (Fig. 2), is controlled
                                                                   3.1    Fieldwork
by eastbound cyclones originating from the Atlantic (Finné
et al., 2011; Xoplaki et al., 2003a).                              Fieldwork was conducted in spring 2018 using a Usinger pis-
   Lake Trichonida is situated in the Trichonis graben, a          ton corer system (Mingram et al., 2007), newly modified with
highly tectonized and complex hydrogeological system (Al-          a wire-operated second platform at the lake bottom. The cor-
brecht et al., 2009; Kiratzi et al., 2008). While the moun-        ing site TRI1 is located in the deepest central eastern part of
tains surrounding the lake rise up to 2000 m a.s.l., the lake      the lake (38◦ 330 0.6100 N, 21◦ 350 20.7600 E; 50 m water depth).
itself lies in the Agrinio depression at approx. 10 m a.s.l. The   We recovered two overlapping parallel cores with 80 mm di-
Pindos thrust cuts right through the lake and a normal fault,      ameter in the upper part and 55 mm diameter in the lower part
striking E–W and dipping north, bounds the southern flank          and retrieved them in 2 m sections. Offset between the cores
of the lake (Overbeck et al., 1982).                               was 50 cm (see Table S1 in the Supplement). The sediment
   The size of the lake catchment varies according to the          cores were removed from the coring equipment, cut into 1 m
sources between 215 and 421 km2 (Dimitriou and Zacharias,          sections for better handling, split open longitudinally on site,
2006; Overbeck et al., 1982; Zacharias et al., 2002). It mainly    and transferred into plastic U channels that were thoroughly
consists of highly tectonized, karstified calcareous rocks in      labelled and sealed. At Kiel University (Germany), they are
the NE (Fig. 1), where groundwater inflow is of high impor-        stored at +4 ◦ C in a cooling container for further processing.
tance; impermeable flysch formations in the SW; and Qua-
ternary sediments in the direct vicinity of the lake (Dim-
                                                                   3.2    Dating
itriou and Zacharias, 2006; Overbeck et al., 1982; Tafas et al.,
1997). Thirty seasonal streams discharge into the lake (Dim-       The chronology of the Trichonida sediment sequence is
itriou and Zacharias, 2006). Lake Trichonida drains into the       based on 13 accelerator mass spectrometry (AMS) radio-
smaller, neighbouring Lake Lysimachia in the west through          carbon (14 C) dates, processed at the Poznań Radiocarbon
a controlled outflow canal (Avramidis et al., 2013; Dimitriou      Laboratory (Table 1). Radiocarbon dating was performed
and Zacharias, 2006) and further into the river Acheloos           on two groups of samples: organic macro-remains and bulk
(Overbeck et al., 1982). The lake’s water balance is presented     sediment samples, in the case of absence of visible macro-
by Overbeck et al. (1982). Lake Trichonida is a warm, mo-          remains. Where visible, macroscopic plant remains were ex-
nomictic lake that is stratified during summer and mixes in        tracted from the sediment cores, isolated under a reflected

https://doi.org/10.5194/egqsj-69-139-2020                                          E&G Quaternary Sci. J., 69, 139–160, 2020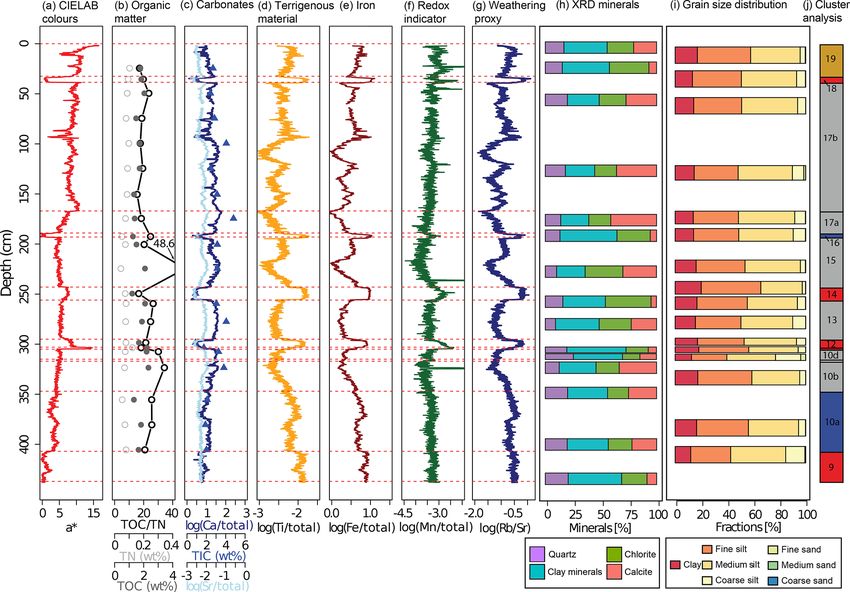
142                          J. Seguin et al.: A 2600-year high-resolution climate record from Lake Trichonida (SW Greece)

Figure 1. Map of the study area. (a) Overview map of Greece and the Balkans. Lake Trichonida is marked in red. Key sites used for
comparison in Fig. 8 are indicated in yellow. (b) Map showing the study area with the coring site, the topography, and geology. Agrinio as
the largest city and Thermos as the most important archaeological site are indicated. The map was created using QGIS. The geological map
is based on IGME (1988, 1977).

Figure 2. Mean monthly precipitation for Araxos. The mean monthly precipitation from January to December for the WMO station Araxos
Airport (38.133◦ N, 21.416◦ E) is shown for the period 1961–1990.

E&G Quaternary Sci. J., 69, 139–160, 2020                                                https://doi.org/10.5194/egqsj-69-139-2020
J. Seguin et al.: A 2600-year high-resolution climate record from Lake Trichonida (SW Greece)                                143

light binocular, and rinsed with deionized water. They con-        quantitative. The full width at half maximum (FWHM) of
sisted of charcoal or plant remains, twigs, or leaves (Table 1).   each diagnostic peak was measured for each detected mineral
In the lower part of the cores, where no macro-remains could       percentage to be calculated. The minimum detection limit is
be found, we used bulk sediment samples for 14 C dating            around 2 %–3 %, with small variations depending on the state
(Fig. S1).                                                         of the studied sample.
   The age-depth modelling was done using rbacon (Blaauw              Carbon and nitrogen samples were taken at approximately
and Christeny, 2011; Fig. 5). All dates are indicated as           25 cm resolution. The concentrations of total carbon (TC),
calibrated calendar years before present (cal BP), where           total inorganic carbon (TIC), and total nitrogen (TN) were
“present” is defined as 1950 CE with 1σ uncertainty ranges         determined on dried, powdered, and homogenized samples,
following Mook and van der Plicht (1999). Mean ages were           using a Euro EA elemental analyser. Total organic carbon
extracted from the model and used for the representation and       (TOC) was calculated from the difference between TC and
interpretation of the proxy data.                                  TIC. The TOC/TN ratio was calculated to indicate the origin
                                                                   of the sedimentary organic matter. While values for in-lake
                                                                   organic matter, such as algae, are low, generally ranging be-
3.3   Analytical methods
                                                                   tween 4 and 10, mixed provenance is indicated by a ratio of
The cores were described concentrating on lithology, sedi-         10 to 20; values higher than 20 indicate that land-plant or-
ment texture, and structure as well as on sediment colour ac-      ganic matter was eroded into the lake (Meyers, 2003).
cording to Munsell soil colour charts (Munsell, 2000) and             All statistical analyses, diagrams, and figures were com-
macroscopic remains. The core sections were visually corre-        piled using the software R version 3.6.1 (R Core Team,
lated on distinct marker layers that were used as tie points       2019). For the RGB and XRF data, cleaning of the datasets,
where possible and fine-tuning was done in a second step           i.e. the removal of explicit outliers due to unevenness or
based on the RGB (red, green, blue) colour values and XRF          cracks in the sediment core and the refilling of the missing
scans.                                                             values by linear interpolation, was done prior to statistical
   The surfaces of the half cores were smoothened and              processing.
photographed using a digital line-scan camera (resolution:            In this study, Spearman’s correlation coefficient (Spear-
143 pixels cm−1 ). Based on RGB values and L*a*b* (L* for          man, 1904) was employed to examine correlations between
lightness, a* from green to red, and b* from blue to yellow)       two populations. We conducted a principal component analy-
from the CIELAB colour space, colour profiles were created         sis using the prcomp function from the R stats package on the
to depict colour variations with depth (Fig. 3).                   centred log-transformed XRF dataset. A hierarchical cluster
   The cores were scanned for XRF using an Avaatech core           analysis was performed on the centred log-transformed XRF
scanner with a rhodium X-ray source. The scanning settings         data and the continuous RGB colour parameters with hclust
were a 1 mm resolution at 10 kV (exposure time of 10 s at          from the R stats package, using Euclidean distances as the
250 µA) and at 30 kV (exposure time of 10 s at 1000 µA using       distance measure and complete linkage as the agglomeration
a Pd-thick filter). The XRF scans provide semi-quantitative        method.
element intensities in total counts per second (tcps). Eleven
elements (10 kV: Al, Si, K, Ca, Ti, Mn, Fe, Co; 30 kV: Rb, Sr,     4     Results
Zr) show continuous data for 438 cm of TRI1 and are used for
further analysis. We analyse relative changes of one element       4.1    Core description
to another by natural logarithmic (log) ratios and interpret
these as proxies for palaeoenvironmental variation. Hence,         Based on the composition, structure, and colour, the investi-
measurement variation caused by sample geometry, physical          gated core sequence of TRI1 was divided into 15 lithological
properties, water content, and the closed-sum effect are min-      units and subunits (Figs. 3, 4, Table 2).
imized (Tjallingii et al., 2007; Weltje and Tjallingii, 2008).        The core dominantly consists of homogeneous, non-
   Twenty-four samples, at least one per lithological unit         laminated marls of greyish colour. While few plant macro-
(Fig. 4), were analysed for their grain size distribution (GSD)    fossils were found, carbonate macrofossils are completely
using a laser particle analyser, Malvern Mastersizer 2000.         absent. The sediment sequence does not show any signs of
The 70 measured classes were grouped into the seven com-           annual lamination or blackish mud, including high organic
mon grain size fractions following the ad-hoc Arbeitsgruppe        matter content, although the lake is classified as monomictic,
Boden (2005).                                                      implying a turnover only once a year and a vertical stratifica-
   Mineralogical analysis was conducted on 15 representa-          tion of the water body throughout most of the year. The X-ray
tive samples from different lithological units using X-ray         diffraction (XRD) analysis indicates that the most prominent
diffraction (XRD, Bruker D8 Advance). Determination and            mineral phase throughout the core consists of clay miner-
qualitative analysis of the results were performed through         als (25.2 %–53.1 %), followed by chlorite (15.6 %–41.0 %),
DIFFRACplus EVA12 software (Bruker AXS), by calcula-               calcite (4.9 %–41.2 %), and quartz (9.2 %–25.3 %; Fig. S4);
tion of the area method, characterizing the method as semi-        other minerals were absent or below the detection limit.

https://doi.org/10.5194/egqsj-69-139-2020                                          E&G Quaternary Sci. J., 69, 139–160, 2020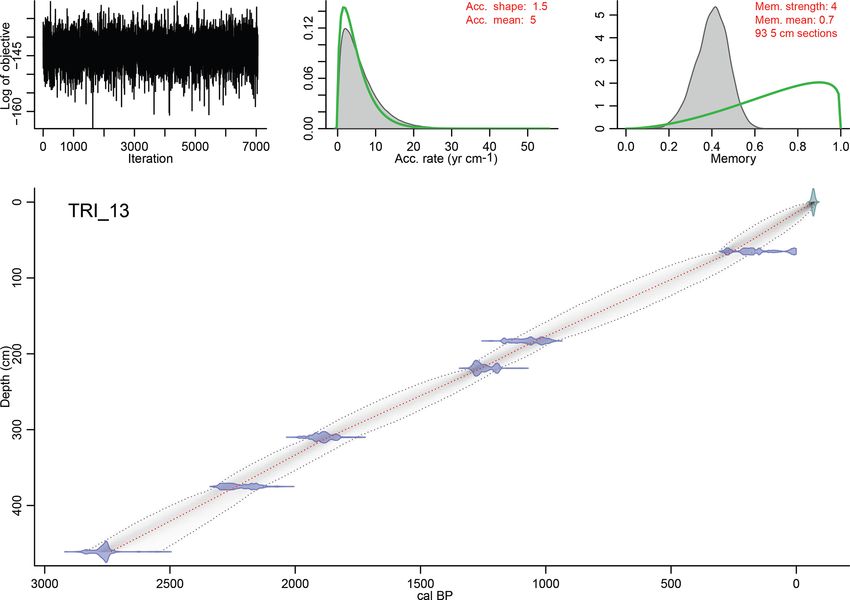
144                                J. Seguin et al.: A 2600-year high-resolution climate record from Lake Trichonida (SW Greece)

Table 1. List of all radiocarbon samples taken from TRI1. Indicated 14 C ages are unmodelled ages giving the 68.2 % calendar dating
probability. Calibrated ages are cal BP ages using the IntCal13 calibration dataset (Reimer et al., 2013).

           Sample           Analysis           Sample material                C content in this        14 C age ±1σ          Calibrated 14 C age     depth
           no.              no.                                               fractiona (mg C)                    (BP)       (cal BP), 1σ ranges      (cm)
           TRI-res01        Poz-106295         terrestrial plant for                           0.5              0 ± 30                     236–235     0b
                                               reservoir age                                                                                 59–42
           TRI-65           Poz-105729         twig                                                          175 ± 30                     282–267      65
                                                                                                                                          215–168
                                                                                                                                          153–144
                                                                                                                                             20–0
           TRI-183          Poz-106296         leaf of deciduous tree                          0.7         1150 ± 30                     1171-1161    183
                                                                                                                                         1121–1112
                                                                                                                                         1085–1046
                                                                                                                                          1033–984
           TRI-219          Poz-110650         leaf of deciduous tree                                      1320 ± 30                     1292–1257    219
                                                                                                                                         1202–1188
           TRI-229          Poz-105452         drupe                                                       2605 ± 35                     2758–2730   229b
           TRI-299          Poz-110652         bulk sediment                                               3605 ± 30         3966–3944               299b
                                                                                                                                   3930–3871
           TRI-310          Poz-106297         charcoal                                                    1940 ± 30                     1926–1865    310
                                                                                                                                         1840–1835
           TRI-375          Poz-110651         charred plant remains                                       2190 ± 30                     2304–2237    375
                                                                                                                                         2182–2148
           TRI-461          Poz-105390         charred plant remains                                       2640 ± 35                     2774–2745    461
           TRI-490          Poz-110653         bulk sediment                                               9290 ± 50               10 567–10 416     490b
           TRI-532          Poz-110654         bulk sediment                                   0.8         8210 ± 40                     9257–9117   532b
                                                                                                                                         9104–9093
           TRI-559          Poz-106298         bulk sediment                                   0.8         9080 ± 50               10 257–10 198     559b
           TRI-598          Poz-100656         bulk sediment                                               8410 ± 50                     9493–9404   598b
                                                                                                                                         9340–9332
           TRI-627          Poz-106299         bulk sediment                                   0.8       10 440 ± 60               12 522–12 471     627b
                                                                                                                                   12 430–12 372
                                                                                                                                   12 352–12 232
                                                                                                                                   12 207–12 167
         a Amount of remaining sample material after respective pretreatment if < 1.0 mg C. b Excluded from the final age-depth model.

   Changes in lithology are closely related with changes in                                 The grain size distribution is very uniform and clearly
colour parameters (RGB and L*, a*, b*). Contrary to the                                  dominated by silt-sized material; sediment types can be dis-
RGB values, the a* parameter, spanning from green to red,                                tinguished ranging from clayey to very clayey silt. Clay con-
and the b* parameter, spanning from blue to yellow, allow a                              tent varies from 11.95 % to 21.74 %, and the sand fraction is
differentiation of the thin, blueish and reddish sedimentary                             hardly present with only 0 % to 4.36 %. A large share of the
units. Towards the top, the amount of yellow colour particles                            silt-sized particles is of calcareous origin as can be expected
is steadily increasing (Fig. 3). This is interrupted by thin lay-                        due to the limestone geology of the catchment (Fig. 4).
ers of very different colouration. Units 11, 12, and 14 have                                The TOC content ranges between 1.2 % and 2.3 %, with
a reddish colour, while units 16 and 18 depict a dark-grey to                            the TOC/TN ratio being in the range 15.5–48.6, indicat-
blueish colour, more intense than unit 9, as visible in the a*                           ing a predominantly to exclusively terrestrial source and al-
colour proxy (Fig. 3).                                                                   lochthonous origin of the organic matter.

E&G Quaternary Sci. J., 69, 139–160, 2020                                                                      https://doi.org/10.5194/egqsj-69-139-2020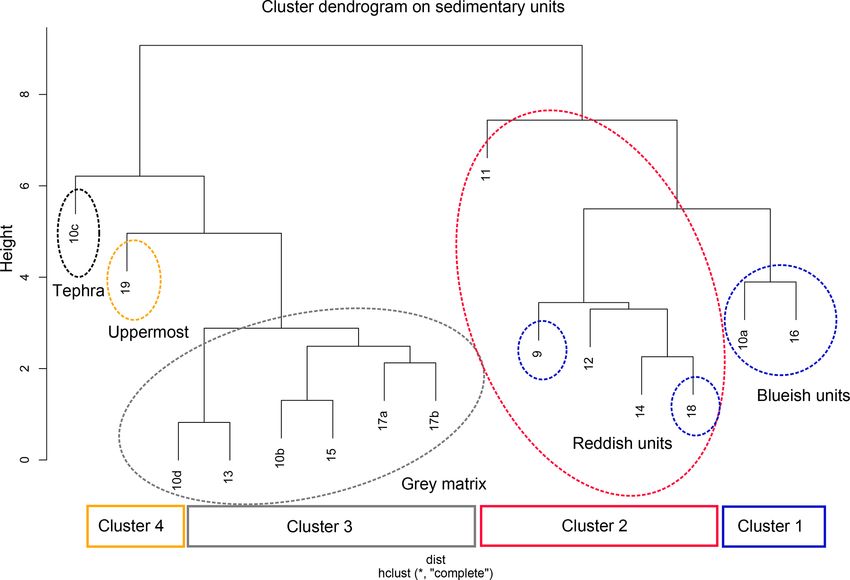
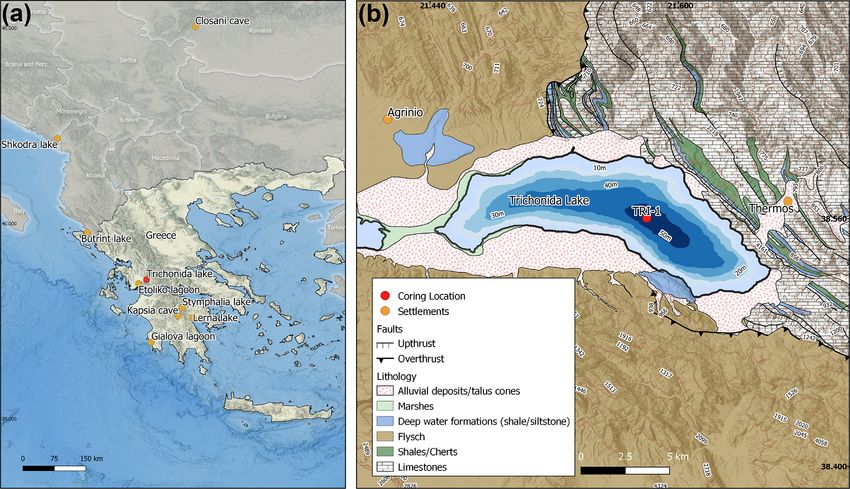
J. Seguin et al.: A 2600-year high-resolution climate record from Lake Trichonida (SW Greece)                                         145

Figure 3. Core pictures of TRI1-A and TRI1-B and lithological profile of the master core TRI1 are plotted against depth. The composite
sections and the delimited lithological units are indicated. Depths where samples for 14 C dating were taken are marked by red dots. On the
right panel, colour sequences in L*a*b* and RGB colour code are depicted.

   The three independent indicators of calcium carbonate,               Zr), Sr shows an exceptionally high peak in unit 10c, which
XRF Ca, TIC, and XRD calcite, are generally in good agree-              was addressed as a tephra layer (see Sect. 5.1). Besides, Sr
ment (Fig. 4). Carbonate content (Ca and Sr) strongly varies            and Ca show a high correlation (rSpearman = 0.88) and a sim-
along the sequence and is lowest in the blueish and reddish             ilar curve progression with depth (Fig. 4).
sedimentary units (11, 12, 14, 16, and 18; Fig. 4). Quartz                 The terrigenous elements (Ti, Rb, Fe, Zr, K, Zr, Al, and Si)
content shows only minor variation but a distinct maximum               all show a very similar behaviour along the entire sediment
in unit 11. Together with several terrigenous elements (Rb, K,

https://doi.org/10.5194/egqsj-69-139-2020                                               E&G Quaternary Sci. J., 69, 139–160, 2020
146                           J. Seguin et al.: A 2600-year high-resolution climate record from Lake Trichonida (SW Greece)

Figure 4. Overview of selected colour, organic, and geochemical proxies for the composite profile TRI1 plotted against depth. (a) CIELAB
colour parameter a*, (b) organic matter proxies (TOC, filled points; TN, empty points; and C/N, points on line), (c) carbonate proxies (Ca,
blue line; Sr, bright blue line; and TIC, triangles), (d) terrigenous material (Ti), (e) iron (Fe), (f) redox indicator (Mn), (g) log(Rb/Sr) as
weathering proxy, (h) XRD minerals, and (i) discrete grain size measurements. Bar widths for XRD and grain size distribution are not at
scale. (j) The lithological units; colour coding follows the cluster analysis. All XRF elements presented here have been normalized against
total counts and log transformed. Horizontal, red dashed lines indicate lithological units.

sequence. The highest values occur in the thin blueish and                bility, the model was cut at the lowermost date obtained from
reddish sedimentary units and in the lowermost unit 9.                    organic remains (461 cm), corresponding to an approximate
   Manganese (Mn) values are rather constant along the core               basal age of 2750 cal BP. All bulk sediment samples were
with increasing variance only in the uppermost unit 19. In                finally excluded from the age-depth model, as they yielded
the thin units 11, 12, 14, and 18, Mn shows enhanced val-                 considerably too old ages (see Fig. S1). This was best visible
ues at the bottom of the unit with a decreasing trend towards             when comparing the bulk sediment age at 299 cm with the
the top (Fig. 4). The log(Rb/Sr) ratio shows irregular cyclic             charcoal sample at 310 cm; these two dates are only 11 cm
variation with depth, with higher values in the blueish and               apart but depict an age difference of 1700 years. We took a
reddish sedimentary units and below 350 cm (Fig. 4).                      surface sample from aquatic plants (TRI-res01) to analyse for
                                                                          a potential hard water effect or reservoir age, but this sample
4.2   Age-depth model                                                     yielded a recent 14 C age, suggesting that the lake is not af-
                                                                          fected by reservoir effects at least under current conditions.
Due to the limestone-rich environment, there is a high                    Dating challenges due to the low preservation of organic ma-
amount of reworked, inorganic carbon present in the sed-                  terial, hard water, and old carbon effects due to the lime-
iment, which may lead to too old 14 C ages when dating                    stone bedrock are known for Greek lakes (Bottema, 1982;
bulk sediment (Grootes et al., 2004; Seguin et al., 2019). Six            Seguin et al., 2019; Vaezi et al., 2019). However, a critical
macro-remain-based radiocarbon ages form the basis of the                 assessment of the dating results and an extensive modelling
final, most reliable age-depth model. To obtain a higher relia-

E&G Quaternary Sci. J., 69, 139–160, 2020                                                   https://doi.org/10.5194/egqsj-69-139-2020
J. Seguin et al.: A 2600-year high-resolution climate record from Lake Trichonida (SW Greece) 147
Figure 5. Bayesian age-depth model TRI_13 constructed using the R package rbacon (Blaauw and Christen, 2011). The blue tie bars indicate
the 14 C age distribution, while the greyscale of the line graph reflects the likelihood; the dotted red line follows the mean ages.
approach, if possible, combined with other numeric or rel- Cluster 1 comprises unit 10a and the thin unit 16, which
ative age information, still yields a solid and reliable age- cover the periods 2600–2080 and 1100–1080 cal BP. These
depth model. The final model shows a continuous and rather units are characterized by the lowest a* and low b* proxy val-
constant sedimentation rate of 1.68 mm yr−1 over the inves- ues, indicating the blue-greyish colouration of the sediment.
tigated period. The amount of terrigenous material is high, while Ca, Sr, and
TIC have minima here. TOC/TN values are slightly elevated.
4.3 Statistical analyses of the geochemical data The grain size is slightly coarser here, notably in unit 9, as
indicated by the GSD. The log(Rb/Sr) proxy is high in these
4.3.1 Cluster analysis
units (Fig. 4).
A hierarchical cluster analysis was conducted on the con- Cluster 2 encompasses the thin, reddish units 11
tinuous XRF and L*a*b* proxies (14 variables) to indepen- (1830–1820 cal BP), 12 (1820–1770 cal BP), and 14 (1500–
dently classify the 15 visually determined lithological units 1420 cal BP), as well as units 9 (2600–2420 cal BP) and 18
and subunits according to potentially different sedimentary (110–90 cal BP). While the three of reddish colour have high
conditions (Fig. 6). a* values and low b*, the latter are of blue-greyish coloura-
Our clusters show meaningful correlations with the sed- tion with low a* and b* proxy values (Fig. 3). The geochem-
imentological units. The results allow a differentiation into ical values are similar for all units with very high terrigenous
two sound main clusters and five systematically traceable input and local minima in carbonate input (Ca, Sr, and TIC).
sub-clusters, and the results are depicted in a dendrogram Unit 11 contains a considerably higher amount of quartz.
(Fig. 6). Four main lithofacies may be distinguished, leaving log(Rb/Sr) shows maxima in all these units.
aside the tephra (unit 10c, see Sect. 5.1), suggesting rather Cluster 3 is the largest cluster comprising all units belong-
similar environmental conditions during the deposition of ing to the homogeneous greyish marls (units 10b, 10d, 13,
material within the same sub-cluster. 15, 17a, 17b). The a* and b* values indicate average values
with an increasing trend with time towards more yellowish
https://doi.org/10.5194/egqsj-69-139-2020 E&G Quaternary Sci. J., 69, 139–160, 2020148 J. Seguin et al.: A 2600-year high-resolution climate record from Lake Trichonida (SW Greece)
Table 2. Sedimentary units of TRI1 with detailed sedimentological description. The sediment type classification follows the German ad-hoc
Arbeitsgruppe Boden (2005; UB: upper boundary, G: gradational, P: planar).
Core depth Sediment Unit thickness Munsell colour Soil Description
(cm) unit (cm) type
0–32 19 32 2.5Y 4/3 Ut4 more yellowish than 17b – terrigenous input
olive brown (UB = sediment–water interface)
32–37 18 5 Gley 1 4/5 GY Ut3 silty blue-greyish unit, similar to unit 16 (UB = G)
olive grey
37–166 17b 129 5Y 6/3 Ut3 matrix becomes darker and more yellowish, brown
olive grey mottles, 0.85–1.0 m thin horizontal grey-blueish
lines visible, 0.945 thin reddish line, more oxida-
tion (UB = P)
166–189 17a 23 5Y 5/2 Ut3 homogeneous grey matrix (UB = G)
olive grey
189–193 16 27 Gley 1 4/5 GY Ut3 thin blue-greyish layer (UB = P)
olive grey
193–243 15 50 5Y 5/2 Ut3-Ut4 homogeneous grey matrix, orange mottled
olive grey (UB = P)
243–256 14 13 2.5YR 5/1 Ut3 similar to unit 12, gradual brightening towards top
reddish grey (UB = G)
256–295 13 39 5Y 5/2 Ut3 homogeneous grey matrix, occasional black
olive grey particles (UB = P)
295–303 12 8 2.5YR 4/1–4/2 Ut3 clayey silt, upper boundary with bubbly intrusions,
dark reddish grey– gradual brightening towards top (UB = G)
weak red
303–305 11 2 2.5 YR 4/4 Ut4 compact, homogeneous, clearly defined boundaries
reddish brown (UB = P)
305–315 10d 10 5Y 5/2 – 6/2 Ut4 similar to 10b, homogeneous grey matrix
(light) olive grey (UB = strongly P)
315–317 10c 2 2.5Y 4/1 Ut3 tephra layer, more strongly present in TRI1-B,
dark grey coarser silt, larger pores (UB = P)
317–347 10b 30 5Y 5/2 – 6/2 Ut4 homogeneous grey matrix, more compact than 10a,
(light) olive grey charcoal particles (UB = G)
347–405 10a 58 5Y 5/2 Ut3 grey matrix, black streaks, orange mottled, number
olive grey of degassing holes decreases, gradually more
compact (UB = G)
405–437 9 32 5Y 4/1 Ut2 no macrofossils in whole core, extremely silty,
dark grey small holes may indicate degassing (UB = G)
colouration. The highest amount of carbonates and the low- is very noisy here, generally indicating higher values than
est log(Rb/Sr) values are found in this cluster. before. The exclusion of this unit as a single cluster suggests
Cluster 4 represents only the uppermost sedimentary unit that the environmental conditions for this period are signifi-
19, which covers the period 90–68 cal BP (1860–2018 CE). cantly different from the preceding times.
It is characterized by increasing terrigenous elements and The clusters show a large coherence with the visually ob-
decreasing carbonate content, which are more strongly in- served differences in the sedimentary units. The clusters 1
creasing since 1970 CE (uppermost 10 cm). In this phase, the and 2 contain all units with reddish and blueish colouration,
highest values for a* and b* colour proxies are reached, indi- while clusters 3 and 4 comprise the greyish marls. Due to the
cating the most intensive orange colouration. The Mn profile blueish colouration, units 9 and 18 were rather expected to
E&G Quaternary Sci. J., 69, 139–160, 2020 https://doi.org/10.5194/egqsj-69-139-2020J. Seguin et al.: A 2600-year high-resolution climate record from Lake Trichonida (SW Greece) 149
Figure 6. Dendrogram obtained by the hierarchical cluster analysis. The XRF elements and L*a*b* colour values were used as input
variables.
group into cluster 1. It is important to keep in mind that the manouilidis et al., 2019; Katrantsiotis et al., 2018; Seguin et
results strongly depend on the chosen set of input variables al., 2019, 2000).
(Khamnueva-Wendt et al., 2019). Slight differences in the The point cloud reveals that the lowermost part of the core
clusters were observed when a different set of variables was (units 9, 10a; ca. 2600–2100 cal BP) plots on the positive
selected, and diverse options including different sets of in- side of the axis and is strongly dominated by clastic mate-
put variables, e.g. including the results of the principal com- rial (Fig. 7c). It corresponds mainly to cluster 1 and 2. The
ponent analysis (PCA), have been calculated. It became ob- middle part of the core (ca. 2100–100 cal BP) alternates be-
vious that the larger dichotomous pattern, dividing the core tween positive and negative values with a focus in the up-
into the more calcite-rich matrix on the one hand and the red- per left quadrant, with it being more strongly influenced by
dish and blueish coloured layers on the other, remained un- carbonate precipitation. It consists notably of cluster 3. The
changed, even if a few sedimentary units were sub-clustered uppermost approximately 50 cm (the last ca. 150 years) shifts
differently. towards more positive PC1 scores again, showing an increase
in detrital input. This part is classified as cluster 4. Similar
fluctuations can be observed in the log(Rb/Sr) proxy plot-
4.3.2 PCA ted over time (Fig. 7d), or alternatively log(Ca/Ti) can be
A principal component analysis was conducted on 11 geo- used (Seguin et al., 2020a). The Spearman correlation be-
chemical elements (Al, Si, K, Ca, Ti, Mn, Fe, Co, Rb, Sr, Zr) tween log(Rb/Sr) and PC1 shows an extremely high confor-
to reduce the multivariable dataset to a limited amount of un- mity (rSpearman = 0.95), and thus here these two proxies are
correlated components. The first three principal components assumed to reflect the most important sedimentation changes
(PC) cover > 80 % of the data information and were thus fur- in the lake catchment.
ther analysed in more detail. Figure 7a shows the correlations PC2 is positively associated with Al, Si, and K, while
between the element loadings and the PCs. Elements which the loadings of the other elements are of minor importance
show the same variation and whose loadings cluster together (Fig. 7a). It has a high variance and the interpretation is not
are likely influenced by the same environmental processes. straightforward; it could potentially be linked to changes in
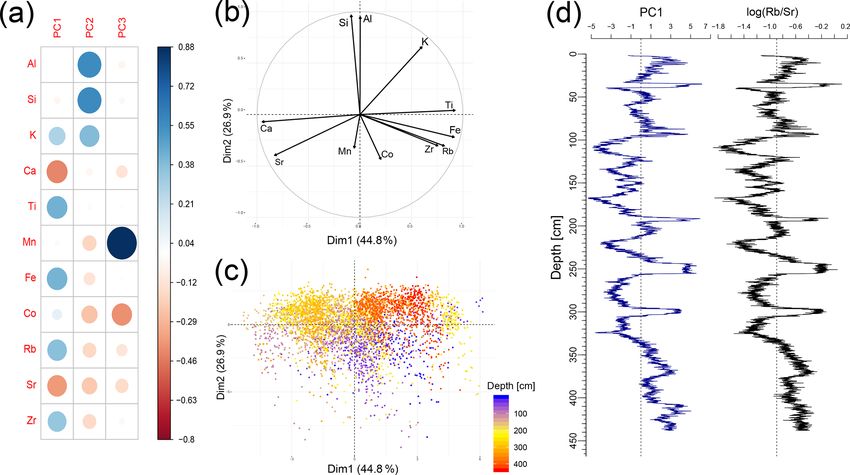
The first principal component captures 44.8 % of the vari- material provenance.
ance and spans the axis between carbonate-rich (Ca, Sr) on PC3 is clearly dominated by Mn and has only a minor con-
the negative axis and mainly mineral-rich assemblages (Zr, tribution of the loading of all the other elements (Fig. 7a).
Rb, Fe, Ti; Fig. 7b) on the positive axis. A similar distri- A correlation between PC3 and Mn/Fe (rSpearman = 0.72)
bution has been found in other studies from the area (Em-
https://doi.org/10.5194/egqsj-69-139-2020 E&G Quaternary Sci. J., 69, 139–160, 2020150 J. Seguin et al.: A 2600-year high-resolution climate record from Lake Trichonida (SW Greece)
Figure 7. Principal component analysis (PCA) based on the centred log-ratio-transformed XRF data. (a) Correlation matrix between original
elements and principal components (PC) 1–3. (b) Variable correlation circle displaying the correlation between PC1 and PC2. (c) Distribution
of the sample points in the PC1–PC2 scatterplot. The samples are coloured according to their depth in the sediment core from purple (surface)
to red (maximum depth). (d) PC1 and log(Rb/Sr) are plotted against depth and show a high conformity.
yields high conformity and suggests that PC3 may hint to- gations that the tephra should more likely be associated with
wards changes in the redox conditions at the lake bottom. the Santorini eruption, which can be rejected based on the re-
cent reconstructions of the pathway of the ash plume (John-
ston et al., 2012). In our age model, this layer dates to 1985–
5 Discussion
1789 cal BP at 316 cm and would thus be in accordance with
the Pompeii eruption in 79 CE (1875 cal BP).
5.1 Chronology
In a recent publication, Insinga et al. (2019) mapped tephra
To support our radiocarbon chronology, we were looking for for the period 2000 to 4200 cal BP in the central Mediter-
independent age indicators. One was found in TRI1 in the ranean. Stratigraphically right below the 79 CE eruption, they
form of a tephra layer at 315–317 cm, lithologically classi- report a new horizon, the “FG/Lipari undefined layer”, orig-
fied as unit 10c (Fig. 3). In the XRF data, Rb, K, Zr and Sr inating from an unknown eruption dated to the time interval
values have a high peak here. Usually, Sr substitutes for Ca 2187 ± 37 to 1970 cal BP. This eruption, which was found
mainly in carbonate or sulfate minerals and co-precipitate in at different sites throughout the Ionian Sea (Insinga et al.,
lakes, but it also occurs in magmatic rocks as part of Ca-rich 2019), also overlaps with the age uncertainty range of our
plagioclase feldspars (Cohen, 2003; Kylander et al., 2011). tephra layer and could have also caused the tephra. The Pom-
This is the only unit in which Rb and Sr correlate, instead peii eruption as well as the newly reported Lipari eruption
of anti-correlating, which suggests that the Sr supply here would both support our age-depth model.
originates from an allochthonous, minerogenic source, e.g. Another independent age marker was found by Bot-
plagioclase feldspars (Dypvik and Harris, 2001; Kylander et tema (1982) in the form of the presence of maize (Zea mays)
al., 2011). This layer was already found around 310 cm by at 110 cm, which according to Bottema needs to be younger
Bottema (1980) and Creer et al. (1981) and described as a than 250 years but unequivocally after 1492 CE (458 BP),
tephra layer. Based on geomagnetic and palynological inves- the date of discovery of the New World. The main spread
tigations, Creer et al. (1981) concluded that due to the wind of maize in the Mediterranean was observed for the 16th
direction this tephra could be associated with the Somma– and 17th century CE (Bintliff, 2012). Our model dates to
Vesuvius eruption in 79 CE that buried the city of Pompeii. 554 cal BP (419–701 cal BP) at 110 cm in TRI1, and, assum-
Bottema (1982, 1980) argued based on palynological investi-
E&G Quaternary Sci. J., 69, 139–160, 2020 https://doi.org/10.5194/egqsj-69-139-2020J. Seguin et al.: A 2600-year high-resolution climate record from Lake Trichonida (SW Greece) 151
ing that the depths were comparable in the cores from both dish and blueish units to specific earthquakes from the cata-
studies, it would be slightly too old in the uppermost part. logue (Papadopoulos et al., 2014).
During the first lake studies, radiocarbon dating on the sed-
iments was challenging and methodological approaches were
5.3 Sedimentary facies interpretation
less advanced. Due to the high sedimentation rate of approx-
imately 1.7 mm yr−1 , the core sequence in principle provides The cluster analysis emphasizes similarities between certain
palaeoenvironmental information in annual resolution. How- sedimentary units of TRI1 based on their colour and geo-
ever, even though our age-depth model is based on terres- chemical characteristics. As these sediment characteristics
trial macro-remains, it only provides an average probability are affected by the palaeoenvironmental conditions during
range of 278 years. Hence, we do not discuss our data on deposition, the dendrogram classification may be used to in-
an annual but rather on a multi-decadal to centennial scale. fer phases with similar palaeoenvironmental conditions. Four
Nevertheless, within the constraints of the age-depth model, different facies were identified during the cluster analysis
we can be more precise about the duration of periods and (Fig. 6).
events than about absolute timing. The presented TRI1 core Cluster 1 is interpreted as compiling phases with higher
sequence continuously covers the last 2600 cal BP over more terrigenous input and bottom water oxygenation, which was
than 4 m of sediments, which is – though not laminated – a caused by rather abrupt changes in the environmental con-
much higher temporal resolution than any other geoarchive ditions, e.g. by intensive precipitation. The higher terrige-
from the area provided so far. nous input is interpreted as an indicator of catchment erosion
during wetter conditions. The values of PC1 are high during
these phases.
5.2 Event layers
Cluster 2 shows likewise a higher amount of detrital mate-
Five lithological units of only few centimetres thickness de- rial that was transported into the lake. The different coloura-
pict a very different colour compared to the remaining se- tion of the sediments in both clusters suggests different pro-
quence (units 11, 12, 14, 16, and 18, Fig. 3). Their lower cesses to have influenced their deposition, but it is not pos-
sediment boundaries can always be classified as being flat sible to unequivocally identify the sedimentary process, as
and sharp but not erosive. If these units were the result of different influential factors would lead to increasing clas-
an immediate mass movement or turbidite event, one would tic input. Wetter conditions with more intense winter pre-
expect an abrupt increase in coarser material and a sorting cipitation may have been one trigger. Another possible trig-
with a fining upwards gradient within these units (Sabatier ger could have been summer storm events that would break
et al., 2017; Wilhelm et al., 2016), which is not possible to down or disturb the stratification in the water column and
identify from the presented analyses. Mn rises steeply at the increase run-off intensity, which would most likely also re-
onset of the units, followed by a gradual decrease within sult in turbulent and coarser sediment deposition. Further-
the respective units (Fig. 4). This pattern suggests bottom more, one may also expect an increasing amount of micro-
water oxygenation (Calvert and Pedersen, 1993) triggered and macrofossils, e.g. broken shells or higher organic matter
by an abrupt (ventilation) event, as during turbidite forma- content, which was washed in and deposited before decom-
tion, which caused Mn enrichment and the changes in colour. position, which we do not observe here. Human impact, e.g.
Afterwards, the system gradually re-gained its initial sta- by deforestation, is also known to increase erosion and detri-
tus. This would support the hypothesis that the reddish and tal material input (Meriam et al., 2018). However, one would
blueish units were deposited during or following short-term expect longer-lasting periods, while these facies units lasted
events. We also elaborated on the option that the units could a maximum of 100 years. We interpret cluster 2 also as indi-
have been deposited at once, e.g. by a turbidity current, treat- cating wetter conditions and attribute the variation in colour
ing these units as mass movement events during the age mod- compared to cluster 1 to differences in the Mn and Fe oxides
elling process. The respective age model overlapped com- (Statham et al., 2017). PC1 likewise shows highest values in
pletely within the uncertainty range of the model without this cluster.
specific event layers (see Fig. S3). Hence, we decided to use The majority of the core is composed of the greyish
the model with continuous sedimentation as the final age- marls in cluster 3, which have a homogeneous appearance,
depth model. although the geochemical ratios show intense fluctuations
As the region is characterized by high seismo-tectonic ac- within these units, most likely reflecting a higher variability
tivity (Taymaz et al., 2007), one plausible trigger causing tur- in palaeoclimate. It is assumed that sediments in this clus-
bidity currents or mass movement events could have been ter were deposited within a stable, stratified lake ecosystem
earthquakes. A connection between earthquakes and terres- with anoxic bottom water conditions. Variations in the XRF
trial landslides and rock falls has been investigated for the data may be explained by palaeoclimatic variation. The high
region by Papadopoulos and Plessa (2000). Due to the fre- Ca content may be linked to intense carbonate precipitation
quent occurrences of earthquakes, however, it seems impos- under warm and dry conditions. The PC1 values are mostly
sible, respecting the age uncertainty range, to assign the red- negative in this cluster.
https://doi.org/10.5194/egqsj-69-139-2020 E&G Quaternary Sci. J., 69, 139–160, 2020152 J. Seguin et al.: A 2600-year high-resolution climate record from Lake Trichonida (SW Greece)
The uppermost sedimentary unit forms cluster 4 by itself tlement activity. In Trichonida, we do not have comparative
and is interpreted as potentially being influenced by anthro- numbers from earlier times. As we do not have indications
pogenic activity in the catchment. It seems as if human ac- for sudden changes, we suppose that small numbers of hu-
tivity in the area has been increasing since the 1860s and mans were always present in the study area during the last
has intensified particularly since 1970 CE with the sudden 2600 years but had a rather marginal influence on the lake de-
increase in a* or that its impacts have increasingly reached velopment. They were probably not responsible for the cre-
the coring spot, e.g. through run-off from cultivated, fertil- ation of the blueish-reddish layers of cluster 1 and 2. How-
ized fields. Mn values in this unit are higher than in unit 3 ever, due to land use activities, they may have indirectly pro-
and have a high variance, potentially indicating instability in vided loose material that could have been eroded more easily
the modern monomictic conditions that supply oxygen to the during strong precipitation events.
hypolimnion. The PC1 values in this unit gradually shift from In an earlier pollen study, Bottema (1982) identified 71
negative to positive and back, and it is likely that the climatic pollen types from the “plant-sociological relevé list” at Lake
signal here was disturbed by human influence. Trichonida. The AP/NAP ratio of arboreal vs. non-arboreal
pollen types was reproduced and is shown in Fig. 8k. As Bot-
5.4 Palaeoenvironmental reconstruction for the last tema (1982) abstained from creating an age-depth model, we
2600 years in comparison to other regional archives used our model to plot the data on a timescale, assuming that
the depth scales of the two cores were comparable, which is
5.4.1 Human history in Aetolia
also suggested by the sediment depth of the tephra unit dif-
Lake Trichonida has been studied irregularly since the 1980s fering by only 5 cm. Overall, the number of pollen types cor-
(for example Albrecht et al., 2009; Bottema, 1982, 1980; related positively with the AP/NAP ratio (Bottema, 1982),
Dimitriou and Zacharias, 2006; Koussouris and Diapoulis, which means that land opening increased the pollen diver-
1982; Tafas et al., 1997). Archaeological research in Aeto- sity and lower AP/NAP values hint towards natural or an-
lia is comparatively weak, as the area was and still is rather thropogenic deforestation. Dense Abies cephalonica wood-
thinly populated, but it confirms human activity since the land could be found in the mountainous regions in southern
Late Helladic period (1700–1100 BCE/3650–3050 BP; Bom- Greece until human deforestation (Jahns, 1993). The low-
meljé and Doom, 1987; Haenssler et al., 2013). Bommeljé est degrees of forestation are depicted in Bottema’s (1982)
and Doom (1987) consider a population peak in the region pollen diagram for the period 2600–2000 cal BP, which is
during the Classical–Hellenistic period (479–31 BCE/2429– considered as a period with a population peak (Bommeljé
1981 BP) and only few traces of human presence throughout and Doom, 1987; cluster 1). The continuous presence of Vi-
Roman and Byzantine times (31–1460 BCE/1981–490 BP). tis pollen confirms our hypothesis of rather constant, but low
The closest major archaeological site is Thermos, which was human influence in the area for the investigated period. The
occupied since the Bronze Age, had its flourishing stage highest arboreal pollen amounts can be observed during the
during the Middle Helladic period (2100–1700 BCE/4050– wet phases of the reddish units in cluster 2. Apart from that,
3650 BP), and was the centre of the Aetolian League (Pa- the resolution is too coarse to reasonably compare it to the
papostolou, 2012). In a recent comparative study on land XRF proxies.
use and demography in Greece by Weiberg et al. (2019),
Thermos was the only site in Aetolia-Acarnania that was in-
5.4.2 Palaeohydrological changes
cluded, underlining the scarcity of data in this region. A simi-
lar picture can be found in the meta-analysis on demography, For the last 2600 years, Lake Trichonida shows different
climate, and erosion by Walsh et al. (2019), which includes phases of palaeohydrological fluctuation. It has witnessed
six Greek sites but completely leaves out western Greece. several phases of wetter or drier climatic conditions, as ob-
They state high levels of human activity during the Classical served in the log(Rb/Sr) and PC1 proxies.
and Roman period for southern Greece, which is in contrast Rb can replace K in the crystal lattice in feldspars and it
with the assumptions by Bommeljé and Doom (1987). These is associated with clay mineral assemblages (Heymann et al.,
findings stress that deduced demographic trends from both 2013; Koinig et al., 2003). As Rb, associated with terrige-
analyses cannot necessarily be transferred to the remote area nous sediment input, and Sr, associated mainly with carbon-
around Lake Trichonida. ates, show a very different geochemical behaviour, the Rb/Sr
The closest palaeoenvironmental archive for comparison ratio is often interpreted as a proxy for chemical weathering
is Etoliko (also known as Aitoliko) Lagoon (Koutsodendris (Jin et al., 2006; Xu et al., 2010). While carbonates can be
et al., 2015, 2017; Haenssler et al., 2013). The sedimenta- associated either with carbonate weathering in the catchment
tion rate at Etoliko Lagoon since 1350 cal BP was calculated or with authigenic precipitation of chemical or biogenic car-
at 2.1 mm yr−1 and is thus in a similar range like at Lake bonates in the lake, notably during dry and warm phases, the
Trichonida. Before, it was calculated at 0.4 mm yr−1 , and clastic elements originate from terrestrial input eroded during
Haenssler et al. (2013) interpret the drastic change as a causal wet periods with enhanced precipitation and run-off (Cohen,
relationship with increasing anthropogenic land use and set- 2003; Kylander et al., 2011). High Sr values are interpreted
E&G Quaternary Sci. J., 69, 139–160, 2020 https://doi.org/10.5194/egqsj-69-139-2020J. Seguin et al.: A 2600-year high-resolution climate record from Lake Trichonida (SW Greece) 153 Figure 8. Comparison of the PC1 proxy with other regional hydroclimate records. (a) NAO index reconstruction from a lake in SW Greenland (axis inverted) from Olsen et al. (2012). (b) Autumn/winter precipitation reconstruction from a speleothem at Closani Cave (SW Romania; Warken et al., 2018). (c) Ti/Ca proxy from Lake Butrint (Albania; Morellón et al., 2016). (d) δ 18 O record from Lake Shkodra (axis inverted; Zanchetta et al., 2012). (e) δ 18 O record from a speleothem in Kapsia Cave (axis inverted; Finné et al., 2014). (f) PC1 on XRF data from Gialova Lagoon (Katrantsiotis et al., 2018). (g) δD23 proxy from Lake Lerna (axis inverted; Katrantsiotis et al., 2019). (h) PC1 on XRF data from Lake Stymphalia (Seguin et al., 2019). (i) log(Rb/Sr) ratio from Etoliko Lagoon (Haenssler et al., 2013). (j) PC1 on XRF data from Lake Trichonida (this study). (k) Arboreal (AP) vs. non-arboreal pollen (NAP) from Lake Trichonida (data reconstructed from Bottema (1982) plotted against our chronology). Values plotted to the top generally indicate wetter conditions. Vertical shaded bars indicate relatively more humid phases at Lake Trichonida (see text for more detail). Vertical dashed lines indicate cultural unit boundaries according to Weiberg et al. (2016). The results of the cluster analysis are plotted at the top. https://doi.org/10.5194/egqsj-69-139-2020 E&G Quaternary Sci. J., 69, 139–160, 2020
154                         J. Seguin et al.: A 2600-year high-resolution climate record from Lake Trichonida (SW Greece)

to generally indicate higher carbonate precipitation under        ical situation during this time period as an incoherent pic-
warm and/or more arid conditions, while higher Rb values          ture without “discernable spatial patterns”. They report gen-
hint towards stronger physical weathering of clastic material     erally warmer temperatures, which would be in agreement
and enhanced surface run-off related to increased precipita-      with the increase in carbonates in the sediment sequence at
tion during colder and wetter conditions (Unkel et al., 2014).    Trichonida.
As PC1 reflects the same variation between carbonate-rich            This drier/warmer phase ends abruptly around 1750 cal BP
and mineral-rich assemblages, it is interpreted similarly (see    with a rapid increase in terrigenous material input into Lake
Sect. 4.3.1). A similar distribution has been found in other      Trichonida, most likely due to increased precipitation and
studies from the area and was interpreted as reflecting hydro-    surface run-off in the catchment. Lithologically, this period
climatic variations (Emmanouilidis et al., 2019; Katrantsiotis    corresponds to the very distinct reddish units 11 and 12
et al., 2018; Seguin et al., 2019).                               (Fig. 3). Closani Cave (Warken et al., 2018, Fig. 8b), Kapsia
    We assume that the lake level has fluctuated over a few       Cave (Finné et al., 2014, Fig. 8e), Lake Lerna (Katrantsiotis
metres – modern inter-annual variation is about 1 m (Tafas et     et al., 2019, Fig. 8g), and Skala Marion Cave (Psomiadis et
al., 1997) – but due to its depth and the sedimentary charac-     al., 2018) all provide evidence for higher humidity for the pe-
teristics, we exclude the option of complete desiccation, as it   riod around 1800 cal BP. Lake Shkodra (Fig. 8d) and Gialova
was shown for shallow lakes in southern Greece (Seguin et         Lagoon (Fig. 8f) also give evidence for a short wetter period,
al., 2020a).                                                      but from a medium term perspective the proxies rather follow
    From around 2600 to 2000 cal BP, PC1 generally shows a        a drying trend lasting until 1400 cal BP (Katrantsiotis et al.,
decreasing trend towards drier conditions in the study area       2018; Zanchetta et al., 2012). Interestingly, this wet century
with a minimum occurring around 2000–1800 cal BP. Olsen           at Lake Trichonida coincides with the aqueduct construction
et al. (2012) reconstructed a high-resolution NAO index for       at Lake Stymphalia, which was interpreted as triggering the
the last 5200 years based on a z score on geochemical data        abrupt shift in the PC1 proxy (Seguin et al., 2019, Fig. 8h).
from a lake sediment record from southwestern Greenland           The AP/NAP ratio depicts an increase in arboreal pollen for
that reflects large-scale variability in the Northern Hemi-       2050–1800 cal BP (Bottema, 1982, Fig. 8k), which on the
sphere climate. Their NAO index for the interval 2400–            one hand supports the wetter conditions favourable for tree
2000 cal BP also shows a predominantly increasing trend that      growth. On the other hand, an increasing input of terrigenous
is likewise connected with drier climatic conditions (Olsen       material, e.g. also caused by increasing land use, may gen-
et al., 2012, Fig. 8a). Centring around 2500 and 2200 cal BP,     erally induce a larger quantity of pollen from the catchment
two short periods with slightly wetter conditions can be iden-    in the sample, and a transformation in the pollen transport
tified in the general trend of the PC1 record, when it be-        process may influence the spectrum composition in the sam-
comes more positive, and are largely in agreement with the        ple. A similar coincidence occurs in 1500 cal BP; an abrupt
negative NAO indices. Katrantsiotis et al. (2019) suggest         increase in terrigenous material coincides with an increase in
that the North Atlantic Oscillation controls the climate in       the AP/NAP ratio.
Greece notably during winter. When the NAO index is posi-            The interval, ca. 1700–1500 cal BP (250–450 CE), can be
tive, the westerlies are stronger than usual and the humid air    interpreted as a phase of stable, drier conditions at Lake
masses run further north, leading to drier and colder winters     Trichonida. Kapsia Cave (Finné et al., 2014) and Closani
in Greece, while negative NAO indices relate to wetter and        Cave (Warken et al., 2018) also show relatively stable condi-
warmer conditions (Katrantsiotis et al., 2019; Koutsodendris      tions, and the NAO index is solely positive although variable
et al., 2015; Nieto-Moreno et al., 2011).                         (Olsen et al., 2012, Fig. 8a). For Anatolia and the Levant,
    Drying climate conditions before 2000 cal BP are also re-     Izdebski et al. (2016) speak of a late Roman drought lasting
ported from Lake Lerna, NE Peloponnese (Katrantsiotis et          from ca. 1600 to 1480 cal BP (350 to 470 CE), which was
al., 2019, Fig. 8g); the Asea valley, central Peloponnese (Un-    then followed by a dramatic shift to much wetter climatic
kel et al., 2014); and Skala Marion Cave, 350 km to the NE        conditions.
on the Greek island of Thassos (Psomiadis et al., 2018). Un-         An abrupt shift to wetter conditions can also be observed at
like these archives, Lake Malik, 250 km to the north at the       Lake Trichonida in ca. 1500 cal BP that lasts about 100 years.
border with Albania (Fouache and Pavlopoulos, 2010), and          It almost coincides with an abrupt shift towards a slightly
Lake Shkodra, 450 km to the north at the border between Al-       negative, neutral NAO index and the wettest period at Lake
bania and Montenegro (Zanchetta et al., 2012, Fig. 8d), as        Lerna (Katrantsiotis et al., 2019). The highest values of the
well as the Agios Floros fen, S Peloponnese (Norström et          Ti/Ca proxy, indicating increasing run-off under wetter con-
al., 2018), reveal a trend towards wetter conditions during       ditions, at Lake Butrint also fall exactly in this phase (Morel-
the same period from 2600 to 2000 cal BP. The resolution of       lón et al., 2016). Wetter conditions are reported from various
the δD23 record from Agios Floros (Norström et al., 2018),        sites in the eastern Mediterranean region for approximately
however, is too low to reasonably compare the record to Lake      1600–1200 cal BP (350–750 CE; Finné et al., 2011; Haliuc et
Trichonida. This inconsistent observation is in general agree-    al., 2017; Seguin et al., 2019). In central and northern Europe
ment with Finné et al. (2011), who summarize the hydrolog-        this period is known as the Late Antique Little Ice Age or

E&G Quaternary Sci. J., 69, 139–160, 2020                                          https://doi.org/10.5194/egqsj-69-139-2020
You can also read