BARRA v1.0: kilometre-scale downscaling of an Australian regional atmospheric reanalysis over four midlatitude domains - GMD
←
→
Page content transcription
If your browser does not render page correctly, please read the page content below
Geosci. Model Dev., 14, 4357–4378, 2021
https://doi.org/10.5194/gmd-14-4357-2021
© Author(s) 2021. This work is distributed under
the Creative Commons Attribution 4.0 License.

BARRA v1.0: kilometre-scale downscaling of an Australian regional
atmospheric reanalysis over four midlatitude domains
Chun-Hsu Su1 , Nathan Eizenberg2 , Dörte Jakob1 , Paul Fox-Hughes3 , Peter Steinle1 , Christopher J. White4,5 , and
Charmaine Franklin1
1 Bureau of Meteorology, Docklands, Victoria 3008, Australia
2 Department of Earth Sciences, The University of Melbourne, Parkville, Victoria 3010, Australia
3 Bureau of Meteorology, Hobart, Tasmania 7000, Australia
4 Department of Civil and Environmental Engineering, University of Strathclyde, Glasgow, Scotland, UK
5 School of Engineering, University of Tasmania, Hobart, Australia

Correspondence: Chun-Hsu Su (chunhsu.su@bom.gov.au)

Received: 2 November 2020 – Discussion started: 15 December 2020
Revised: 25 May 2021 – Accepted: 26 May 2021 – Published: 12 July 2021

Abstract. Regional reanalyses provide a dynamically con-         domain-averaged bias pattern from BARRA-R but does pro-
sistent recreation of past weather observations at scales use-   duce different climatological extremes for temperature and
ful for local-scale environmental applications. The develop-     precipitation. An added-value analysis of temperature and
ment of convection-permitting models (CPMs) in numerical         precipitation extremes shows that BARRA-C provides addi-
weather prediction has facilitated the creation of kilometre-    tional skill over BARRA-R when compared to gridded obser-
scale (1–4 km) regional reanalysis and climate projections.      vations. The spatial patterns of BARRA-C warm temperature
The Bureau of Meteorology Atmospheric high-resolution            extremes and wet precipitation extremes are more highly cor-
Regional Reanalysis for Australia (BARRA) also aims to re-       related with observations. BARRA-C adds value in the repre-
alize the benefits of these high-resolution models over Aus-     sentation of the spatial pattern of cold extremes over coastal
tralian sub-regions for applications such as fire danger re-     regions but remains biased in terms of magnitude.
search by nesting them in BARRA’s 12 km regional reanaly-
sis (BARRA-R). Four midlatitude sub-regions are centred on
Perth in Western Australia, Adelaide in South Australia, Syd-
ney in New South Wales (NSW), and Tasmania. The result-          1   Introduction
ing 29-year 1.5 km downscaled reanalyses (BARRA-C) are
assessed for their added skill over BARRA-R and global re-       At horizontal kilometre scales (1–4 km), convection-
analyses for near-surface parameters (temperature, wind, and     permitting models (CPMs) have provided a step change in
precipitation) at observation locations and against indepen-     weather forecasting capabilities, particularly for forecasting
dent 5 km gridded analyses. BARRA-C demonstrates better          rainfall and cloud cover (e.g. Lopez et al., 2009; Mailhot
agreement with point observations for temperature and wind,      et al., 2010; Brousseau et al., 2016; Clark et al., 2016) over
particularly in topographically complex regions and coastal      local regions with complex terrain or land–sea boundaries
regions. BARRA-C also improves upon BARRA-R in terms             (Calmet et al., 2018). Similarly, CPMs have provided new
of the intensity and timing of precipitation during the thun-    insights for regional climate projections (e.g. Argüeso et al.,
derstorm seasons in NSW and spatial patterns of sub-daily        2014; Prein et al., 2015; Kendon et al., 2017; 2019) beyond
rain fields during storm events. BARRA-C reflects known is-      current global models. For instance, regional CPMs have
sues of CPMs: overestimation of heavy rain rates and rain        suggested that future increases in short-duration precipitation
cells, as well as underestimation of light rain occurrence.      extremes are larger than what can be expected from increases
As a hindcast-only system, BARRA-C largely inherits the          in atmospheric moisture alone (Kendon et al., 2021, and ref-
                                                                 erences therein). Major efforts are underway toward refin-

Published by Copernicus Publications on behalf of the European Geosciences Union.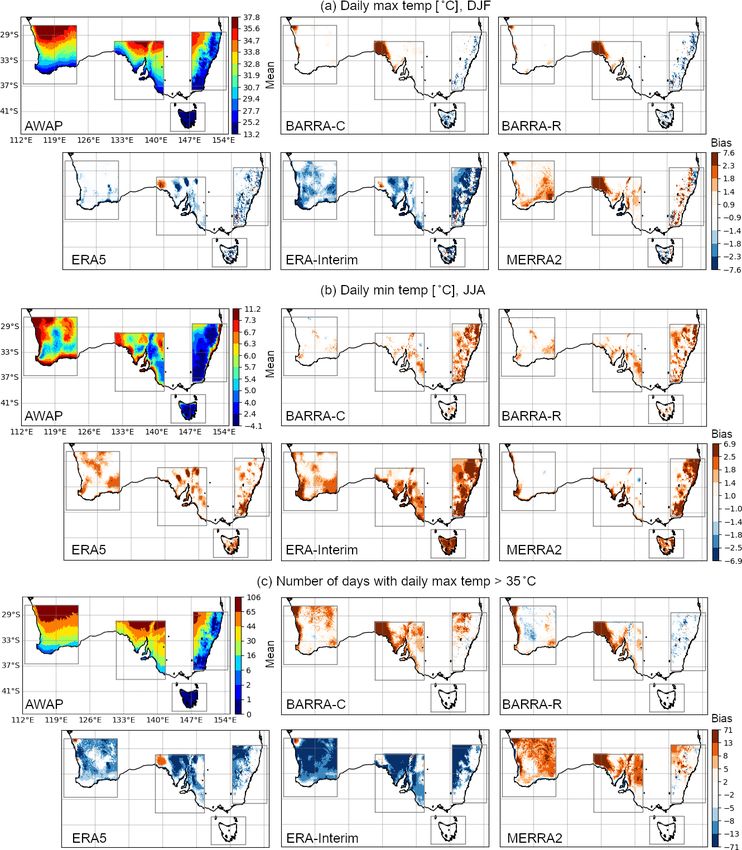
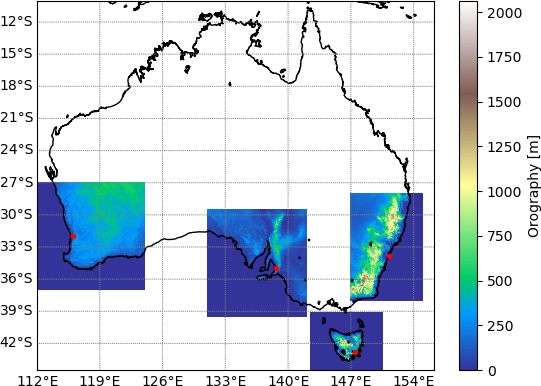
4358                                                                                               C.-H. Su et al.: BARRA v1.0

ing the horizontal resolution of global climate models to the       Global-scale reanalyses have advanced in quality and quan-
kilometre scale (Schär et al., 2020). Extreme weather events        tity during the past 3 decades with improvements to models,
such as thunderstorms, damaging winds, and hailstorms are           data assimilation methods, the number of observations, and
better represented in higher-resolution models (Walsh et al.,       ensemble methods (Kalnay et al., 1996; Ebita et al., 2011;
2016). Current general practice is that grid spacings less than     Gelaro et al., 2017; Dee et al., 2011), as well as with increas-
about 4 km are required to explicitly model small convec-           ing spatial resolution. The latest addition, ERA5 (Hersbach
tive cloud processes, replacing parameterizations of moist          et al., 2020), has a horizontal spacing of 31 km. Users of re-
convection. This avoids several issues seen in parameter-           analyses have called for development towards finer spatial
ized convection schemes used in models with a grid spacing          and temporal scales, i.e. below 10 km horizontal spacing and
greater than 10 km (Lean et al., 2008) and the “grey zone”          sub-daily time intervals (Gregow et al., 2016). Such scales
issues in mesoscale (4–10 km) models (Gerard et al., 2009).         are needed in localized climate monitoring for which local-
A common assumption of traditional convective parameteri-           scale mechanisms influenced by complex topography, coast-
zations is that cloud fields adjust so much more rapidly than       lines, and convective processes are responsible for local cli-
the processes forcing them that this adjustment can be mod-         mate features and feedbacks.
elled as instantaneous. Such schemes thus have no “memory”             Departing markedly from global reanalyses are the re-
of the meteorological flow, leading to unrealistic model be-        gional reanalyses that use limited-area models at higher
haviours. Models with parameterized convection exhibit pre-         horizontal resolutions over sub-regions, e.g. North America
mature convective initiation, a misrepresented diurnal cycle        (Mesinger et al., 2006), the Arctic polar region (Bromwich
of precipitation, overestimation of drizzle occurrence, under-      et al., 2016), Europe (Borsche et al., 2015, and references
estimation of extreme rainfall (Lean et al., 2008; Clark et al.,    therein), India (Mahmood et al., 2018), and Australia (Su
2016), fewer identifiable mesoscale convective systems with         et al., 2019). These reanalyses use grid lengths of the order of
less structure (Done et al., 2004), and rainfall coastal lock-      10 km to improve the representation of sub-daily variability
ing whereby precipitation generated over the sea does not           and near-surface weather. These are generally produced with
penetrate inland (Bureau of Meteorology, 2018). When the            global atmosphere model configurations that include convec-
parameterization scheme is used at a resolution finer than          tion parameterizations (e.g. Su et al., 2019). Recently, Wahl
10 km, it also tends to produce intermittent on–off behaviour       et al. (2017) overcame this with a 7-year 2 km reanalysis
of deep convection (Gerard et al., 2009).                           over Germany with the assimilation of conventional obser-
   By contrast, CPMs can represent deep convection and              vations and radar-derived rain rates and showed improved
mesoscale convective organization explicitly on the model           spatiotemporal variability and intensity frequency of precip-
grid. Explicit modelling of convection better captures precip-      itation. Such a direction in the development of the reanal-
itation persisting across orographic or land–sea boundaries         yses, combined with higher-resolution regional projections,
by the advection of clouds and precipitation. Better represen-      can offer a more accurate picture of changes in regional me-
tation of topography in CPMs also leads to improved wind            teorology and extreme weather in the changing climate.
circulation patterns and resulting vertical velocities (e.g. Fos-      Dynamical downscaling is frequently used to estimate
ser et al., 2015). Improved modelling of the interactions be-       the dynamic variables at scales finer than those of coarser-
tween storm cells and their organizations should improve the        resolution climate or weather models. This approach is un-
estimation of damaging winds. Many studies have found a             dertaken at the Bureau of Meteorology (Bureau) in Aus-
better diurnal cycle of tropical convection over land, cloud        tralia to produce kilometre-scale weather forecasts and/or en-
vertical structure, and coupling between moisture convec-           semble forecasts over major cities, and a 1.5 km forecast-
tion and convergence in CPMs (Stein et al., 2015; Leutwyler         only model has been used since 2017 for added value over
et al., 2017). A finer grid resolution can improve the flow         the Bureau’s lower-resolution global system. This goal is
and wind simulation over the recirculation zone behind the          also pursued in the Bureau of Meteorology Atmospheric
escarpment of a hill, and higher vertical grid resolution im-       high-resolution Regional Reanalysis for Australia (BARRA;
proves simulation on the lee side of hills (Ma and Liu, 2017).      Jakob et al., 2017) project. Within this context, this pa-
   These benefits from using CPMs are yet to be fully real-         per is a companion paper to Su et al. (2019) wherein an
ized in many atmospheric reanalyses. Atmospheric reanaly-           Australian regional 12 km reanalysis system (BARRA-R)
ses combine prior knowledge of physical processes captured          was presented. Here we describe dynamical downscaling of
in the models with observations from a diverse range of in-         BARRA-R using the UK Met Office (UKMO) Unified Model
struments to form spatially complete representations of the         (UM) at a 1.5 km horizontal grid length over four midlatitude
historical atmospheric conditions. They are therefore invalu-       sub-regions of Australia (Fig. 1) over 29 years from January
able for applications concerned with local weather processes,       1990 to February 2019. These regions are chosen in part-
climate signals, or events that were not fully observed such as     nership with state fire and emergency management agencies
climate monitoring and change assessments (Kendon et al.,           because of the important advantages that dynamically down-
2017; 2019), renewable energy assessment (e.g. Frank et al.,        scaled reanalyses can provide for local-scale planning and
2020), and hazard management (e.g. Vitolo et al., 2019).            management to reduce future risks due to extreme weather

Geosci. Model Dev., 14, 4357–4378, 2021                                             https://doi.org/10.5194/gmd-14-4357-2021
C.-H. Su et al.: BARRA v1.0                                                                                            4359

                                                                and a newer version of the meteorological forecast model
                                                                and science configuration (Sect. 2.1). In particular, BARRA-
                                                                R is nested in ERA-Interim reanalysis (Dee et al., 2011) and
                                                                includes four assimilation and hindcast cycles per day (Su
                                                                et al., 2019). BARRA-C is a hindcast-only system that inher-
                                                                its the analysis from BARRA-R as initial conditions. While
                                                                BARRA-C refers to the collection of the four sub-domain
                                                                models, we use BARRA-AD, BARRA-PH, BARRA-SY, and
                                                                BARRA-TA to denote individual domains centred at Ade-
                                                                laide (South Australia, AD), Perth (Western Australia, PH),
                                                                Sydney (New South Wales, SY), and Tasmania (TA) (Fig. 1).
                                                                   The PH and AD domains are similar in terms of climate,
                                                                having arid deserts north of their domains, temperate dry hot
                                                                or warm summers near coasts, and arid steppe climate in be-
                                                                tween (Peel et al., 2007). SY has a temperate climate with
Figure 1. Domains of BARRA-C, (left to right) BARRA-PH          warm to hot summers and lacks a dry season, while TA dif-
(over Perth), BARRA-AD (Adelaide), BARRA-TA (Tasmania), and     fers with a cooler summer. Cool-season perennial grass (C3 )
BARRA-SY (Sydney), showing the modelled orography. Red cir-     is the dominant vegetation over the southwestern region of
cles indicate the locations of the state capital cities.        PH and the near-coast region of AD, and broadleaf trees are
                                                                widespread in the SY and TA domains (Fig. S1 in the Sup-
                                                                plement). There are several large ephemeral salt lakes (e.g.
events such as bushfires. The four downscaling models, col-     Lake Torrens, Lake Gairdner) in the AD domain, and these
lectively referred to as BARRA-C, yield gridded products        are modelled as land points with bare soil. Of the four do-
that include a variety of 10 min to hourly surface parame-      mains, only SY has a distinct thunderstorm season, which
ters describing both weather and land surface conditions as     occurs during November–March. Thunderstorms are far less
well as hourly upper-air parameters covering the troposphere    frequent in the other three domains due to lower incidence
and stratosphere with a 40 km model top on 70 model levels      of warm, humid air masses and also prevalent stable condi-
and 37 pressure levels.                                         tions during the potentially favourable warmer months owing
   This paper describes the model and the experimental de-      to a subtropical high-pressure belt over or near these areas
sign in Sect. 2, and Sect. 3 provides the first assessment of   (Kuleshov et al., 2002). In contrast to PH and AD, the SY
the downscaled reanalysis with a focus on screen-level tem-     and TA domains are topographically complex. The Great Di-
perature, 10 m wind, and precipitation. Comparisons with        viding Range extends north to south through the SY domain,
BARRA-R and global reanalyses are also made to illustrate       and the TA domain features low mountains and a landscape
the added value of BARRA-C. Our findings are further dis-       of plateaus.
cussed in Sect. 4, with an overall summary in Sect. 5.
                                                                2.1   Forecast model

2   BARRA-C                                                     The UM (Davies et al., 2005; version 10.6) is the grid-
                                                                point atmospheric model used in BARRA and ACCESS.
The development of BARRA is based on the Bureau’s op-           It uses a non-hydrostatic, fully compressible, deep atmo-
erational deterministic numerical weather prediction (NWP)      sphere formulation, and its dynamical core (Even Newer
forecasting over the Australian region using the Australian     Dynamics for General atmospheric modelling of the envi-
Community Climate and Earth-System Simulator systems            ronment, ENDGame) solves the equations of motion using
ACCESS-R and ACCESS-C (Puri et al., 2013). The op-              mass-conserving, semi-implicit, semi-Lagrangian (SL), time
erational version at the time (Australian Parallel Suite 2)     integration methods (Wood et al., 2014). The prognostic vari-
of ACCESS-R is the national 12 km 6-hourly analysis–            ables are three-dimensional wind components, virtual dry
assimilation and 3 d forecasting system (Bureau of Meteorol-    potential temperature and Exner pressure, dry density, and
ogy, 2016). ACCESS-R has provided the initial and bound-        mixing ratios of moist quantities. These variables are dis-
ary conditions to initialize and constrain ACCESS-C over        cretized horizontally onto a regular longitude–latitude grid
six smaller domains centred at the Australian cities until      with Arakawa-C staggering (Arakawa and Lamb, 1977) and
2020 (Bureau of Meteorology, 2018). The APS2 ACCESS-            vertically with the Charney–Phillips staggered grid (Charney
C dynamically downscales ACCESS-R to provide 6-hourly,          and Phillips, 1953). The BARRA-C model has a horizontal
1.5 d forecasts at 1.5 km horizontal resolution. The relation   spacing of 0.0135◦ × 0.0135◦ (about 1.5 km at the Equator),
between BARRA-R and BARRA-C mirrors this system but             and its vertical levels follow the modelled orography at the
is implemented with a shorter forecast (or hindcast) range      surface and relax to surfaces of uniform radial height after

https://doi.org/10.5194/gmd-14-4357-2021                                         Geosci. Model Dev., 14, 4357–4378, 2021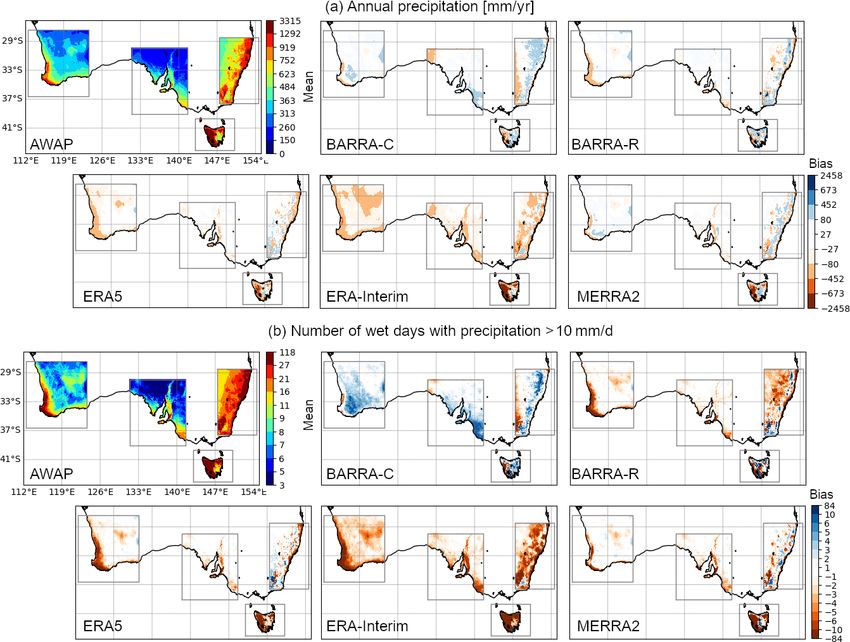
4360                                                                                              C.-H. Su et al.: BARRA v1.0

62 model levels (∼ 17 km above ground) in the upper atmo-         and moisture as well as relatively weak turbulent mixing
sphere, with the model top height at 40 km. At this resolution,   to encourage the model fields to be less uniform and help
the model is run with an integration time step of 60 s.           convection to initiate. BARRA-C does not use stochastic
   The science configuration of the model in BARRA-C is           perturbations for moisture and may thus still suffer from
based on the UK Met Office operational suite OS36, while          convection initiation issues.
BARRA-R is based on the Global Atmosphere (GA6) con-                 Another distinguishing feature of BARRA-C is the han-
figuration of Walters et al. (2017). While the OS36 model         dling of mass conservation during the advection of moisture
configurations preceded the release of the first UM Regional      prognostic variables. This is one of the key science devel-
Atmosphere and Land (RAL1) configuration of Bush et al.           opments in RAL1. BARRA-C and RAL1 use the zero lat-
(2020), BARRA-C implements some of the improvements               eral flux scheme of Zerroukat and Shipway (2017) for mois-
from RAL1. Table 1 summarizes the differences between             ture conservation at the model’s lateral boundaries, avoiding
BARRA-C, BARRA-R, and RAL1. The physical parameter-               spurious extreme precipitation caused by the SL treatment of
ization schemes common to BARRA-C and BARRA-R in-                 moisture variables near partially resolved convection.
clude a variant of Wilson and Ballard (1999) for mixed-phase         BARRA-C is missing some of the configuration improve-
cloud microphysics, the large-scale cloud scheme of Smith         ments introduced in RAL1 because production runs had al-
(1990), and the radiation scheme of Edwards and Slingo            ready commenced. BARRA-C does not include a set of
(1996), all of which have been improved since publica-            changes to the representation of the land surface and the
tion. BARRA-R uses a convection parameterization scheme           canopy radiation model, which improve the damped diur-
based on Gregory and Rowntree (1990), which is not used in        nal cycle issue in near-surface temperatures. BARRA-C also
BARRA-C. With a grid length of 1.5 km, the horizontal grid        does not benefit from the improved treatment of gaseous ab-
length approaches the depth of the boundary layer (Hanley         sorption in both longwave and shortwave regimes in GA7
et al., 2015), and as such it is no longer appropriate to use     and RAL1, which improves interaction with band-by-band
the 1D boundary layer parameterization that restricts mixing      aerosol and cloud forcing.
to the vertical. BARRA-C therefore uses a blended bound-             BARRA uses the land surface scheme of Best et al. (2011),
ary layer parameterization (Boutle et al., 2014b) whereby the     implemented in the Joint UK Land Environment and Sim-
scheme transitions from the 1D vertical turbulence scheme of      ulator (JULES). It describes a 3 m four-layer soil column
Lock et al. (2000) to a 3D subgrid turbulence scheme based        with subsurface temperature updated using a heat diffusion
on Smagorinsky (1963) as a function of the grid length to         equation and with vertical moisture flux estimated using the
the turbulent length scale (Halliwell et al., 2007). The mix-     Richard’s equation and Darcy’s law. The soil hydraulics are
ing length, which can be tuned to control the smoothness of       computed using the van Genuchten equation. It uses a nine-
the fields and the number of small cells, is taken as 300 m,      tile approach to represent subgrid-scale heterogeneity in land
which is used in operational systems.                             cover, with the surface of each land point subdivided into
   The cloud scheme uses a profile of critical relative humid-    five vegetation types (broadleaf trees, needle-leaved trees,
ity values (RHcrit), above which a grid box contains some         temperate cool-season (C3 ) grass, tropical warm-season (C4 )
cloud if the relative humidity is exceeded. Based on the as-      grass, and shrubs) and four non-vegetated surface types (ur-
sumption that there should be less subgrid variability in hu-     ban, inland water, bare soil, and land ice). Urban surfaces
midity for smaller grid boxes, BARRA-C uses higher RHcrit         are represented only by a single urban tile such that street
values that BARRA-R in the lowest few layers, decreasing          canyons and roofs are not distinguished.
smoothly above to 0.8.                                               The characteristics of the lower boundary, climatological
   Without the convection parameterization scheme,                fields, and natural and anthropogenic emissions are specified
BARRA-C relies on the model dynamics to represent                 using static ancillary fields. These are created as per Bush
convective motions. While convection remains unresolved           et al. (2020; Table A1), with the exception of ancillaries for
in 1.5 km models, removal of the cumulus parameteriza-            the land–sea mask, canopy tree heights, and land usage. The
tion has been shown to result in more realistic behaviour         land–sea mask is created from the 1 km resolution Interna-
(Clark et al., 2016). In particular, the model can explicitly     tional Geosphere–Biosphere Programme (IGBP) land cover
capture processes with convective-like characteristics,           data (Loveland et al., 2000) for SY and TA and from Shuttle
which can subsequently drive scales that the model can            Radar Topography Mission (SRTM) orography data for AD
properly resolve. BARRA-C also reduces the appearance             and PH. Land cover data based on the Climate Change Initia-
of unrealistically strong vertical velocities and “grid-point     tive (CCI; Hartley et al., 2017) are not adopted here as their
storms” seen in BARRA-R due to the inability of convective        mapping to the nine land surface tiles over the Australian
parameterization to stabilize the air column (Su et al.,          region remains untested. The canopy tree heights are derived
2019). Nevertheless, convection can remain under-resolved,        from satellite light detection and ranging (lidar; Simard et al.,
leading to cases of small, shallow showers that are too           2011; Dharssi et al., 2015). The land usage ancillary, created
early or no rain at all. The midlatitude version of RAL1          from IGBP, is modified for AD and PH to match the wa-
therefore includes stochastic perturbations of temperature        ter fractions in the Water Observations from Space (WOfS;

Geosci. Model Dev., 14, 4357–4378, 2021                                            https://doi.org/10.5194/gmd-14-4357-2021
C.-H. Su et al.: BARRA v1.0                                                                                                                             4361

Table 1. An overview of major differences between BARRA-C, BARRA-R, and the midlatitude version of RAL1 (RAL1-M). The con-
figurations for BARRA-R are described in Su et al. (2019) and Walters et al. (2017), and those for RAL1-M are described in Bush et al.
(2020).

 Aspects                              BARRA-R                                  BARRA-C                                RAL1-M
 Nesting setup                        Nested in 6-hourly ERA-Interim           Nested in hourly BARRA-R bound-        NA
                                      boundary conditions                      ary conditions
 Horizontal grid length in radial     0.11◦                                    0.0135◦                                0.0135 to 0.04◦
 resolution
 Vertical model level set             70 levels, with 50 levels below          70 levels, with 61 levels below 18 km and 9 levels above this,
                                      18 km and 20 levels above this,          fixed model lid of 40 km a.s.l.
                                      fixed model lid of 80 km a.s.l.
 Model time step                      300 s                                    60 s                                   60–100 s, depending on the model
                                                                                                                      resolution
 UM model version                     10.2                                     10.6                                   ≥ 10.6
 JULES model version                  3.0                                      4.7                                    ≥ 4.8
 Data assimilation                    6-hourly 4D variational analysis         None                                   NA
 Moisture variable SL advection       Quasi-monotone (Bermejo and Staniforth, 1992)                                   Posteriori monotonicity filter
 schemes                                                                                                              (PMF)
 Convective parameterization          Mass flux convection scheme of           None
 scheme                               Gregory and Rowntree (1990)
 Gaseous absorption (radiation)       GA6 (Walters et al., 2017)                                                      GA7 (Walters et al., 2019)
 scheme
 Include spectral land surface        No                                                                              Yes
 albedo
 Canopy radiation backscatter         Isotropic                                                                       Anisotropic
 scheme
 Cloud microphysics scheme            Single-moment scheme based on            Wilson and Ballard (1999), with prognostic graupel (Wilkinson
                                      Wilson and Ballard (1999)                and Bornemann, 2014) and improved warm rain scheme
                                                                               (Boutle et al., 2014a)
 Boundary layer scheme                1D vertical turbulent mixing             Blended boundary layer parameterization (Boutle et al., 2014b)
                                      scheme of Lock et al. (2000)
 Land surface and hydrology           GA6 (Walters et al., 2017), PDM subgrid-scale heterogeneity,                    GA7 (Walters et al., 2019), wherein
                                      JULES urban parameters optimized for Australia (Dharssi                         TOPMODEL is used, and RAL1
                                      et al., 2015)                                                                   changes, namely use of CCI-based
                                                                                                                      land cover tiles, reduced bare soil
                                                                                                                      fraction of short vegetation tiles,
                                                                                                                      scalar roughness lengths for grass
                                                                                                                      tiles, and revisions to the albedos of
                                                                                                                      vegetation tiles
 BL stochastic perturbations          None                                     Perturbation to temperature            Perturbation to temperature and
                                                                                                                      moisture
 BL stability functions               For stable BL, the “sharp” func-         The “sharpest” function for stable BL everywhere; the
                                      tion of Lock et al. (2016) is used       convective BL stability functions are based on UKMO
                                      over the sea, and over land it is a      large-eddy model simulations.
                                      blended combination of the Louis
                                      (1979) and the “sharpest” function
                                      for heights below 200 m. The con-
                                      vective BL stability functions are
                                      based on UKMO large-eddy model
                                      simulations.
 Critical relative humidity profile   0.92 in the lowest layer, with a grad-   0.96 in the lowest layer and a decrease to 0.8 at model level 15
                                      ual decrease to 0.8 at model level 17    (∼ 850 km)
                                      (∼ 2100 km)

https://doi.org/10.5194/gmd-14-4357-2021                                                                Geosci. Model Dev., 14, 4357–4378, 2021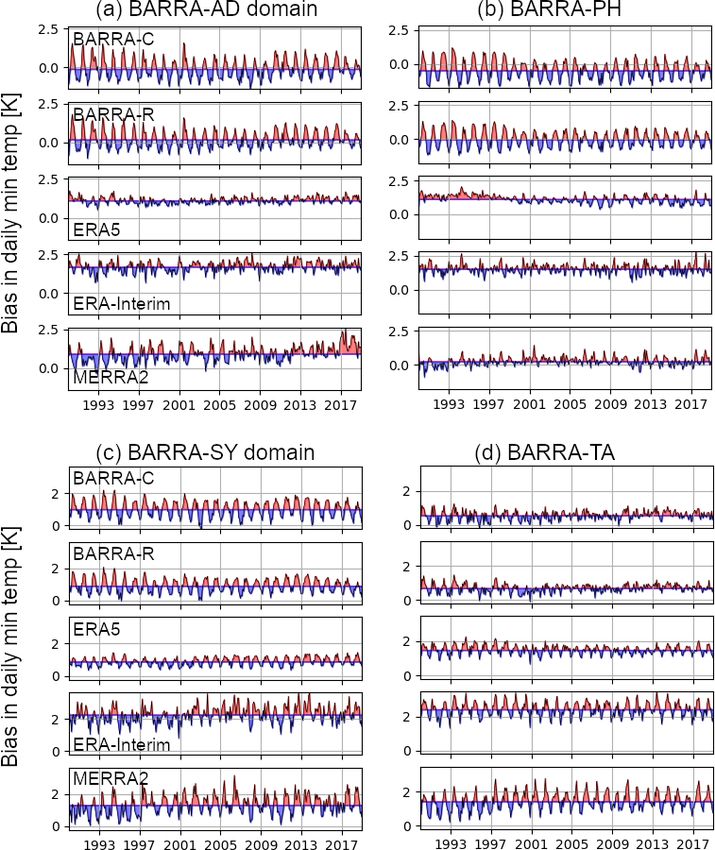
4362                                                                                             C.-H. Su et al.: BARRA v1.0

Mueller et al., 2016). Aerosol absorption and scattering in      servations for temperature (Sects. 3.2 and 3.6) and precipi-
the radiation scheme assume climatological aerosol proper-       tation (Sects. 3.4 and 3.6). Added skill in BARRA-C is il-
ties. A climatological ozone field is also prescribed.           lustrated by comparing these variables against BARRA-R,
                                                                 ERA-Interim hindcasts, and ERA5 hourly analyses (ERA5
2.2    Initial and boundary conditions                           hindcasts only for precipitation). To increase the diversity
                                                                 of models used in our intercomparison, we also include
The BARRA-C model hindcast is re-initialized with 6-             the Modern-Era Retrospective analysis for Research and
hourly initial conditions at the synoptic hours t0 = 00:00,      Applications-2 (MERRA-2; Gelaro et al., 2017) hindcasts. A
06:00, 12:00, and 18:00 UTC created by downscaling from          scale-selective evaluation of extreme storms is conducted in
BARRA-R analyses (Fig. S2 in the Supplement). These              Sect. 3.5 using radar observations available over the SY do-
fields are taken from the centre of BARRA-R’s 6 h analy-         main. Finally, an added-value (AV) method is used to quan-
sis windows. A two-component reconfiguration approach is         tify improvements between BARRA-C and BARRA-R in
used in which BARRA-R winds, moisture, and temperature           the representation of extreme daily maximum and minimum
are downscaled separately with different resolution topogra-     temperature as well as daily rainfall from gridded observa-
phy sets to remove model instability due to large horizon-       tions. Readers are referred to Sect. A in the Supplement for
tal topography gradients. BARRA-C is further constrained         details of the various reference datasets considered in our as-
by BARRA-R at the lateral boundaries without nudging             sessment.
based on the prescription described in Bush et al. (2020)
and a boundary rim width of 0.34◦ . The boundary conditions      3.1   Point evaluation of screen temperature, 10 m wind
force the development of the larger-scale features within the          speed, surface pressure
BARRA-C domains. These setups follow the Bureau’s NWP
system and ensure that the benefits of the BARRA-R analy-        The t0 + 6 h model hindcasts of screen-level temperature,
sis are inherited by BARRA-C, wherein the nested model is        10 m wind speed, and surface pressure are evaluated against
treated as a physically consistent interpolator of the driving   land station observations during the 2010–2012 period, fol-
model.                                                           lowing the approach of Su et al. (2019). These observations
   The JULES soil moisture and temperature are prescribed        have no direct relation to BARRA-C, since there is no anal-
by BARRA-R. Consistent with BARRA-R, daily sea surface           ysis in BARRA-C, and they are not used in the associated
temperature and sea ice 0.05◦ × 0.05◦ analysis from repro-       BARRA-R cycle t0 . These fields are interpolated from the
cessed (1985–2007; Roberts-Jones et al., 2012) and near-         model levels using surface similarity theory (Walters et al.,
real-time Operational Sea Surface Temperature and Ice Anal-      2017). Our benchmarks include BARRA-R and ERA-Interim
ysis (OSTIA; Donlon et al., 2012) are used as lower bound-       t0 + 6 h hindcasts, the MERRA-2 hourly time-averaged hind-
aries over the water after being interpolated to the BARRA-C     cast fields, and the ERA5 hourly analysis. The models are
grid. The near-real-time data are used from January 2007.        interpolated to be coincident with the observed locations and
   Each hindcast in BARRA-C is a 9 h simulation but only 6 h     times. As the observations are irregularly distributed in time,
are used. The model data during the first 3 h are discarded as   all observations within a t0 + 5 to t0 + 7 h time window for
the fine detail is only partially established from the coarse-   t0 = 00:00 and 12:00 UTC are considered. The root mean
resolution initial conditions due to model spin-up. There-       square difference (RMSD), Pearson’s linear correlation, ad-
fore, the hindcast fields between t0 + 4 h and t0 + 9 h form     ditive bias, and variance bias are calculated at each station
the BARRA-C datasets. Such a hindcast length is considered       between observed (do ) and model (dm ) data. Additive bias is
short but is chosen to meet computational constraints when       defined as Bias = E(dm ) − E(do ), where E(·) is the expecta-
regular re-initialization is needed for running the model for    tion operator, and the variance bias as Mbias = var(d  m)
                                                                                                                   var(do ) − 1 so
such an extended period. One clear limitation of our setup is    as to capture differences in the dispersion, where var(·) com-
that model spin-up artefacts are expected to still be present,   putes the variance in time. This assessment does not serve to
particularly for convective clouds and rain.                     provide information on the true quality of the various reanal-
                                                                 yses at their native resolutions; rather, it indicates whether
                                                                 the models contain finer-scale information captured by point
3     Assessment                                                 measurements. Based on Di Luca et al. (2016), we distin-
                                                                 guish three distinct regions with characteristics of complex
Our assessment focuses on near-surface variables and pre-        topography (stations with an elevation higher than 500 m –
cipitation as the aim of BARRA-C is to capture small-scale       topo), land–sea contrasts (stations that are within 1.5◦ of the
local weather phenomena which are most apparent near the         coast – coast), or relatively smooth terrain (stations far from
surface. BARRA-C hindcasts are evaluated against point-          the coast – flat) (Fig. S3 in the Supplement).
scale station observations for screen-level temperature, 10 m       The comparisons of scores across all BARRA-C domains
wind speed (Sect. 3.1), and precipitation (Sect. 3.3). They      are shown in Fig. 2. For temperature, BARRA (i.e. BARRA-
are also compared with gridded daily analyses of these ob-       R and BARRA-C) and ERA5 show better agreement with the

Geosci. Model Dev., 14, 4357–4378, 2021                                           https://doi.org/10.5194/gmd-14-4357-2021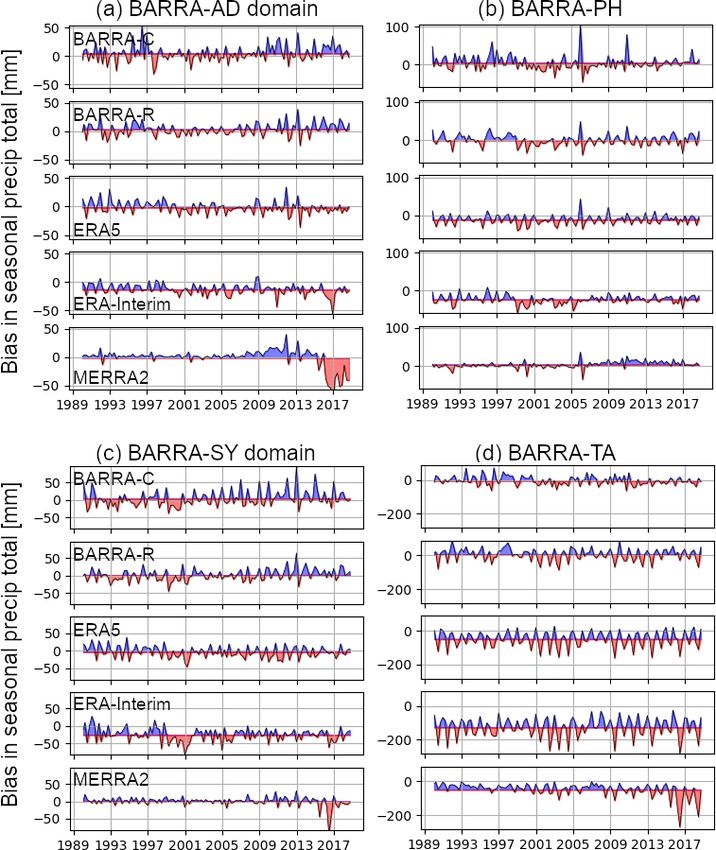
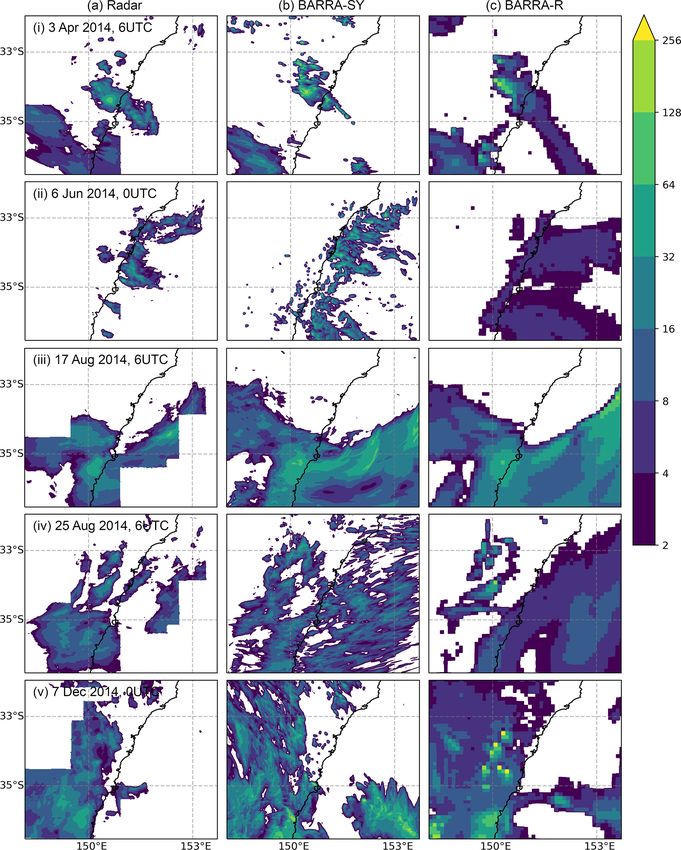
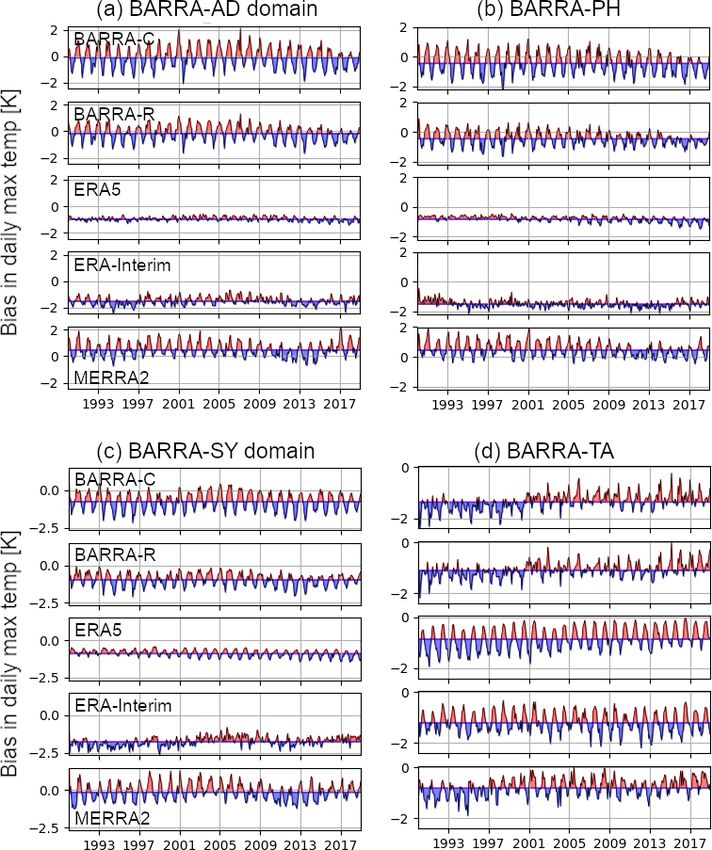
C.-H. Su et al.: BARRA v1.0                                                                                                         4363

Figure 2. Box plots showing the distribution of evaluation scores of various models for (a) screen-level temperature, (b) 10 m wind speed,
and (c) surface pressure across the four BARRA-C domains. Three regions are analysed separately: coastal (“coast”), complex topography
(“topo”), and flat, and the models are distinguished by colours. The scores are calculated from model hindcasts valid between 05:00–
07:00 UTC and 17:00–19:00 UTC against observations during 2010–2012.

station data than the other coarser reanalyses for most met-           and while we observe higher RMSD in BARRA-C, the dif-
rics. For instance, BARRA-C shows lower RMSD than ERA-                 ference is within 1 m s−1 . The wind estimated by all the mod-
Interim at 80 % of stations. BARRA shows greater contrast              els tends to be underdispersed (Mbias < 1), relating to a pos-
from the global reanalyses than between them. ERA5 shows               itive (negative) bias during light (strong) wind conditions.
a warm (additive) bias, while BARRA appears cooler. ERA-               Such a model underdispersion is more striking in the TA and
Interim and ERA5 generally show less variability in temper-            SY domains than in the other domains as well as over coastal
ature than observations (Mbias < 0), while the other models            regions.
tend to have more similar temperature variability with ob-                For surface pressure, the higher-resolution models, includ-
servations. This is related to the cold bias in ERA during             ing ERA5, show markedly lower RMSD near coasts. There
high temperature (shown in the next section). On average,              is very good agreement between ERA5 and the observations.
BARRA scores lower for RMSD than ERA5 at elevated sta-                 BARRA-C shows some improvements over BARRA-R in
tions (e.g. Snowy Mountains in SY) and smaller for Mbias               correlation and Mbias as well as over coastal regions and
at near-coast stations. In general, BARRA-C shows more                 mountains.
visible improvements to BARRA-R at stations near coasts
or over complex topography in terms of RMSD, correla-                  3.2   Comparison with gridded analysis of daily
tion, and Mbias (Fig. S3 in the Supplement). Consequently,                   maximum and minimum screen temperature
BARRA-TA scores higher than BARRA-R on average. How-
ever, BARRA-C shows higher RMSD in the flat regions than               The reanalyses are compared against a gridded daily
in the other regions, unlike the other reanalyses. The degra-          0.05◦ × 0.05◦ analysis of observed maximum and minimum
dation is small (within 0.6 K in terms of RMSD), and for AD,           screen temperature from the Australian Water Availability
this is related to overdispersion (Mbias > 1).                         Project (AWAP; Jones et al., 2009) in Fig. 3. BARRA outper-
   For 10 m wind speed, BARRA-C, BARRA-R, and ERA5                     forms the driving model ERA-Interim in reducing the cold
similarly exhibit lower RMSD and higher correlation with               (warm) bias during summer DJF (winter JJA), particularly
the station data than the other global reanalyses, and the dif-        over the SY and TA domains. BARRA-C shows a smaller
ferences between these three models are not pronounced.                extent of summer cold bias in daily maximum temperature
BARRA’s largest enhancement to ERA-Interim is found at                 over the Great Dividing Range than both BARRA-R and
elevated stations and near coasts, benefitting Tasmania par-           ERA5, but it shares a similar bias with BARRA-R elsewhere.
ticularly. Contrasting with BARRA-R, BARRA-C tends to                  BARRA and the global reanalyses also exhibit a considerable
show lower RMSD at these stations (Fig. S3, Supplement),               warm bias in the northwest of the AD domain, the Nullarbor

https://doi.org/10.5194/gmd-14-4357-2021                                                   Geosci. Model Dev., 14, 4357–4378, 2021
4364                                                                                                  C.-H. Su et al.: BARRA v1.0

Figure 3. Mean difference in (a) summer (DJF) daily maximum temperature, (b) winter (JJA) daily minimum temperature, and the (c) number
of days with temperature exceeding 35 ◦ C in various models during 1990–2018 with respect to AWAP. The models are regridded onto the
AWAP grid using nearest-neighbour interpolation.

Plain, but this is likely an artefact of the AWAP station den-        for daily maximum and minimum temperature, respectively.
sity and is discussed later.                                          They are similar between BARRA-C and BARRA-R, with
   The warm bias in daily minimum temperature in winter is            BARRA-C showing slightly wider inter-seasonal variability.
also similar between BARRA-C and BARRA-R. BARRA-                      The inter-seasonal range of bias in BARRA is around 2 K,
C has largely inherited the biases from BARRA-R but with              which is similar to ERA-Interim and MERRA-2 in most do-
small local-scale differences. Despite such similarities in           mains but is larger than ERA5 with the exception of TA. For
summer bias, there are more hot days (i.e. days exceeding             AD and PH, the daily maximum temperature is positively bi-
35 ◦ C or 308.15 K) in Fig. 3c in BARRA-C than in BARRA-              ased during summer months (DJF) and is negatively biased
R over inland Australia. By contrast, the summer cold tem-            during winter (JJA). The negative bias in daily maximum
perature bias in both ERA reanalyses is also reflected by             temperature is smallest during summer for SY and TA and
fewer hot days and vice versa for MERRA-2. Further analy-             is largest during winter for SY. For daily minimum tempera-
sis of the temperature extremes is considered in Sect. 3.6.           ture these are reversed; e.g. the associated positive bias peaks
   Figures 4 and 5 examine the inter-seasonal and inter-              during winter for AD, PH, and SY, and the negative bias is
annual variations in temperature bias with respect to AWAP            maximum during summer for AD and PH.

Geosci. Model Dev., 14, 4357–4378, 2021                                                https://doi.org/10.5194/gmd-14-4357-2021
C.-H. Su et al.: BARRA v1.0                                                                                                  4365

Figure 4. Time series of monthly mean difference in daily maximum temperature averaged over various BARRA-C domains with respect to
AWAP. The time series are shaded around their individual 1990–2018 means.

   There is both inter-annual variability and a trend of the        BARRA versions are similar and generally underdispersed
temperature biases in BARRA. For daily maximum tempera-             by 0.3 K compared to AWAP.
ture bias, there is a cooling trend in AD and PH and a warm-
ing trend in TA. These trends can also be seen in ERA5 and          3.3   Comparison with rain gauges over Sydney
MERRA-2. For daily minimum temperature bias, trends in
BARRA are less apparent than in ERA5 and MERRA-2. We
                                                                    Hourly modelled precipitation from BARRA and ERA5 is
also observe in the TA domain that BARRA shows a small
                                                                    compared against observations from 27 rain gauges within a
warming trend with respect to AWAP.
                                                                    1◦ radius around Sydney during the warmer months (NDJF)
   This analysis of variability in the bias is repeated for the
                                                                    in 2008–2013 in Fig. 6. During these months convection
standard deviation of the modelled temperature and AWAP
                                                                    processes dominate and can produce a distinct diurnal dis-
in Figs. S4 and S5 in the Supplement. BARRA-C shows
                                                                    tribution in thunderstorm activity. The greatest frequency
a slightly wider dispersion of daily maximum temperatures
                                                                    of severe thunderstorms occurs in November and Decem-
than AWAP (by 0.4 K) and BARRA-R (by 0.1 K), with the
                                                                    ber (Griffiths et al., 1993). ERA5 and to a lesser extent
exception of the TA domain. For BARRA-TA, the standard
                                                                    BARRA-R both underestimate the frequency of heavy rain
deviation of BARRA is similar to AWAP and is higher than
                                                                    rates > 8 mm h−1 . By contrast, BARRA-C underestimates
the global reanalyses. For daily minimum temperature, both
                                                                    the frequency of light rain rate and overestimates heavy rates.

https://doi.org/10.5194/gmd-14-4357-2021                                              Geosci. Model Dev., 14, 4357–4378, 2021
4366 C.-H. Su et al.: BARRA v1.0
Figure 5. As Fig. 4 but for daily minimum temperature.
BARRA and ERA5 also distribute rainfall differently over a ern and western seaboards and the Fleurieu and Yorke penin-
day. BARRA-C shows a bimodal distribution similar to the sulas of South Australia. BARRA-C also shows dry biases on
observations despite showing too much rain leading up to the western borders of the AD and SY domains, possibly due
the 06:00 UTC peak and too little rain during the daily mini- to inconsistencies with the zero lateral moisture mass flux
mum around 18:00 UTC. BARRA-R shows less diurnal vari- on the boundary conditions (Sect. 2.1). A striking difference
ation in rainfall with too much rain distributed during 00:00– between BARRA and the global reanalyses is over western
06:00 UTC, whereas ERA5 shows a pronounced early timing Tasmania where the latter displays a dry bias.
bias. In Fig. 7b, BARRA-R, ERA5, and ERA-Interim show
too few heavy rain days (> 10 mm d−1 ) over the coast-
3.4 Comparison with daily rainfall analysis lines, SA peninsula, and western Tasmania. BARRA-C im-
proves on this but generally simulates more heavy rain days
Figure 7a compares the modelled precipitation against the than other reanalyses and too few moderate–light rain days
daily rain-gauge analysis from AWAP including MERRA-2’s (< 10 mm d−1 , not shown) in all domains. BARRA-R and
hourly time-averaged precipitation (PRECTOTCORR) prod- MERRA-2 generally show too many light rain days, and the
uct. BARRA-C shows a wet bias over the Great Dividing ERA reanalyses show too many light rain days in SY and
Range and the southeast area of the AD domain but improves eastern Tasmania and too few in AD, PH, and western Tas-
the dry bias in BARRA-R and ERA reanalyses over the east- mania.
Geosci. Model Dev., 14, 4357–4378, 2021 https://doi.org/10.5194/gmd-14-4357-2021C.-H. Su et al.: BARRA v1.0 4367
3.5 Storms over Sydney
The point gauge-based assessment in Sect. 3.3 is harsher
to higher-resolution models than coarser models due to the
compound error of space and time near-misses, which in-
creases as the grid cells shrink. Therefore, we compare the
simulated rainfall from BARRA-SY with the Bureau’s radar
nowcasting rainfall product (Rainfields2; Seed et al., 2007)
and use the fractions skill score (FSS) to allow assessment
at different spatial scales following the approach described
in Roberts and Lean (2007), Jermey and Renshaw (2016),
and Acharya et al. (2020). The FSS provides an evaluation
of the rainfall skill as a function of spatial resolution. The
radar product, blended with gauge observations using con-
ditional merging (Sinclair and Pegram, 2005), is available
from 2014 onwards on a mosaic grid consisting of the do-
mains of multiple radars. Following Acharya et al. (2020),
the largest 36 storm events during 2014–2016 are selected
based on domain-averaged daily precipitation.
FSS is categorized as a “neighbourhood verification” met-
ric (Ebert, 2009) in which fractional coverages of grid cells
close to observations are valued equally. The FSS tallies the
Figure 6. Distribution of (a) hourly rain rate (mm per hour) and relative number of “hits” between the model and the obser-
(b) rain over 24 h in UTC over Sydney during November to Febru- vation at different spatial scales and different rain thresh-
ary in 2006–2018. olds. An FSS of 1 represents a perfect forecast wherein the
number of cells with precipitation above a threshold within
a neighbourhood is identical between the model and obser-
The inter-seasonal and inter-annual variations in precipi- vation grids for all possible neighbourhoods. Here, BARRA
tation bias with respect to AWAP are plotted in Fig. 8. As hourly rain rates are regridded to the radar grid of 1.5 km,
with temperature (Fig. 4), they are similar between BARRA- and the accumulated rain amounts over moving 6 h windows
R and BARRA-C, although the latter shows a larger range in are analysed. From the 36 multi-day storm event set, 1323
all BARRA-C domains except TA. In particular, a wet bias is different 6 h events are produced using a moving window.
generally observed during the wet season (JJA for AD, DJF FSS is computed for each 6 h event for each model, and then
for PH), wetter months (JJA for TA), and thunderstorm sea- the scores are aggregated to give an average for all events.
son (DJF for SY). A dry bias generally occurs during the Given that inherent bias between the observation and the
dry season or drier months, i.e. SON for AD, PH and TA. models exists due to differences in their representativity, and
This is consistent with the tendency of BARRA-C to over- also to focus on the spatial accuracy of the models, we use
estimate heavy rain rates and underestimate light rain occur- percentile-based thresholds computed across all the storm
rence. Some of the inter-annual variations in bias are clearly events. This ensures that the model and observed rain fields
common amongst BARRA and the global reanalyses, e.g. in have an identical fraction of rain events for each threshold
AD and PH domains during the Millennium Drought (1996– value (explained further in Sect. E in the Supplement). Fig-
2009) when the various models share a dry bias. BARRA ure 9 illustrates the striking differences between BARRA-R
also shows different trends to the global reanalyses. There is and BARRA-SY for five events in 2014. BARRA-SY can
a wetting trend post-2009 for BARRA in AD, but this is op- show more realistic organization in the 1.5 km model ow-
posite for the other models. In SY, BARRA also displays a ing to the explicit modelling of convection and can produce
wetting trend, while ERA trends are drier. higher rainfall intensity. The event on 7 December 2014 in
It should, however, be noted that, as is often found for grid- Fig. 9v illustrates a summer storm case in which BARRA-R
ded interpolated data, AWAP tends to underestimate the in- shows rainfall accumulation lacking the spatial pattern com-
tensity of extreme rainfall events and overestimate the fre- mon to convective organization that is evident in BARRA-
quency and intensity of low rainfall events (King et al., SY and in observations. BARRA-R also shows excessive
2012). The errors are larger at high elevations (SY and TA) grid-point precipitation over the mountains, which is absent
where gauges are fewer, when there is frozen precipitation, in both observations and BARRA-SY. At the same time,
and/or topography is exposed to prevailing winds (Chubb BARRA-SY can show too many cells (Fig. 9ii), which can
et al., 2016). produce streaks of light rainfall (Fig. 9iv).
https://doi.org/10.5194/gmd-14-4357-2021 Geosci. Model Dev., 14, 4357–4378, 20214368 C.-H. Su et al.: BARRA v1.0
Figure 7. Mean difference in (a) annual precipitation and (b) annual count of wet days with depth ≥ 10 mm. The models are regridded onto
the AWAP grid using nearest-neighbour interpolation.
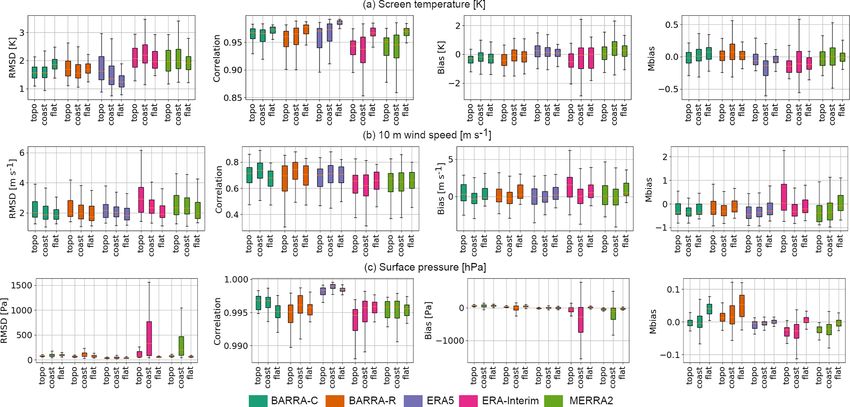
The FSS results in Fig. 10 show that BARRA-SY is more are given by the percentiles of the daily temperature
skilful over all scales than BARRA-R for all threshold lev- and precipitation values over the 29-year time period.
els. FSSuniform is the FSS of a forecast field with a uni- We use AVd = [d(XBARRA-R , XAWAP ) − d(XBARRA-C ,
form fractional coverage equal to the fraction of points ob- XAWAP )]/[d(XBARRA-R , XAWAP ) + d(XBARRA-C , XAWAP )]
served with any rain (> 0.2 mm h−1 ). Scores greater than from Di Luca et al. (2016), where d defines a distance
FSSuniform are considered skilful. For the lowest threshold metric between the model-derived and AWAP-derived
(56 %, i.e. 4 mm in the observed radar values), the uniform statistics computed across the grid cells. To capture both
score (FSSuniform ) is reached at scales of 0.3◦ (BARRA-SY) the total errors and spatial patterns of the statistics, we let
and 0.65◦ (BARRA-R). At the highest threshold (99.9 %, d ≡ MSE(A, B) = E (A − B)2 to define the mean squared
64 mm), the uniform score is reached at scales of 2.4◦ and error and also use d ≡ Corr(A, B) = 1 − R(A, B), with R as
3.35◦ , respectively. The contrast between the two BARRA Pearson’s correlation. Larger positive AV values suggest
FSSs is therefore greater at the higher precipitation thresh- smaller errors in BARRA-C than in BARRA-R and thus
olds. FSSs for higher rainfall thresholds are also generally substantial added value by the downscaling of BARRA-R.
lower as the area of rain being sampled becomes more lo- Figure 11 plots AV scores for different BARRA-C do-
calized and is more challenging to reproduce correctly in the mains, showing that AV is not gained consistently across
models. the percentiles, variables, and domains. For warm extremes
of daily maximum temperature, BARRA-C shows positive
3.6 Added-value analysis for temperature and rainfall AVMSE over BARRA-R in the TA and AD domains. Low
extremes or negative AVMSE for AD, PH, and SY (inland region) is
mainly due to the warm and wet bias in BARRA-C seen
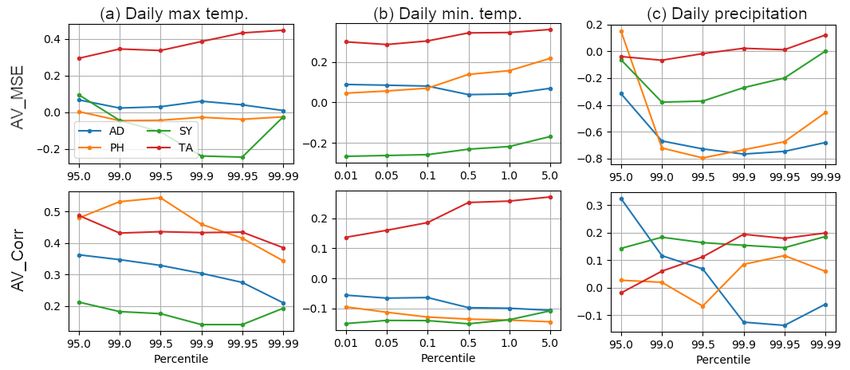
We apply an approach similar to Di Luca et al. (2015) in Figs. 3c and 6a and b. The positive AVCorr indicates that
to quantify the added value (AV) in the representation of BARRA-C captures the spatial patterns of the warm extremes
climatological extremes from BARRA-C by comparing its across the domains, particularly over the coastal and high-
skill to the skill in BARRA-R. The warm extremes of daily topography regions (see also Fig. S6 in the Supplement).
maximum temperature, the cold extremes of daily minimum For cold extremes in Fig. 11b, BARRA-C still shows pos-
temperature, and the wet extremes of daily precipitation itive AVMSE over all domains except SY. This AV is mostly
are assessed against AWAP. The statistics for extremes (X) contributed by coastal regions, as seen in Fig. S6. Negative
Geosci. Model Dev., 14, 4357–4378, 2021 https://doi.org/10.5194/gmd-14-4357-2021C.-H. Su et al.: BARRA v1.0 4369
Figure 8. Mean difference in seasonal precipitation totals over various BARRA-C domains with respect to AWAP. Black curves are shaded
around the 1990–2018 means. Note that the y axes in (a–d) are different.
AVMSE in SY is related to warmer cold extremes, particularly 4 Discussion
over the Great Dividing Range. Positive AVCorr is seen in TA
but not in the other domains. However, it should be noted that
The BARRA-C 1.5 km models are strongly forced by
the BARRA versions are generally strongly correlated with
BARRA-R with both initial conditions every 6 h and hourly
AWAP, with R mostly between 0.7 and 0.9.
boundary conditions. BARRA-C has therefore inherited
AV from BARRA-C for wet extremes of precipitation re-
much of the same quality of BARRA-R; however, it does
lates more to the spatial patterns of the extremes (Fig. 11c).
provide additional information about local near-surface me-
There is negative AVMSE for all domains except TA, which
teorological conditions. BARRA-C provides better repre-
remains near zero, highlighting the BARRA-C rainfall bias.
sentative point-scale estimates of screen temperature, 10 m
On the other hand, the AVCorr is positive for all domains ex-
wind speed, and surface pressure at some areas with com-
cept AD for the three highest rainfall percentiles, which in-
plex topography or near coastlines, and it mainly inherits the
dicates better spatial correlation of rainfall than BARRA-R.
skills of BARRA-R over other areas. The degradation from
BARRA-R is slight, within (RMSD) 0.6 K for temperature
and 1 m s−1 for wind speed.
BARRA-C also shows a 10 m wind speed bias that is pos-
itive (negative) during light (strong) wind conditions, simi-
https://doi.org/10.5194/gmd-14-4357-2021 Geosci. Model Dev., 14, 4357–4378, 20214370 C.-H. Su et al.: BARRA v1.0
Figure 9. Simulated 6 h rainfall accumulation [mm] in BARRA-SY and BARRA-R compared with rainfall derived from the composite radar
network around the Sydney area for five events.
lar to the bias in BARRA-R. Many factors such as boundary BARRA-C also inherits the domain-averaged biases in
layer mixing, form drag for subgrid orography, and surface daily maximum and minimum temperature from BARRA-
properties can influence wind estimation over land. The rep- R. It reduces some bias over the Great Dividing Range but
resentation of the stable boundary layer remains challeng- simulates more hot days than seen in observations, particu-
ing due to the multiplicity of physical processes and their larly over inland Australia. However, in some inland regions
complex interactions, i.e. turbulence, radiation, land surface the AWAP analyses are poorer quality due to low observing
coupling and heterogeneity, and turbulent orographic form station density. For example, in the northwest of the AD do-
drag. Models typically suffer biases in 2 m temperature and main – the Nullarbor Plain – both BARRA and the global
wind speed under such conditions (Steeneveld, 2014, and ref- models show a large warm bias in daily maximum tempera-
erences therein). ture; however, the station density used in AWAP is less than
two per square degree (Sect. A in the Supplement).
Geosci. Model Dev., 14, 4357–4378, 2021 https://doi.org/10.5194/gmd-14-4357-2021C.-H. Su et al.: BARRA v1.0 4371
realistic organization and does not underestimate peak rain
rates. However, the latter also exhibits too much heavy rain
and not enough light rain, which is likely due to the still
under-resolved convection and the model’s inability to re-
solve detrainment from convective updrafts. This is consis-
tent with the findings reported in other studies. For exam-
ple, Lean et al. (2008) and Hanley et al. (2015) found that
1 km grid length UM simulations tend to produce cells that
are too intense, too far apart, and with not enough light rain.
The latter also noted insufficient small storms in both shower
cases and large storm cases, as well as too many large cells
in shower cases.
The short hindcast length in BARRA-C (Sect. 2.2) poses
a further limitation. The rainfall excess could result from
model spin-up. Extra energy (i.e. CAPE) builds up during the
early time steps when there is insufficient convection, which
is finally released in the form of convective precipitation in
later time steps (Lean et al., 2008). Champion and Hodges
(2014) have also noted that modelled precipitation intensities
are most accurate when the model is initialized 12 h before
the rain maxima. The moisture-conserving zero lateral mass
flux boundary conditions in BARRA-C exacerbate this issue.
Figure 10. Aggregated FSS across 1323 6 h storm events as a func- Moisture variables are not advected across boundaries and
tion of neighbourhood distance (degrees) for 6 h rainfall above three are instead allowed to develop via physical processes in the
percentile thresholds (distinguished by colours, percentile values, model. These processes take some time to spin up in each
and observed amount in mm). The solid curves indicate the score hindcast, leading to a near-boundary downstream moisture
for BARRA-SY, dotted curves for BARRA-R, and the dashed hor- bias, e.g. the western boundary of the annual rainfall maps
izontal lines the uniform score (FSSuniform ) for each threshold as of the AD and SY domains (Fig. 7a). These issues of pre-
specified by Roberts and Lean (2007).
cipitation with short hindcasts can be improved with an as-
similation system that will allow high-resolution features to
propagate from one hindcast cycle to the next (Dixon et al.,
The daily temperature bias varies differently in time be- 2009). In spite of these limitations, we find that BARRA-C
tween the four domains, with AD and PH showing a change provides a more representative rainfall climatology for heavy
of sign in bias between summer and winter months, while rain days near the coastal and mountainous regions, as well
SY and TA show a persisting negative (positive) bias for as better sub-daily rain spatial patterns.
daily maximum (minimum) temperatures. Such similarities BARRA-C simulates peaks in the diurnal distribution of
between the domains may be related to their similarities in precipitation better than BARRA-R and ERA5. However, we
terms of climate and land cover. Bush et al. (2020) discussed also find that precipitation may be initiated too early and
the fact that changes in RAL1 for land surface representa- grow too rapidly. Consequently, BARRA-C under-represents
tions (Table 1, Sect. 2.1) are important to improve the diur- off-peak rain rates, resulting in an overly pronounced diurnal
nal biases in pre-RAL1 configurations. These could benefit cycle, as seen in Fig. 4(b) for BARRA-SY in summer. This is
the biases seen over vegetated areas, particularly for daily contrary to the expectation for all models to initiate too late
minimum temperature in SY and TA. since subgrid-scale initial plumes cannot be represented. The
Differences in land classification between BARRA and early initiation bias in BARRA-R is due to the CAPE-based
ERA reanalyses can explain some of the differences seen trigger mechanism of the convection scheme (Lean et al.,
in the comparison of gridded daily maximum and minimum 2008). In the case of the kilometre-scale UM, there are likely
temperatures seen in Fig. 3. BARRA avoids the bias in ERA several reasons. Hanley et al. (2015) partly attributed tim-
over the salt lakes in SA by modelling them with land char- ing bias in convection initiation, which is too early in shower
acteristics based on IGBP, whereas ERA uses CCI. cases and too late in the larger storm cases, to unresolved
The dry bias of higher rain rates seen in the coarser-scale convection at the kilometre-scale grid length. Other reasons
models during the thunderstorm seasons in the SY domain may be that stochastic perturbations (Sect. 2.1) or model re-
is alleviated by BARRA-C. The underestimation of the peak sponses to the pre-convective profile are too strong or that the
rain rates in BARRA-R and ERA5 was expected from the profile has inadequate convective inhibition (CIN). The var-
lack of convection organization due to the use of a cumulus ious aspects (intensity, size, and timing) of simulated cells
parameterization, whereas BARRA-C evidently shows more have been shown to improve with adjustments to the mix-
https://doi.org/10.5194/gmd-14-4357-2021 Geosci. Model Dev., 14, 4357–4378, 20214372 C.-H. Su et al.: BARRA v1.0
Figure 11. Added-value (AV) analysis of the (a) warm extreme of daily maximum temperature, (b) cold extreme of daily minimum temper-
ature, and (c) wet extreme of daily precipitation for all four BARRA-C domains.
ing length used in the subgrid turbulence scheme, but not all AV can be related to temperature and precipitation biases,
aspects improve simultaneously (Hanley et al., 2015). which differ between the regions. For example, the BARRA-
There are trends and/or inter-annual variability of the bias C wet bias relative to AWAP, particularly over the PH domain
in BARRA against analyses of temperature and precipitation (Fig. 7b), is responsible for the low AVMSE for rainfall. The
observations, and some of these trends are also apparent in positive AVCorr for precipitation in BARRA-SY agrees with
the global reanalyses. BARRA-C has similar bias variabil- the above FSS analysis, which somewhat avoids the wet bias
ity as BARRA-R, and its magnitude is similar to or less than issue through percentile-based thresholding.
the global reanalyses. Spurious trends or artificial shifts in Assessing AV for wet extremes may also be problematic
reanalyses could result from abrupt changes to the amount with AWAP. As an interpolated dataset, AWAP tends to un-
of data assimilated, e.g. at the start and end of satellite mis- derestimate the intensity of extreme heavy rainfall observed
sions or the various observational data archives. In BARRA- at stations, and the issue is more pronounced at locations with
R, corrections were also made to the observation screening sparse observational sampling or high topography, particu-
and thinning rules mid-production (Su et al., 2019). How- larly in SY and TA (Chubb et al. 2016; King et al., 2012).
ever, it is outside the scope of this work to assess the impacts While this analysis suggests that limited value is added by
of various observational changes. the downscaling of BARRA-R for these extremes, the true
BARRA-C shows better agreement with the pattern and AV of BARRA-C at its native resolution is not assessed here
the relative distribution of radar-derived rainfall during given the limited resolution of AWAP and can be explored
storms over Sydney. This improvement is due to the use of further with the scale-dependent AV analysis of Di Luca et al.
explicit convection (Sect. 2.1) and a higher-resolution model (2016). Determining AV at the kilometre scale is also ex-
and is consistent with earlier studies with UM (e.g. Lean pected to be challenging as more accurate and representative
et al., 2008). Comparisons of FSS from the same events in- observational datasets are needed.
cluding ERA5 show that its lower resolution leads to larger
representation errors and lower FSS than BARRA-R despite
both parameterizing convection (Fig. S6, the Supplement). 5 Conclusions
While BARRA-C still shows considerable bias compared to
both rain gauges and radar observations, it adds value to The recent development of CPMs in NWP has facilitated
BARRA-R and ERA by providing more realistic and accu- the creation of kilometre-scale regional reanalysis and cli-
rate spatial representations of rainfall during storms at vari- mate projections. BARRA is the first regional reanalysis that
ous spatial scales and percentile thresholds. focuses on the Australasian region. It has been developed
The AV analysis of temperature and precipitation extremes with significant co-investment from state-level emergency
shows that BARRA-C provides some value over BARRA- service agencies across Australia. BARRA-C is the critical
R in various aspects including the spatial patterns of the component of the project that provides these agencies with
warm temperature extremes and wet precipitation extremes the means to develop a deeper understanding of past ex-
as well as the bias in cold extremes over coastal regions. Low treme weather at local scales, especially in areas that were
not adequately served by observation networks (e.g. Fig. S3,
Geosci. Model Dev., 14, 4357–4378, 2021 https://doi.org/10.5194/gmd-14-4357-2021You can also read