Policy Dialogue on the assessment and convergence of RES Policy in EU Member States
←
→
Page content transcription
If your browser does not render page correctly, please read the page content below
Contract N°: IEE/12/833/SI2.645735

 Project Acronym: DIA-CORE

 Policy Dialogue on the assessment
and convergence of RES Policy in EU
 Member States

D4.2: RES market values and the merit-
order effect
 Project Coordinator: Fraunhofer ISI

 Work Package 4 Leader Organization: TU Wien

 Authors: André Ortner, Marijke Welisch, Sebastian Busch, Gustav Resch

 June 2016
EC-IEE Project
Contract N°: IEE/12/833/SI2.645735

PREFACE

DIA-CORE intends to ensure a continuous assessment of the existing policy mechanisms
and to establish a fruitful stakeholder dialogue on future policy needs for renewable
electricity (RES-E), heating & cooling (RES-H), and transport (RES-T). The core objective
of DIA-CORE is to facilitate convergence in RES support across the EU and enhance
investments, cooperation and coordination.
This project shall complement the Commission’s monitoring activities of Member States
(MSs) success in meeting 2020 RES targets and builds on the approaches developed and
successfully applied in the other previous IEE projects.
The strong involvement of all relevant stakeholders will enable a more thorough
understanding of the variables at play, an identification and prioritization of necessary
policy prerequisites. The dissemination strategy lays a special emphasis on reaching
European-wide actors and stakeholders, well, beyond the target area region.

PROJECT PARTNERS

 Country
 No Participant Name Short Name
 Code

 Fraunhofer Institute for Systems and Innovations
 CO1 Fraunhofer ISI DE
 Research

 Vienna University of Technology, Energy
 CB2 EEG AT
 Economics Group

 CB3 Ecofys Netherlands bv Ecofys NL

 CB4 Eclareon GmbH eclareon DE

 CB5 National Technical University of Athens NTUA GR

 CB6 Lithuanian Energy Institute LEI LT

 CB7 Centre for European Policy Studies CEPS BE

 CB8 German Institute for Economic Research DIW DE

 CB9 University of Utrecht UU NL

 CB10 AXPO Austria AXPO AT

D4.2 Assessment of costs and benefits of RES Page 2
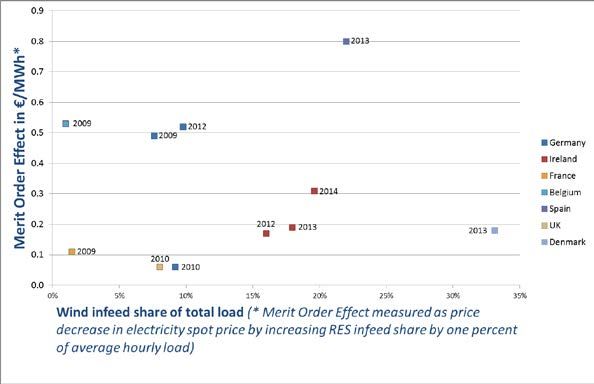
EC-IEE Project
Contract N°: IEE/12/833/SI2.645735

Summary

The topical focus of this report is on the assessment of the merit-order effect and market
values of renewable energy sources electricity (RES-E) generation since both are relevant
for a correct quantification of net support expenditures for RES in the electricity market.
In particular, the analysis focuses on the assessment of these indicators for variable
renewable energy sources (vRES), most prominently wind and solar PV. The installed
capacity of variable renewable energy sources is being assumed to substantially increase
to meet EU RES and climate targets. In case of high deployment shares the feedback
effect on electricity markets is expected to reach a significant dimension and therefore
indirectly influences the overall cost-benefit analysis. The assessment of both the merit-
order effect and market values are conducted from a historical and a future perspective.
Based on historic data an econometric analysis has been performed for selected Member
States, which were already at the forefront of RES deployment in the past. The historical
price development in these member states represents 73 % of the RES share in Europe’s
regional electricity markets. To gain insights into the impact of renewable electricity on
prices, market values and the merit order effect were calculated using a multivariate
regression analysis and ex-post calculations.
The results of the historical analysis show a clear and consistent trend; specifically it can
be seen that feed-in of electricity from variable renewables (wind power and
photovoltaics) has a negative impact on day-ahead electricity prices. Regression results
performed for all Member States confirm this finding. Also, the market value of
renewable electricity generation is influenced: we found that an increased share on total
load, in particular for wind power, leads to a substantially lower market value per
generated MWh. Concretely, looking at normalized market value factors, which relate the
revenues of a certain technologies to the ones of a baseload generator, one can see that
the market value factor for wind power drops with an increase in the share of wind in
total load. The intensity of the drop however varies between member states thus shows
that some electricity markets are more able to incorporate fluctuating renewables than
others (due to flexibility, interconnection, storage and other forms of demand side
management). Outcomes of the econometric analysis looking at the effect of variable
renewables on spot prices show decreases of around 0.53 €/MWh for e.g. Germany or
0.8 €/MWh for Spain per additional percent of wind infeed. Scaling this up to a yearly
measure translates into 180.7 Million € or 197.7 Million € lower cost of consumed
electricity evaluated at wholesale prices. These findings are similar to those found in the
literature.
The model-based forward looking analysis finds that an additional amount of RES-E,
ceteris paribus, decreases average electricity prices by 2 to 5 percent depending on the
actual amount and type of additional RES-E and the corresponding in- and divestments in
the conventional generation park.

When it comes to the sensitivity of market revenues of variable renewables to framework
conditions in electricity markets this report has shown that additional energy efficiency
measures in combination with a more ambitious carbon pricing considerable impacts
specific market revenues of RES. The impact depends on the technology in question but
can reach up to 15 €/MWh. Further influencing factors are the future development of the
high voltage transmission grid, whether additional demand side flexibility can be utilized
and which market design will be chosen. The aggregated results show that the market

 Page 1
EC-IEE Project
Contract N°: IEE/12/833/SI2.645735

value of vRES in the EU increases by 0.28 billion EUR in 2030 and by 11.47 billion EUR in
2050 as a result of increased demand side participation through power2heat applications.
When international grid development is delayed the overall effect results into lower
market values of 0.36 billion EUR in 2030 to 4.90 billion EUR in 2050. If throughout the
EU capacity markets were implemented revenues of vRES within wholesale markets are
lower by 3.29 and by 6.85 billion EUR in 2030 and 2050, respectively.

Also market revenues are expected to change in between years due to intra-yearly
differences in resource availability. These impacts are attributable to variations in
meteorological conditions and can cause up to 10 €/MWh variations in specific market
revenues of variable renewable generation.

Furthermore, the ratio between potential market revenues of RE generators and baseload
generators (the market value factor) considerably drops with increasing penetration,
especially for vRES. In the period until 2030 and 2050 the decreasing effect of market
value factors becomes apparent. The average of market value factors over all EU
countries drops for wind onshore, wind offshore and solar PV with increasing RES
penetration by as much as 4 to 12 percentage points as compared to a baseline pathway.

To put the calculations in this paper into a perspective, moreover a market based
framework for assessing the effects of RES-E is presented. The framework establishes
the merit-order effect and market values of RES-E as distinct benefit measures, which
are based on market prices, and from which the benefit RES-E has in the electricity
market can be calculated. This framework is applied in the overall cost-benefit analysis
of renewable electricity that is presented in project deliverable D4.4 available on the
project webpage (http://diacore.eu).

 Page 2
EC-IEE Project
Contract N°: IEE/12/833/SI2.645735

Table of Contents
1 INTRODUCTION ............................................................................................ 5

2 BACKGROUND ............................................................................................... 7

3 DEFINITIONS AND KEY ASSUMPTIONS ........................................................ 9

 3.1 GENERAL APPROACH ....................................................................................... 9
 3.2 FORMAL NOTATION CONVENTIONS ....................................................................... 9
 3.3 THE MERIT-ORDER EFFECT...............................................................................10
 3.4 MARKET VALUES ..........................................................................................11
 3.5 ACCOUNTING FRAMEWORK FOR THE ELECTRICITY SECTOR FOR COST BENEFIT ANALYSIS ........11
 Cost perspective .............................................................................................14
 Cost recovery conditions .................................................................................14
 Value perspective ...........................................................................................15

4 ASSESSMENT FROM A HISTORICAL PERSPECTIVE ...................................... 18

 4.1 LITERATURE REVIEW OF EXISTING STUDIES ...........................................................18
 4.2 EMPIRICAL APPROACH ...................................................................................22
 4.2.1 Robustness Checks and Variations ........................................................22
 4.2.2 Calculation of absolute effects..............................................................25
 4.3 DATA .......................................................................................................25
 4.4 HISTORICAL MARKET VALUES OF RES .................................................................27
 4.5 RESULTS OF THE EMPIRICAL ANALYSIS .................................................................29
 Country Case Studies ......................................................................................30
 4.5.1 Belgium ............................................................................................31
 4.5.2 Denmark ...........................................................................................34
 4.5.3 France ..............................................................................................36
 4.5.4 Germany ...........................................................................................38
 4.5.5 Ireland..............................................................................................40
 4.5.6 Netherlands .......................................................................................42
 4.5.7 Spain ................................................................................................44
 4.5.8 UK....................................................................................................46
 4.6 DISCUSSION AND COMPARISON WITH THE LITERATURE .............................................48

5 MODEL-BASED ASSESSMENT ...................................................................... 51

 5.1 METHOD OF APPROACH...................................................................................51
 5.2 APPLIED MODELS .........................................................................................52
 5.2.1 Green-X ............................................................................................52
 5.2.2 The long-term electricity market model .................................................53
 5.2.3 HiREPS .............................................................................................54
 5.3 MODELLING ASSUMPTIONS AND DATA INPUT ..........................................................56
 5.4 SCENARIOS ................................................................................................57
 5.5 RESULTS OF THE MODELLING............................................................................61
 5.5.1 Relative effects ..................................................................................61
 5.5.2 Absolute effects .................................................................................71

 Page 3
EC-IEE Project
Contract N°: IEE/12/833/SI2.645735

6 OVERALL FINDINGS AND OUTLOOK ............................................................ 77

7 REFERENCES ............................................................................................... 79

ANNEX .............................................................................................................. 81

 EXPLAINING THE BASELINE ESTIMATION ON THE BASIS OF THE GERMAN ELECTRICITY MARKET.........91

 Page 4
EC-IEE Project
Contract N°: IEE/12/833/SI2.645735

1 Introduction
The installed capacity of vRES – in particular wind and solar power – is being assumed to
substantially increase to meet EU RES and climate long-term targets (EC 2011). Some
countries such as Denmark, Germany or Spain have already integrated large shares of
renewables into their power systems. However, the integration of vRES into grids and
markets creates a number of impacts, from either the technical (operation and planning),
economic and regulatory perspective. In case of high shares of these variable RES
technologies the feedback effect on electricity markets is expected to reach a significant
dimension that should be carefully considered in energy policy. An in-depth analysis of
these effects from different perspectives has been conducted within the EU project
beyond2020 (Frías et al. 2013).

One effect of viral importance is that with sufficiently high shares of RES-E in a certain
power system the operation of the system and the underlying grids changes. These
changes are not fundamental in the sense that they compulsively require completely new
market architecture. However, they cause a shift from traditional generation patterns
towards a more dynamic operation of conventional power plants and might alter the
generation mix of dispatchable plants. As a direct consequence, this changes price
dynamics of wholesale electricity markets, which in turn leads to distributional effects
between different market participants and alters their in- and divestment incentives. It is
important to note that this basically holds regardless of whether RES-E are fully
integrated in markets and thus directly marketed in these wholesale markets or if they
impact markets only indirectly via residual load profiles. However, if renewable
generation units market their output directly they probably can realize higher market
revenues through innovative business models.

In any case, the overall price dynamics of wholesale markets and potential revenues
from selling their generation on markets is of great importance for the overall cost-
benefit analysis of renewables. On the one hand, market price changes go hand in hand
with the costs of serving wholesale demand within a certain period of time. These
changes influence producer and consumer rents during that period and have the potential
to drive the market towards a different equilibrium. The corresponding distributional
effects during such transition phases induced by renewable deployment can impact the
amount of RES-E support expenditures and consumer electricity prices. On the other
hand, under perfect framework conditions support costs for RES-E are determined by the
gap between expenditures needed for investment and potential market earnings. The
higher market earnings the less support expenditures are needed to ensure investments
in RES-E. As a consequence, current designs of renewable support policies get more
market-oriented via setting incentives for RES-E generators to switch from protected
markets into common balancing groups and directly market their energy in electricity
markets. Furthermore, on the one hand, the share of RES-E generation that runs out of
support and thus has to participate in electricity markets gets progressively higher and,
on the other hand, some of the RES-E technologies are about to reach grid parity in the
near future. Even in the case of a support cost assessment for support systems where
generators are not responsible for market integration (e.g. fixed feed-in tariffs) it is

 Page 5
EC-IEE Project
Contract N°: IEE/12/833/SI2.645735

important to establish a relation between the deployment of RES and the resulting
influence on electricity markets to accurately calculate the required monetary transfer
caused by the policy intervention for RES in the electricity market from the
consumer/societal point of view.

The focus of this report is to shed light on these key effects of large-scale RES-E
integration in electricity markets. First, we analyse how price dynamics in wholesale
markets induced by RES-E deployment have changed in the past and are expected to
change based on a number of scenarios. These changes are summarized under the term
merit-order effect of RES-E in the relevant literature (cf. Sensfuß et.al, 2008). Second, a
closer look is taken on potential earnings of RES-E stemming from electricity markets.
Within this report we refer to the term market value of RES-E as the sum of revenues
earned from RES-E plant operators through the marketing of generated electricity in spot
markets.

The remainder of the report is organized as follows. Chapter 2 introduces the above
described market figures more formally and provides additional information on the
assumptions taken within the assessment. Also, as basis for the incorporation of these
figures in the subsequent support cost assessment, an appropriate cost-benefit
framework is introduced in chapter 3. In chapter 4 results of ex-post calculated historical
market values and an econometric analysis of the merit-order effect for selected
countries are documented. Specifically, the most important countries with regard to RES
expansion of wind and solar power are analysed by looking at impacts of RES infeed on
their respective electricity spot prices and corresponding market values. All results are
contrasted against the findings from other relevant studies in order to contribute to
existing literature in this field. Finally, in chapter 5 a comprehensive modelling set-up for
the assessment of the merit-order effect and RES market values under changing
framework conditions is presented. The report closes with a summary chapter on
preliminary findings and conclusions.

 Page 6
EC-IEE Project
Contract N°: IEE/12/833/SI2.645735

2 Background
As in all markets the fundamental variables in liberalized electricity markets are prices.
Electricity prices are distinguished in retail and wholesale prices. Retail prices are the
average cost of electricity plus taxes, surcharges (e.g. the RES surcharge) and grid fees.
Retail prices for different consumers are different depending on their supplier, the type of
consumer (household or industry), the yearly amount of electricity that is consumed and
the location of electricity withdrawal. The share of energy cost of the total electricity price
varies among countries. Figure 2-1 and Figure 2-2 summarize the composition of
electricity retail prices for consumers and industry for selected European countries. It can
be seen that the share of energy accounts on average for 41% in household prices and
for 36% in industry prices, whereas it varies considerably more for households in
different countries. However, it can be seen that the energy share makes up a significant
part of the price. Electricity taxes are in the range of 30% on average of overall prices
and the remainder accrues from the provision of grid services.

 100%
 90%
 80%
 70%
 60%
 Taxes
 50%
 Grid
 40%
 Energy
 30%
 20%
 10%
 0%

Figure 2-1 Components of electricity retail prices of households in selected countries
(Source: Eurostat)

 100%
 90%
 80%
 70%
 60%
 Taxes
 50%
 Grid
 40%
 Energy
 30%
 20%
 10%
 0%

Figure 2-2 Components of retail electricity prices for industry in selected countries
(Source: Eurostat)

 Page 7
EC-IEE Project
Contract N°: IEE/12/833/SI2.645735

In the long run, average retail electricity prices should cover all costs and levies that
arise in the course of supplying consumers with electricity. Therefore, they also comprise
the costs of supporting and generating electricity from renewable sources (RES-E). Table
2-1 shows a further subcategorization of retail electricity prices. Since the focus of this
analysis is laid on the impacts of renewable electricity on prices and costs, RES
surcharges are separated from other taxes to make them a distinct category.

Table 2-1 Subdivided composition of retail electricity prices

 Energy-only wholesale markets
 Energy costs
 Capacity markets

 Distribution grid

 Grid costs Transmission grid
 (System usage charge) Balancing costs

 Other system services

 Taxes Levies on production, transport and sale

 Generation costs

 RES surcharge RES market value and support costs

 Support design

Energy costs comprise the total costs of electricity generation from conventional energy
sources. They include variable and fix costs. In liberalized markets generators, traders
and large consumers compete in wholesale markets for the interregional provision and
delivery of electricity. At the moment, the main share of total electricity generation costs
is covered by revenues stemming from energy-only wholesale markets. Depending on
the concrete market design a certain share of fixed costs can be earned from capacity
markets. The second part of the price consists of the remuneration for costs that
comprise all services provided by grid operators. These are among others the reliable
operation and maintenance of existing grids as well as investments in new infrastructure
and equipment. Taxes comprise e.g. poverty, environmental and consumption taxes,
which differ in type and size from country to country (cf. Figure 2-1 and Figure 2-2).
Finally, the RES surcharge covers all expenditures arising from the gap between long-run
generation costs and market revenues of RES-E. The size of necessary support
expenditures for RES strongly depends on the design details of the implemented support
instrument(-s) (Ragwitz et al. 2014). The support of RES-E and the subsequent
integration in electricity markets and grids causes costs and benefits that appear at
several points in the above mentioned price categories. To what extent and at what point
in time these costs and benefits actually materialize in retail prices depends on many
factors including system inherent time lags, the level of competition and the regulatory
framework. In this report we take a step back and analyse impacts of RES-E on
wholesale electricity markets and what RES-E generators can earn from these markets.
These two market figures significantly impact energy costs as well as RES surcharges and
thus total electricity costs to be borne by consumers.

 Page 8
EC-IEE Project
Contract N°: IEE/12/833/SI2.645735

3 Definitions and key assumptions
3.1 General approach

The aim of this report is to deliver numerical insights into two distinct benefits of
renewable electricity generation in electricity wholesale markets. The first benefit
concerns the price-damping effect of renewable infeed, which has been termed the merit-
order effect in the literature (cf. Sensfuss et al. 2008). The second quantifies the market
value of renewable generation itself. Both figures are closely related to each other. In the
following the relation of these two benefits of RES are formally characterized and
incorporated in a general cost-benefit framework of the electricity sector.

The merit-order effect concerns the relation between wholesale electricity market prices
and renewable electricity generation. This relation is multi-facetted and can be expressed
through various measures. For example, it depends on which concrete prices are taken
into account, on what characteristics of prices it is focused on and over what period of
time the analysis is performed. Furthermore, whereas empirical approaches are limited
by the availability of data, model results are strongly influenced by the applied modelling
approach and assumptions on framework conditions. For this reason, we are approaching
the assessment of the merit-order effect from several directions. First, we provide a
formal definition of the merit-order effect, which is embedded in a more general
framework developed for the cost-benefit analysis of RES-E based on electricity markets.
The framework is set up in a way that the results can be directly transferred into the
assessment of net support expenditures of RES-E. Secondly, we perform a
comprehensive empirical analysis of observed merit-order effects in several EU countries
by applying different econometric models, which are oriented on the state-of-the-art in
the relevant literature. The results of this analysis are again contrasted and interpreted
with respect to the existing literature. Thirdly, we use a hybrid modelling approach to
model the merit-order effect under different framework conditions. In order to account
for robustness checks of the results we perform sensitivity analyses of the most
important input assumptions. To show the implications of a simultaneous change of
various framework parameters we carry out pathway scenarios.

3.2 Formal notation conventions

In this section we provide some basic definitions of variables and indicators that will be
used throughout the paper. We apply the convention that absolute values as sum over a
certain time period (in EUR/a) are denoted by capital letters and marginal values that
relate a certain cost or benefit to the amount of energy generated or consumed (in
EUR/MWh) by lower case letters. Energy contents are always given in MWh per
corresponding time period. Table 3-1: Selected notation gives and overview on the main
variables, which are used in the following in order to formally describe how the merit-
order effect and market values play together in a general cost-benefit framework of the
electricity sector.

 Page 9
EC-IEE Project
Contract N°: IEE/12/833/SI2.645735

 Table 3-1: Selected notation

MOE … Absolute Merit-Order Effect in EUR/a

MV … Absolute Market Value in EUR/a

mv … Relative Market Value in EUR/MWh

mvf … Market value factor in interval [0,1]
p … (Wholesale) electricity price in EUR/MWh

q … Electricity consumed/generated in MWh per hour

Q … Cumulated electricity consumed/generated in MWh per year

C … Yearly fixed electricity generation costs in EUR/a

c … Variable electricity generation costs in EUR/MWh

B … Net benefit of additional RES deployment in EUR/a

Conv … Index indicating conventional electricity generation

Res … Index indicating renewable electricity generation

Dem … Index indicating total electricity consumed

3.3 The merit-order effect

We interpret the merit-order effect in its general form as the relation between wholesale
electricity prices and renewable electricity generation. This relation is quantified as
differential change of price characteristics as response to additional RES deployment.
Therefore one has to contrast two system states to each other. We define
system state (1) as our reference case with a certain RES deployment. In contrast to
that system state (2) characterises the same power system, however with a greater
share of RES on demand. Thus, both system states describe a certain power system in its
equilibrium, whereas the states are differing in the share of RES on gross electricity
demand. We mark the relevant variables with indices (1) and (2), respectively, to state
whether they refer to system state (1) or (2).

With regard to prices we have to recognize that there are plenty of prices subject to
three distinct dimensions. A price pt ,l ,δ refers to a point in time t , a certain location l
and to a future point in time δ when the electricity is physically delivered (gate closure).
The concrete market design defines products that discretize this 3-dimensional price
space, since not for each time, location and gate closure point a priced product can be
traded. Within this report we abstract from this and consider only the day-ahead
wholesale prices within a certain country to assess market values and the merit-order
effect. For a certain country the merit-order effect will be calculated as
 t =8760
 =
 MOE ∑ (p
 t =1
 (1)
 t − pt(2) ) ⋅ qtD . (0)

 Page 10
EC-IEE Project
Contract N°: IEE/12/833/SI2.645735

Therein, the MOE effect is calculated as the sum of system-state differences in price-
weighted electricity demand over one year. In other words, the merit-order effect
quantifies how the market value of consumption changes when additional RES is
deployed.

3.4 Market Values

In principle, the market value of RES-E generation comprises all segments where this
generation is eligible to be marketed. Generally, for a more profound assessment of
market values the amount of potential profits that can be achieved by RES-E generators
has to be analysed in detail. Since the various RES-E technologies differ significantly in
some for the markets relevant characteristics (e.g. generation profile / dispatchability,
capacity credit, cost structure, locational needs, etc.) each technology has to be analysed
separately.

A simplified estimation of the market value of RES-E generation can be calculated by
multiplying the electricity production by the day-ahead electricity market price in a
certain price zone as shown in eq. (2).
 T
 =
 MV ∑ p ⋅q
 t =1
 t t
 Res
 (1)

Division by the cumulative generation leads to the relative market value
 T

 ∑ p ⋅q t t
 Res

 mv = t =1
 T
 . (1)
 ∑q
 t =1
 t
 Res

The base price of day-ahead electricity prices are the average over the year

 1 T
 pbase = ∑ pt .
 8760 t =1
 (2)

The ratio between the relative market value of a certain technology and the
corresponding base price in the same price zone is called the market value factor

 mv
 mvf = (3)
 pbase
This factor is important to compare relative market revenue changes of certain
technologies between different countries / price zones.

3.5 Accounting framework for the electricity sector for cost benefit
 analysis

In this section we describe a framework for assessing the effects of RES-E in terms of
costs and benefits in the electricity sector. Thereby we discuss the effects under the
following propositions:

 Page 11
EC-IEE Project
Contract N°: IEE/12/833/SI2.645735

 • By direct or indirect relationships all costs are reflected by prices, how costs
 materialize into prices depends on the applied market design.

 • As the output – a unit of electricity - is a homogeneous good, benefits are
 reflected in cost savings.

In the electricity sector the costs for the supply of electricity divide into fixed and variable
costs of electricity generation. These costs are priced in different market segments that
are either organized competitively or regulated. In the absence of market power, in the
long-term equilibrium the revenues from the different market segments are sufficient to
cover the long-term costs (capacity and energy) of generation, though technical
constraints such as limited potential may induce rents for some generation technologies.
Structural changes in the composition of revenues in one market segment therefore,
ceteris paribus, imply unabatedly immediate or time-lagged changes in the composition
of revenues in other market segments so that in the long-term equilibrium all costs are
covered. Thus the long-term retail price for electricity, composed of the wholesale price
and all surcharges equals the long-term average system costs.

Now we discuss the impacts of RES-E on the electricity sector in more detail. We do this
with the help of Figure 3-1. A legend for Figure 3-1 is provided in Table 3-2. We assume
that in Figure 3-1 costs, revenues and prices are shown as yearly weighted average.
Moreover we assume that marginal costs are constant so that marginal costs equal
average costs.

In our simple model two types of generating technologies are available: a conventional
fossil peak power plant (F) that serves as benchmark and a RES-E power plant (R) with
volatile output. The two types of technologies distinguish in how their costs of electricity
generation are divided into costs for energy (1a-1d) and costs for capacity (1e). Whereas
peak power plants are characterized by high variable costs relative to their capacity costs
due to their low full-load-hours, RES-E plants have variable costs close to zero and their
generation costs almost exclusively derive from the costs of the generating capacity.

Now when a new unit of RES-E generating capacity is added it creates benefits (3a+3b)
within the power system by displacing both energy and capacity from the conventional
benchmark power plant. Due to its variability in output there are system states in a year
where the RES-E capacity is not available to displace conventional generating capacity.
This effect takes place on several time scales (cf. Hirth, Ueckerdt, und Edenhofer 2015;
Nicolosi 2012):

 • In the short run (2a+2b) additional energy from the conventional benchmark
 technology is required due to the need for additional system flexibility (ramping,
 cycling, part-load).

 • In the long term the RES-E power plant decreases the amount of energy produced
 by conventional generators much more than reducing the need for installed
 capacity so that additional conventional capacity with low utilisation needs to be
 installed (2c).

Thus the system integration costs are the additional costs of the conventional benchmark
technology that cannot be displaced by the RES-E power plant. The RES-E generator

 Page 12
EC-IEE Project
Contract N°: IEE/12/833/SI2.645735

“sees” these integration costs as reduction in market value (Hirth, Ueckerdt, und
Edenhofer 2015). The aggregated benefit of the new RES-E capacity across all market
segments determines its market value (3c). The investment costs of a new RES-E project
net of its market value determine the support costs that need to be covered outside the
wholesale electricity market.

The different components of costs and benefits discussed so far are reflected by prices in
different segments of the electricity market (Spot, Balancing, Capacity, Support
Scheme). We distinguish between electricity wholesale spot markets and other market
segments; while on spot markets generally a price emerges that determines the
exchange of quantities between the supply and the demand side, the other segments are
often characterized by only one party forming the demand side, so that they are either
operated as procurement auctions or regulated and the resulting costs of the demand are
usually passed on as surcharges on the retail prices for electricity.

In the short term the marginal costs (1a-1c) of the last generating unit needed to satisfy
the demand set the price on the wholesale electricity market (4a). These prices are
however not sufficient to cover the costs of capacity. Two options exist to finance this
cost gap: an energy only market with scarcity prices (4b) or a market for capacity (5b).
As can be seen from Figure 3-1 in a market environment with perfect information both
options for pricing capacity should lead to the same mark up on average, i.e. while price
spikes occur less frequently they are generally higher in magnitude than capacity prices,
but apportioned to a MWh. both options should lead to the same price.

The costs for the provision of balancing energy of the conventional power plant are
reimbursed on the balancing market. This does not imply that the RES-E power plant
cannot provide balancing energy; we however only display here the additional amount of
balancing energy resulting from the variability compared to the conventional benchmark.

Finally, the RES-E power plant asks for its financing gap to be recovered through a
support premium. Ultimately, in one way or the other, this financing gap is passed on to
consumers as support costs (③). This financing gap arises as the RES-E plant cannot
(yet) achieve the same market value as the more efficient benchmark technology
(neglecting positive externalities outside the electricity sector). Thus the market value
(①) that will be analysed in more detail in this paper is an important indicator for the
competitiveness of RES-E power plants in the electricity market.

We recall from above that the market value of RES-E depends on the costs of the
alternative benchmark technology that it displaces. With increasing penetration of RES-E
capacity however the number of hours where the costs of conventional generation are
displaced will also go down. In extreme cases with a very high availability of RES-E
capacity, new RES-E capacity would only displace other existing RES-E capacity. This
shift in the generation mix through pushing more costly generation out of the market is
referred to as the merit-order effect (②). The consequence is that the wholesale price
level will go down and given that the surcharges stay constant also the retail price for
electricity has to go down, unless retailers do not pass on the decreased costs for the
purchase of electricity to the consumers. However, as we operate in a closed system
where all costs have to be recovered in the long term, the investment gap will have to be
recovered less smoothly in fewer time steps, either by means of more extreme scarcity

 Page 13
EC-IEE Project
Contract N°: IEE/12/833/SI2.645735

prices in the wholesale market, or by means of higher surcharges in the other market
segments, depending on the applicable market design. Thus the reader may observe that
in the long-term equilibrium the average retail price for electricity has to equal the
average system costs, which are composed of the average costs of the benchmark
technology (1a-1e), plus the support costs of the not yet efficient RES-E technology.

Next we present our conceptual discussion from above in a more formal framework. The
objective is to dismantle the interrelationships between the different RES-E impacts we
are interested in.

Cost perspective

As we have argued above the output of the electricity value chain – a unit of electricity –
is a homogeneous good and therefore benefits in the electricity sector can be expressed
as cost differences between different system configurations (in our case system state (1)
and (2)). In both states we assume a system that is supplied by a certain mix of
conventional and renewable electricity generation. The total system costs are simply
given by the sum of fixed and variable costs of generation

 = C fix + cvar ⋅ q =
 Ctotal C Conv
 fix + cvar
 Conv
 ⋅ q Conv + C Res
 fix + cvar ⋅ q
 Res Res
 . (4)

Adding renewable electricity generation to this reference system lowers the costs of
conventional generation by the amount they are displaced by renewable generation and
adds additional fixed and variable costs on part of renewable generation to the total
costs. Thus, additional costs of switching from system state (1) to (2) can be calculated
by subtracting total system costs of both system configurations. Due to the fact that in
the end all costs are translated into electricity prices and potential additional side
payments that have to be borne by consumers, the cost difference of both states also
represents the net-benefit of RES
 (1− 2)
 B= (1)
 Ctotal − Ctotal
 (2)
 . (5)

When renewable generation has relatively higher costs than conventional generation the
net-benefit is negative.

Cost recovery conditions

We have postulated that in the long-term competitive equilibrium all costs are covered by
a combination of market revenues in case of an energy-only market (EOM) or by a
combination of market revenues (EM) and premium payments outside the electricity
market in case of distinct mechanisms for energy and capacity remuneration (CM). In the
following we assume for the sake of notational simplicity an “energy-only” market design
for conventional generation whereas the renewable generation can receive a premium a
premium outside the electricity market on top of the electricity market revenues. Within
the subsequent modelling activities we differentiate all relevant configurations. Thus, the
cost recovery conditions translate into

 Page 14
EC-IEE Project Contract N°: IEE/12/833/SI2.645735 EOM +, Additional premium +, for RES mv Res ⋅ Q Res + pr Res ⋅ Q Res = C Res fix + cvar ⋅ Q Res Res , ∀ Res (6) EOM +, mv ⋅ Q Conv Conv = C Conv fix + cvar Conv ⋅ Q Conv , ∀ Conv. Value perspective The total market value of demand, i.e. all market revenues in the wholesale market, can be split up in market revenues from conventional and renewable generators. mv Dem ⋅ Q Dem = mvConv ⋅ Q Conv + mv Res ⋅ Q Res (7) If we add up both cost recovery conditions from (8) we receive Ctotal = mv Res ⋅ Q Res + pr Res ⋅ Q Res + mvConv ⋅ Q Conv (8) The revenues of conventional generators can be expressed via eq. (9), which leads to =Ctotal mv Dem ⋅ Q Dem + pr Res ⋅ Q Res . (9) Equation (11) describes the total power system cost as function of the market value of demand plus a premium to be paid to renewable generators. This equation is valid for both system states. Thus, we can thus describe the net-benefit defined in eq. (7) as ((((+((((, MOE (((((( +(((((( Change in support payments , (1− 2) = B (mv Dem ,(1) − mv Dem , (2) ) ⋅ Q + ( pr Dem Res ,(1) ⋅Q Res ,(1) − pr Res , (2) ⋅Q Res ,( 2 ) ) (10) In doing so, we established a relationship between the net-benefit of renewables and the merit-order effect together with a change in required support payments to renewables. Finally, the support payments to renewables from eq. (12) can be split up in costs and revenues via eq. (8) into (((((( +((((((, Change in market value pr Res ,(1) ⋅Q Res ,(1) − pr Res ,(2) ⋅Q Res ,(2) = (mv Res ,(1) ⋅Q Res ,(1) − mv Res ,(2) ⋅ Q Res ,(2) ) + ... (11) ((((((((( +((((((((( Change in generation cost , ... −cvar Res ,(1) ⋅ Q Res ,(1) + cvar Res ,(2) ⋅ Q Res ,(2) − C Res fix ,(1) + C Res ,(2) fix . In the remainder of this report the merit-order effect (MOE) and corresponding changes in market values (MV) of wind onshore, wind offshore and solar PV will be quantified for a number of scenarios. In order to fully assess changes in support payments, and therefore calculate the overall net-benefits, the effect of e.g. learning rates, resource quality and other impacts on generation costs need to be taken into account as well. Therefore, total changes in support costs will be conducted in the overall cost-benefit analysis documented in deliverable D4.4 available on the project webpage (http://diacore.eu). Page 15
EC-IEE Project
Contract N°: IEE/12/833/SI2.645735

 Table 3-2: Legend for Figure 3-1.

 Page 16
EC-IEE Project
 Contract N°: IEE/12/833/SI2.645735

Figure 3-1: Assessment framework for the electricity sector.

 Page 17
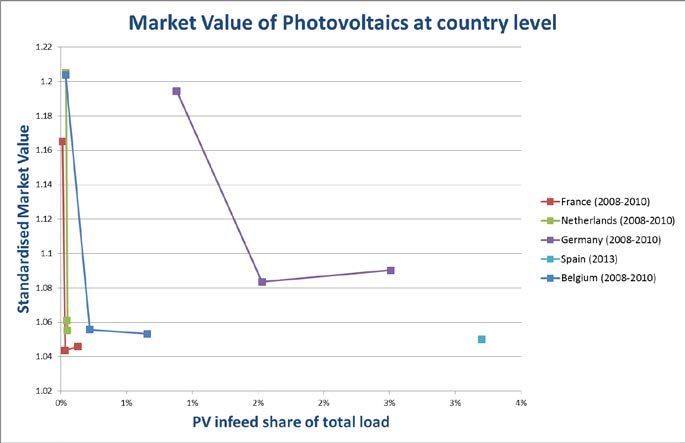
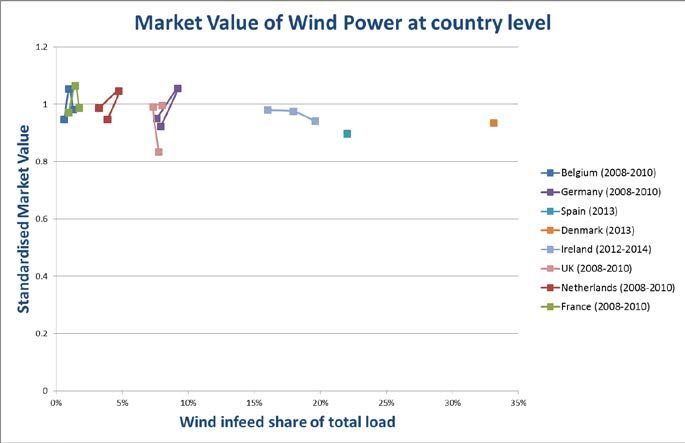
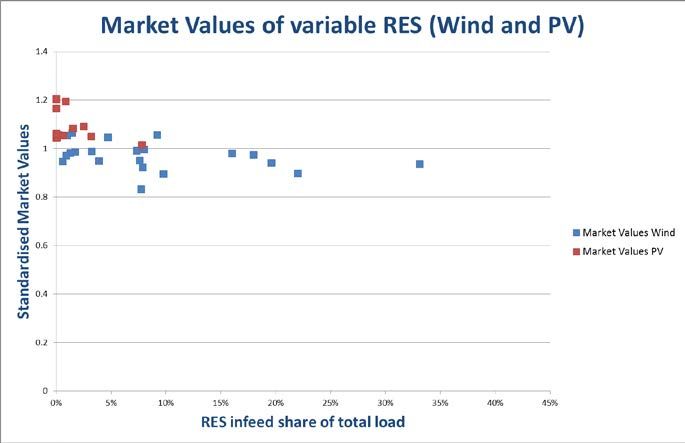
EC-IEE Project
Contract N°: IEE/12/833/SI2.645735

4 Assessment from a historical perspective
In this first subtask an assessment of both the merit-order effect and market values has
been conducted from a historical perspective. Building on the literature review
conducted, light will be shed on Europe’s regional electricity markets.

A clear distinction has been made between market values and the merit-order effect,
thus covering both the system- and investor-perspective. Finally, for variable RES-
technologies (i.e. wind and solar) market values will be analysed in depth. The analysis
includes a calculation of the market values on the basis of historical data for generation
of variable RES and the corresponding spot market prices.

4.1 Literature review of existing studies

As starting point of the historical analysis, a literature review on existing definitions,
approaches, results and criticisms will be presented: The literature analysing empirical
effects of renewables infeed on the electricity spot price and thus implications for merit
order and market value is very diverse and covers a variation of methodologies and
countries. To our knowledge, nevertheless, a Europe-wide study of these effects,
covering as many countries as the following has not been executed so far. This literature
review gives a broad overview of empirical approaches used to analyse merit order and
market value effects of renewables during the last years. In the methodology section,
some specific studies that inspired the methodology used in this approach are examined
in more detail.

The German electricity market has experienced an exceptional growth of RES during the
past decade and has been analysed quite frequently. Pham and Lemoine, 2015, for
example apply a GARCH framework and model the effect of wind power and
photovoltaics separately on the German electricity spot price in the period of 2009 to
2012. They use maximum likelihood and discover a price depressing effect of increased
renewables feed-in. Cludius et al. (2014) also take Germany into focus and look at the
merit order effect of wind and photovoltaics. Using OLS (ordinary least squares)
regressions in different specifications, they find that each additional GWh of renewables
fed into the grid would lead the price of electricity on the day-ahead market to fall by 1.1
to 1.3 €/MWh. The derived merit order effect takes on a value of 5 €/MWh in 2010 and
rises to over 11 €/MWh in 2012 according to their calculations. Weber et al. (2006) find
similar effects for Germany in the period between 2004 and 2005: they estimate a fall in
the day-ahead price of electricity by 1.89 €/MWh for each additional GWh of wind power
by applying a univariate regression model.

Two further studies that look into the German and Austrian power sector simultaneously
have been conducted by Würzburg et al. (2013) and Hildmann et al. (2015). While
Würzburg et al. (2013) apply a multivariate regression approach for the years of 2010 to
2012 and also find a substantial merit order effect of renewables (wind power and
photovoltaics taken as a joint explanatory variable). They estimate a decrease of around
one euro per additional GWh of electricity and thus calculate a merit order effect of 7.6
€/MWh on average from these results. Hildmann et al. (2015) also analyse the spot

 Page 18
EC-IEE Project
Contract N°: IEE/12/833/SI2.645735

market and marginal production costs of RES production – they nevertheless present a
more critical approach of calculating a merit order effect from the infeed of RES
electricity. Concretely they state that neither zero marginal operation costs nor zero grid
integration costs for RES, which are assumed in most studies analysing the merit order
effect or market values of RES, are entirely correct. This provides interesting insights and
a new perspective in the discussion on these developments and should be considered
when interpreting and comparing previous findings.

Another country that has been analysed by several authors is Spain. A study by Gelabert
et al. (2011) looking at day-ahead electricity prices between 2005 and 2009 finds that “a
marginal increase of 1 GWh of electricity production using renewables and cogeneration
is associated with a reduction of almost 2€ per MWh in electricity prices (around 4% of
the average price for the analyzed period)” (Gelabert, Labandeira, and Linares 2011).
The methodology of this study has been applied partly for the following analysis of
different European electricity markets. Gil et al. (2012) analyse the effect of large-scale
wind power integration into the Spanish electricity market in the years 2007 to 2010.
They apply a conditional probability approach and find that the price of electricity would
have been around 9.7 €/MWh or 18% higher without wind production. Using an an
artificial intelligence-based technique (M5P algorithm) to determine the influence of wind
power technology on the spot market, Azofra et al. (2014) also analyse historical data for
Spain in the year 2012. They find that “wind power depressed the spot prices between
7.42 and 10.94 €/MW h for a wind power production of 90% and 110% of the real one,
respectively” (Azofra et al. 2014).

Two further studies analyse developments on the Danish electricity market. Østergaard
et al. (2006) analyse data for the year 2005 and find that electricity spot prices would
have been lower in Denmark without any wind electricity generation – namely by 1
€/MWh in 2004, 4 €/MWh in 2005 and 2.5 €/MWh in 2006. Jónsson et al. (2010) apply a
non-parametric regression model and look at the effect of day-ahead wind power
forecasts on electricity spot prices between 2006 and 2007. As the Danish electricity
market has specific characteristics, namely being relatively small and exhibiting a large
wind penetration, variation and price effects estimated there are especially high.
Concretely, in times of high wind feed-in a downward effect of 55-50 €/MWh. This
describes an overall effect, which is induced by “large shares” of wind feed-in of total
electricity generation and not normalised to e.g. one GWh of additional wind power
generated. All in all, Jónsson et al. (2010) say that about 40% of variation in the Danish
electricity prices can be assigned to wind power infeed – an important finding as variation
in prices is also an important determinant, e.g. for profitability of electricity storage – an
effect that should also be taken into account when looking at the effect of variable RES
infeed on electricity prices.

Further European countries where market values and/or merit order effects of variable
RES have been assessed are the Netherlands, Italy and Ireland. In Ireland for
instance, O’Mahoney and Denny (2011) have analysed the merit order effect of wind
generation in the Irish electricity market. Applying a OLS multiple regression model, they
find that wind power induced a coefficient on wind of -0.0099 in their analysis for the
year of 2009 – scaled up to the market outcomes in this year, this implies that prices
would have been 12% higher without wind generation, or phrased differently, that

 Page 19
EC-IEE Project
Contract N°: IEE/12/833/SI2.645735

savings through wind generation amount to 141 million €. Nieuwenhout and Brand
(2011) study the impact of wind power on electricity prices in the Netherlands. This
empirical study primarily compares different wind generation intervals according to
historical weather data in the years 2006-2009. They find that average day-ahead prices
on the Dutch electricity market have been around 5% higher during no-wind intervals in
comparison to the rest of the analysed period. A more recent study on the Italian
electricity market – a further relevant European market in terms of installed variable RES
capacities – has been conducted by Clò et al. (2015). Applying a multivariate linear
regression model for the years 2005 to 2013, they find an impact of variable RES
(photovoltaics and wind power) on the Italian electricity spot prices. Looking into the two
technologies separately, the authors conclude that “an increase of 1 GWh in the hourly
average of daily production from solar and wind sources has, on average, reduced
wholesale electricity prices by respectively 2.3€/MWh and 4.2€/MWh and has amplified
their volatility” (Clò, Cataldi, and Zoppoli 2015). This study is interesting due to the fact
that it analyses almost a decade and that it furthermore also takes variability into
account.

Finally, to complete the overall literature review and to open up the geographical scope,
some literature from the United States is presented. Woo et al. (Woo et al. 2011) use a
stationary AR-process to model the effect of wind generation on balancing energy prices
and variance in Texas for the years 2007 to 2010. The four-zone Electricity Reliability
Council of Texas (ERCOT) works with 15-min balancing energy market prices, which
allow an extremely high-resolution study of the market. The authors find that “a 1 GW
increase in wind generation (during 15 min) decreased Texas balancing electricity prices
between 13 and 44 US$/MWh.” (Woo et al. 2011). Nicholson, et al. (2010) also analyse
the ERCOT market, with a focus on balancing energy. The authors estimate an ARMAX
model and find decreasing effects of wind generation on balancing energy prices of 0.67
to 16.4 US$/MWh per additional GW of wind power (depending on the year, time of the
day, and the area in the Texas network). A report by Hresko and Goggin (2015),
elaborated for AWEA (the American Wind Energy Association) looks into electricity price
developments in another area, specifically the PJM region which serves serving all or
parts of Delaware, Illinois, Indiana, Kentucky, Maryland, Michigan, New Jersey, North
Carolina, Ohio, Pennsylvania, Tennessee, Virginia, West Virginia and the District of
Columbia. Using a different approach, they just analyse how prices developed during the
two days of the polar vortex, which brought about extreme weather circumstances. The
authors show that “Wind energy protected Mid-Atlantic and Great Lakes consumers from
extreme price spikes during the polar vortex event in early January 2014, saving
consumers over US$ 1 billion on their electric bills” (Hresko and Goggin 2015).

The overall conclusion that can be drawn from this literature review is that variable
renewables have a visible effect on electricity prices and can induce a merit order effect.
Moreover, market values of RES are largely influenced by their share of the overall
electricity generation and by the respective time of day in which the variable RES feed in
takes place. Nevertheless it is also important to consider that wind and solar power lead
to substantial variation in electricity prices. It is also not entirely correct to assume that
these technologies operate at zero marginal costs – implying that effects that have been
observed so far could be overestimated to a certain extent. Overall, however the

 Page 20
EC-IEE Project
Contract N°: IEE/12/833/SI2.645735

downward effect of variable RES infeed on electricity spot prices seems to be very
unambiguous.

 Page 21
EC-IEE Project
Contract N°: IEE/12/833/SI2.645735

4.2 Empirical Approach

The approach followed in our analysis is oriented along the lines of the papers by
(Gelabert, Labandeira, and Linares 2011) and (Würzburg, Labandeira, and Linares 2013).
The independent or outcome variable is the electricity price, measured as the hourly spot
price on the country’s respective electricity exchange platform. We then assess, as
explained before, how this price changes in hours with different levels of variable RES
infeed.

The Regression Model

The influence of variable renewables on electricity spot prices is modelled by a
multivariate regression in different specifications. As the electricity price is determined to
a large extent by demand, the load, also measured in an hourly resolution, is introduced
as a main control variable. As the electricity generated does not exclusively stay in the
respective country, cross-border flows of the electricity, if available improve the accuracy
of the estimated relationship.

As different seasons of the year exhibit significantly different levels of demand, monthly
dummies are introduced to represent this pattern, which can be especially relevant in
countries where use of electricity is strongly weather dependent, as e.g. France, where a
substantial amount of heating stems from electric heaters, such that demand in winter is
a lot higher than in the summer time. For the same reason, weekly dummies are used as
to account for different levels of electricity demand due to the structure of a given week.
As the day-ahead electricity price is a variable that depends strongly on the price that
occurred a day earlier, lags of the electricity price of 24 hours behind were also
introduced as a control factor.

 ß0 + ß1 LOADh + ß2 REh + ß3 ExImh + ß4 lagph + ß5dummies + εh
 Baseline Regression : Ph =

The Durbin Watson test indicated positive autocorrelation among the residuals, such that
robust (heteroscedasticity consistent) standard errors were computed. A second variation
to account for this factor was performed by differencing the regression. This regression
could only be executed if the dependent variables were also forecasts, i.e. if load and
infeed were available as a 24 h ahead estimation. Only the difference to the preceding
(i.e. 24 hour behind) value is estimated by implementing this regression specification.

First differencing of the variables yields very similar results on the coefficient estimates.
Taking exemplarily the year 2010 in Germany, the regression coefficient on wind infeed
is -0.00098 as compared to -0.00097 for explanatory variables in levels. As the
regression making use of variables in levels has more explanatory power (adjusted R2 of
0.804 compared to 0.607), we keep the specified form as before.

4.2.1 Robustness Checks and Variations

As a first robustness check, following the methodology of Gelabert et al. (2011) a
regression specification was performed using daily averages to cancel out unwanted
noise through strong fluctuations during the day.

 Page 22
You can also read