Myanmar National Electrification Program (NEP) Roadmap and Investment Prospectus Draft Final Road Map and Investment Prospectus - August 2014
←
→
Page content transcription
If your browser does not render page correctly, please read the page content below
Myanmar National
Electrification Program (NEP)
  Roadmap and Investment
           Prospectus

  Draft Final Road Map and
   Investment Prospectus

            August
             2014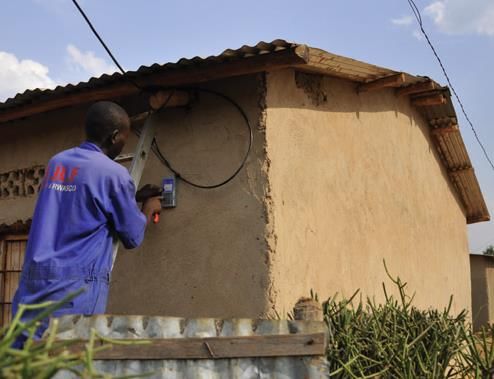
Table of Contents

1   Introduction                                                            1
2   Financing for the Least-Cost Roll-out for the Period FY2015-
    2019                                                                    4
    2.1    Least-cost Roll-out                                              5
    2.2    The Financing Need                                               9
    2.3    Development Rationale for Donor Financing                       11
3   Target Number of Connections                                           13
    3.1    Grid Connections Ramp Up                                        13
    3.2    Permanent Mini-grid and Off-grid Connections Ramp Up            14
    3.3    Pre-electrification Connections Ramp Up                         15
4   Costs of the Roll-out                                                  17
    4.1    Capital Costs                                                   19
    4.2    Operating Costs                                                 20
    4.3    Demand Assumptions                                              21
    4.4    Key Sensitivies                                                 22
           4.4.1   Proportional Connections Roll-out Scenario              22
           4.4.2   Targeted Connections Roll-out Scenario                  23
           4.4.3   Sensitivity to Generation Cost                          24
5   Funding (Cost Recovery)                                                29
    5.1    International Tariff Comparisons                                30
    5.2    The Reference Case                                              32
    5.3    Key Sensitivities                                               34
           5.3.1   Tariffs Remain Constant in Real Terms                   34
           5.3.2   Zero Funding Gap Tariff                                 37
6   Implementation Road Map                                                38
    6.1    Diagnostic of Institutional Barriers to Implementing the
           NEP                                                             40
           6.1.1   Program-level Management and Coordination               41
           6.1.2   Efficient Operation of Utilities and their Ability to
                   Scale-up                                                43
           6.1.3   Need for Coordinated Implementation of Mini-grids       44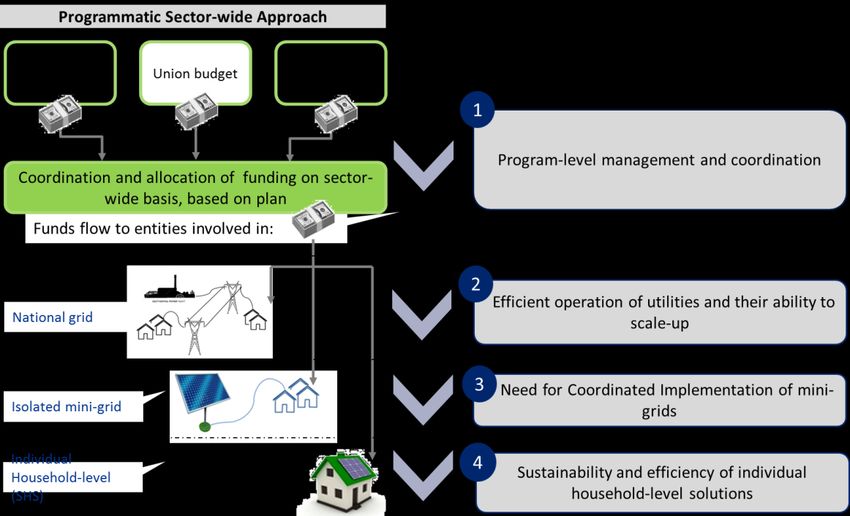
6.1.4   Sustainability and Efficiency of Individual
                      Household Solutions                                44
       6.2    Program Coordination                                       45
       6.3    Grid Connections in YESB Franchise Area                    46
       6.4    Grid Connections in the ESE Franchise Area                 46
              6.4.1   ESE                                                49
              6.4.2   Sub-Franchise Concessions                          49
       6.5    Mini-Grid Connections                                      51
       6.6    Household Electrification                                  53
7      Technical Assistance for Myanmar National Electrification
       Plan (NEP)                                                        55
8      Conclusions: Milestones and Accountability                        65

Tables
Table 1.1: Annual Capital Expenditure (Capex) by Connection Type
(US$ Million)                                                            iii
Table 2.1: National Least-Cost Roll Out (financial year beginning 1
April)                                                                    8
Table 2.2: Annual Capital Expenditure (Capex) by Connection Type
(US$ Million)                                                            11
Table 3.1: Total Target Connections by State and Type over the
Entire Program                                                           13
Table 3.2: Ramp Up in Annual Grid Connections (2015- 2019)               14
Table 4.1: Assumed Loan Terms for Donor Finance                          17
Table 4.2: Capital Costs for Grid Electrification (US$ Million)          19
Table 4.3: Mini-grid, Pre-electrification and Off-grid Capex (US$
Million)                                                                 20
Table 4.4: Cost per MWh                                                  21
Table 4.5: Annual Electricity Demand per Gird and Mini-Grid
Connection (2015-2030)                                                   21
Table 4.6: Proportional Connections Roll-out (FY2015-2019)               23
Table 4.7: Current Electrification Rates and National Average            23
Table 4.8: Hypothetical Least-cost Generation Mix                        26
Table 4.9: Least cost dispatch from our analysis of levilized costs of
generation                                                               27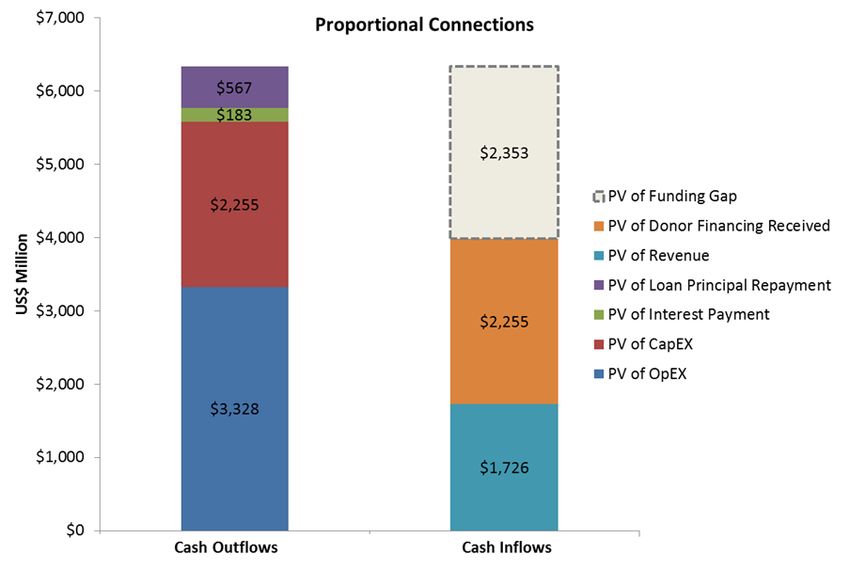
Table 5.1: Required Real Growth in Average Tariff to Ensure Current
Network is Cash Neutral                                               33
Table 5.2: Tariff and Connection Charges                              34
Table 5.3: PV of Funding Gap 2015-2070, National Least Cost
Connections                                                           35
Table 5.4: PV of Funding Gap 2015-2070, Proportional Connections      35
Table 5.5: PV of Funding Gap 2015-2070, Targeted Connections          36
Table 5.6: Tariffs when New System is Cash Neutral Every Year (In
US$)                                                                  37
Table 6.1: Decentralized Mini-grid Support Model Adapted to
Myanmar                                                               51
Table 7.1: Technical Assistance Costs                                 55
Table 7.2: Technical Assistance Tasks and Level of Effort             56
Table B.1:Grid-based Cost Components                                  72
Table B.2: Mini grid-based Cost Components per Connection             72
Table B.3: Off grid-based Cost Components per Connection              72
Table B.4: Assets that Need to be Replaced                            73
Table B.5: Partial Snapshot of EI Roll out Sequence Algorithm
Output                                                                73
Table B.6: Annual Baseline Demand Growth Profile (Base Case)          74
Table B.7: Customer Connection Charges and Tariffs (Base Case)        74

Figures
Figure 1.1: Roadmap to 100 percent Electrification in Myanmar         ii
Figure 1.2: Annual Capex Least Cost Roll Out                          iii
Figure 1.3: Funding gap sensitivity to tariff levels                   v
Figure 2.1: Roadmap to 100 percent Electrification in Myanmar          5
Figure 2.2: Recommended Electrification Solutions                      7
Figure 2.3: Relative Connection Contributions by Each State and
Region from FY2015-2019                                                9
Figure 4.1: Annual generation costs and load factors                  25
Figure 4.2: Annual generation costs and load factors                  26
Figure 5.1: Funding gap sensitivity to tariff levels                  30
Figure 5.2: GDP Per Capita and Residential Electricity Prices         31
Figure 5.3: Business electricity prices: 2013 comparison           31
Figure 5.4: Electrification Ratios                                 32
Figure 5.5: Funding Gap When Existing System is Cash Neutral:
National Least Cost Roll out Scenario                              33
Figure 5.6: Annual Government Support Needed under National
Least-Cost Roll-out                                                34
Figure 6.1: Summary of Barriers to Achieving Electrification
Objectives                                                         41
Figure 6.2: Private and Community Operators on the ESE Franchise   49
Figure 8.1: Snapshot of Financing Input Assumptions                76

Boxes
Box 1.1: The Difference Between Funding (Cost Recovery) and
Financing                                                           2
Box 6.1: Programmatic Sector-Wide Approach: Case of Rwanda         39

Appendices
Appendix A : Successful Electrification Case Studies               66
Appendix B : Financial Model Assumptions and Methodology           71
Acronyms and Abbreviations
ARR           Annual Revenue Requirement
ADB           Asian Development Bank
Capex         Capital Expenditure
DRD           Department of Rural Development
EI            Earth Institute (Columbia University)
ESE           Electricity Supply Enterprise
GoM           Government of Myanmar
IDA           International Development Association
JICA          Japan International Cooperation Agency
kV            Kilo volts
kWh           Kilo Watt Hour
LV            Low Voltage
LRMC          Long Run Marginal Cost
MEB           Myanmar Economic Bank
MEPE          Myanmar Electric Power Enterprise
MOEP          Ministry of Electric Power
MICB          Myanmar Investment and Commercial Bank
MLFRD         Ministry of Livestock, Fisheries and Rural Development
MV            Medium Voltage
NEMC          National Energy Management Committee
NEP           National Electrification Program
O&M           Operations and Maintenance
Opex          Operating Expenditure
PLN           Perusahaan Listrik Negara (Indonesia)
PPP           Public Private Partnership
PV            Present Value
PSO           Public Service Obligation
RDB           Rural Development Bank
REPWC         Rural Electrification and Potable Water Committee
SHS           Solar Home System
VEC           Village Electrification Committee
YESB          Yangon Electricity Supply Board
Executive Summary
The Myanmar National Electrification Plan (NEP) aims to electrify 100% of Myanmar’s
households by 2030. According to the Earth Institute’s (EI) geospatial planning results, this
means connecting more than 7.2 million households over the next 16 years.
Strong Government commitment to institutional strengthening and reform, and collective
contribution of resources from consumers, and the Government of Myanmar and its
development partners as well as the private sector are key factors in achieving the NEP’s
ambitious goals.
The Roadmap to 100 percent Electrification
At present, Myanmar has about 2.3 million residential electricity connections. Depending on
assumptions on household size, this implies that less than 30 percent of the population has
access to electricity. Schools, clinics, and business in rural areas also have limited access.
At present, approximately 190,000 additional households gain access to electricity every year.
At this rate, it would take almost 40 years to achieve full electrification. Such a slow rate of
progress is not acceptable to the Government and the people of Myanmar. The Government
is committed to achieve 100 percent electrification by 2030.
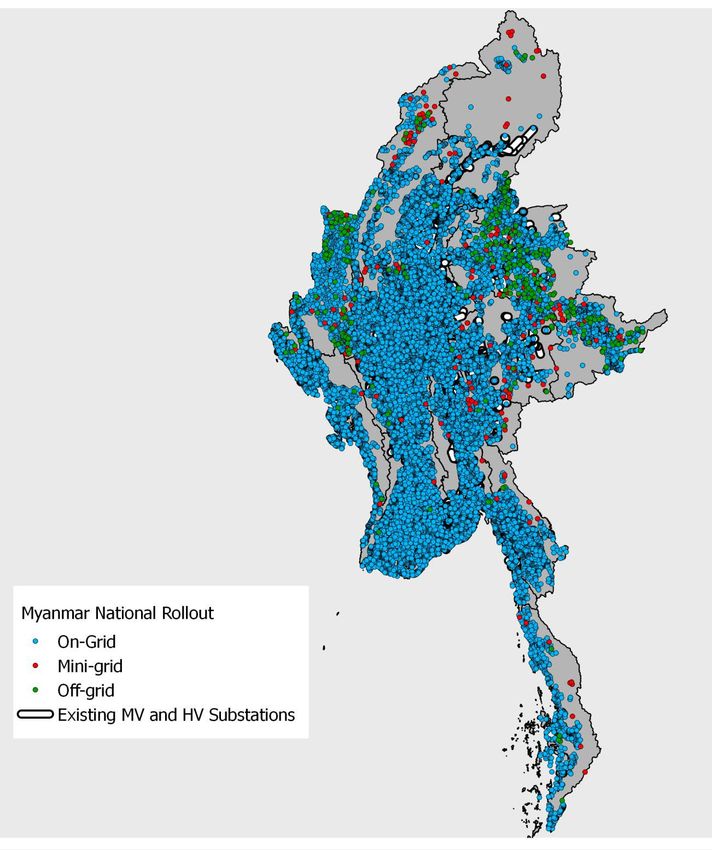
An initial comprehensive geospatial plan for the roll-out of electrification estimates that over
90% of the total new connections will be grid-based. While the electrification program will
evolve dynamically, the initial plan envisages the least cost roll-out of the grid, alongside the
development of mini-grid and off-grid solar home solutions. Additionally, approximately
250,000 connections using “pre-electrification” solutions such as temporary mini grids or off
grid solar home systems will be viable for households who can expect to be connected to
the grid at the very end of the roll-out program.
In all, approximately 7.2 million household connections will be required in the next 16 years
to fulfill the vision of universal electrification by 2030. This means that the number of
household connections needs to increase from the current 189,000 a year, to an average of
450,000 a year over the next 16 years—a more than two fold rise. Given the time required
for ramp-up, the sustained number of connections once the program reaches maturity will
be even higher: in excess of 550,000 per year.
The chart below describes the expected roadmap for the number of additional connections.
The analysis of technical and institutional capabilities shows that it will take about two years
to train sufficient technical and commercial personnel to become able to manage around
550,000 connections a year. The initial ramp-up means that during the first 5 years of the
program (FY2015-2019), a total of about 1.7 million new connections can be made. This
represents 12.3 percent of all new connections under the roll-out program. This means that
once the program reaches maturity, it will be expected to implement about 8 percent of all
new connections in each subsequent year.
Subject to the successful implementation of this plan, Myanmar can be expected to achieve
approximately 47 percent electrification by 2020, 76 percent electrification by 2025, and 100
percent by 2030.
iFigure 1.1: Roadmap to 100 percent Electrification in Myanmar
Source: Castalia and EI estimates
Investment Prospectus
The total capital cost of the electrification roll-out over 16 years is estimated to be $5.8
billion. Efficient implementation of the program will require that all capital expenditure is
financed (so that, as much as possible, repayments can be spread over the economic life of
the assets). Further investment will be needed in Myanmar’s generation and transmission
systems in addition to investment in the medium and low voltage networks required for the
roll-out (as well as investment in off-grid solutions). Additional demand from newly
connected customers will require approximately 2,600 MW of additional generation capacity
to be built over the next 16 years. While this Investment Prospectus does not cover the
financing requirement of the generation and transmission program, the analysis ensures that
sufficient funding will be available to cover the incremental costs of generation and
transmission (including the cost of finance).
With 1.7 million new connections slated for FY2015-2019, the total financing need for the
period will be $669.3million. This amount will cover fixed investment in long-lived capital
assets ($645.5 million) plus Technical Assistance of $23.8 million.
iiTable 1.1: Annual Capital Expenditure (Capex) by Connection Type (US$ Million)
2015 2016 2017 2018 2019
Grid Capex $72.5 $80.6 $79.8 $139.9 $232.2
Planned Mini-grid Capex $0.6 $0.6 $0.6 $0.6 $0.6
Pre-electrification Capex $2.0 $3.0 $4.5 $7.5 $9.5
Off-grid Capex $2.2 $2.2 $2.2 $3.2 $3.2
Total Capex $77.3 $86.4 $87.1 $151.2 $245.5
Technical Assistance $10.3 $6.8 $2.2 $3.1 $1.4
Total $87.6 $93.2 $89.3 $154.3 $246.9
The figure below puts the financing need for FY2015-2019 within the context of the overall
financing requirement for the electrification roll-out.
Figure 1.2: Annual Capex Least Cost Roll Out
$600
$500
Grid Capex ($million)
$400
$300
$200
$100
$0
2015 2016 2017 2018 2019 2020 2021 2022 2023 2024 2025 2026 2027 2028 2029 2030
There is a strong development rationale for donors providing all, or most of the financing
need during this initial roll-out phase. Meeting the financing need through concessional
donor finance will make a significant development contribution as:
It will reliably enable Myanmar to achieve the targeted 1.7 million connections in
the next 5 years. This will not only make significant contribution to the country’s
development by giving those households access to electricity, it will underwrite
the ramp-up in both technical and institutional capability required to achieve 100
percent electrification by 2030.
It will keep tariffs affordable, which is critical in ensuring that access to electricity
translates into greater welfare and faster economic growth. Moreover, the long
tenor of the concessional finance makes sure that the future users of electricity—
who can expect to be substantially better off than the current users—pick up a
fair share of the burden. In other words, it will ensure that the burden is
iiiconsistent and commensurate with one’s ability to pay among Myanmar
consumers and on the Government of Myanmar.
It will support the roll-out program over the period of economic reforms. Over
time, as Myanmar economy becomes more integrated with the global financial
system and as the local banking system matures, commercial finance will
increasingly become available on tenors and other terms that can replace
concessional finance without a material shock to tariffs.
The Government of Myanmar is already receiving important assistance from the ADB, IFC
and others, including the framework for competitive tendering for rural electrification and
the development of a regulatory framework for mini-grids. The implementation of the
Institutional Roadmap will require further Technical Assistance over the next 5 years of
$23.8 million. The TA program will add to the existing work streams and support the setup
of the Executive Secretariat (discussed below), as well as the up-skilling required for ESE,
YESB, government agencies and domestic banks that could become conduits for donor
finance to the private sector.
This report considered the feasibility of the roll-out under different tariff scenarios and
tested sensitivities to different cost assumptions, including the cost of generation. The roll-
out is feasible if future tariff revenues and subsidies committed by the Government are
sufficient to cover all costs, including payment of interest and repayment of loans. The long-
term financial model developed for this study confirms that under reasonable assumptions,
viable combinations of affordable tariff revenues and fiscally sustainable Union Budget
subsidies exist, which will ensure the full funding of the program—allowing loans to be
repaid when due.
The figure below summarizes the relationship between tariff levels and the funding gap. The
funding gap is the difference between tariff revenues and total cost of the electricity roll-out
(including operating costs and the costs of incremental generation and transmission) which
needs to be covered by Government subsidy.
The largest contributing factor of the funding gap results from keeping the current tariff
constant in real terms—in other words, the nominal tariff is adjusted each year in line with
inflation. This tariff produces the funding gap with the present value of $2.174 billion.
On the other hand, it is possible to set a tariff path that would fully cover the costs of the
electricity system over the next 40 years, so that no government subsidy would be required
(and hence, there would be no funding gap). Given the existing structure of tariffs, this
would require the weighted average tariff of $0.084 per kWh or an average weighted
residential tariff of approximately $0.05 per kWh over the period.
The Government’s current strategy is to adjust the tariff to ensure that the revenues on the
existing system cover all cash costs. Even if no roll-out happens, the cash costs of the
existing system will grow as the already connected customers increase their demand, and new
generation has to be added at full costs (including return on and of capital) to meet that
demand. The average tariff that would be required to keep the current system cash neutral is
$0.076 per kWh. This translates into a weighted average residential tariff of $0.043. In other
words, the weighted average real residential tariff in any case would be expected to increase
from $0.037 to $0.043—a real rise of 17% on average over the period—under the
Government’s present policy.
ivFigure 1.3: Funding gap sensitivity to tariff levels
$2.500
Myanmar current tariff
$2.000
Funding Gap $ billion
$1.500
$1.000
Vietnam
$0.500
Existing system cash neutral tariff
$-
$0.037 $0.038 $0.040 $0.041 $0.042 $0.043 $0.045 $0.046 $0.047 $0.049
Average Residential Tariff $/kwh
Note: Points on the horizontal axis represent the weighted average residential tariff
Overall, the tariff strategy needs to ensure that access to electricity is affordable to every
household in the country: in this way, electrification will make a critical contribution to the
Government’s poverty reduction objectives. To ensure that the subsidy commitment is
fiscally sustainable and efficient, the tariff structure will need to be reviewed to align more
closely with different households’ varying ability to pay.
Implementation Road Map
The report sets out the steps the Government of Myanmar will need to take to implement
the roll-out program. Financing is not the only challenge Myanmar possesses. Limited
institutional capability will remain a significant constraint even if financing becomes
available, tariffs are increased, and if the Government commits to future subsidies.
Moreover, the Government will need to strengthen its capability to assess and implement
predictable tariff and subsidy policies.
To meet the institutional challenges, the Government will need to ensure high quality sector
wide coordination, and strengthened implementation capacity within each area of
responsibility.
Coordination: There is an urgent need to establish a well-resourced Executive Secretariat
under the National Electrification Management Committee. The Executive Secretariat
should perform a number of roles:
It would maintain and update the geospatial and financial plans for the NEP, and
monitor the achievement of the electrification targets
v It would serve as the main point of contact for Myanmar’s development partners
and would advise the Government on managing a coherent financing program for
the sector-wide plan
It would provide advice and support to the Ministries involved in implementing
the aspects of the NEP they will be responsible for.
Electrification on YESB franchise: YESB needs certainty to access financing for
investment, and should be the Government’s immediate objective (within a year). Although
YESB electrification needs are relatively small, these steps are needed both to make the
YESB itself more sustainable (as well as to improve the quality of its service), and to ensure
that electricity consumers in Yangon are able to make a financial contribution to the overall
roll-out program. Given that the cost of service in Yangon is substantially lower than in the
rest of the country (due to higher population density and a significant proportion of industry
being concentrated in Yangon), a single national tariff would likely result in a cross-subsidy
from consumers in Yangon to consumers in the rest of the country. A stable financial
environment for the YESB can be achieved by:
Calculating an appropriate cost of service for the YESB, including the cost of
power purchases and the return on and of capital employed in the distribution
network
Determining a tariff that would cover such costs, and
Creating a mechanism for using any profits from the YESB to contribute to the
subsidies required for the electrification roll-out.
In the medium term, it will be the role of the regulator to set the Annual Revenue
Requirement (ARR) for the distribution enterprises. In the short term, this function can be
performed by the Executive Secretariat.
Electrification on ESE franchise: 96 percent new connections in Myanmar will occur in
ESE franchise area. For ESE, the Government should follow the same reform path as for
YESB, focusing in the short term on enabling ESE to access finance for investment.
In addition, it is likely that many connections under the responsibility of ESE will be
managed by private and community enterprises that will receive a concession for a sub-
franchise (covering lines below 11kV and household connections). Given the scale of the
electrification challenge in Myanmar, a multitude of solutions and initiatives should be
welcomed. However, to ensure orderly process of establishing and implementing such sub-
franchises, it will be necessary to:
Make arrangements for a clear delineation of service areas and responsibilities.
Where private parties or community organizations wish to provide service, they
should operate below 11kV network, provide a clear geographic description of the
area in which they will provide the LV and household connection service and take
on an explicit obligation to serve all customers within that area. In order to obtain
a sub-franchise, a private or community service provider should be required to file
a detailed roll-out plan showing how 100 percent electrification within the
proposed area will be achieved
vi Ensure that the ESE receives wheeling payments for its MV investments that
serve such sub-franchises. This will require a determination of wheeling tariff for
connections below the 11kV level
Create a mechanism to enable operators of such sub-franchises (whether private
or community-owned) to access appropriate financing. This should focus on
enabling a selected Myanmar bank to serve as an effective channel for
concessional finance
Create a mechanism for delivering subsidies to these operators where such
subsidies are required. Such subsidies may be either an initial capital subsidy, or
the payment of a “shadow” tariff by the Government.
For sub-franchises to be viable, it will be necessary for a proportion of concessional finance
be channeled via the Myanmar banking system to private operators seeking to establish sub-
franchise operations.
Mini-Grids: From the perspective of the implementation of the NEP, the issues around the
development of mini-grids (whether temporary or permanent) are similar to the sub-
franchising of the ESE areas. DRD should take responsibility for:
Providing standard processes and standard documentation which sets out the
obligations of the operator
Developing a competitive (minimum subsidy) process in response to a local
initiative, against predictable tariff rules
Ensuring timely delivery of the subsidy
Working together with the Executive Secretariat to implement a program of two-
step loans via a selected Myanmar bank to enable the operator to access
concessional finance.
Given the similarities in the issues, the solutions should also be similar. In fact, we would
recommend that a single set of rules be applied to sub-franchising of grid connections and to
mini-grids, since the main factor differentiating the two is likely to be the timing of when the
grid connection occurs.
Household electrification: the Government needs to move the household electrification
program (whether temporary or permanent) from the relatively unsustainable give-away of
solar systems without the users taking ownership and maintenance responsibilities of the
systems, to an arrangement where customers are provided with energy supply by firms that
maintain and operate household and village systems. Customers would pay for the energy
they receive. Private providers would use revenue to cover the costs of maintenance. The
Government would provide subsidies to ensure that tariff revenues were sufficient to cover
the costs of the private operator.
Implementation milestones
Looking back a year or two from now, how will we know that the Roadmap has been a
success? The following are the key milestones for the implementation of the Roadmap in the
next 12 months:
Milestone 1: the Government of Myanmar formally adopts the Roadmap,
including the institutional implementation plan via a Government Decree
vii Milestone 2: The Government appoints an Executive Secretariat tasked with
coordinating the roll-out program and responsible directly to the Vice-President.
The Executive Secretariat should be empowered by Decree to act as the single
window for cooperation with Myanmar’s development partners in relation to the
roll-out program. While various agencies involved in the roll-out (such as the
Myanmar International Cooperation Agency being set up by MLFRD as the
implementation enterprise) will have direct engagement with donors, the
Executive Secretariat should coordinate the overall financing program, helping
aligning donor preferences with the responsibilities of particular agencies
Milestone 3: the Government of Myanmar commences a donor pledging process,
and continue working with donors to secure the full financing package needed for
the implementation of the program
Milestone 4: the Government of Myanmar formally and publically instructs the
Executive Secretariat to conduct a tariff study (with appropriate technical
assistance) and to conducts public consultation to improve public understanding
of the costs of the electricity service and of the required tariff decisions. The new
tariff should be both affordable and consistent with the Government’s fiscal
constraints
Milestone 5: the Government of Myanmar appoints advisors to develop a sub-
franchising mechanism and standard documentation to facilitate private sector
participation in the roll-out program
Milestone 6: the Government of Myanmar makes short-term changes to the
budgeting process for the YESB and the ESE to facilitate more independent
commercial decision-making and to encourage and enable both to borrow on
their balance sheet.
The Office of the Vice-President should hold the overall accountability for the
implementation of the NEP, with each Minister being provided with clear delegations of
responsibility and corresponding accountability.
viii1 Introduction
National electrification is a top priority of the Government of Myanmar (GoM). The
Myanmar National Electrification Plan (NEP) aims to achieve 100 percent electrification by
2030. The scale of the electrification challenge in Myanmar is immense. Currently, the
electrification rate in the country stands at a mere 28.9%.1 This means that approximately 43
million out of close to 60 million people in the county does not have access to electricity.2 To
fulfill the vision of universal electrification by 2030, the number of household connections
needs to increase from the current 189,000 a year to approximately 450,000 a year3 to be
sustained over the next 16 years—a more than two fold rise. Given the time required for a
ramp-up, we estimate that the sustained number of connections once the program reaches
maturity will be even higher: in excess of 550,000 per year.
In order to achieve national electrification efficiently and effectively, the NEP needs to be
backed by (i) a sound least cost roll-out plan, (ii) sufficient funding and financing to build out
the network and (iii) capable and robust institutions to coordinate and direct the program.
This report presents intermediate targets and milestones to achieve universal access by 2030,
which is the financing and funding requirements along with the institutional roadmap for
Myanmar’s NEP for the period of 5 financial years, 1 April 2015 to 31 March 2020 (from
April to March follows the cycle of the fiscal year in Myanmar). As a short-hand, we refer to
this as the 5 year period from 2015 to 2019, indicating the commencement of the financial
year. This initial period of the NEP is a time during which technical and institutional
capability will be ramped up to create the platform for achieving the overall target by 2030.
However, to ensure the sustainability of the overall program, the financial analysis is based
on a 55-year financial model, which covers the period during which debt has to be repaid.
This report is structured as follows:
In Section 2 we describe the least cost roll-out plan and the financing need for the
period FY2015-2019. This is the Investment Prospectus part of the report: we
summarize the total amount of finance that is required for the roll-out, and
consider sources
In Section 3 we explain how we derived the total connections target for the
period FY2015-2019
In Section 4 we explain our analysis of the costs of roll-out, and consider the
sensitivities to various assumptions
In Section 5 we consider the funding of the roll out: we confirm whether the roll-
out can be funded through a combination of affordable tariffs and Government
subsidies
1
MOEP Presentation by Mr. Kyaw Myat Htoo, “Framework for Power Development Plan,” 23rd September 2013
2
Castalia calculation, based on MOEP Presentation by Mr. Kyaw Myat Htoo, “Framework for Power Development Plan,”
23rd September 2013
3
Myanmar Power System Development Scheme Presentation, 2-7-2013, MEPE, and Castalia calculations, based on ESE
and YESB 2012 Statistics Book
1 In Section 6 we present our conclusions about the institutional reforms required
to implement the NEP
In Section 7 we consider the technical assistance needs of NEP implementation
We set out key conclusions in Section 8.
Throughout this report we draw a clear distinction between the financing and the funding
of the roll out. This distinction is crucial to the analysis of financial viability of the NEP, and
to understanding how the burden will be allocated between consumers, the Government of
Myanmar, and development partners. In essence, financing is the money that has to be
returned over time, while funding is the money that does not require return. These terms are
explained fully in the box below.
Box 1.1: The Difference Between Funding (Cost Recovery) and Financing
It is important not to confuse the need for financing with the need for subsidies. Subsidies
address the cost recovery problem, while financing problems may exist even if total costs
are fully funded through a combination of tariffs and subsidies.
Figure 1 shows the situation of an infrastructure service provider with a need for financing.
The service provider needs to make a major initial investment, such as an electricity
distribution system extension. In the future, during the operational phase of the project,
the service will be able to sell electricity at a tariff which recovers the full cost of service. If
the present value of the cash flows during the operational phase exceeds the present value
of the negative cash flow during the investment phase, the provider will have recovered the
full costs of service. In this case, the project is fully funded, and providers should be able
to get financing, for example by borrowing to pay for the initial investment, and repaying
the debt from the positive cash flow during the operational phase.
Figure 2 shows the situation of an infrastructure service provider with a cost recovery
problem. Total revenues from all sources (tariffs and subsidies) are lower than total costs,
including capital costs.4 The provider whose situation is illustrated in this figure has a cost
recovery problem. The project is not fully funded: that is, there is not enough income
(tariffs and subsidies) being generated to cover total costs (operating and capital) for the
foreseeable future. No amount of financial engineering would enable the service provider
to access finance.
4
Capital costs are meant to include both the cost of capital assets being used up and needed to be replaced, usually
measured by depreciation, and the need to provide a return on capital invested, for example by making interest payments
on a loan or allowing an equity investor to earn dividends.
2FigureFinancing
1 : Financing
Need
Need
$ Initial Capital Operations Phase
Investment Phase
Cash Inflow
Cash Outflow
Operating Cash Surplus
Capital Required
NB: PV of Operating Cash Surplus > PV of Capital Required
Time
Figure 2:Recovery
Cost Cost Recovery
Need Problem
$
Losses
Total Cost (including capital costs)
Total Income (tariffs and subsidies)
Time
Source: Castalia
32 Financing for the Least-Cost Roll-out for the Period
FY2015-2019
In this section we explain the approach to planning the least-cost electrification rollout for
the next 5 years, and the implication of this plan for the need to raise finance. We also
explain why meeting this financing need through concessional donor finance would have
high development impact.
The least-cost electrification plan targets to achieve 100 percent electrification by 2030.
Current estimates suggest that this will require 7,216,638 new residential connections over
the next 16 years. This estimate includes projected population growth between now and
2030. Of course, the electrification program will evolve dynamically, both as more
information becomes available and as on-the-ground conditions change over time.
The program will need to start with a steady ramp up from the current rate of 189,000
connections per year, to a steady state of around 550,000 connections per year. The details
are further explained later in this report. The chart below describes the expected roadmap
for the number of connections achieved.
If the Government of Myanmar implements this plan, Myanmar can be expected to achieve
approximately 47 percent electrification by 2020, 76 percent electrification by 2025, and 100
percent by 2030. Of course, we recognize that the last 10 to 20 percent of the electrification
program will be particularly difficult, both from the engineering and financial perspective.
The medium term financial plan incorporates the expected funding and financing
requirements for full electrification, but the focus of this report is on the funding and
financing needs over the next 10 years. Future needs will become confirmed as geospatial
information required for planning continues to be updated and improved.
4Figure 2.1: Roadmap to 100 percent Electrification in Myanmar
Source: Castalia and EI estimates
2.1 Least-cost Roll-out
This Prospectus is based on the detailed geospatial planning undertaken by Earth Institute
(EI) in cooperation with the Government of Myanmar. This planning work underscores the
fact that this Prospectus is not a hypothetical request for funds from development partners,
but rather a concrete analysis of a least-cost expansion which incorporates technical and
economic aspects.
The geospatial plan identifies the best way to achieve full electrification by 2030 (with a
particular focus on the next five years), based on the physical characteristics of different
locations within the country. The roll-out plan is conducted at a programmatic level, and
further detailed design and planning work will be completed as the program is implemented.
The EI analysis combines geospatial information (covering the location of population
clusters, load centres, the existing medium voltage (MV) lines, as well as the existing and
planned transmission lines) with the cost information of MV and LV grid lines, transformers,
and mini-grid generation options. The technical model further incorporates population
growth and electricity demand forecasts.
EI then applies a planning algorithm which identifies the least cost electrification solution
for each location. This algorithm identifies which settlements would best be served through
5connection to the national grid, and which would be best through off-grid solutions. Off-
grid solutions may include mini-grids and household systems.
For connection to the national grid, the algorithm develops an optimal connection sequence
roll-out plan. Initial phases of grid construction reach areas that are closest to the existing
grid, where less extension of the MV lines is needed per household. Later phases reach the
next closest areas, toward rural remote communities where more MV lines are required.
Overall, under a least-cost roll-out, grid connections are prioritized in areas that meet higher
electricity demand with the shortest MV line extension.
The key conclusion from this geospatial modelling is that the least-cost way to extend
electrification to 98 per cent of the population in Myanmar is through connection to the
national grid. Approximately 98 percent of the population of the country live within 50km of
an existing or planned transmission line, with 92 percent living within 25km.
The overall plan is illustrated in the figure below.
6Figure 2.2: Recommended Electrification Solutions
Source: Earth Institute
For the national least-cost plan, the level of focus is the country as a whole. This means that
in states where the cost of grid connection is relatively high, no connection may be made
until the average cost of new connection in other states reaches that level. As we discuss later
in the report, it is possible to change the priority accorded to each state, while preserving the
7least-cost sequence within each state. However, the national least-cost plan shows the
greatest value for money that is possible over the next five years. For the given amount of
resources, it identifies the greatest number of connections that can be made. Conversely, for
a given connection target, it shows the least amount of resources that would be required.
Our analysis based on EI research shows that under the national least-cost plan, during the
five year period of FY2015-2019, zero new connections will be made in Kayah State, and
only few will be made in the Yangon Region. In practice—given YESB’s recent
performance—it is likely that Yangon Region will achieve close to 100 percent electrification
during the period of FY 2015-2019.
The national least-cost rollout by state and region for the first five years is shown in the table
below.
Table 2.1: National Least-Cost Roll Out (financial year beginning 1 April)
State/ Region Total Year 1 Year 2 Year 3 Year 4 Year 5
Connections
to be done in
FY 2015-2019
Period by
State
2015 2016 2017 2018 2019
Ayerawady 41,808 - - 4,593 23,070 14,145
Bago 79,477 - - - 39,161 40,316
Chin 16,296 - - 13,589 2,707 -
Kachin 70,956 - 59,741 - 5,223 5,992
Kayah - - - - - -
Kayin 75,070 - 28,013 - 43,591 3,466
Magway 164,969 - 29,419 71,083 29,221 35,246
Mandalay 214,699 - 37,021 7,834 28,140 141,704
Mon 91,267 - - - 16,566 74,701
Naypitaw 14,463 - - - 1,846 12,617
Rankhine 394,643 213,950 - 71,095 38,214 71,384
Sagaing 135,701 - 32,315 2,733 3,360 97,293
Shan 169,197 - 37,648 29,206 98,728 3,615
Thaninthayri 25,025 - - 24,284 401 340
Yangon 18,632 - - - 8,806 9,826
Figure 2.3below shows the relative contribution of each state or region in the first five years
of the roll out.
8Figure 2.3: Relative Connection Contributions by Each State and Region from
FY2015-2019
The national least cost plan provides the key benchmark for the electrification roll-out. The
Government of Myanmar may legitimately change the sequence of the roll-out for social,
economic, or political reasons. However, while it would be appropriate for the development
partners to support the financing needs of the least-cost program, the burden of additional
costs incurred due to policy decisions made by the Government may more appropriately fall
on the Government.
In addition to the national least-cost grid roll-out, we assume most of the areas that are
slated to be electrified through off-grid solutions in the first five years. While there is no
specific efficient sequence for off-grid projects, prioritizing such projects would contribute
to the overall social cohesion by enabling people in remote communities to be among early
beneficiaries of electrification. We also incorporate a provision for a “pre-electrification”
program: an out of sequence off-grid electrification of areas that will eventually—but
possibly only in the late 2020s—be connected to the grid. As we discuss later in the report,
there are likely to be numerous situations where such off-grid or household solar solutions
would be efficient in providing electricity to these households, prior to grid connection
which will only be possible in the later phase.
2.2 The Financing Need
The purpose of this Investment Prospectus is to identify the financing that needs to be
raised for the electrification targets for the 5-year period to be met. In principle, there are
three possible constraints on the pace of electrification:
The existence of sufficient technical and institutional capability to implement the
roll-out
9 The availability of financing
The ability and willingness to pay for electricity by the households and businesses
that will be connected.
For the purposes of estimating the financing need for the five year period, we start with the
assumption that the binding constraint over the period is the limited technical and
institutional capability. In other words, we assume that sufficient financing will be found to
under-write the maximum technically possible number of connections. We then separately
confirm that it is viable to fund the additional electrification fully through a combination of
concessional financing, affordable tariffs, and government subsidies.
To achieve 100 percent electrification by 2030, approximately 7.2 million currently un-served
households will need to be connected over the 16 year period. From the technical and
institutional point of view, we estimate that it will be feasible to connect approximately 1.7
million households in the five year period from FY2015 to 2019. By 2020, the annual
capacity to make connections will be ramped up to the level that would enable the remaining
un-served households to be connected over the following 10 years.
We use the geospatial planning results provided by EI to derive the technical solution for
each household, (i.e. on-grid or off-grid, and the type of off-grid solution), and the cost of
that solution. Of the approximately 1.7 million new households that can feasibly be
connected over the next five years, 98 percent will be connected through the grid.
The costs of an electrification roll-out include gross capital expenditures of the program, as
well as operating costs. The capital invested in the roll-out—the poles, wires, transformers,
and generation units—will have long asset lives. Since such assets provide services over a
period of time, it is efficient to finance their cost, so that payment (paying both for the
return on, and of capital) is spread over the expected economic life. By contrast, operating
costs incurred in any year should usually be covered by revenues and subsidies provided in
that year. Spreading the cost of capital assets over time through financing ensures that todays
and future users share the burden fairly. By contrast, financing to cover the costs of
recurrent operating costs defers the burden to future users.
For this reason, we assume that in order to connect approximately 1.7 million households
over the next five years, financing will be needed to cover the program’s gross capital
expenditures.
Overall, we estimate that approximately $645.5 million of financing will be required over 5
years. We note that this financing need relates only to the electrification roll-out, which
includes MV and LV distribution networks, mini-grids, and household electrification.
Further financing will be required for generation and transmission investment programs.
The table below shows the annual financing need over the next five years.
10Table 2.2: Annual Capital Expenditure (Capex) by Connection Type (US$ Million)
2015 2016 2017 2018 2019
Grid Capex $72.5 $80.6 $79.8 $139.9 $232.2
Planned Mini-grid Capex $0.6 $0.6 $0.6 $0.6 $0.6
Pre-electrification Capex $2.0 $3.0 $4.5 $7.5 $9.5
Planned Off-grid Capex $2.2 $2.2 $2.2 $3.2 $3.2
Total Capex $77.3 $86.4 $87.1 $151.2 $245.5
2.3 Development Rationale for Donor Financing
The NEP is being implemented at the same time as Myanmar’s economy is undergoing
general transformation. The Institutional Plan for the implementation of the roll-out
envisages a growing role for the private sector, including reliance on private finance through
a mix of equity and commercial borrowing. However, in the immediate future, access to
appropriate finance is severely constrained:
The Myanmar banking system is poorly developed. No banks in Myanmar offer
loans for periods of more than 2 to 3 years, and re-financing of existing debt is
extremely difficult. We understand that Village Electrification Committees
(VECs) often are only able to borrow for 3 to 6 months to spread the cost of
connecting ones village if needed. Hence, any finance that could be obtained from
the Myanmar banking system would require rapid amortization through tariffs or
subsidies
The Myanmar banking system has little experience of project financing
infrastructure developments. Hence, there would likely be delays in securing the
necessary credit, at whatever cost and tenor
The Myanmar banking system is unlikely to be able to accommodate overall credit
demand of over $100 million per year from the sector
While international commercial lenders may be willing to finance electricity
generation IPPs in Myanmar, it is unlikely that such lenders would be able to
provide systematic and reliable support to the distribution roll out without
significant structural reforms, such as full corporatization of YESB and ESE, and
the introduction of an independent electricity regulator. Again, such reforms
would take time and delay the implementation of the electrification roll-out
Finally, the cost of commercial finance is initially likely to be substantially higher
than the cost of finance provided by development partners. Myanmar is still seen
as a high risk investment destination. Over time, the risk premium of lending to
Myanmar businesses will decline.
We conclude that without substantial support from the development partners, the objective
of achieving 1.7 million connections in the next 5 years would not be met: it would be
unrealistic to expect to raise the required $645.5 million over the period from commercial
sources, and even if this amount could be financed, the burden on the consumers and the
Government of Myanmar of servicing such debt at commercial rates and tenors would not
11be sustainable. For example, we estimate that electricity tariffs would need to rise from the
current weighted average of $0.064, to $0.27/kWh. The top range of the tariff increase is
particularly influenced by the short term loan repayments which are currently prevalent in
Myanmar. We are not aware of any commercial or state banks in Myanmar offering loans of
more than 5 years for commercial projects. Our interviews with Village Electrification
Committees indicate that if there were some sort of financing has been available for
electrification projects, it ranged within less than year up to three years.
In effect, to keep tariffs affordable and to achieve the 100 percent access without access to
concessional finance, the Government would have to substantially increase its current
funding commitment to the sector. This does not appear possible, given the existing fiscal
constraints. Even if it were possible, such fiscal commitment would undermine the
Government’s other national development objectives, deter private sector participation in
the sector, and likely lead to less efficient implementation.
Given the existing financing constraints, meeting the financing need through concessional
donor finance will make a significant development contribution:
It will reliably enable Myanmar to achieve the targeted 1.7 million connections in
the next 5 years. Not only will this make a significant contribution to the country’s
development by giving those households access to electricity, it will underwrite
the ramp-up in both technical and institutional capability required to achieve full
electrification by 2013
It will ensure that the burden on Myanmar consumers and on the Government of
Myanmar is consistent with their ability to pay. In the absence of donor financing,
tariffs may rise to unaffordable levels. The long tenor of the concessional finance
makes sure that the future users of electricity—who can expect to be substantially
better off than the current users—pick up a fair share of the burden
It will support the roll-out program over the period of economic reforms. Over
time, as Myanmar’s economy becomes more integrated with the global financial
system, and as the local banking system matures, commercial finance will
increasingly become available which can replace concessional finance without a
material shock to tariffs.
123 Target Number of Connections
EI’s assessment of the total number of connections required to electrify Myanmar’s entire
population by 2030 is summarized in Table 3.1 below:
Table 3.1: Total Target Connections by State and Type over the Entire Program
No State/Region Total Grid Total Mini-grid Total Off-grid Total
Connections Connections Connections Connections
1 Ayerawady 1,092,296 32 9 1,092,337
2 Bago 686,085 160 - 686,245
3 Chin 119,524 701 1,114 121,339
4 Kachin 115,467 703 425 116,595
5 Kayah 26,952 224 21 27,197
6 Kayin 379,450 287 26 379,763
7 Magway 788,685 203 72 788,960
8 Mandalay 723,874 22 38 723,934
9 Mon 256,452 1,221 21 257,694
10 Naypitaw 98,221 - - 98,221
11 Rankhine 969,539 725 151 970,415
12 Sagaing 908,747 1,366 275 910,388
13 Shan 505,394 2,625 2,241 510,260
14 Thaninthayri 322,853 2,611 75 325,539
15 Yangon 207,752 - 8 207,760
Total 7,201,291 10,880 4,476 7,216,647
Source: EI
We estimate that over the next five years (FY2015-2019), it will be technically feasible to
implement about 1.7 million additional connections, or 12.3 percent of the total connections
expected under the roll-out program. By contrast, the total capital expenditure during that
period will be only 4 percent of the expected total cost of the entire roll-out program, since
the easiest and cheapest connections will be made first.
3.1 Grid Connections Ramp Up
Our analysis of the capability constraints suggests a ramp up profile for grid connections
shown in Table 3.2 below. This was developed (i) using historical data for new annual
connections from the two distribution utilities—Electricity Supply Enterprise (ESE) and
Yangon Electricity Supply Board (YESB), (ii) conducting interviews with ESE/YESB
engineers and management, as well as village electrification committees to assess physical
and institutional capacity, (iii) benchmarking ramp up rates from similar developing
countries.
Overall, we understand that both the private and public sectors in Myanmar are likely to be
short of approximately 1,000 trained electrical workers required for the implementation of
the roll-out. We estimate that it will take up to two years to train the required personnel, with
on-going commitment to training in the future.
13Table 3.2 below provides the estimated annual grid connections ramp up between 2015 to
2019.
Table 3.2: Ramp Up in Annual Grid Connections (2015- 2019)
New Total 2012 Year 1 Year 2 Year 3 Year 4 Year 5
Connections Actual 2015 2016 2017 2018 2019
Required
ESE 6,993,539 59,000 75,000 150,000 225,000 337,500 564,185
YESB 207,752 130,000 130,000 77,752 0 0 0
Total 205,000 227,752 225,000 337,500 564,185
The specific assumptions around this ramp up as are follows:
YESB continues to connect households at its current rate, until all of Yangon is
connected. This takes only two years, since 78% of Yangon is already electrified.
ESE increases connections by 20% in the first year, as service providers (such as
private contractors) respond to an increased volume of work by being more
productive with existing resources. Resources include adequately skilled labor as
well as physical resources (materials, equipment and so forth)
Connections on the ESE franchise area double in the second year through
additional resources recruited by ESE and through greater reliance on the private
sector, plus some reallocation from freed up YESB resources
Connections on the ESE franchise area increase by approximately 50% in years
three and four through additional resources and growth in the private sector,
including completion of training by approximately 1,000 additional electricians
Year five is the first “steady state” year. From this point on the same number of
connections are made to end of the roll out.
YESB and ESE currently perform a limited range of work themselves: a substantial
proportion of MV/LV line installation and household connections is currently performed by
private contractors. At present, such private providers may be contracted by YESB and ESE
themselves, or by Village Electrification Committees. However, the capacity of the private
sector is also constrained due to limited level of activity in this sector until now. As the
volume of contracting increases, both the public and the private sectors will develop new
capabilities. On the public side, the increase in the volume of contracting will require further
enhanced procurement capability. In recent years, capex by ESE amounted to about $20
million to $40 million per year, while the capex by YESB has been between $15 million and
$30 million. This total capex of between $35 million and $70 million a year will need to rise
consistently to reach over $230 million within 5 years.
3.2 Permanent Mini-grid and Off-grid Connections Ramp Up
EI’s geospatial analysis indicates that only a very small proportion of households can expect
to be permanently served by mini-grid and off-grid solutions: fewer than 11,000 households
will be served by mini-grids, and fewer than 5,000 will be served by household solutions. For
14the purposes of this Investment Prospectus, we assume that all of these households will be
connected during the next five years.
In practice, since many of these households are extremely isolated and poor, it is difficult to
predict exactly when they will become served. However, we think it is reasonable to assume
that their basic needs can be addressed fairly quickly:
Mini-grid and off-grid connections make up a small part of the overall
electrification program—0.15% and 0.06% of total connections respectively. With
a concerted effort, they can be completed quickly
EI’s results have shown that there is no clear way to rank mini-grid and off-grid
connections in least cost order, since they cost nearly the same per connection
across the country
Our fieldwork has revealed that mini-grid and off-grid connections are proceeding
rapidly across the country, so the envisaged five year time period to make all
mini-grid and off-grid connections by the least cost plan is reasonable.
Overall, we would like to emphasize that the number of permanent non-grid connections in
question is so small, that the timing makes almost no difference to the financing need
(although clearly, a lot of difference to those households).
3.3 Pre-electrification Connections Ramp Up
We assume that out of a total of 7.21 million households that will be connected to the grid,
some proportion will be in areas where a temporary mini-grid or other “pre-electrification”
such as household solar solution may be viable. Since the grid roll-out may not reach these
areas for 10 or more years, it is implausible to expect that residents and businesses in some
of them will not take the initiative to find alternative solutions in the meantime. In due
course, these pre-electrified areas will be connected to the grid.
Assuming the least-cost grid rollout is on target and finished by 2030, the net benefits from
pre-electrification are greatest—and pre-electrification is most commercially viable—during
the first five years. This is because it will allow capital costs of setting up a diesel mini-grid or
diesel/solar hybrid systems to be largely amortized, before the grid arrives. This is based on
EI’s assumption that diesel generators (main additional cost of such a pre-electrification
solution) have to be replaced after 10 years. In other cases, existing local renewable energy
sources will enable pre-electrification, which will remain as a viable source of generation
even after grid connection in the later phase. Finally, household solar solutions may also be
available prior to the grid arriving in an area.
Overall, it appears that the opportunity for commercially viable pre-electrification may exist
in areas that serve around 250,000 households. However, it is impossible to predict the
extent of local initiative or the availability of local renewable energy sources. Hence, we
cannot estimate the rate of “pre-electrification” solutions over the next five years.
Moreover, to some extent, the rate of pre-electrification will depend on financing availability
and institutional support. For the purposes of this Prospectus, we draw on the analysis of
“pre-electrification” options prepared by the EI and include a broad estimate of possible
financing required to provide a reasonable level of support for “pre-electrification”. To
some extent, this number is based on estimates on what may be possible given the capability
15of the implementation agency of mini-grid/off-grid programs, local communities, and the
local private sector.
It is also difficult to predict which households across Myanmar will be covered by pre-
electrification. However, for modeling purposes, the location of the mini-grids is largely
irrelevant.
164 Costs of the Roll-out
We have developed a 40-year financial model to estimate the annualized costs of the
electrification roll-out. This model allows us to estimate the revenue requirement of
Myanmar’s electricity system, as well as consider the implications of different tariff levels for
the requirement for Government subsidy.
To understand the financial viability of the roll-out, we model the distribution roll-out as a
stand-alone “business” over a period from 2015 to 2070—that is, the period during which all
loans will be fully amortized. This allows us to examine the effects of different tariff
assumptions on:
The extent to which newly connected households will fund the services they will
receive
The extent to which the existing electricity consumers will contribute to the
funding of the electrification roll-out
The level of government subsidy required.
A further benefit of looking at the “new” and “old” distribution systems as separate
businesses is that it allows us to pinpoint the incidence of subsidy. This is important since
many components of the roll-out will actually be implemented by stand-alone businesses
(such as private mini-grids or private concessionaires of distribution sub-franchises), and
each one of them will need to be financially viable.
Our financial model for the ‘new” distribution system combines three cost areas:
Distribution capex and opex—The capital and operating costs of the
distribution infrastructure needed for the rollout as well as the capital and
operating costs of generation in areas identified as more suitable for mini-grids.
This analysis is derived from work of EI.
Return on and return of capital—This is the cost of finance, and the tenor of
such finance.
For the purpose of this analysis, we assume that all the capex for the rollout
program is financed with concessional loans. The assumed loan terms, modeled
along IDA lines, are given in Table 4.1 below:
Table 4.1: Assumed Loan Terms for Donor Finance
Interest Rate 1.25 percent Annual
Grace Period 5 years No principal payments due for first five years. Interest
is payable from year 1.
Term of Loan 25 years From year of drawdown
Start year Project year when financing is disbursed for capex required in that year
Additional infrastructure costs–The capital and operating costs of additional
infrastructure needed to support the rollout. This includes:
17You can also read