ESKOM'S FINANCIAL CRISIS AND THE VIABILITY OF COAL-FIRED POWER IN SOUTH AFRICA - IMPLICATIONS FOR KUSILE AND THE OLDER COAL-FIRED POWER STATIONS
←
→
Page content transcription
If your browser does not render page correctly, please read the page content below

ESKOM’S FINANCIAL
CRISIS AND THE
VIABILITY OF COAL-FIRED
POWER IN SOUTH AFRICA
IMPLICATIONS FOR KUSILE AND THE OLDER
COAL-FIRED POWER STATIONS

Grové Steyn, Jesse Burton, Marco Steenkamp
Contact: grove.steyn@meridianeconomics.co.za

15 November 2017
ACKNOWLEDGEMENTS
This study benefitted from the support of numerous
parties. It was funded by a grant from the European
Climate Foundation. We acknowledge the support
from the Institute for Energy Economics and Financial
Analysis (IEEFA) and, in particular our collaboration
with David Schlissel.

We also acknowledge the role of a wide range of
stakeholders and industry participants who granted us
interviews and without whose support we would not
have been able to undertake the project.1

We thank the Council for Scientific and Industrial
Research (CSIR) Energy Centre for undertaking the
system level analysis for this project.

All errors remain ours.

This study should be cited as:

Steyn, G, Burton, J, Steenkamp, M (2017) "Eskom’s
financial crisis and the viability of coal-fired power in
South Africa: Implications for Kusile and the older coal-
fired power stations" Meridian Economics, Cape Town:
South Africa.

1   Given the sensitive nature of the issues under consideration, and the difficulties currently experienced at Eskom, it was necessary to agree upfront
     that the names of interviewees will not be disclosed.

© Meridian Economics 2017                            | ii
1. Should Eskom cancel part of its power station
EXECUTIVE SUMMARY construction programme to reduce costs?
The South African power system has reached a 2. Should Eskom bring forward the
crossroads. Eskom, the national power utility, is decommissioning of some of its older coal
experiencing an unprecedented period of demand power stations to reduce costs?
stagnation and decline, while having simultaneously
Our method allows us to assess whether the costs
embarked on an enormous, coal-fired power station
associated with running a particular station for its
construction programme (Medupi 4 764 MW and
remaining life exceed the value of that station to the
Kusile 4 800 MW) that has been plagued with delays
electricity system. The comparison hinges on the
and cost over-runs. This has forced Eskom to
alternative cost of meeting demand if a station is
implement the highest tariff increases in recorded
decommissioned early (or other new plant
history, and has led to a crisis in its financial viability
construction is cancelled i.e. not completed). If the
and, at the time of writing, a liquidity crisis
system can meet demand over the same time period
(Groenewald & Yelland, 2017).
through alternative resources (existing and new) at a
Having recently suffered from capacity shortages, cost lower than the levelised cost of electricity from a
Eskom's inflexible construction programme has now particular station, then it makes economic sense to
resulted in a significant and growing surplus of decommission that station early (or to not complete
expensive generation capacity. Recently, the Minister it). Our analysis is thus premised on two parts:
of Finance, Mr Gigaba indicated that Eskom has a
surplus capacity of 5 GW (Creamer, 2017).2 Eskom’s • a system-wide analysis concerned with calculating
Medium-term System Adequacy Outlook (MTSAO) the system alternative value of a station (the
(Eskom, 2017a), published in July, estimates excess station’s avoided cost);
capacity of between 4 and 5 GW in 2019/20, assuming • which is then compared against the incremental
a higher demand than is currently experienced levelised costs of running that station.
(Eskom, 2017a). The latest MTSAO (Eskom, 2017b) The system analysis undertaken by the CSIR Energy
indicates an expected excess capacity of just over 8 Centre for the reference scenario produced results
GW in 2022 based on their low demand scenario. that are in themselves important: in a 34 year, least
South Africa has also embarked on a highly successful cost optimised, power system operation and
renewable energy procurement programme. Although expansion plan, no new coal-fired power capacity is
this programme initially resulted in expensive built after Kusile, and no new nuclear plant is built
renewables prices, it has more recently produced either. New coal and nuclear plants are simply no
highly competitive prices for wind and solar power in longer competitive. When new capacity is required,
line with the paradigm-changing energy transition demand is met at lowest cost primarily from new solar
experienced globally. Despite these circumstances, PV and wind. In the more plausible moderate demand
Eskom nonetheless has not yet committed to scenario renewable energy is supplemented by flexible
decommission any of its older plants, even as they technologies, storage (pumped storage and batteries)
approach the end of their lives and the costs of and open-cycle gas turbines (OCGTs) for peaking, but
running the older stations increase. no combined cycle gas turbines. In the less plausible
high demand scenario, combined cycle gas turbines
In this report we present the results of an are only required after 2040 and produce little energy.
independent study into several possible strategies to In the moderate demand scenario this means that the
assist with ameliorating Eskom’s critical financial gas demand for peaking OCGTs will remain low until at
challenges. Essentially, we have investigated two least 2030 or later. Overall the system level analysis
questions: thus shows that South Africa does not need a nuclear,
2 This is capacity over and above a reasonable reserve margin required for system security.
© Meridian Economics 2017 | iiicoal or gas power procurement or construction Figure A shows our results for the analysis of the
programme. individual stations for a moderate demand scenario (in
which we assumed higher demand than currently seen
in the economy).
80 Env Retr Capex Capex Fuel Cost
Water cost Env Retr O&M Variable O&M
70 Fixed O&M Early Decom System value
60 Minimum capital
cost saving required.
50
LCOE (c/kWh)
40
30
20
10
0
Arnot Camden Grootvlei Hendrina Komati GrHeKoKusile (units 5&6)
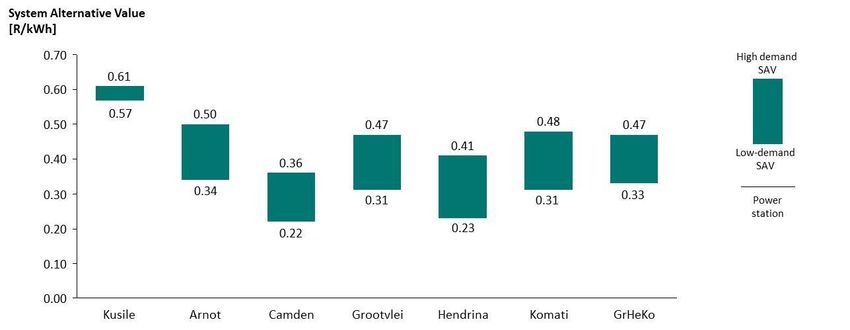
Figure A: Comparison of system alternative value and levelised costs per station (2017 c/kWh) in a moderate
demand scenario
The results show that it makes economic sense to where we decommission three stations early
decommission the older stations early, since the (Grootvlei, Hendrina, and Komati – GrHeKo).
system can meet demand at a lower cost than running
Table A shows the potential savings associated with
each of the stations. This holds for the scenario even the early decommissioning of each station.
Table A: Estimated system cost savings arising from earlier decommissioning (R'm)
Scenario Arnot Camden Grootvlei Hendrina Komati GrHeKo
Moderate Demand 5 177 5 139 5 714 7 829 3 371 12 568
Note: These savings are not additive; our methodology assesses each station individually, except in the case of GrHeKo.
By decommissioning GrHeKo early, Eskom can save as alternative value. This determines the avoidable
much as R12.5bn in present value terms. capital cost at which the option of cancelling Kusile
units 5 and 6 costs the same (given the costs of the
The incremental cost of Kusile units 5 and 6 includes
alternative resources that will then be used) as
the avoidable capital cost of completing these
completing it. This is the threshold capital cost saving.
units. However, we were not able to obtain reliable
Therefore, if the capital cost saving is more than this
estimates of the avoidable capital costs for units 5 and
threshold it will be more economic to cancel the
6. We have therefore reversed part of the analysis in
construction of Kusile units 5 and 6 than to complete
this case by netting off the other components
it, even considering that other resources will have to
of its levelised incremental cost from its system
© Meridian Economics 2017 | ivbe employed in future to replace the supplies that
would have come from units 5 & 6.
Table B below shows that this threshold capital cost cost savings threshold required is approximately 1.9%
saving level is approximately R4 747m for the of the total capital cost of the station, or
moderate demand scenario and our stated approximately 13% of the estimated cost to
assumptions. To put this into perspective, assuming completion of Kusile. Table B shows what net savings
that Eskom will still incur a 15% budget overrun on the that will result if the cancelling saving is larger than
remaining capital budget for the station, the cancelling this threshold.
Table B: Kusile Cost Saving threshold (Moderate Demand Scenario)
Percentage of estimated cost to PV of CAPEX Nett CAPEX Saving
completion for Kusile saving (R’m) (R’m)
13.18% 4 747 0
20% 7 202 2 455
25% 9 002 4 256
Our further estimates show that decommissioning workers and communities, and provide support for re-
GrHeKo and avoiding the completion of Kusile units 5 training, skills development, relocation, etc.
and 6 could giving rise to a financial saving in the
Lastly, we have to consider the possibility that Eskom’s
region of R15 - 17bn without affecting security of
financial position is even worse than generally
supply. These estimates do not reflect the additional
understood at the time of writing. The analysis
large savings in the impact on human health, local
presented above was focussed on the relative
environment and climate change that will result.
economics of the options considered, and did not
These are large and difficult decisions to make and are consider the financing implications of each option.
fraught with vested interests that will be affected. We However, if Eskom’s financial crisis continues to
have already seen from Eskom’s ongoing governance worsen, as we suspect it might, financial constraints
crisis, that Government and Eskom are partially will have to be brought into the picture. In this case,
paralysed, and could struggle to take the right further possibilities must be considered in the light of
decisions in the public interest. It is exactly for the systemic risk to the state and the entire economy
situations like this (i.e. where democratic governance posed by Eskom’s financial crisis. Assuming that the
fails), that countries create independent regulators (or economy’s ability to absorb further tariff increases and
independent public protectors, independent courts, government’s ability to provide further bailouts and
etc.). It is therefore critical that the National Energy sovereign guarantees are rapidly diminishing, Eskom
Regulator of South Africa (NERSA) ensures that these will have to urgently find other ways of maintaining its
issues are investigated and addressed, and that Eskom solvency and avoiding a liquidity crisis. In this scenario,
is only allowed to recover efficient costs in its tariffs. the only option will be to reduce the haemorrhaging of
cash. The question will be: how can this be achieved
Ensuring a just transition for existing employees is of
without letting the lights go out?
paramount importance and should be the subject of a
multi-stakeholder political process and further Although not discussed in this report, it appears that
analysis. Workers and communities should not bear Eskom has some scope for cutting back on human
the brunt of Eskom's financial crisis. Part of the savings resources costs, and on reducing its primary energy
realised could be used to cushion the impacts on costs. However, this is unlikely to be achievable over
the short-term or to be sufficient. Two key insights
© Meridian Economics 2017 | vthat emerged during this study are therefore critical
for considering how best to address this question:
1. The level of surplus capacity that Eskom now
anticipates for the foreseeable future is at least
equal to an entire Medupi or Kusile power station,
or more.
2. By the time this spare capacity would be required
in future, it will be cheaper to provide it by a
combination of alternative means (renewable
energy, gas turbines, battery storage, etc.).
Essentially the unavoidable conclusion is that Eskom is
still spending vast amounts of capital on a power
station construction programme that South Africa
does not need and cannot afford.3 Drastically
curtailing Eskom's power station capital programme
(beyond Kusile 5 and 6) might be the only way to
restore its solvency. This will of course come at a high
cost in terms of the penalties to be paid by Eskom in
future, and the impact on personnel working on the
construction projects. But, the lights will stay on,
Eskom’s cash flow situation could rapidly improve, and
confidence in Eskom and the economy would be
restored.
In this scenario South Africa might well face a stark
choice: Abandon a large part of the Kusile (and
possibly part of the Medupi) project, or allow Eskom
and possibly the state to default on its financial
obligations and pay an enormous economic and social
price.
In either case it now appears critical that Eskom puts
in place a process to plan for the urgent
decommissioning of its older power stations and
prepares for the possibility that its capital programme
will have to be curtailed. Furthermore, it will be
unrealistic to expect Eskom to drive these decisions on
their own accord. It will be necessary for key
government departments, NERSA, consumers and
other stakeholders to act in order to protect the
integrity of the power system and enable the South
African economy to participate in the global energy
transition to lower cost, clean energy resources.
3 To put this into context, we estimate that Medupi and Kusile will still require at least R80bn capital expenditure (excluding interest) as of March
2017.
© Meridian Economics 2017 | viCONTENTS
ACKNOWLEDGEMENTS II
EXECUTIVE SUMMARY III
INTRODUCTION 3
CONTEXT 4
Global context 4
Local context 5
RESEARCH DESIGN AND METHODOLOGY 8
System level analysis 9
Power station level analysis 9
DATA AND ASSUMPTIONS 10
Main sources of information 10
Common assumptions 10
System level analysis 11
4.3.1 Demand forecasts 11
4.3.2 Technology learning curves 12
Power station analysis 13
4.4.1 Operating and maintenance costs 13
4.4.2 Refurbishment 13
4.4.3 Water 14
4.4.4 Air quality compliance 14
4.4.5 Coal costs 18
4.4.6 Other power station analysis assumptions 26
Study limitations 27
RESULTS 28
System model results 28
Station level analysis 31
5.2.1 Individual stations 33
5.2.2 GrHeKo 34
5.2.3 Kusile units 5 and 6 34
Sensitivities 35
BROADER IMPLICATIONS AND CONCLUSIONS 37
ANNEXURE A 39
BIBLIOGRAPHY 45
© Meridian Economics 2017 | 1List of Tables
Table A: Estimated system cost savings arising from earlier decommissioning (R'm) iv
Table B: Kusile Cost Saving threshold (Moderate Demand Scenario) v
Table 2: Nominal Capacity of Power Stations Investigated (MW) 10
Table 3: Water Tariffs and Water Consumption 14
Table 4: Air Quality Compliance 16
Table 5: Alternative Baseline Abatement Units Cost Estimates 17
Table 6: Summary of Costs (2017 ZAR) 26
Table 7: Decommissioning Scenarios 26
Table 8: Components of Incremental Levelised Costs in the Moderate Demand Scenario (2017 c/kWh) 31
Table 9: Components of Incremental Levelised Costs in the High Demand Scenario (2017 c/kWh) 32
Table 10: System Cost Savings Arising from Earlier Decommissioning (R'm) 34
Table 11: Kusile Cost Saving Threshold (Moderate Demand Scenario) 35
Table 12: Capital Expenditure to Date in R’bn 39
Table 13: Distribution of Capital Expenditure per FY (R’bn) 41
Table 14: Medupi FGD Cost Distribution (R’m) 43
List of Figures
Figure A: Comparison of system alternative value and levelised costs per station (2017 c/kWh)
in a moderate demand scenario iv
Figure 1:Historical Electrical Energy Demand (GWh) 5
Figure 2: Electrical Energy Demand (GWh) 11
Figure 3: Equivalent Cost Assumptions for Wind and Solar PV 13
Figure 4: Coal Supplied to Kusile (Dentons, 2015; Ichor 2015; IDC, 2016; interviewees;
authors own calculations 25
Figure 5: Moderate Demand Scenario Installed Capacity (GW) 28
Figure 6: Moderate Demand Scenario Energy Mix (TWh/year) 29
Figure 7: High Demand Scenario Installed Capacity (GW) 29
Figure 8: High Demand Scenario Energy Mix (TWh/year) 30
Figure 9: System Alternative Value for Each Power Station for High and Moderate Demand Forecasts 31
Figure 10: Comparison of System Alternative Value and Levelised Costs per Station (2017 c/kWh)
in the Moderate Demand Scenario 32
Figure 11: Comparison of System Alternative Value and Levelised Costs per Station (2017 c/kWh)
in a High Demand Scenario 33
Figure 12: Kusile Cumulative Capital Expenditure 42
Figure 13: Medupi Cumulative Capital Expenditure 42
Figure 14: Kusile and Medupi LCOE 44
© Meridian Economics 2017 | 22. Should Eskom bring forward the decommissioning
INTRODUCTION of some of its older coal power stations to reduce
The South African power system has reached a costs?
crossroads. Eskom, the national power utility, is
We adopted a conservative approach throughout the
experiencing an unprecedented period of demand
study. Therefore, with respect to the first question, we
stagnation and decline, while having simultaneously
focussed on the area where the least progress has
embarked on an enormous, coal-fired power station
been made and therefore where cost savings might be
construction programme (Medupi 4 764 MW and
most likely - Kusile power station’s last two units (units
Kusile 4 800 MW) that has been plagued with delays
5 and 6). Similarly, we focussed our investigation on
and cost over-runs. This has forced Eskom to
the older stations that are likely to be the most
implement the highest tariff increases in recorded
uneconomic to continue operating, namely: Camden,
history, and has led to a crisis in its financial viability. 4
Grootvlei, Hendrina, Komati and Arnot. We also
Having recently suffered from capacity shortages,
investigated the option of simultaneously
Eskom's inflexible construction programme has now
decommissioning three of the older stations earlier
resulted in a significant and growing surplus of
than planned, namely: Grootvlei, Hendrina, and
generation plant. Recently, Minister Gigaba indicated
Komati.
that Eskom has a surplus capacity of 5 GW (Creamer,
2017)2. Eskom’s Medium-term System Adequacy In addition to the financial costs coal-fired power
Outlook (MTSAO) (Eskom, 2017a), published in July, stations impose on Eskom, coal power also places
estimates excess capacity of between 4 and 5 GW in enormous economic, social and environmental costs
2019/20, assuming a higher demand than is currently on third parties. These costs take the form of negative
experienced (Eskom, 2017a). The latest MTSAO impacts on human health and mortality, local
(Eskom, 2017b) indicates an excess capacity of just pollution impacts on the environment and agriculture
over 8 GW in 2022 based on their low demand and its contribution to climate change. These
scenario. externality impacts are substantial and should be
included in the cost benefit assessment of power
South Africa has also embarked on a highly successful
generation options. However, given the crises with
renewable energy procurement programme. Although
Eskom’s tariffs and finances, our study focussed on
this programme initially resulted in expensive
the direct financial impact on Eskom associated with
renewables prices, it has more recently produced
the options under investigation.
highly competitive prices for wind and solar power.
Despite now being the cheapest source of new
electrical energy, the renewables programme has
been caught up in Eskom's crises with the utility
refusing to sign the power purchase agreements
(PPAs) for the most recent procurement rounds.
In this report we present the results of an
independent study into several possible strategies to
assist with ameliorating Eskom’s critical financial
challenges. Essentially, we have investigated two
questions:
1. Should Eskom cancel part of its power station
construction programme to reduce costs?
4 Eskom has recently applied to the National Energy Regulator of South Africa (NERSA) for a further 19.9 % tariff increase and intends to implement
yet further increases as a way out of its financial and funding crises (Eskom, 2017c).
© Meridian Economics 2017 | 3Power Projects have actually been built. In addition,
CONTEXT India’s state-owned power generator, the National
The review of current global and local developments Thermal Power Corporation has also announced its
in the power sector, presented in this section, decision to shut down 11 GW of its oldest coal-fired
provides important context for understanding the capacity. (The Times of India, 2017).
motivation for our study and for interpreting the
These shifts away from coal have been echoed across
findings.
the world. The South Korean government announced
plans to operate 10 of its oldest coal-fired power
GLOBAL CONTEXT
plants during the non-spring months only, with the
Countries around the world are reducing their
permanent closure of these plants by 2022, three
dependence on coal and moving instead to an
years earlier than previously planned (Chung, 2017).
increased reliance on renewable resources. While in
The Dutch government announced that all coal-fired
the past subsidies played an important role, the
power plants would be shut down by 2030, including
energy transition is now driven by economic and
three plants that were only completed in 2015 (Wynn,
financial considerations. Transition steps include
2017). The Netherlands joins several G7 countries that
cancellation of projects already under construction,
have announced coal phaseouts.
retirement of older stations and deferral of proposed
coal-fired capacity additions. At the same time, The Indonesian Energy Minister recently announced
renewable energy costs have fallen dramatically across that the government will not approve any new coal-
the world, delivering prices that are increasingly fired plants on the country’s Java grid (Jensen, 2017a).
competitive with existing conventional generation Lower than expected electricity demand placed their
prices. plan to increase the nation’s generating capacity by 35
GW, including coal-fired capacity, in doubt and the
Although global growth in coal power over the past
plan now appears to be scaled back. Some 9 000 MW
decade has been highest in China and India, both
of planning capacity has been put on hold until 2024,
countries cancelled more than 50% of their planned
and thousands more megawatts (including coal-fired
coal power plants in 2015 and 2016 (United Nations
plants) will be cancelled (Jensen, 2017b).
Environment Programme, 2017). China has taken
major steps to reduce its coal use and produce power While the cancellation of these plants during pre-
from renewable wind and solar resources. For construction and construction phases, and early coal
example, in the autumn of 2016, China halted closures, are subject to market dynamics and policy
construction on 30 large coal-fired power plants. interventions in these countries, they are also
Another 30 projects, for which transmission lines were supported by rapidly falling renewable energy costs
already under construction, were also stopped across the world. Renewable energy auctions have
(Myllyvirta & Mills, 2016). A new list, issued in January delivered record-breaking declines in price, driven
2017, identified the cancellation of 103 coal-fired both by falling technology costs and newly established
projects, eliminating 120 GW of planned capacity. competitive procurement frameworks.
These cancellations included dozens of projects on Recent auctions (up to the end of 2016) have
which construction had already started, representing a consistently delivered solar photovoltaic (PV) prices of
combined output of 54 GW (Forsythe, 2017). less than USD 50/MWh, in countries such as the US,
In India, lower-than-expected growth in electricity Peru, Mexico and Chile. Even lower prices have
demand, combined with rapidly declining costs for materialised in countries with good solar resources
renewable resources and falling utilisation rates at such as Abu Dhabi (2,42 USc/kWh), Dubai and Texas.
existing plants, led to the cancellation of 13.7 GW of From the beginning of 2017, it is increasingly the norm
planned coal-fired power plants. These factors have for solar auctions to deliver prices of around 3
also led to the admission that an additional 8.6 GW of USc/kWh, even unsubsidised. Even lower prices have
newly built coal-fired capacity is not financially viable. been seen in countries offering subsidies such as
(Hill, 2017). Only two of the planned 16 Ultra Mega concessional finance or special pricing arrangements
© Meridian Economics 2017 | 4(e.g. Saudi Arabia's 1,79 USc/kWh). In Arizona solar PV stagnated and new plants have come online.
without storage has come in at 3 USc/kWh, and with
Error! Reference source not found. shows South
storage at 4,5 USc/kWh (Wright, Arndt, et al., 2017;
Africa’s electricity demand from 1985 to the present.
Diaz Lopez, 2016; Whiteman et al., 2017).
As can be seen, demand has been flat for the last
Wind energy costs have fallen less rapidly, but decade. This new trend was driven by rapidly
auctions also frequently deliver prices of below 50 increasing prices, low economic growth and changes in
USD/MWh, currently converging at around 40 electricity intensity. The demand forecast of the
USD/MWh (Whiteman et al., 2017), with lower prices original 2010 Integrated Resource Plan (IRP) Base Case
achieved in Mexico, Peru and Morocco. In the latter, scenario is shown for comparison. As can be seen,
onshore wind achieved a price of 3 USc/kWh (Wright, current demand is approximately 78 TWhs5 below the
Arndt, et al., 2017). These prices are close to the costs 2010 IRP projection. This is similar to the energy
assumed in our study for renewable energy in 2030, output of two and a half Kusile power stations at full
highlighting that cost reductions may happen output. The substantial overestimate in demand in the
substantially more quickly than anticipated in our 2010 IRP also highlights that committing to large, high
modelling (see 0 below). complexity, inflexible, new build with long lead times
is a very risky strategy (Steyn, 2001; Steyn & Eberhard,
LOCAL CONTEXT 2010).6
After several years of supply shortages, Eskom now
faces a surplus of generation capacity as demand has
400000
350000
300000
250000
GWh
200000
150000
100000
50000
0
1985
1986
1987
1988
1989
1990
1991
1992
1993
1994
1995
1996
1997
1998
1999
2000
2001
2002
2003
2004
2005
2006
2007
2008
2009
2010
2011
2012
2013
2014
2015
2016
2017
2018
2019
Year
Eskom: generated and purchased (in FY) Historical Demand (GWh) IRP 2010 (GWh)
Figure 1:Historical Electrical Energy Demand (GWh) 7
Source: Eskom, 2017d,e; Wright, Calitz, et al., 2017
5 The IRP 2010 forecast (320.751 TWh) is approximately 78 TWh more than the energy available by Eskom 2016/17 (Eskom financial year) (242.023
TWh).
6 This exact contingency was foreseen and warned against in Steyn(2001, 2006)
7
The Eskom: generated and purchased are in Eskom financial years whereas the other data is in calendar years. The grey part of the “Eskom:
generated and purchased” line show Eskom’s projections included in their 2017 NERSA Revenue Application (Eskom, 2017c) and is the Total Gross
Production in GWh. Both the Eskom: generated and purchased and the Total Gross Production are inclusive of energy generated by Eskom,
purchased from IPP’s, wheeling and energy imports from SADC countries
© Meridian Economics 2017 | 5Indeed, Eskom's own system adequacy report to R393/ton in FY 2017, and is expected to increase to
highlighted that the surplus is forecast to grow to R430/ton by FY 2019 (Burton & Winkler, 2014; Eskom,
between 4 and 5 GW in the next five years, assuming 2017e). However, these overall cost increases mask
their moderate growth in demand (Eskom, 2017b). divergent station-specific costs that affect the merit
This surplus is primarily a result of the commissioning order of the stations. Station-specific costs should be
of the large units at Medupi and Kusile, which driving future choices around investment in
effectively stranded the older, less efficient, coal-fired refurbishment, life extensions, environmental
stations, given the low demand for electricity over the compliance and the option of earlier
past decade. In Eskom's low demand forecast (Eskom, decommissioning. Part of the cost increase is due to
2017b), surplus capacity grows to over 8 GW by 2022, corruption, as has been widely reported in the South
when new Independent Power Producer (IPP) African press. However, poor planning (partly because
renewable energy capacity is included (and close to 6 of political interference) and mining sector market
GW even without new IPPs). dynamics are also driving higher coal prices for Eskom.
Stagnant demand is likely to be at least partly a result Most independent analyses of the South African
of Eskom’s unprecedented tariff increases. Yet Eskom electricity sector have not used detailed, station-
continues to request tariff increases. In addition to the specific coal, water and other input costs. This
350% increase in real terms since 2007, Eskom limitation curtails insight into how Eskom manages the
requested a 19.9% average increase in tariffs in its coal fleet and the understanding of which plants may
2017 National Energy Regulator of South Africa be surplus to the system and/or uneconomic to run.
(NERSA) revenue application. A key aim of the This study aims to fill the gap. An independent
application is to make up for declining sales volumes. economic analysis remains important because, despite
This appears to be an early sign of the utility death the challenges facing Eskom as outlined above, the
spiral, where higher prices drive down demand and utility has not put plans in place for the imminent
sales, which in turn leads to higher prices to recover a decommissioning of its power plants, nor for the
fixed cost base. socioeconomic impacts of these closures - even as
these plants rapidly approach their planned
With repeated cost escalations and time overruns at
decommissioning dates. In response to several
the Medupi and Kusile construction projects, reduced
Promotion of Access to Information Act (PAIA)
sales are putting Eskom under enormous financial
requests, for example, Eskom continues to state that it
strain. Eskom’s financial woes have reached the point
has no plans to decommission its plants (Eskom,
where the Finance Minister and others have deemed
2017f) and is side-stepping the issue of
the utility to be a systemic risk to the South African
decommissioning (let alone early decommissioning) by
economy (Bonorchis & Burkhardt, 2017; Creamer,
keeping the option of life extension of the older plants
2017; de Vos, 2017).
on the table. We understand from our interviewees
Eskom’s cost base is exacerbated by the costs that the motivation is partly political. Politicians are
associated with an inefficient and ageing coal fleet concerned about potential electoral impacts of plant
that faces escalating coal costs, requires increased closures and want to minimise perceived job losses in
maintenance and refurbishment, is not the run up to the 2019 elections. There are also calls
environmentally compliant and therefore requires from unions and others outside Eskom (e.g. the Fossil
substantial capital expenditure to meet legislative Fuel Foundation) to extend the lives of the aged plants
standards. (iNet Bridge, 2017).
Primary energy costs have risen substantially in real In practice, however, the surplus of capacity has
terms over the past 18 years (see section 4.4.5 below). resulted in Eskom already placing many units (at
More recently Eskom’s average cost of coal has risen various stations) in extended cold reserve, with a call
from less than R200/ton in Financial Year (FY)8 2010, up time of up to five days. Eskom also recently
8 The financial years referred to in the report are Eskom financial year i.e. from April to March, unless stated otherwise
© Meridian Economics 2017 | 6announced that Grootvlei, Hendrina, and Komati underplayed. Table 1 shows the number of employees
would be placed in extended cold reserve in their at Eskom’s coal-fired power stations.10
entirety (though not decommissioned) (le Cordeur,
Table 1: Employment at Eskom's Coal-fired Power
2017a; Eskom, 2017d). These stations will therefore Stations
continue to incur costs even though they might be
surplus to the country's requirements9. Furthermore, Power Station Employment
Eskom continues to sign new coal contracts for power Arnot 677
stations that are supposed to be decommissioned in Camden 324
the coming years, locking itself into expensive take-or- Duvha 696
pay contracts for coal it does not and will not need. Grootvlei 427
Within this context of Eskom’s financial crisis, falling Hendrina 644
demand, surplus capacity and rising coal costs, South Kendal 668
Africa has successfully implemented renewable energy Komati 331
auctions that reflect international trends in technology Kriel 701
cost reductions, delivering falling prices over Kusile 247
successive bid windows. Lethabo 628
It is now clear that renewable plants are the lowest Majuba 508
cost new build options in South Africa. The latest Matimba 476
round of renewable energy bids (Round 4.5), at an Matla 659
average of 62 c/kWh (2016 ZAR), are approximately Medupi 293
40% lower than the bids received for the new Tutuka 649
independent coal power plants at over R1,0/kWh. Source: Centre for Environmental Rights, 2017
Furthermore, according to our calculations, the latest
round of new renewable energy bids is substantially
below the levelised costs of Eskom's new coal plants.
We calculate Medupi’s levelised cost of electricity
(LCOE) as R1,70/kWh and the LCOE of Kusile as
R1,91/kWh (2017 ZAR; see Annexure A on page 39 for
details of the calculations). Energy from new
renewable projects is therefore approximately one-
third of the costs of new Eskom mega coal plants.
South Africa has every reason to expect that the prices
for new renewable energy projects will continue to fall
(see section 0 below) to the point where coal-fired
plants will be made redundant.
Any structural changes in the energy economy will of
course have socioeconomic impacts that should not be
9 Eskom does not explain what it means by these various terms, but in general, cold reserve means a station is not running but can be called up if
needed within 12-16 hours; extended coal reserve means the station can be called up within 5 days. Mothballing means an asset is closed but not
permanently so, and can be used again in the future.
10 In addition to the direct employees at stations, we note that there are significant numbers of people temporarily employed at Kusile during
construction. Eskom's latest MYPD applications indicated 22 000 workers at Kusile. This is substantially higher than earlier numbers provided by
Eskom, and have grown from 8000 peak construction jobs in 2008, to 12 000 direct and 1 700 indirect jobs in 2011, to 17 000 jobs in 2015. In 2015,
Eskom also stated that: " the project had reached its peak in terms of employment numbers and had no additional employment opportunities."
(Mafika, 2008; Parliamentary Monitoring Group, 2011; Steyn, 2015)
© Meridian Economics 2017 | 7should be ignored (or deemed zero). All that matters
RESEARCH DESIGN AND are the costs that the decision maker still has
METHODOLOGY discretion over, and which can, in principle, still be
This section outlines our research design and avoided. Incremental costs are thus similar to
methodology, describes two key analytical avoidable costs.
approaches, explains important methodological
Levelised costs
concepts and highlights a fundamental principle on
which the study relied. The relative economics of different electricity
generation options can be analysed by calculating
In order to address this study’s research questions, we their levelised costs. Generally, the levelised cost is
had to adopt a research design that was both practical calculated so as to express all the relevant costs over
and achievable, but that also produced reliable results. the lifetime of the project as a single cost per unit of
Both research questions set up a counterfactual logic. production (e.g. per kilowatt-hour for electricity). This
Essentially, we are assuming that electricity demand is similar to a simple average cost, but the calculation
will be met in all cases, but whether it will be met with takes the timing of the costs and of the production
or without the plant in question is the crux of the volumes over the life of a project into account.
matter. Accordingly, this analysis has to compare the Mathematically the levelised cost is calculated as the
costs to Eskom of meeting electricity demand both present value of the project costs, divided by the
with and without the plant, in each option under present value of its production volumes.
investigation (Kusile units 5 and 6, or the older coal
stations). While levelised cost analysis is usually used to
compare the total costs of a resource (power station),
We employed two analytical approaches in order to any aspect of its costs can be levelised over the
conduct this analysis. Firstly, we investigated the volumes, in order to show the result as a cost/unit of
optimised resource allocation and cost of supply for volume. It is therefore also possible to express the
the entire South African power system. This system- incremental cost of running a power station in
level analysis was performed by the Council for levelised cents/kWh terms.
Scientific and Industrial Research (CSIR) Energy Group,
using their PLEXOS power system modelling tool. In System alternative value
order to meet a particular demand forecast, the model When conducting the analysis of an entire power
schedules existing plants, based on their incremental system, as we did for this study, we relied on a
costs (subject to certain constraints), and constructs fundamental principle: The energy and capacity
new system resources as required, based on their total provided by any resource (a supply or demand side
costs. option) can alternatively be provided by an optimised
Secondly, we conducted a detailed investigation into combination of other system resources, should the
the future incremental costs of each individual power initial resource be unavailable. This should be a like-
station in question. This station level analysis was for-like comparison with respect to the dispatchability
undertaken by the Meridian Economics project team. and reliability provided by the plant under
investigation. In economic terms, therefore, the value
The key concepts described below explain our
of a power station to the system is the alternative
methodology and how we utilised these two levels of
costs to the system that are avoided by having this
analysis:
station available and operational. We refer to this as
the system alternative value (SAV) of the station.11 The
Incremental costs
system alternative value can be expressed as a
When considering the costs of alternative strategies,
levelised cost per unit of output (e.g. kWh).
economists would generally accept that sunk costs
11 This can also be referred to as a power station’s levelised avoided cost of energy, i.e. the costs that are avoided by keeping the station on the
system and dispatching it in accordance with its economic merit order.
© Meridian Economics 2017 | 8It will only be economic to operate an existing power saving. If the saving is higher than this level, it would
station, or build a new one, if the alternative (its be more economic to cancel rather than complete
system alternative value or SAV) will cost more. construction of the Kusile units 5 and 6.
Conversely, if the station's levelised cost is more than
its SAV, it means that the energy and capacity services SYSTEM LEVEL ANALYSIS
to the system can be provided at a lower cost by The primary aim of the system modelling was to
available alternative resources, and therefore, all determine the system alternative value for each
things being equal, should be closed down (if already power station option under consideration. For these
operating) or not constructed at all. The system purposes we utilised the CSIR’s energy system
alternative value thus becomes a ceiling value that the modelling capability. The model determines the
costs of any power station (existing or to be lowest total electricity system cost over 34 years by
constructed) should not exceed. optimising the utilisation of existing generators (which
Our methodology consists of the following steps: decommission over time) and new investments. In
doing so it ensures that the energy balance is
1. Use the system model to determine the optimal maintained for every period in a least-cost manner
use of each station and the construction of new subject to system adequacy requirements (i.e.
stations to produce a reference (or base) scenario. reserves and cost of unserved energy). The
This provides an energy output profile (energy optimisation is also subject to a range of other user-
profile) for each station over the analysis period, defined constraints, e.g. supply technology technical
for a high and a moderate demand scenario. characteristics (ramp rates, start/stop costs, minimum
2. Use the system model to determine each station’s up/down times, etc.), supply technology reliability and
system alternative value. operational limitations (pumped storage weekly
cycling) (Wright, Calitz, et al., 2017)12.
3. Investigate each station’s incremental cost of
operation and calculate the levelised incremental
cost of producing the energy profile required from
POWER STATION LEVEL ANALYSIS
The aim of the power station level analysis was to
each.
conduct a detailed investigation into the incremental
4. Compare each station's incremental levelised cost levelised costs of operating each power station under
to its system value to determine, in the case of an consideration. To conduct this calculation, we had to
existing station, whether it should be investigate the circumstances of each station and
decommissioned, or in the case of pending gather best estimates of its present and future
construction, whether it should be completed or relevant cost drivers, including factors such as:
cancelled.
• Primary energy cost (coal supply arrangements
In the case of the investigation into the economics of and costs)
completing Kusile units 5 and 6, the incremental cost • Power station efficiency
includes the avoidable capital cost of both these units. • Water costs
As discussed below, we were, however, unable to
• Fixed and variable operating and maintenance
obtain any reasonable estimates of this cost. We
costs (FOM and VOM)
therefore reversed the analysis in step four and
• Refurbishment costs
calculated the avoidable capital cost (in cents per
• Environmental compliance retrofits required and
kWh) by netting off the units’ other components of
the costs thereof
levelised incremental cost from its system value. At
• The increased operating cost associated with
this level, cancelling both units would cost the same as
environmental retrofits
completing them. This is the threshold capital cost
12 For further details on the approach adopted by the CSIR see their technical report (Wright, Calitz, et al., 2017) also available on the Meridian
Economics website (www.meridianeconomics.co.za).
© Meridian Economics 2017 | 9• The environmental levy station level analysis were obtained from the
• Kusile’s outstanding capital expenditure (CAPEX) following:
• Energy production profile (from system modelling) • Information authored by Eskom and available in
• Operating capacity the public domain, either on their website,
• The costs of station decommissioning and the net published in articles or provided in response to
present value cost impact thereof requests made in terms of the Promotion of
We have constructed a discounted cash flow model Access to Information Act (PAIA).
that calculates the levelised cost of electricity (LCOE) • Technical reports available in the public domain or
for each power station. For the purposes of this provided in terms of the PAIA.
analysis, the cost data used to drive the calculation • Annual reports, reserves and resources reports,
only reflects the avoidable incremental cost of running sustainable development reports, investor reports
each station. for Eskom's coal suppliers and possible future coal
suppliers where known, as well as industry reports
The power stations under investigation in this study
on coal mines and Eskom's coal supply.
are shown in Table 2.
• General news and industry news publications.
Table 2: Nominal Capacity of Power Stations • Interviews with people who have intimate
Investigated (MW) knowledge of Eskom’s operations, related air
Power Station Number of Units Nominal quality compliance matters and the coal sector.1
Capacity (MW)
Arnot 6 2220 COMMON ASSUMPTIONS13
To ensure consistency, a number of overarching
Camden 8 1900
assumptions were used in both the system level and
Grootvlei 6 1520 station level analyses. The main overarching
assumptions include:
Hendina 10 900
• The analysis period is from 2016/17 to 2049/50,
Komati 6 1080
and although the PLEXOS model was run in
Kusile (all units) 6 4338 calendar years, all output required for the station
Kusile units 5 and 6 2 1446 model was adjusted for financial years (i.e. Eskom
financial year 1 April – 31 March).
• The commissioning and decommissioning
schedules are as per the draft IRP 2016
DATA AND ASSUMPTIONS (Department of Energy, 2016a).
This section outlines the main sources of data and the • CAPEX and operating expenses (OPEX) for new
assumptions used in the analysis. We detail build power generators, unless stated otherwise,
assumptions on the demand and technology costs are as reported in the Electric Power Resource
used in the system model, after which the data and Initiative (EPRI) (2015) study.
assumptions used for calculating the levelised costs • All costs are in real terms and are presented in
for each station are described. 2017-rand terms, unless stated otherwise.
• An after tax real discount rate of 8.2% which is
MAIN SOURCES OF equal to the economic opportunity cost of capital
INFORMATION (EOCK) specified by National Treasury (National
Publicly available information was used as far as Treasury, 2016: 27).
possible. The main sources of information used for the
13 A detailed explanation of the system level modelling assumptions can be found in Wright et al (2017).
© Meridian Economics 2017 | 10• The station level analysis used the energy and committed plants (Medupi, Kusile and Ingula) were
capacity profiles (for the various scenarios) used. Unlike the draft IRP 2016 (Department of
produced by the system level analysis. Energy, 2016a), this study assumes that all renewable
capacity from the Renewable Energy Independent
SYSTEM LEVEL ANALYSIS Power Producer Procurement Programme (REIPPPP)
In this section we briefly outline the key assumptions Bid Window 1, 2, 3, 3.5 and 4 is committed, but
used for the system level analysis. The model aims to excludes Bid Window 4 Additional, Expedited and the
meet demand at the lowest cost, subject to the new build coal IPPs. That is, the model optimally
operational and other system constraints (e.g. ramp meets demand (either from existing stations or using
rates, lead times to build new capacity, reserve least-cost new capacity) after the REIPPPP Bid Window
margins, etc.), and uses an hourly time resolution. 4 and Kusile. A full set of assumptions can be found in
Wright, Arndt, et al., 2017. The demand forecasts used
Many of the assumptions in the reference scenarios
in the reference scenarios and the assumptions on
were aligned with the draft IRP 2016 (Department of
technology costs and learning curves for renewable
Energy, 2016a). For example, the energy availability
energy are shown below.
factor, discount rate, cost of unserved energy and the
decommissioning schedule of the existing fleet (50- 4.3.1 Demand forecasts
year life or as per draft IRP 2016). In the reference Figure 2 shows the high and moderate demand
scenarios, all six units at Kusile are commissioned as forecasts used in the system modelling.
planned, and the P80 commissioning dates for
ELECTRICAL ENERGY DEMAND
550000
500000
450000
400000
350000
GWh
300000
250000
200000
150000
100000
2001
2031
1985
1987
1989
1991
1993
1995
1997
1999
2003
2005
2007
2009
2011
2013
2015
2017
2019
2021
2023
2025
2027
2029
2033
2035
2037
2039
2041
2043
2045
2047
2049
Moderate (IRP 2016 Low) Historical Demand
High (IRP 2016 Base Case) Eskom: generated and purchased (in FY)
IRP 2010 (Base Case)
Figure 2: Electrical Energy Demand (GWh)7
© Meridian Economics 2017 | 11The high demand projections were taken from the between zero growth and the moderate demand used
Base Case presented in the draft IRP 2016 while the in this study. The moderate demand scenario might
moderate demand forecast is an update from the draft well be on the upper end of the range of plausible
IRP 2016 low demand which was developed by the future outcomes. Generally speaking, a lower demand
Energy Intensive User Group (Wright, Calitz, et al., forecast will lead to a lower system alternative value
2017: 9). and a higher incremental LCOE. We therefore consider
the moderate scenario to be a conservative
As can be seen, Eskom's short-term projections are
assumption, particularly in the short to medium-term.
well below the forecasts used in this analysis.
Furthermore, these electricity growth assumptions are 4.3.2 Technology learning curves
premised on a GDP growth of 1.9%, 2.4% and 2.7% for
Conventional technology costs are based on the draft
the 2017, 2018 and 2019 years respectively (Eskom, IRP 2016 (Department of Energy, 2016b) and EPRI
2017e: 39). However, more recent National Treasury 2015 (Electric Power Resource Institute [EPRI], 2015).
estimates for South Africa's growth rate have been Renewable energy starting costs were based on the
reduced to 0.7% and 1.1% for 2017 and 2018 Bid Window 4 (Expedited) tariffs, with learning curves
respectively (2017b: 12). If one compares the based on Bloomberg (2017). Wind energy costs
compound annual growth rate (CAGR) of the period
decline by approximately 25% by 2030 and
2007 to 2017, to the CAGR forecasted in the two
approximately 50% by 2040, remaining constant
scenarios for the period 2017 to 2027, the numbers
thereafter. Solar PV costs decline by approximately
reveal a discrepancy between historic and forecasted
35% by 2030 and approximately 70% by 2040,
demand. The CAGR of the historic demand is negative
remaining constant thereafter (see Wright, Calitz, et
0.07%. This is essentially stagnant demand, although
al., 2017 for a full breakdown of the cost structure of
one needs to bear in mind the supply limitations due
the technologies). The cost assumptions for 2030 used
to load shedding. The CAGR for the high demand
in our study were already globally realised in 2016 and
scenario is 2.37%, and for the moderate demand
2017. The 2030 wind energy cost of 3,1 USc/kWh
scenario, 1.44%. As mentioned in the introduction to (2016 USD) is close to the price recently achieved in
this report, both these forecasts are relatively Morocco, while the 2030 solar PV cost of 2,5 USc/kWh
optimistic and unlikely to be realised under current has been achieved in several countries already, albeit
economic conditions. with supportive policy (Diaz Lopez, 2016; Wright,
It is therefore apparent that it would have been Arndt, et al., 2017).
appropriate to have also considered a lower demand
Based on the latest realised prices for these
forecast scenario similar to that of Eskom's latest 10-
technologies, our learning curve assumptions are
year forecast, which would be pitched somewhere
considered to be conservative (See Figure 3).
© Meridian Economics 2017 | 124 Assumptions: IRP 2016 - high (Solar PV)
Assumptions: IRP 2016 - low (Solar PV)
3.5
Assumptions for this study (Solar PV)
3 Actuals: REIPPPP (BW1-4Exp) (Solar PV)
Tariff (ZAR/kWh)
2.5 Assumptions: IRP 2016 - high (Wind)
Assumptions: IRP 2016 - low( Wind)
2 Assumptions for this study (Wind)
1.5 Actuals: REIPPPP (BW1-4Exp) (Wind)
1
0.5
0
2010
2012
2014
2016
2018
2020
2022
2024
2026
2028
2030
2032
2034
2036
2038
2040
2042
2044
2046
2048
2050
Years
Figure 3: Equivalent Cost Assumptions for Wind and Solar PV
is because, in terms of the International Financial
POWER STATION ANALYSIS Reporting Standards, not all these costs are expensed,
This section outlines the data and assumptions used in indeed some are capitalised. Furthermore, for older
the study for each set of costs per power station. We stations, and especially older stations that have been
also note where we excluded particular costs (usually run very hard, these costs may underestimate the
for lack of data), as well as whether and why we think capital spend required.
particular costs may be an overestimate or
underestimate. We have relied on publicly available It is difficult to find interchangeable capital cost
data wherever possible. This data was used to estimates for power stations, as stations vary in age,
compare the costs per station in the analysis against design, capacity and operational conditions. In
the system alternative value for the stations, as addition, it is not always clear which refurbishment
calculated in the optimisation modelling. costs are included in fixed and variable operating and
maintenance cost estimates. Publicly available
4.4.1 Operating and maintenance costs information on refurbishment cost estimates is rare
We were unable to obtain any public information on and seldom discloses the extent of refurbishment
the fixed and variable operating and maintenance associated with these costs (as some refurbishments
costs (FOM and VOM) for each Eskom power station may include life extensions). Additionally, the specific
investigated. We therefore relied on data provided by refurbishment requirements at Eskom’s different
the Electric Power Research Institute for South African power stations are unclear.14 This makes estimating
power stations (Electric Power Resource Institute the refurbishment costs for Eskom’s existing coal-fired
[EPRI], 2015; Wright, Arndt, et al., 2017). power stations extremely challenging, even though it
is clear that many stations require substantial
4.4.2 Refurbishment
investment in refurbishment (Dentons, 2015). Eskom’s
Evidence from other countries, from PAIA requests to stations have been run exceptionally hard and Eskom
Eskom, and from our interviews, show that the has not made adequate capital investments into its
operating and maintenance cost estimates do not fleet over the past 15 years. For example, all of the
include all refurbishment and maintenance costs. This
14 While we submitted a PAIA request for the data, we were denied the cost estimates as Eskom deemed the information commercially sensitive.
© Meridian Economics 2017 | 13stations in our study have exceeded their boiler and be included in our FOM and VOM assumptions, given
turbine design lives (Dentons, 2015: 18) the plant specific data constraints we encountered. In
effect this is a conservative assumption given that
The Hendrina Power Station Life-Ex Study (Siemens,
most stations could be expected to require substantial
2015), commissioned by Eskom, also includes a capital
further refurbishment investments to complete their
expenditure scenario for the investments required to
original life span.
ensure Hendrina functions until 2025, the plant’s
original decommissioning date. These investments 4.4.3 Water
imply that there is a need for capital expenditure over
Water is a key input into the electricity production
and above normal maintenance.
process. Each station pays specific tariffs related to the
Nonetheless, international estimates for the CAPEX catchment it draws from, and the associated
associated with older plants gives a broad sense of the infrastructure requirements for the provision of water.
costs involved. Carbon Tracker (2017), found that in This study makes use of the current tariffs for
the US, refurbishment costs for stations older than 30 supplying water to Eskom for each station (the
years are approximately R250/kW15 (or approximately Department of Water Affairs third party tariff),
R560m to refurbish Arnot). Refurbishment costs need obtained from the DWA. Water consumption data for
to be incurred in addition to the annual fixed and each station was obtained from the World Bank’s
variable operating and maintenance costs. Water-Energy Nexus study (World Bank, 2017a). The
water tariffs and consumption are presented in Table
We decided, however, not to include any further
3.
refurbishment costs in addition to those which might
Table 3: Water Tariffs and Water Consumption
Power Station Water (ZAR/kl) Raw Water Use (l/MWh)
Arnot 7.6493 2220
Hendrina 7.6493 2610
Camden 7.4886 2310
Komati 7.6493 2490
Grootvlei 3.5077 1710*
Kusile 19.27 120**
Notes: *Four units, wet closed cycle and two units direct dry system with spray condenser and dry cooling tower
**this is estimated based on the Matimba Power Station
Source: World Bank, 2017
The administered prices used in the study do not externality costs (Nkambule & Blignaut, 2017). The
include the externality costs of water supply and use. water tariff, therefore, does not have any signalling
That is, these prices do not capture society’s welfare power for the actual social cost of water use.
impact due to the externalities associated with water
4.4.4 Air quality compliance
supply and use (Spalding-Fecher & Matibe, 2003).
These may be substantial, for example, recent work Eskom has in recent years faced mounting pressure to
has shown that water accounts for 65% of the comply with environmental regulations and legislation
15 The refurbishment figures were originally in 2012 USD terms. The average exchange rate of ZAR:USD for 2012 was used, i.e. R8.20, to convert the
cost into 2012 ZAR terms. This was then inflated to 2016 ZAR based on the historic SA inflation rate.
© Meridian Economics 2017 | 14You can also read