LOCKED IN THE PAST WHY EUROPE'S BIG ENERGY COMPANIES FEAR CHANGE
←
→
Page content transcription
If your browser does not render page correctly, please read the page content below
LOCKED IN THE PAST
WHY EUROPE’S BIG ENERGY
COMPANIES FEAR CHANGE

Contents
Executive summary 3
1. Introduction 5
2. Changing environment 6
3. The “dinosaurs” still dominate, for now 8
4. Failure to adapt 10
4.1. Over-investment in obsolete fossil assets 10
4.2. Missing the renewables revolution 18
4.3. Missing initial advantage in serving prosumers 21
4.4. Huge capex growth since the crisis 22
5. Dire consequences 23
5.1. The “valley of tears” 23
5.2. Utilities with more vulnerable fossil generation businesses 28
6. Utility responses 30
6.1. Traditional responses: lobbying and cost cutting 30
6.2. Potential elements of new utility business models 32
7. Greenpeace recommendations to governments 34
8. Appendix: Top 10 EU utilities production and renewable share 2012 36
Written by Gyorgy Dallos, February 2014
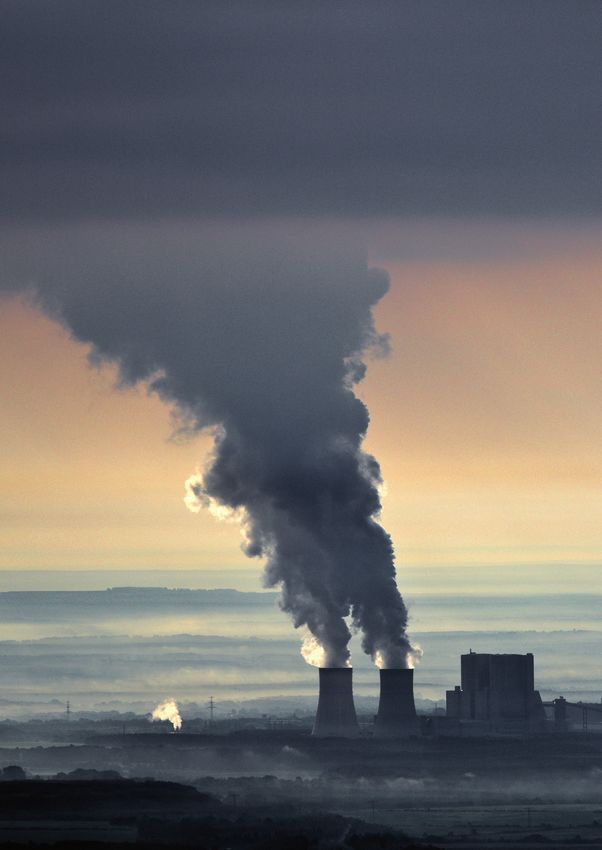
Cover photograph Lignite power plant Schwarze Pumpe (Vattenfall Europe)
in Germany’s region Lausitz (federal state Brandenburg). © Paul Langrock / Greenpeace
Designed by Egon Tobias
Published by Greenpeace Germany
Hongkongstraße 10
20457 Hamburg
040 306180
www.greenpeace.de
Acknowledgements
We would like to thank the following people who contributed to the creation of this report. If we have forgotten
anyone, they know that our gratitude is also extended to them: Franziska Achterberg, Helen Babs, Andree Boehling,
Mark Breddy, José Luis Garcia Ortega, Lucie Jakešová, Damian Kahya, Albert ten Kate, Brian Kenety.
Disclaimer
This paper and the information contained herein is not investment advice. The purpose of this report is to highlight the
risks posed by some utilities’ business model because governments and other investors may want to have a better
understanding of these risks.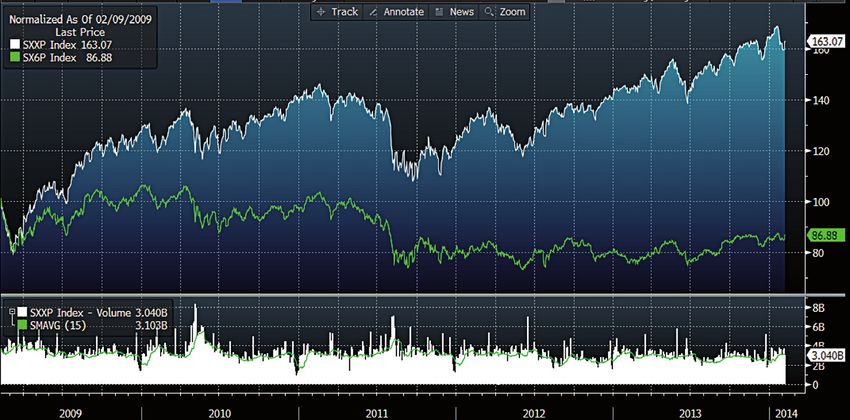
EXECUTIVE SUMMARY

  EXECUTIVE SUMMARY

  Large energy companies continue to dominate,                                                   Fast-changing environment
  for now
                                                                                                 Large utilities have made a poor show recently of adapting either to
  The 10 largest energy utilities produce more than half of Europe’s                             government policies or to external market developments. For many
  power. Despite the financial crisis and momentous changes in                                   years, they have been facing policy challenges, including market
  European electricity markets, they more than doubled their revenues                            deregulation; nuclear phase-outs; support for renewable energy;
  between 2002 and 2012 and significantly increased their earnings.                              and stricter regulations related to air pollution and CO2 emissions.
  Until recently, they also have been generally doing better than their                          They have also been confronted with slowing demand; gas and
  US peers.                                                                                      coal market shifts; and the emergence of viable renewable energy
                                                                                                 generation by private individuals at the local level (distributed
  But after decades of growth and profitability, the past few years
                                                                                                 generation).
  have impacted their earnings substantially. Ironically, it is their power
  generation business – traditionally a gold-mine – that is pulling them                         Sticking to their old business model, it seems, is not working. For
  down. Since 2008, these top utilities have lost half of their €1tn                             example, with the emergence of distributed generation they face
  share value1 and seem unable to make a comeback, unlike most                                   selling steadily less electricity at ever lower prices, while their
  other industries2. This poor performance has also hurt some of their                           costs keep increasing. As the large utilities’ fossil and nuclear
  largest shareholders: European governments.                                                    plants become more expensive and alternatives become cheaper,
                                                                                                 savvy consumers are looking to decrease their dependence on the
                                                                                                 utilities’ power supply. To cope, the utilities are trying to decouple
                                                                                                 their increasing costs from the amount of electricity they sell, further
                                                                                                 increasing the cost advantages of renewables and other alternatives.
                                                                                                 Renewables, with zero-marginal-costs, helped push down wholesale
                                                                                                 prices to 8-year lows in 2013.

  1 THE ECONOMIST: EUROPEAN UTILITIES: HOW TO LOSE HALF A TRILLION EUROS. EUROPE’S ELECTRICITY
                                                                                                 Combine this with lower electricity demand and the over-capacity
  PROVIDERS FACE EN EXISTENTIAL THREAT. 12 OCTOBER 2013: HTTP://ECON.ST/1CYIVEV                  in electricity production and you have utilities with lower earnings
  2 SEE THE DISAPPOINTING PERFORMANCE OF THE STOXX EUROPE 600 UTILITIES INDEX HERE: HTTP://
  WWW.STOXX.COM/INDICES/INDEX_INFORMATION.HTML?SYMBOL=SX6P                                       and lower credit ratings that make access to funding more difficult.

3 LOCKED IN THE PAST WHY EUROPE’S BIG ENERGY COMPANIES FEAR CHANGE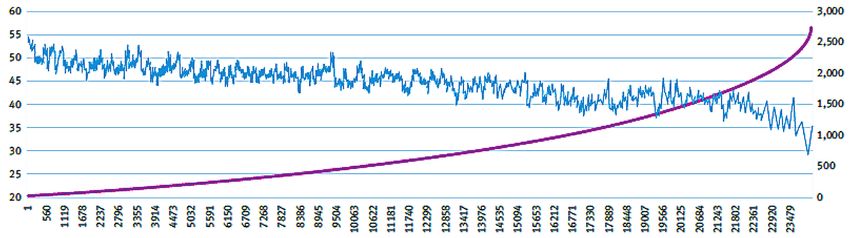
EXECUTIVE SUMMARY

  Most energy companies have already been downgraded by credit                 Short-term firefighting does not make up for
  rating agencies and have seen their bond yields grow. As a result,           lack of strategic adaptability
  the utilities’ profits are falling, their share prices are underperforming
                                                                               Now, facing the consequences of their mistaken asset-allocation
  and business outlooks are getting gloomier. For example, Enel made
                                                                               decisions, utilities are reaching for the usual remedies, including
  more than €3bn on its generation and trading business every year
                                                                               intense lobbying for fossil subsidies (e.g. capacity fees) and against
  between 2005 and 2010, but this dropped to €1.3bn in 2012. E.ON’s
                                                                               renewables (e.g. solar “backup tolls”3); cost-cuttings and massive
  earnings from power generation were down by two-thirds in the first
                                                                               layoffs; divestment programmes and lately capital expenditure
  nine months of 2013, year-on-year. Utility impairments grew to over
                                                                               cutbacks. These moves, even if successful, will not ensure
  €10bn per year in 2012, with E.ON, EdF and Vattenfall initially hit
                                                                               the companies’ long-term viability. A strategic reorientation is
  worst, followed by Enel, RWE and GdF Suez.
                                                                               unavoidable.
  However, not all utilities are affected in the same way. Those with
                                                                               History shows that aggressive lobbying tends to offer good
  less-diversified portfolios and higher shares of generation earnings
                                                                               results for utilities, but this comes at the expense of customers,
  from the EU within their total EBITDA (Earnings Before Interest,
                                                                               communities and companies that invested in renewables assets.
  Taxes, Depreciation and Amortization) are particularly vulnerable.
                                                                               Moreover, the success of anti-renewables lobbying can hurt the
  Currently, those with more gas plants are being hit hardest, but coal
                                                                               utilities themselves: Iberdrola, E.ON and Enel are estimated to have
  is not a safe bet even in the near future. The nuclear phase-out has
                                                                               made a total of €4-5bn in annual EBITDA from their renewables
  affected the German “Big Four” (RWE, E.ON, EnBW and Vattenfall)
                                                                               businesses. Draft Spanish laws to limit returns on existing
  while companies that continue to operate nuclear plants are being
                                                                               renewables assets will also hit Iberdrola significantly.
  hit by safety investments and increasing nuclear costs.
                                                                               Better strategic responses start to emerge
                                                                               Not all utilities have reacted in the same way. Some smaller
  Failure to adapt
                                                                               companies have responded quickly and positively to political and
  Large EU utilities have had a long grace period to prepare for the           market changes. For example, Dong Energy and EDP have built up
  challenges they face. Market deregulation started in the early 1990s,        more balanced portfolios which include higher shares of renewables.
  when demand growth began to slow. It has fallen significantly                 Their renewable assets are making more profits than their thermal
  during the past 5 years. The decision to phase out nuclear power in          ones.
  Germany was originally made in 2000. Air pollution regulation and
                                                                               Some utilities have started to reconsider their adaptability by
  renewable support systems started even earlier. Now that many of
                                                                               increasing the flexibility of their power generation portfolios. They
  these changes have combined and are aggravated by high gas prices
                                                                               are building up renewables portfolios, offering innovative services for
  and a prolonged financial crisis, it has become clear that utilities are
                                                                               the newly emerged private producers/consumers of energy (known
  ill-prepared to adapt.
                                                                               as “prosumers”) and starting to invest in storage capacities, among
  Utilities have invested large amounts during the past decade and             other measures.
  even doubled their capital expenditures after the financial crisis.
  But instead of using these resources to fund a genuine change
  of business model, they have done the opposite: they have over-              Government responsibilities
  invested in fossil fuel capacities, thereby missing a chance to build
                                                                               Governments must send energy companies clear and unequivocal
  up controlling stakes in renewables.
                                                                               signals in order to direct them towards new economically and
  Despite slowing and then falling demand, and despite over-capacity,          environmentally sustainable business models consistent with
  energy companies have added around 85 gigawatts (GW) of fossil               agreed policies on energy, climate change, air pollution, nuclear
  fuel capacity to their European portfolios during the past decade.           safety and other relevant areas. Governments should not offer
  Now, they are building at least 20 GW more, although, during the             utilities temporary relief mechanisms or unsustainable fossil and
  2000s, EU peak demand (EU-27) actually fell. In fact, analysts say           nuclear subsidies that undermine the strategic reorientation of
  over-capacity from thermal power stations (based on fossil fuels and         energy companies. Governments should also learn not to rely almost
  nuclear energy) is so high that Europe’s utilities need to shut down         exclusively on a handful of utilities when millions of Europeans are
  about 50 GW of their total fossil power capacity by 2017 if they want        becoming energy prosumers.
  to maintain even their diminished 2012 profit levels.
  In Europe the top 10 utilities produce only 4% of their power from
  non-hydro renewables, but they often make €1-2bn in annual
  EBITDA, mostly from wind. The “Big Four” in Germany dominate
  production with around a 70% market share, but control only 5-6%
  of the country’s wind and solar capacity. J.P. Morgan estimated the
  value of E.ON’s renewables business to be much larger than its
                                                                               3 ACCORDING TO NEW DRAFT SPANISH RULES, PEOPLE WHO PRODUCE THEIR OWN POWER MUST PAY A
  conventional generation business.                                            “BACKUP TOLL” JUST TO REMAIN CONNECTED TO THE GRID.

4 LOCKED IN THE PAST WHY EUROPE’S BIG ENERGY COMPANIES FEAR CHANGE
1. INTRODUCTION

  1. INTRODUCTION

  Europe’s top 10 energy companies have seen their business                                 Large utilities have had many years to prepare for and adapt to these
  environments change fundamentally since the mid-1990s. These                              changes. Instead, mostly they have fought to reverse change through
  changes have largely been driven by European Union (EU) policies,                         aggressive lobbying. What so far they have called “adaptation” has
  such as legislation on deregulation, air pollution, renewables and                        consisted of using their market dominance to consolidate control, cut
  climate change. Some countries, such as Germany and Belgium,                              costs, diversify, and overbuild their capacities. Utilities have aimed
  have also decided to phase out nuclear power generation. Key                              to maintain their inflexible business models based on large-scale
  external changes also include significant improvements in renewable                       centralised fossil and nuclear power generation, and failed to shift
  energy technologies, the US shale gas boom and the financial and                          towards in a meaningful manner. Even today, renewable energy,
  economic crisis. Another key underlying trend is the slow-down of                         for example, represents only a fraction of their power generation
  demand growth, which already started in the 1990s and since 2008                          businesses.
  has decreased rapidly.
                                                                                            This briefing shows that, by failing to genuinely adapt to changed
  These changes started slowly, but combined they have become                               conditions, energy companies have been the architects of their
  faster, more profound and have had substantial consequences.                              own demise. As challenges around them have become almost
  Genuine adaptation has become a must for EU utilities. As Reuters                         overwhelming, large power utilities have no alternative to a genuine
  puts it: “Every new solar panel installed on European rooftops chips                      strategic re-orientation. European governments – often themselves
  away at power utilities’ centralised production model. Unless they                        large shareholders of these utilities – have the responsibility
  reinvent themselves soon, these giants risk becoming the dinosaurs                        to shepherd energy companies towards new economically and
  of the energy market.”1                                                                   environmentally sustainable business models.

  1 G. DE CLERCQ: ANALYSIS: RENEWABLES TURN UTILITIES INTO DINOSAURS OF THE ENERGY WORLD,
  REUTERS, 8 MARCH 2013: HTTP://REUT.RS/19YKRBZ

5 LOCKED IN THE PAST WHY EUROPE’S BIG ENERGY COMPANIES FEAR CHANGE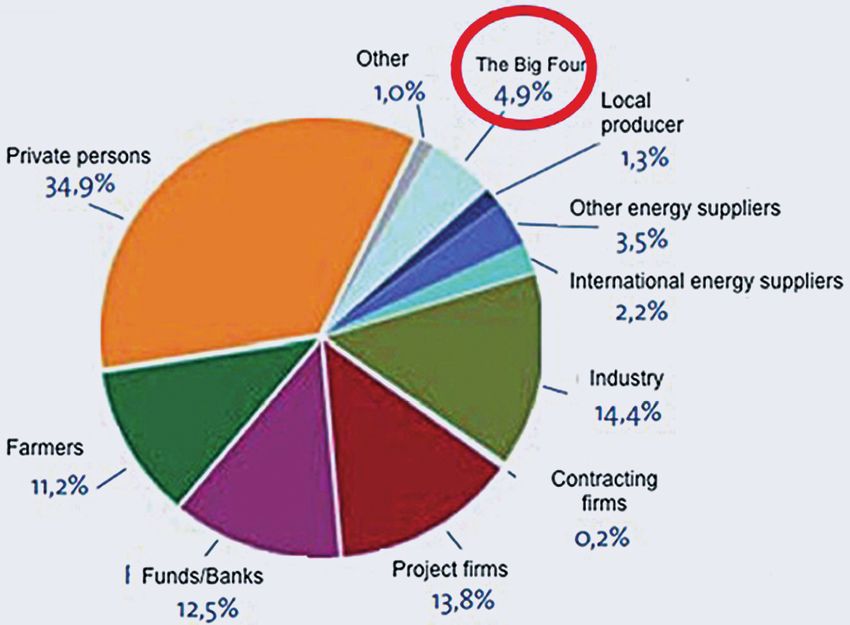
CHANGING ENVIRONMENT

  2. CHANGING ENVIRONMENT

  After many decades of fast demand growth and monopolistic               Slowing demand
  structures, substantial changes to electricity markets emerged in
                                                                          Total and peak electricity demand in the European Union started
  the 1990s. These changes began slowly, giving utilities ample time
                                                                          to slow in the 1990s, and have been falling since 2007 (with the
  to prepare, but utilities mostly used the long grace period to resist
                                                                          exception of in 2009). Total demand in the EU-27 fell by around
  change instead of adapting to it.
                                                                          2.5% from 2007 to 20121. Demand also fell in several large national
                                                                          markets: by 7.5% in the UK, 4.3% in Italy, 3.4% in Spain and 3.2%
  Two decades of change combining into a                                  in Germany2. In the first 11 months of 2013, demand fell by a further
  paradigm shift                                                          2.6% in Spain and 3.5% in Italy (where Enel, the country’s major
                                                                          electricity producer, reported an even larger drop in its nine-month
  European electricity markets have been evolving significantly for        report3); in the first nine months of 2013, demand in Germany fell by
  almost two decades. Changes shifting the energy sector paradigm         1.1%4.
  include: slowing demand; the emergence of low-to-zero marginal
  cost renewables; the move from centralised to distributed power         In some major markets, including Germany and the UK, demand
  production; market deregulation; and nuclear phase-outs. Early on,      is expected to decline even further; even the industry-lobby group
  these changes were gradual, but recently they have accelerated,         Eurelectric5 is forecasting this. Meanwhile, the registered decrease
  causing decreased market (and through fast and radical policy           in demand has been coupled with a significant increase in both
  changes even reduced regulatory) predictability.                        renewable and fossil installed capacity, resulting in substantial over-
                                                                          capacities in several countries. Europe today has about twice as
  Combined, these individual changes strengthen one other. For            much installed generation capacity as peak demand would warrant.
  example, while utilities have successfully constrained competition,
  renewable technologies have now developed to a point where they         Reserve margins also are sufficient across the EU, and there is no
  help intensify competition by reducing market-entry barriers for        strong suggestion of the system experiencing even medium-term
  millions of new producers and by bringing low-to-zero marginal cost     stress to meet prospective overall peak demand6. Low spot and
  capacities to the market. The reverse is also evident: unbundling is    futures wholesale prices across Europe (with Italy as an anomaly)
  helping to create more favourable conditions for the emergence of
  new large-scale renewable players.                                      1 DEMAND FELL FROM 3.161 TWH IN 2007 TO 3.082 TWH IN 2012. EURELECTRIC: HTTP://WWW.
                                                                          EURELECTRIC.ORG/POWERSTATS2013/
                                                                          2 EURELECTRIC: POWER STATISTICS & TRENDS 2013 AND EARLIER EDITIONS: HTTP://WWW.EURELECTRIC.
                                                                          ORG/POWERSTATS2013/
                                                                          3 ENEL: 9M 2013 RESULTS, 7 NOVEMBER 2013: HTTP://BIT.LY/1D4CE90
                                                                          4 PLATTS: POWER IN EUROPE, DIFFERENT ISSUES FROM OCTOBER 2013 TO JANUARY 2014.
                                                                          5 EUROELECTRIC “REPRESENTS THE COMMON INTERESTS OF THE ELECTRICITY INDUSTRY AT PAN-
                                                                          EUROPEAN LEVELS”: HTTP://WWW.EURELECTRIC.ORG/ABOUT-US/OUR-MEMBERS/
                                                                          6 INVESTEC: EUROPEAN POWER UTILITIES: SECTOR REVIEW, 21 JANUARY 2013

6 LOCKED IN THE PAST WHY EUROPE’S BIG ENERGY COMPANIES FEAR CHANGE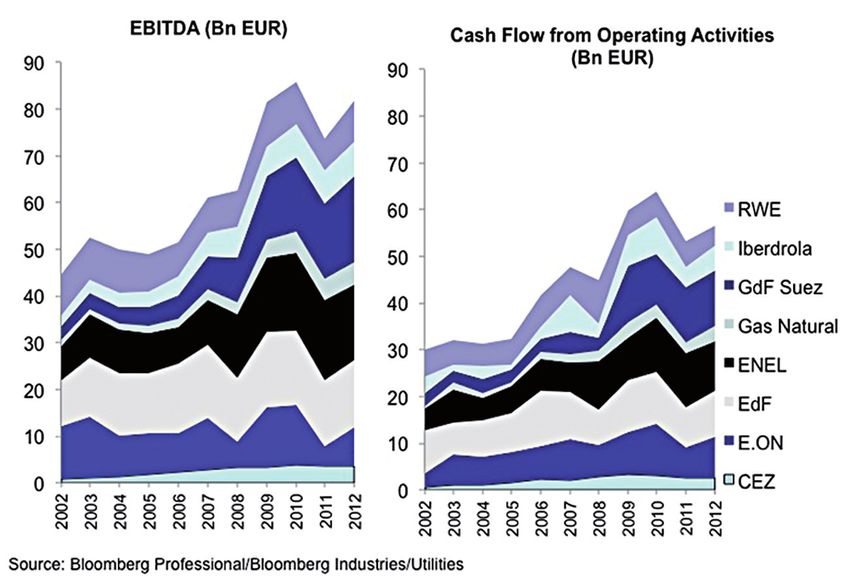
CHANGING ENVIRONMENT

  also confirm this. ENTSO-E7 has estimated spare capacity at over 100                        Resisting deregulation and decrying emerging
  GW to meet demand and reserves for the 2013/14 winter. In most                             renewables
  markets, the real challenge is actually managing excess capacity and
                                                                                             Over the past two decades, large EU utilities focused on slowing
  output (e.g. in Italy and Spain).8
                                                                                             the liberalisation process and lobbied hard to avoid having their
                                                                                             monopolistic networks unbundled from their generation and trade
  Deregulation, renewables, nuclear phase-                                                   businesses. Up until now, utilities have been successful at keeping
  out: policy decisions drive many changes on                                                customer-switching rates low, and most succeeded in avoiding
  electricity markets                                                                        effective unbundling and truly fair and transparent third-party access
                                                                                             to their grids despite additional EU regulatory packages in 2003 and
  Market deregulation within Europe started in around 1990, first                             2009. Most large energy companies could stay integrated, and in
  in the UK and in the Nordic countries, and reached an important                            some countries, such as Poland, they could even reintegrate after
  turning point with the 1996 Electricity Market Directive. The EU’s                         initial unbundling steps.
  liberalisation agenda has created enhanced competition, introduced
  new market participants and increased cross-border electricity                             From the outset, large EU utilities have decried renewable energy
  trading.                                                                                   and lobbied against any support systems for emerging renewable
                                                                                             technologies. Hypocritically, they have fought subsidies for
  As renewable electricity started to emerge decades ago, with some                          renewables despite still being reliant on nuclear subsidies themselves
  national incentive programmes dating back to the 1980s, the EU also                        – even after 50 years since the first commercial reactors came
  introduced policies to promote these technologies and mitigate the                         online. For a long time, the large EU utilities did not invest substantial
  climate impacts of Europe’s power generation. In 2008, it adopted its                      resources in developing their own renewable businesses, apart from
  climate and energy package, including a revised Renewable Energy                           Iberdrola, which took a more balanced but cynical approach: Although
  Directive aiming for a 20% share of renewables in final energy                              it is the world’s largest wind power owner, for years it has been
  consumption by 2020. EU countries subsequently set up support                              leading the smear campaign against renewables, especially solar
  schemes for renewable power generation. Through these measures,                            energy, in Spain and now seems to be successfully destroying billions
  which are backed up by broad public support, EU wind capacity grew                         of solar investments, often those of its customers – and in the case of
  from around 1 GW in mid-1993 to around 117 GW in 20139. Solar PV                           wind, even its own (see box in 3.2.).
  capacity grew from 2 GW in 2005 to more than 70 GW in 201210.
  Additionally, several countries also announced decisions to phase out
  nuclear power. In Germany, nuclear power generation should stop by                         Failure to adapt
  January 2023 and in Belgium by September 2025. In France, where                            Large European utilities have had many years to prepare and adapt
  nuclear power is the primary source of energy, the government has                          to these and other changes. Instead, mostly they have fought against
  announced a steep reduction of the nuclear share in national power                         them.
  generation, from 75% now (the highest in the world) to 50%.
                                                                                             The examples of the airline and telecommunications industries from
  The strong policy signals weakened, however, during the economic                           the 1970s also offer useful lessons for utilities – as is shared in a
  crisis as several countries, including in Spain, Italy, Germany and the                    report11 by the Edison Electric Institute,12 a US association of the
  UK, where support for renewable was significantly reduced. A switch                         electric utilities. Both capital-intensive industries experienced very
  from coal- to gas-based power generation in the US led to a decline                        significant landscape shifts within a few years after deregulation and
  in the European price for coal, whilst the EU’s failure to sustain                         technology changes. In the airline industry, each major US carrier
  the carbon price under its Emission Trading Scheme (ETS) further                           filed for bankruptcy following the 1978 deregulation. Nothing about
  reduced the incentives for utilities to shift from polluting to clean                      the telecommunications industry of 1978 is recognizable today.
  power generation.

  7 ENTSO-E: THE EUROPEAN NETWORK OF TRANSMISSION SYSTEM OPERATORS FOR ELECTRICITY:
  HTTPS://WWW.ENTSOE.EU/
  8 PLATTS: 100 GW SPARE THIS WINTER: ENTSO-E, POWER IN EUROPE, ISSUE 665, 9 DECEMBER 2013
  9 EUROPEAN WIND ENERGY ASSOCIATION: WIND IN POWER, 2013 EUROPEAN STATISTICS, FEBRUARY
  2014: HTTP://BIT.LY/1GPKYWM                                                                11 P. KIND: DISRUPTIVE CHALLENGES: FINANCIAL IMPLICATIONS AND STRATEGIC RESPONSES TO A
  10 EUROPEAN PHOTOVOLTAIC INDUSTRY ASSOCIATION: GLOBAL MARKET OUTLOOK FOR PHOTOVOLTAICS     CHANGING RETAIL ELECTRIC BUSINESS, EDISON ELECTRIC INSTITUTE, JANUARY 2013
  2013-2017: HTTP://BIT.LY/1DMEHPI                                                           12 EDISON ELECTRIC INSTITUTE: HTTP://WWW.EEI.ORG/PAGES/DEFAULT.ASPX

7 LOCKED IN THE PAST WHY EUROPE’S BIG ENERGY COMPANIES FEAR CHANGE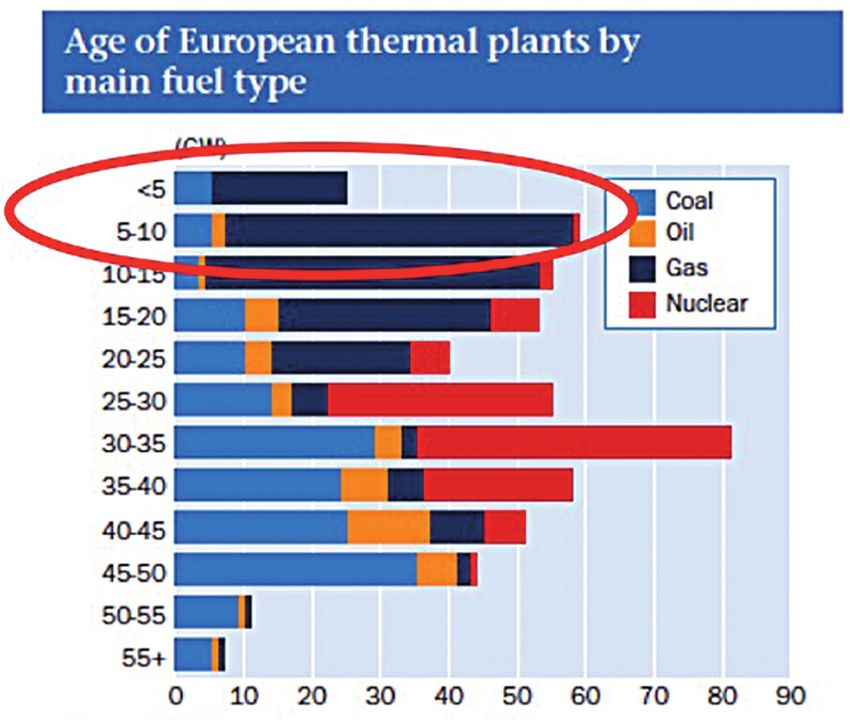
THE “DINOSAURS” STILL DOMINATE, FOR NOW

  3. THE “DINOSAURS”
  STILL DOMINATE, FOR NOW

  Until recently, and despite the financial crisis and massive changes                    Size
  in European electricity markets, the largest utilities have been able
                                                                                         The 10 largest utilities dominate EU electricity markets and most
  to maintain their market dominance, to increase their size and,
                                                                                         individual national markets. They produce more than half of Europe’s
  until 2012, even improve their results. From 2002 up to 2012, their
                                                                                         total power14.
  revenues grew substantially; their EBITDA13 and Operating Cash
  Flows nearly doubled.                                                                  Top EU utilities have higher market shares than top US utilities do,
                                                                                         and are generally larger (by market capital, sales, assets, number
                                                                                         of employees, etc.). For instance, the largest US utility has annual
                                                                                         revenues similar to those of the ninth or tenth largest European
                                                                                         utilities (in $ terms). While at least six EU utilities have above $100bn
                                                                                         in assets on their books, in the US only Duke Energy does (see
                                                                                         Bloomberg Utility Leaderboard15).

  Table 1: Shares in power generation by the 10 largest EU utilities

   2012 Share                 EdF           RWE            E.ON           Enel   GdF Suez Vattenfall        Iberdrola          CEZ           EnBW             PGE           Others
   in EU power
   generation               20.0%           7.4%           6.2%           5.9%    5.4%         5.3%           2.5%            2.2%            1.9%            1.9%          41.3%

                                                                                         14 ONLY COMPANY PRODUCTION WITHIN THE EU BASED ON COMPANY REPORTS, ANALYST PACKS, DATA
                                                                                         TOOLS, ETC. THE FIGURES FOR TOTAL PRODUCTION WITHIN THE EU WERE DERIVED FROM: EUROPEAN
                                                                                         COMMISSION, EUROSTAT, “ELECTRICITY PRODUCTION AND SUPPLY STATISTICS, EXCEL-SHEET”: HTTP://BIT.
                                                                                         LY/1I9Y7QM
                                                                                         15 BLOOMBERG INDUSTRY LEADERBOARD: UTILITIES. HTTP://BLOOM.BG/1GTASP4, ACCESSED IN
  13 EBITDA = EARNINGS BEFORE INTEREST, TAXES, DEPRECIATION AND AMORTISATION             DECEMBER 2013

8 LOCKED IN THE PAST WHY EUROPE’S BIG ENERGY COMPANIES FEAR CHANGE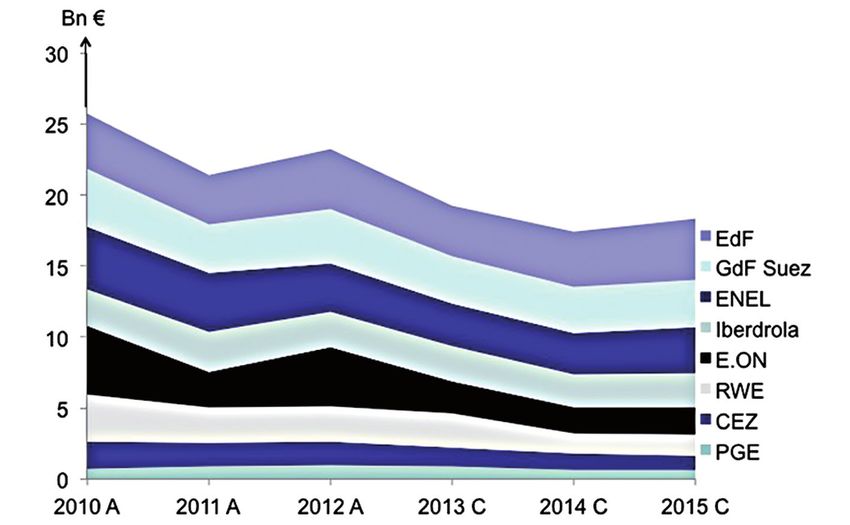
THE “DINOSAURS” STILL DOMINATE, FOR NOW

  Revenues                                                                                      Figure 1: EU utilities with strong EBIDTA and
  In terms of sales growth, European utilities have significantly                                operating cash flows
  outperformed US utilities. According to Bloomberg, all large European
  utilities grew their revenues during the past 12 months, while six
  out of 10 large US utilities shrank. The top eight European utilities
  produced strong revenue growth during the whole past decade as
  well. Their combined revenue (in 2002 at €270bn) grew dynamically
  until 2008 (€532bn), and – after a small glitch in 2009 – further to
  €698bn in 201216. Each of the giants grew their revenues partly as a
  consequence of the integration of their acquired businesses, but most
  M&A activities happened in the earlier part of the past decade17.

                                                                                                Earnings
                                                                                                Until 2012, European utilities generated significant earnings. Annual
                                                                                                EBITDA for the eight largest EU utilities was around €50bn annually
                                                                                                a decade ago and mostly above €80bn since 2007. According to the
                                                                                                Bloomberg Leaderboard, even recently they were on par with the
                                                                                                large US utilities in terms of return on asset and return on invested
                                                                                                capital, and showed a better performance in return on equity.
                                                                                                Their Cash Flow from Operations grew from a typical annual €30bn
                                                                                                level a decade ago to around €50bn in 2008–2012. EdF, E.ON,
                                                                                                GdF Suez, RWE, Enel, Iberdrola, Gas Natural and CEZ have all seen
                                                                                                both their EBITDA and Operating Cash Flows grow during the past
                                                                                                decade18. The following chart shows the significant growth in EBITDA
                                                                                                and Operating Cash Flow even after the financial crisis.

  16 BLOOMBERG PROFESSIONAL. BLOOMBERG INDUSTRIES – UTILITIES – POWER GENERATION EUROPE (BI
  EGENE) - PROFITABILITY, ACCESSED IN JAN, 2014
  17 THE LARGEST ACQUISITION WAVE WAS HAPPENING AROUND 2000 UP TO 2007, E.G. EDF ACQUIRED
  ENBW, VIVENDI ENERGY, LONDON ELECTRICITY, EOS, ETC; E.ON POWERGEN, RUHRGAS, ZCE, SYDRAFT,
  HEINGAS, ETC; RWE ACQUIRED SE, THYSSENGAS, INNOGY, THAMES WATER; VEW AND MANY OTHERS. THE
  MOST IMPORTANT TRANSACTIONS SINCE 2008 INCLUDE THAT YEAR’S TAKEOVER OF BRITISH ENERGY BY
  EDF, THE 2009 TAKEOVER OF NUON BY VATTENFALL AND OF ESSENT BY RWE, AND THE 2011 TAKEOVER OF   18 BLOOMBERG PROFESSIONAL. BLOOMBERG INDUSTRIES – UTILITIES - POWER GENERATION EUROPE (BI
  INTERNATIONAL POWER BY GDF SUEZ                                                               EGENE) - PROFITABILITY, ACCESSED IN DEC, 2013

9 LOCKED IN THE PAST WHY EUROPE’S BIG ENERGY COMPANIES FEAR CHANGE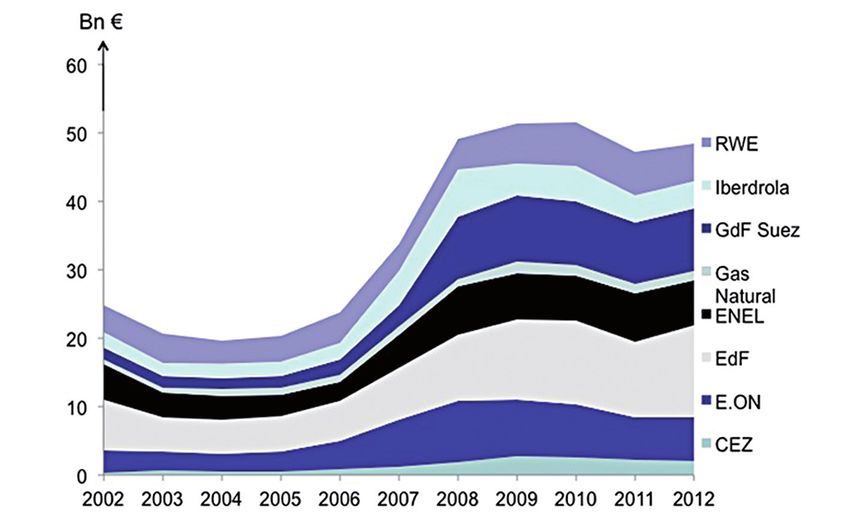
FAILURE TO ADAPT

   4. FAILURE TO ADAPT

   Favourable financials and easy access to funding have lulled utilities                     Figure 2: Fossil capacities grew by 85 GW in the
   into a false sense of security. They have failed to use the past two                      last 10 years
   decades to prepare for a shift in their core markets. In fact, they have
   made things worse by building up massive additional coal and gas
   capacities, and letting others control the majority of the 200 GW of
   wind and solar capacity in Europe today.

   4.1. OVER-INVESTMENT IN
   OBSOLETE FOSSIL ASSETS
   Large capacity growth during the past decade
   According to Platts (please see chart below), fossil capacities grew
   by around 85 GW in Europe during the past 10 years (2003-2013)1.
   Additionally, as of May 2013, Platts estimated that 8.7 GW of gas-
   fired and 11.9 GW of coal-fired capacity was being built in West
   Europe only along with 19 GW of other capacities, mostly renewables
   – and substantial additional capacities are also permitted2.                              SOURCE: PLATTS POWERVISION, DECEMBER 2013

   1 PLATTS POWER PLANTS DATABASE, ACCESSED DECEMBER 2013
   2 PLATTS POWER GENERATION TRACKER: WEST EUROPE’S 20 GIGAWATTS NEW CAPACITY, 7 MAY 2013:
   HTTP://BIT.LY/1KOBFZE

10 LOCKED IN THE PAST WHY EUROPE’S BIG ENERGY COMPANIES FEAR CHANGE
FAILURE TO ADAPT

   Over-capacities, low demand                                                                     Capacities grew so large, that – according to UBS – 49 GW of coal,
                                                                                                   gas & oil plants would need to close by 2017 to maintain 2012
   This large addition in capacity happened in a market characterised                              profit levels6 This also includes 24 GW of ‘mainly cash-flow positive
   by: already substantial over-capacities; demand that will be lower                              capacity’ on top of the 7 GW that utilities already plan to shut and an
   in 2020 than in 20101; significant growth in renewable capacities;                               additional 18 GW of closures expected to be announced.
   plant emission rules that are getting stricter2; and a carbon allowance
   market that may be bottoming out3.                                                              The following boxes show case studies from five countries (Germany,
                                                                                                   the Netherlands, Italy, Spain and Poland) demonstrating the large new
   As The Economist4 weekly summarised it: “During the 2000s,                                      coal and gas capacities that have been built recently or which are
   European utilities overinvested in generating capacity from fossil                              under now construction.
   fuels, boosting it by 16% in Europe as a whole and by more in some
   countries (up 91% in Spain, for example). The market for electricity
                                                                                                   6 R. MOSISON: UTILITIES NEED TO CLOSE 30% OF EUROPEAN POWER PLANTS, UBS SAYS, BLOOMBERG, 7
   did not grow by nearly that amount, even in good times; then the                                MARCH 2013: HTTP://BLOOM.BG/1A0XPNW
   financial crisis hit demand. According to the International Energy
   Agency, total energy demand in Europe will decline by 2% between
   2010 and 2015.”
   Eurelectric statistics5 show that between 2000 and 2010 the peak
   demand of the EU-27 fell from 460 GW to 440 GW, while fossil
   capacity grew by 69 GW and zero-to-low marginal cost renewable
   capacity by 98 GW. As the following chart shows, between 1990
   and 2010, 124 GW of capacity growth came from fossil and 116 GW
                                                                                                   Case study: Germany: large new and restored
   capacity growth from non-hydro renewable power plants.
                                                                                                   coal generation capacities

   Figure 3: Substantial fossil capacity additions                                                 The map below shows a few selected coal power plants in Germany
   beyond renewables (installed cypacity in GW)                                                    that have been commissioned or restored recently. In the past few
                                                                                                   years, Vattenfall, E.ON, RWE and others have built large new coal
                                                                                                   power plants. Approximately 20 coal and lignite blocks have also
                                                                                                   been rehabilitated. The map is not comprehensive, but it shows more
                                                                                                   than 15 GW of new or restored coal/lignite capacities created during
                                                                                                   the past six to seven years, signalling massive investments in assets
                                                                                                   that may become obsolete.
                                                                                                   Substantial new gas capacities have also been built, e.g. Platts
                                                                                                   reported in October 2013 that there were more than 30 gas
                                                                                                   units under development, with 9 GW in total capacity1. The
                                                                                                   Bundesnetzagentur listed a 10.9 GW thermal plant as scheduled
                                                                                                   for construction before 2016 and 9.9 GW of decomissionings were
                                                                                                   planned by 2018. So thermal capacities still would show a net
                                                                                                   increase2,3.
   SOURCE: EURELECTIC POWER STATISTICS
                                                                                                   These new additions came and are coming online at a time when
                                                                                                   investors could lose €140mn on a single 750 MW coal plant
   1 T, ANDERSEN: GERMAN UTILITIES HAMMERED IN MARKET FAVOURING RENEWABLE. BLOOMBERG, 12           annually, according to the owner of the €1.4bn Lünen plant that
   AUGUST 2013. HTTP://BLOOM.BG/1IYAXIT                                                            started commercial operation in December 20134. The CEO of E.ON
   2 EUROPEAN COMMISSION: INDUSTRIAL EMISSIONS: HTTP://EC.EUROPA.EU/ENVIRONMENT/AIR/
   POLLUTANTS/STATIONARY/                                                                          summarised, “when you invest in new generation, you can write it off
   3 “THE COST OF EMITTING CARBON DIOXIDE WILL JUMP TO €7.75 ($10.54) A METRIC TON BY THE END OF   the day you start”5. Still new plants are commissioned one after the
   THE YEAR, FROM TODAY’S CLOSE
   OF €4.65, ACCORDING TO THE MEDIAN OF NINE ANALYST AND TRADER ESTIMATES COMPILED BY              other, with the potential of being closed down after only a few years
   BLOOMBERG NEWS.” IN E. KRUKOWSKA AND M. CARR: POLLUTION COSTS TO RISE AS EU BACKS MARKET
   FIX, BLOOMBERG NEWS, 8 JANUARY 2014                                                             of operation6, or production is delayed, as in the case of Statkraft’s
   4 THE ECONOMIST: EUROPEAN UTILITIES: HOW TO LOSE HALF A TRILLION EUROS. EUROPE’S ELECTRICITY    new CCGT in Hürth7.
   PROVIDERS FACE EN EXISTENTIAL THREAT. 12 OCTOBER 2013: HTTP://ECON.ST/1CYIVEV
   5 EUROELECTRIC POWER STATISTICS & TRENDS: HTTP://WWW.EURELECTRIC.ORG/POWERSTATS2013/
                                                                                                   1 PLATTS: SMALL GAS UNIT PROLIFERATE IN GERMANY, POWER IN EUROPE, ISSUE 662. 28 OCTOBER
                                                                                                   2013.
                                                                                                   2 PLATTS: BNA: 1 GW NET ADDS TO 2018, POWER IN EUROPE, ISSUE 663, 11 NOVEMBER 2013.
                                                                                                   3 BUNDESNETZAGENTUR – BUNDESKARTELLAMT: MONITORINGBERICHT 2013: HTTP://WWW.
                                                                                                   BUNDESKARTELLAMT.DE/SHAREDDOCS/PUBLIKATION/DE/BERICHTE/ENERGIE-MONITORING-2013.PDF?__
                                                                                                   BLOB=PUBLICATIONFILE&V=6
                                                                                                   4 FULDAER NACHRICHTEN: ÜWAFÜKOHLEKRAFTWERK LÜNEN RECHNET MIT 140 MILLIONEN EURO
                                                                                                   VERLUST JAHRLICH, 27 APRIL 2013: HTTP://WWW.FULDAER-NACHRICHTEN.DE/?P=108401
                                                                                                   5 HIGH-LEVEL STAKEHOLDER CONFERENCE ON THE ENERGY ROADMAP 2050: HTTP://BIT.LY/1BIXCSZ
                                                                                                   6 S. PATEL: EUROPE’S GAS POWER PLANT CARNAGE INTENSIFIES, 22 AUGUST 2013, POWERMAG: HTTP://
                                                                                                   BIT.LY/K0OOGB
                                                                                                   7 KÖLNER STADT ANZEIGER: NEUES KRAFTWERK PRODUZIERT NOCH NICHT, 13 JUNE 2013: HTTP://BIT.
                                                                                                   LY/1ICA29V

11 LOCKED IN THE PAST WHY EUROPE’S BIG ENERGY COMPANIES FEAR CHANGE
FAILURE TO ADAPT
Utilities actively lobby to avoid such massive losses, and authorities Map 1: Coal plants built (black)/renovated (yelow)
tend to bow to their demands. In 2010, E.ON completed Irsching-5 or under construction in Germany since 2007
for €400mn but just three years later was threatening to close it
down due to low usage8. In the end, E.ON forced a compensation deal
with the Bundesnetzagentur and TenneT9 to keep it online for tens of
millions of Euros annually10. For now, customers are compensating
E.ON for an uneconomic investment.
Bremenhaven 5 (830 MW, 2014)
Wilhelmshaven (830 MW, 2014) Moorburg (1640MW, 2014?)
Farge (397 MW, 2007)
8 T. ANDRESEN AND T. PATEL: EUROPE GAS CARNAGE SHOWN BY E.ON CLOSING 3-YEAR-OLD PLANT,
BLOOMBERG, 12 MARCH 2013: HTTP://BLOOM.BG/1GN2GJB
9 TENNET IS ELECTRICITY TRANSMISSION OPERATOR OF MOST OF GERMANY AND THE NETHERLANDS.
HTTP://WWW.TENNET.EU/NL/HOME.HTML
10 STERN: ENIGUNG VON EON UND NETZBETREIBER TENNET: GASKRAFTWERK IRSCHING BLEIBT DOCH AM Ibbenbüren
NETZ, 26 APRIL 2013: HTTP://BIT.LY/1LCNZXB (838 MW, 2009) Braunschweig Mitte (183 MW, 2011)
Lünen (750 MW, 2013)
Gelsenkirchen Scholven D (370 MW, 2009) Hamm (1500 MW, 2014)
Duisburg-Walsum (790 MW, 2010) Datteln 4 (1055 MW, ?)
Boxberg R (675 MW, 2012)
Grevenbroich Neurath F (1100 MW, 2012) Niederaussem G (687 MW, 2008)
Grevenbroich Neurath G (1100 MW, 2012) Niederaussem H (687 MW, 2009) Chemnitz Nord II
(100 MW, 2010)
Mannheim-Neckarau 9 (912 MW, 2015)
Heilbronn 5 (125 MW, 2010)
Heilbronn 6 (125 MW, 2010)
Karlsruhe-Rheinhafen (910 MW, 2013) Heilbronn 7 (816 MW, 2009)
Walheim 1 (107 MW, 2011)
Altbach Deizisau 2 Zolling Leininger 5
Walheim 2 (160 MW, 2011)
(379 MW, 2012) (474 MW, 2011)
Table 2: Coal plants recently built/renovated or under construction in Germany since 2007
Plant (City) Capacity Owner Date
Bremen Hafen 5 145 MW SWB Rehabilitation: 2007
Bremen Hafen Farge 397 MW GdF Suez Rehabilitation: 2007
Niederaußem G&H 2*687 MW RWE Rehabilitation: 2008/2009
Ibbenbüren 838 MW RWE Rehabilitation: 2009
Gelsenkirchen Scholven D 370 MW E.ON Rehabilitation: 2009
Heilbronn 5&6&7 2*125 MW + 816 MW EnBW Rehabilitation: 2009/2010
Chemintz Nord II 100 MW Eins Energie Rehabilitation: 2010
Walheim 1 & 2 107 MW + 160 MW EnBW Rehabilitation: 2011
Zolling Leninger 5 474 MW GdF Suez Rehabilitation: 2011
Altbach Deizisau 2 379 MW EnBW Rehabilitation: 2012
Boxberg R 675 MW Vattenfall Commissioning: 2012
Neurath BoA 2&3 2*1100 MW RWE Commissioning: 2012
Westfalen D&E (Hamm-Uentrop) 2*800 MW RWE + kommunale Partner Commissioning: 2013/2014
Walsum 10 (Duisburg) 790 MW Evonik Steag, EVN Commissioning: 2013
Lünen 750 MW Trianel Commissioning: 2013
RDK 8 (Karlsruhe-Rheinhafen) 912 MW EnBW Commissioning: 2013
Datteln 4 1100 MW E.ON Commissioning: 2014
Wilhelmshaven 800 MW GdF Suez-BkW FMB Commissioning: 2014
Moorburg 1&2 (Hamburg) 2*820 MW Vattenfall Commissioning: 2014
Mannheim GKM9 (Mannheim-Neckarau) 900 MW GKM Commissioning: 2015
12 LOCKED IN THE PAST WHY EUROPE’S BIG ENERGY COMPANIES FEAR CHANGEFAILURE TO ADAPT
Case study: The Netherlands: over 10 GW of new According to PwC3, total capacity (including wind and connections
coal and gas plants since 2009 with neighbouring countries) is expected to reach 55 GW in 2020,
while Dutch peak demand is estimated to be just over 20 GW that
The power plant building fever reached the Netherlands as well: RWE, year. Even when corrected for the lower load factors of wind energy,
Vattenfall, GdF Suez, E.ON, EdF, Eneco and others have completed/are total capacity would still reach 47 GW.
completing at least 10 GW of gas and coal-fuelled capacities since
2009. RWE (with 3 GW) and Vattenfall (with 2 GW) built the most. 3 PRICEWATERHOUSECOOPERS, REPORT “ENERGIE-NEDERLAND, FINANCIAL AND ECONOMIC IMPACT OF
A CHANGING ENERGY MARKET”, , MARCH 2013
Both continued large generation projects after acquiring local utilities,
Essent and Nuon in 2009 (€8.1bn1 and €10.3bn2, respectively). Map 2: New coal (black) and gas plants (blue)
RWE and Vattenfall have already had to acknowledge billions of commissioned in The Netherlands during the
impairment losses for these two transactions. past 5 years
Magnum Centrale Eemsmond (1311 MW, 2016) Eemshaven (1560 MW, 2013)
1 RWE, PRESS RELEASE “ESSENT AND RWE COMPLETE TRANSACTION”, ,
SEPTEMBER 2009. RWE, “REPORT ON THE FIRST THREE QUARTERS OF 2011”, ,
PAGE 47.
2 NUON, PRESS RELEASE, “NUON AND VATTENFALL JOIN FORCES TO CREATE A LEADING EUROPEAN
ENERGY COMPANY”, , FEBRUARY 2009.
Schoonebeek (140 MW, 2011)
Maximacentrale Lelystad (870 MW, 2010)
Hemweg 9 (435 MW, 2012)
Diemen 34 (435 MW, 2012)
Nieuwbouw Centrale (800 MW, 2014)
Enecogen (870 MW, 2011)
MaasStroom Energie (425 MW, 2010)
Maasvlakte (1070 MW, 2014)
Sloe Centrale (870 MW, 2009)
Clauscentrale Maasbracht C
(1304 MW, 2012)
Table 3: The Netherlands: new coal and gas plants commissioned during the past 5 years
Plant (City) Capacity Owner Commissioning Date
Sloe Centrale Gas: 870 MW Delta, EdF 2009
Maximacentrale Lelystad Gas: 870 MW GdF Suez 2010
MaasStroom Energie Gas: 425 MW Intergen 2010
Enecogen (Rotterdam) Gas: 870 MW Eneco, Dong 2011
Schoonebeek Gas: 140 MW Shell, ExxonMobil 2011
Clauscentrale Maastbracht C Gas: 1304 MW RWE/Essent 2012
Diemen 34 (Amsterdam) Gas: 435 MW Vattenfall/Nuon 2012
Henweg 9 (Amsterdam) Gas: 435 MW Vattenfall/Nuon 2012
Eemshaven Coal: 1560 MW RWE/Essent 2014
Maasvlakte Coal: 1070 MW E.ON 2014
Nieuwbouw Centrale (Rotterdam) Coal: 800 MW GdF Suez 2014
Magnum Centrale (Eemsmond) Gas: 1311 MW Vattenfall/Nuon 2013
SOURCES: PLATTS, COMPANY WEBSITES
13 LOCKED IN THE PAST WHY EUROPE’S BIG ENERGY COMPANIES FEAR CHANGEFAILURE TO ADAPT
Case study: Spain and Italy: large new capacities’ Frontera (Andalusia)2, while a few months later Endesa (Enel) applied
addition peaking somewhat earlier to build an additional 800 MW coal power plant in a nearby location.
According to Platts’ power plant database, in both in Spain and Italy In Italy between 2002 and 2012, new fossil fuelled capacity totalling
around 20-20 GW of gas/LNG fuelled power generation capacity was 23 GW was commissioned, most before 2007. Gas capacities grew
added between 2003 and 2012. especially fast, e.g. they doubled from 12 GW in 2000 to 24.4 GW
in 2009. Total installed capacity increased by nearly 60%, from 77
In Spain1 27 GW gas power generation existed in 2013, all of which GW in 2002 to 122 GW in 2011, while consumption grew by only 8%
was commissioned between 2002 and 2011. The large new fossil (from 291 TWh to 314 TWh) and peak demand by even less (from 50
capacities were hit by falling demand and growth in renewables. In to 51 GW). Demand fell significantly after the financial crisis, e.g. by
2013 electricity demand showed a third consecutive annual decline. 5.7% in 2009 alone. At the same time renewable competition grew
Renewable capacities reached 32.9 GW in 2013, and their share in significantly, e.g. between 2007 and 2012 18 GW solar PV and wind
demand reached 42.4%, up from 31.9% in 2012. While in 2008 gas capacity was added.
plants produced 95.5 TWh (32%), this fell to 42.5 TWh (14%) in 2012
and 28.9 TWh (10%) in 2013. In July 2013 Iberdrola asked for the
closure of the third unit (800 MW) in their power plant at Arcos de la
1 REE: EL SISTEMA ELÉCTRICO ESPANOL EN EL 2008: HTTP://BIT.LY/1LXYCNL ; INFORME DEL SISTEMA 2 A. M. SEVILLA: IBERDROLA SOLICITA A INDUSTRIA EL CIERRE PARCIAL DEL CICLO COMBINADO DE
ELÉCTRICO ESPANOL 2012: HTTP://BIT.LY/1ASEHY0 ARCOS, DIARIO DE SEVILLAM 27 JULY 2013: HTTP://BIT.LY/1DFPV8G
Map 3: Combined cycle gas power plants commissioned in Spain 2002 – 2011
Puentes de García Rodríguez (870 MW, 2008)
Santurce (402 MW, 2005)
Sabón (389 MW, 2008) Bahía de Bizkaia Electricidad (Vizcaya), (785 MW, 2003)
Soto de Ribera(866 MW, 2008/2010) Amorebieta (749 MW, 2005)
Arrúbal (800 MW, 2005)
Castejón 2 (Navarra), (386 MW, 2003)
Castejón 1,3 (855 MW, 2002/2008)
Castelnou Energía (798 MW, 2006)
Besós III (Barcelona), (826 MW, 2002)
Escatrón (800 MW, 2007) Puerto de Barcelona (892 MW, 2011)
Besós V (873 MW, 2011)
Tarragona (410 MW, 2003)
Tarragona Power (424 MW, 2003)
Plana del Vent (833 MW, 2007)
Aceca (765 MW, 2005/2006) Castellón (1668 MW, 2002/2008)
Sagunto (1255 MW, 2007)
Cas de Tresorer (480 MW, 2006/2010)
Son Reus (611 MW, 2005)
Cartagena-Gas Natural (1268 MW, 2006)
Escombreras (831 MW, 2005)
Cristóbal Colón (392 MW, 2006) El Fangal (1200 MW, 2006)
Palos de la Frontera (1186 MW, 2005)
Arcos de la Frontera (1600 MW, 2005) Málaga (420 MW, 2011)
Campo de Gibraltar (763 MW, 2004)
San Roque (782 MW, 2002)
Bahía de Algeciras (800 MW, 2011)
CANARY ISLANDS
Granadilla (433 MW, 2007/2011)
Barranco de Tirajana (438 MW, 2005/2009)
14 LOCKED IN THE PAST WHY EUROPE’S BIG ENERGY COMPANIES FEAR CHANGEFAILURE TO ADAPT
Table 4: Combined cycle gas power plants commissioned in Spain 2002 – 2011
Combined Cycle Power Plant Power (MW) Ownwer Commissioning date
San Roque (Cádiz) 782 Endesa, Gas Natural Fenosa 2002
Besós III (Barcelona) 826 Gas Natural Fenosa; Endesa 2002
Castejón 2 (Navarra) 386 Iberdrola 2003
Bahía de Bizkaia Electricidad (Vizcaya) 785 EVE, Iberdrola, BP 2003
Tarragona 410 E.ON 2003
Tarragona Power 424 Iberdola 2003
Campo de Gibraltar (Cádiz) 763 Gas Natural, Cepsa, 2004
Amorebieta (Vizcaya) 749 ESB, Osaka Gas 2005
Santurce (Vizcaya) 402 Iberdrola 2005
Arcos de la Frontera (Cádiz) 1600 Iberdola 2005
Palos de la Frontera (Huelva) 1186 Gas Natural Fenosa 2005
Son Reus (Mallorca) 611 Endesa 2005
Arrúbal (La Rioja) 800 CountorGlobal 2005
Escombreras (Murcia) 831 Iberdrola 2005
Aceca (Toledo) 765 Iberdrola, Gas Natural Fenosa 2005/2006
Cartagena-Gas Natural (Murcia) 1268 Gas Natural Fenosa 2006
El Fangal (Murcia) 1200 GdF Suez 2006
Cristóbal Colón (Huelva) 392 Endesa 2006
Castelnou Energía (Teruel) 798 Electrabel (GdF Suez) 2006
Plana del Vent (Tarragona) 833 Alpiq, Gas Natural Fenosa 2007
Escatrón (Zaragoza) 800 E.ON 2007
Sagunto (C. Valenciana) 1255 Gas Natural Fenosa 2007
Castellón (C. Valenciana) 1668 Iberdrola 2002/2008
Castejón 1,3 (Navarra) 855 HC Energía 2002/2008
Puentes de García Rodríguez (La Coruña) 870 Endesa 2008
Sabón (La Coruña) 389 Gas Natural Fenosa 2008
Barranco de Tirajana (Gran Canaria) 438 Endesa 2005/2009
Soto de Ribera (Asturias) 866 HC Energía 2008/2010
Cas de Tresorer (Mallorca) 480 Endesa 2006/2010
Granadilla (Tenerife) 433 Endesa 2007/2011
Bahía de Algeciras (Cádiz) 800 E.ON 2011
Málaga 420 Gas Natural Fenosa 2011
Besós V (Barcelona) 873 Endesa 2011
Puerto de Barcelona 892 Gas Natural Fenosa 2011
SOURCES: PLATTS, COMPANY WEBSITES
15 LOCKED IN THE PAST WHY EUROPE’S BIG ENERGY COMPANIES FEAR CHANGEFAILURE TO ADAPT
Case study: Poland: the Opole II coal power value4 even after the government made a state-owned coal mining
plant, when “politics override business logic” company sell coal to the new plant at below market prices. The
government is also ensuring financing from everywhere it can: from
PGE’s Opole II in Poland is a recent example of new plants that its newly created investment fund5; by using a government bank
made no economic sense to build already from the moment of to buy up PGE’s bonds at below-market yields6; and by issuing
the investment decision. Here, the Polish government ordered the guarantees to the (nearly bankrupt) building companies7. Poland
70% state-owned PGE to build a 1,800 MW coal plant despite the simply makes the taxpayers pay for the missing billions in the
management’s opposition1 and the CEO’s resignation2 over the project. The Economist called the project an example of “politics
matter. overriding business logic”8.
PGE’s share price plunged by 7% in June 2013 when the prime
minister pushed ahead with the project3, and investment banks like 4 J.P. MORGAN CAZENOVE: PGE: KW CONTRACT LOOKS BROADLY IN LINE – STILL SEE RISK THAT OPOLE
JP Morgan warned of the project’s potential to destruct shareholder DESTROYS SHAREHOLDER VALUE – ALERT, 19 AUGUST 2013
5 M. MARTEWICZ: PGE WANTS PIR IN OPOLE, TALKS WITH FUTURE ENERGY BUYER, BLOOMBERG, 28
AUGUST 2013. ACCESSED IN BLOOMBERG PROFESSIONAL SERVICE.
1 UPI: POLAND`S PGE OKS $3.78 BILLION EXPANSION OF OPOLE COAL-FIRED PROJECT, 10 JANUARY 2014: 6 M. MARTEWICZ & K. KRASUSKI: KFW CLONE DEPRESSES YIELDS AS IT CROWDS OUT FUNDS: POLAND
HTTP://BIT.LY/1D75D6E CREDIT, BLOOMBERG BUSINESS WEEK, 2 JULY 2013: HTTP://BUSWK.CO/1IAMGZZ
2 PLATS: POWER IN EUROPE: PGE’S KILIAN RESIGNS OVER OPOLE, 25 NOVEMBER 2013 7 M. MAREWICZ: POLIMEX IS CLOSE TO AGREEING “FINANCIAL PACKAGE” WITH CREDITORS, BLOOMBERG,
3 P. BUJNICKI & M. MARTEWICZ: PGE DROPS MOST IN 3 MONTHS AS PREMIER BACKS OPOLE PLANT, 27 AUGUST 2013, ACCESSED IN BLOOMBERG PROFESSIONAL SERVICE.
BLOOMBERG, 6 JUNE 2013: HTTP://WWW.BLOOMBERG.COM/NEWS/2013-06-06/PGE-DROPS-MOST-IN-3- 8 THE ECONOMIST: POLAND’S ENERGY INVESTMENTS: POLITICS OVERRIDES BUSINESS LOGIC, 12 JUNE
MONTHS-AS-PREMIER-BACKS-OPOLE-PLANT.HTML 2013: HTTP://ECON.ST/KRNUPV
Falling wholesale prices
As a consequence of high over-capacities and low demand,
wholesale prices fell and are now at five to eight year lows – and
getting worse1 in most markets. The following chart shows how
2019 futures baseload German prices fell during 20132.
Figure 4: Fall of 2017 futures baseload German prices during 2013
During the past two years, baseload futures prices have been falling Figure 5: Germany, France and Netherlands
in Germany, France and the Netherland, as shown in the following day-ahead base
chart from Platts3.
1 R. MORISON, J. MENGEWEIN: GERMAN POWER COSTS SEEN DROPPING FOR FOURTH YEAR,
BLOOMBERG, 3 JANUARY 2013: HTTP://BLOOM.BG/1DFXIHY
2 2019 PHELIX BASELOAD YEAR FUTURES PRICES: HTTP://WWW.EEX.COM/EN/MARKET-DATA/POWER/
DERIVATIVES-MARKET/PHELIX-FUTURES#!/2014/02/11
3 PLATTS SPECIAL REPORT: GERMAN ELECTRICITY. EUROPE’S POWER DISCOUNT-SUPERMARKET, SOURCE: PLATTS
FEBRUARY 2014
16 LOCKED IN THE PAST WHY EUROPE’S BIG ENERGY COMPANIES FEAR CHANGEFAILURE TO ADAPT Market punishes overinvestment These massive over-investments in fossil capacities with higher marginal costs (as compared to grid-connected renewables) have led to large utilities being more and more harshly punished. According to a recent Oxford University study,1 an increasing number of recently built CCGT gas plants are being mothballed or prematurely closed across the EU. Over the course of 2012–2013, 10 major EU utilities announced the mothballing and closure of over 20 GW CCGT of capacity, of which 8.8 GW was either built or acquired within the past 10 years. Ernst & Young’s annual analysis of European power and utility asset impairments2 shows increasing write-downs, with a large share coming from generation assets. Annual impairments among the largest 16 European utilities grew from €8.5bn in 2010 to €9.3bn in 2011, and to €12.8bn in 2012. In 2010-2011 E.ON, EdF and Vattenfall represented 60% and in 2012 Enel, RWE and GdF Suez made up 59% of the impairments. For example, GdF Suez wrote down over €2bn mainly on EU assets3 in 2012 and Enel made a €2.58bn impairment on Endesa4. In 2013 Vattenfall wrote down SEK29.7bn (or €3.4bn), mostly from its coal and gas plants in the Netherlands and Germany5. This large impairment pushed the company’s net income to negative for the whole year.6 Still, the company plans to continue investing in fossil coal assets, including by completing its new Moorburg coal plant outside Hamburg. RWE will announce its annual results in early March, but has already signalled that it will write down an additional €3.3bn, of which €2.9bn is attributable to deteriorated earnings from fossil-fuel power stations7. RWE already wrote down €0.9bn in Q3 2013. GdF Suez also announced that it is preparing to write down European power assets, while – after its large earlier write-offs – E.ON is not planning to write down any more plants in the near future8. 1 B. CALDECOTT & J. MCDANIELS: STRANDED GENERATION ASSETS: IMPLICATIONS FOR EUROPEAN CAPACITY MECHANISMS, ENERGY MARKETS AND CLIMATE POLICY. WORKING PAPER. SMITH SCHOOL OF ENTERPRISE AND ENVIRONMENT, OXFORD UNIVERSITY, JANUARY 2014 2 ERNST & YOUNG: BENCHMARKING EUROPEAN POWER AND UTILITY ASSET IMPAIRMENTS. LESSONS FROM 2012; 2013 3 W. HOROBIN: GDF SUEZ PROFIT HIT BY IMPAIRMENTS, THE WALL STREET JOURNAL, 28 FEBRUARY 2013: HTTP://ON.WSJ.COM/1F6UIHM 4 L. MOLONEY: ENEL SLASHES DIVIDEND AFTER EUR 3.58 BILLION ENDESA CHARGE, THE WALL STREET JOURNAL, 14 MARCH 2013: HTTP://ON.WSJ.COM/1EEQGEQ 5 VATTENFALL: INTERIM REPORT JANUARY – JUNE, 2013: HTTP://WWW.VATTENFALL.CO.UK/EN/FILE/ Q2-REPORT-2013_35251329.PDF 6 VATTENFALL: FULL YEAR 2013 RESULTS. CONFERENCE CALL FOR ANALYSTS AND INVESTORS, 4 FEBRUARY 2014: HTTP://CORPORATE.VATTENFALL.COM/GLOBAL/CORPORATE/INVESTORS/INVESTOR- PRESENTATIONS/Q4-ANALYST-AND-INVESTOR-CONFERENCE-CALL.PDF 7 S. NICOLA: RWE WRITES DOWN $4.5 BILLION AS POWER-PLANT EARNINGS DROP, BLOOMBERG, 28 JANUARY 2014: HTTP://BLOOM.BG/1ECHXYD 8 C. STEITZ: UPDATE 2 – RWE TAKES €3.3BN CHARGE ON POWER PLANTS, REUTERS, 28 JANUARY 2014: HTTP://REUT.RS/1JMNATB 17 LOCKED IN THE PAST WHY EUROPE’S BIG ENERGY COMPANIES FEAR CHANGE
FAILURE TO ADAPT

   4.2. MISSING THE                                                                               Low renewable production by utilities
                                                                                                  The 10 largest utilities generated more than half of all power within
   RENEWABLES                                                                                     the EU in 2012, but only 4% of this was from non-hydro renewable
                                                                                                  sources. While the share of wind power within total EU-27 power
   REVOLUTION                                                                                     production amounted to 6.4% in 2012, the share of wind power
                                                                                                  within the total power production by the 10 largest utilities was low
                                                                                                  at 2.7%. Even on hydro[2]2 the large utilities score lower than the EU-
   The top EU utilities have failed to respond properly to the emergence
                                                                                                  average, 9.2% versus 11.7%.3
   of renewables despite having plenty of time to understand the
   risks and opportunities. They have also had strong comparative
   advantages to build up renewable positions, including access to large
   amounts of cheap financing and tax/investment credits; established
   relationships with equipment producers; the ability to combine and
   hedge different energy sources; and experience with regulation and                             2 HYDRO IS EXCLUDED FROM THE TABLE BELOW. THIS IS BECAUSE POWER PRODUCTION FROM HYDRO
                                                                                                  HAS BEEN STABLE OVER THE LAST TEN YEARS WITHIN THE EU-27, WHILE EXTRA CAPACITY HAS BEEN
   licensing. But most utilities missed this opportunity, and the mistake                         BUILT FOR POWER GENERATION THROUGH OTHER RENEWABLES. HYDRO IS ALSO EXCLUDED, BECAUSE ITS
   has started to haunt them, as renewables increase fast due to feed-in                          APPLIANCE DEPENDS VERY MUCH ON GEOGRAPHICAL CIRCUMSTANCES (FOR EXAMPLE VATTENFALL HAS
                                                                                                  MORE POSSIBILITIES THAN OTHER UTILITIES)
   tariffs and low interest rates1.                                                               3 PRODUCTION WITHIN THE EU BY THE 10 LARGEST EU-UTILITIES IS BASED ON INFORMATION BY THE
                                                                                                  COMPANIES: COMPANY REPORTS, ANALYST PACKS, DATA TOOLS, ETC. THE FIGURES FOR TOTAL PRODUCTION
                                                                                                  AND PRODUCTION OF WIND POWER AND HYDRO WITHIN THE EU WERE DERIVED FROM: EUROPEAN
   1 DPA-AFX: AUSBLICK 2014: VERSORGER RUFEN AUS DEM `TAL DER TRÄNEN’ NACH DER POLITIK, 5         COMMISSION, EUROSTAT, “ELECTRICITY PRODUCTION AND SUPPLY STATISTICS, EXCEL-SHEET”:

   Table 5: Share of renewables of the 10 largest EU utilities

          Share of                 EdF            RWE              E.ON         GdF Suez          Enel          Vattenfall     Iberdrola            CEZ            EnBW              PGE
        renewables

           Wind %                  1%              2%               2%              4%            4%                2%             21%              1%               1%               0%
     Other non-hydro               1%              2%               1%              2%            3%                2%             1%               2%               1%               3%
            %

   Case study: German utilities and renewable asset                                               Figure 6: Ownership structure of renewables in
   ownership                                                                                      Germany (In total 72.9 GW)
   In 2011 the German “Big Four” (RWE, E.ON, Vattenfall and EnBW)
   owned 74% of all generation capacity not covered by the Renewable
   Energy Law (“EEG”)1. In the same year, they only controlled 6.5%
   of non-hydro renewable capacities2. In early 2013, trend:research
   estimated their renewable share to be even lower, at 4.9%3.
   Utilities have allowed co-operatives, private individuals, industrial
   companies, financial firms and others to dominate both wind and
   solar power production. Even in onshore wind, where the utilities
   have especially large advantages, the Big Four only own 10% of the
   capacity while private individuals own 50% and other companies
   40%. The large utilities own only a meagre 3.5% of all German solar
   capacity while private individuals and non-utility companies each
   have 48%4.

   1 BUNDESNETZAGENTUR AND BUNDESKARTELLAMT, “MONITORINGREPORT 2012”, , FEBRUARY 2013
   2 HEINRICH BÖLL STIFTUNG: ENERGY TRANSITION: THE GERMAN ENERGIEWENDE BY CRAIG MORRIS AND
   MARTIN PEHNT, NOVEMBER 2012: HTTP://BIT.LY/19EZAYA
   3 TREND:RESEARCH. ANTEILE EINZELNER MARKTAKTEURE AN ERNEUERBARE ENERGIEN-ANLAGEN IN
   DEUTSCHLAND (2. AUFLAGE) KURZSTUDIE, 2013 HTTP://BIT.LY/1ECQNGD . THE FIGURES DO NOT INCLUDE
   PUMPED-STORAGE HYDROELECTRICITY.
   4 TREND ANALYSIS COMPANY TREND:RESEARCH AND THE LEUPHANA UNIVERSITÄT LÜNEBURG:
   “DEFINITION UND MARKTANALYSE VON BÜRGERENERGIE IN DEUTSCHLAND”, ,
   OCTOBER 2013

18 LOCKED IN THE PAST WHY EUROPE’S BIG ENERGY COMPANIES FEAR CHANGE
FAILURE TO ADAPT
Blind to the benefits Figure 7: Evolution of earnings by German utilities
RWE and E.On from renewable and conventional
Utilities have been so busy attacking the regulations related to
generation
renewable energy that they have ignored the benefits of controlling a
substantial part of renewable capacities. Beyond the strategic value
of being able to combine renewables and gas capacities or pumped
storage facilities, renewables can also bring direct cash benefits.
Recently, large utilities such as E.ON, Iberdrola and Enel have been
making considerable earnings from their renewable businesses:
• During the past five years, 5-6% of Iberdrola’s revenue and 20%
of its EBITDA1 came from its renewable business, contributing
€1.5–1.6bn in earnings annually2. Renewable EBITDA is also
expected to remain in the €1.5–1.7bn range in the coming years
while further deterioration of EBITDA from the Spanish liberalised
segment is probable3.
• E.ON’s renewable business, including hydro, produced €1.5bn
(16%) of its total EBITDA in 2011 and €1.3bn (12%) in 2012. SOURCE: J.P. MORGAN: GERMAN UTILITIES, 19 NOVEMBER, 2013
Non-hydro renewable EBITDA was €0.6bn in both years4. Based
on results of the first nine months of last year, this is expected
to grow in 20135. The following chart shows that J.P. Morgan • Enel Green Power (EPGW) in 2012 delivered €1.7bn, or 10% of
forecasts growing earnings for E.ON’s and even RWE’s renewable the Enel group’s EBITDA and 15% of its operating profits7. These
businesses but a significant fall in their conventional generation percentages increased in the first nine months of 2013, year
earnings6. The analysis also gave a sum of parts evaluation of on year, while Spanish and Italian fossil generation EBITDA fell.
the different divisions. It estimated the current value of E.ON’s Renewables in the group account for 3% of revenues, but 11%
Generation business at €1.7bn and of its Renewable business of earnings8. J.P. Morgan expects further increases in EPGW’s
at €15.3bn; RWE’s Conventional Power Business was valued at EBITDA, e.g. over €2bn in 2015 and close to €2.2bn in 2016 while
€8.9bn and its Renewables business at €5.1bn. it forecasts that Generation and Energy Management business’
EBITDA will weaken9. EPGW shares are outperforming those of
parent company Enel (see the Bloomberg share price chart below).
Figure 8: Evolution of equity by Enel group and its subsidiary Enel Green Power
1 IBERDROLA 2012-14 OUTLOOK, STRATEGIC PILLARS, CAPITAL MARKET DAY, 24 OCTOBER 2013: HTTP://
BIT.LY/19E8KID
2 IBERDROLA 2012-14 OUTLOOK, RENEWABLES BUSINESS, CAPITAL MARKET DAY, 24 OCTOBER 2013:
HTTP://BIT.LY/1CF6PXY
3 J.P. MORGAN: IBERDROLA: 2014 SHOULD STILL BE A DIFFICULT YEAR, BUT A 6% DIVIDEND YIELD 7 BLOOMBERG PROFESSIONAL, ENEL IM EQUITY, FA – FINANCIAL ANALYSIS, SEGMENTS, ACCESSED IN
SHOULD PROVIDE SUPPORT, 28 OCTOBER 2013 DECEMBER 2013
4 E.ON: FULL YEAR 2012 RESULTS, MARCUS SCHENCK, 13 MARCH 2013: HTTP://BIT.LY/1D6OFQ2 8 BANCA IMI: ENEL: 2013 GUIDANCE CONFIRMED, BUT UPSIDE ON NET DEBT TARGET. CREDIT COMPANY
5 EON: FIRST NINE MONTHS 2013, 13 NOVEMBER 2013: HTTP://BIT.LY/1BYZMF9 NOTE. 27 NOVEMBER 2013
6 J.P. MORGAN: GERMAN UTILITIES: RWE: BALANCE SHEET STORY CONTINUING TO UNFOLD, MAINTAIN 9 J.P. MORGAN: SPANISH & ITALIAN GENERATIONS: TARIFF DEFICIT WEIGH ON NEAR-TERM SENTIMENT. 17
PREFERENCE VS. EON, 19 NOVEMBER 2013 DECEMBER 2013
19 LOCKED IN THE PAST WHY EUROPE’S BIG ENERGY COMPANIES FEAR CHANGEYou can also read