U.S. POPULATION, ENERGY & CLIMATE CHANGE - Center for Environment & Population - Center for Biological ...
←
→
Page content transcription
If your browser does not render page correctly, please read the page content below
U.S. POPULATION,
              ENERGY &
          CLIMATE CHANGE

                                            Center for
                                            Environment &
                                            Population

1 / U.S. Population and Climate Change, www.cepnet.org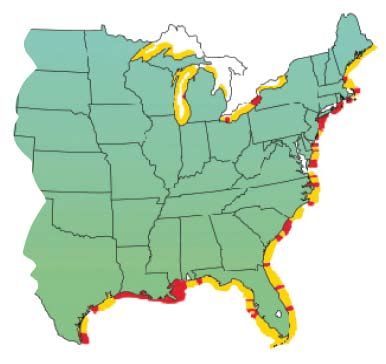
U.S. Population,
                 Energy & Climate Change

                                              By Victoria D. Markham

                                              Center for
                                              Environment &
                                              Population

1 / U.S. Population and Climate Change, www.cepnet.org
Acknowledgements
Special thanks to Kara DiFrancesco and Mercedes About This Report
Bravo who contributed to the research and writing of this
This report is the first in a series of
report, and to Martha Farnsworth Riche, Brian O’Neill and
publications on U.S. Population, Energy and
Nadia Steinzor for their expertise and insights. The Center
Climate Change by the Center for Environ-
for Environment and Population (CEP) is grateful to the
ment and Population (CEP). The series
Compton Foundation, Richard and Rhoda Goldman Fund,
contains brief, easy-to-read reports, fact
New-Land Foundation, Wallace Global Fund, Winslow
sheets, and briefing materials on population
Foundation, and an anonymous donor for their invaluable
and climate change trends in the U.S. and
support of this project.
globally. Activities are also being conducted
to integrate the information into U.S. policy
Center for Environment and Population and public action at the local, national and
(CEP) international levels.
The Center for Environment and Population (CEP)
is a non-profit research, policy, and public advocacy
organization that addresses the relationship between For more information contact:
human population and its environmental impacts. The Victoria D. Markham, Director
Center works to strengthen the scientific basis of policies Center for Environment and Population (CEP)
and public outreach to achieve a long-term sustainable 161 Cherry Street, New Canaan, CT 06840
balance between people and the natural environment in
the U.S. and globally. Phone: 203-966-3425
CEP links science to policy, public education, and Fax: 203-966-5443
advocacy to better understand and address the issues. Email: vmarkham@cepnet.org
To do this, the Center: compiles and assesses the best Website: www.cepnet.org
available current knowledge and emerging trends on the
issues; produces easy to understand science-based ma-
terials for policymakers and the public, and; undertakes
activities to integrate the information directly into policies
and public outreach. The Center’s work focuses on the
U.S. population’s environmental impact in the nation, and
within the global context.
The Center has two major program areas: Emerging
Issues in Environment and Population and Building
New Population-Environment Leadership. CEP
produces unique, cutting-edge reports and briefing
materials including the U.S. National Report on Population
and the Environment, U.S. State Reports, the Issues
on Population & the Environment series, and the AAAS
Atlas of Population and Environment (all available online
at www.cepnet.org). Activities are also undertaken to
incorporate the information into policy and public
outreach. The Center engages leading organizations,
scientists, and other experts as partners in its efforts.
CEP is a project of the Tides Center, and works in the
U.S. (from the local community to national level) and
internationally.
©2008 Center for Environment and Population (CEP).
All rights reserved.
2 / U.S. Population and Climate Change, www.cepnet.orgContents
U.S. Population, Energy & Climate Change
Acknowledgements...................................................................................................... 2
Introduction................................................................................................................... 4
U.S. Population and Climate Change Profile
The Issues
l U.S. Population Factors, Energy Use, and Climate Change...................................... 6
The Effects
l Altered Weather, Rising Sea Levels, Freshwater, Biodiversity, Human Health......... 8
In More Detail
l Metropolitanization, Land Use, Households.............................................................. 9
l Population and the Coasts.......................................................................................... 12
l Climate Change and Population: Effects and Impacts.............................................. 14
In Your Region: U.S. Population and Climate Change
l Northeast, Midwest, South and West......................................................................... 19
Conclusion..................................................................................................................... 21
Endnotes........................................................................................................................ 24
3 / U.S. Population and Climate Change, www.cepnet.orgIntroduction
There is growing evidence that population, linked to energy use and greenhouse gas
emissions, is a key factor in global climatic change.1 In the climate change equation,
population is the “big multiplier” – particularly when linked with resource consumption –
because it intensifies the rate, scale, and scope of both the root causes and effects of
climate change in the United States (U.S.), and worldwide.
W ithin the global context, the U.S. stands
out for two reasons: it has by far the
largest population amongst other industrial-
ized nations, the only sizable one with significant
population growth, and; it uses more energy than any
their unique combination makes the U.S. one of the
world’s most important players in population and climate
change.
While the U.S. “population and climate change”
connection is complex, it manifests itself in two primary
other country and is the largest carbon dioxide (CO2) ways:
greenhouse gas emitter amongst industrialized nations l first, population is related to the causes of
worldwide.2 climate change, mainly through high per capita
This unique combination – America’s high popula- energy use and greenhouse gas emissions (the
tion numbers and growth, together with its high rates of “carbon footprint”) and;
per capita energy consumption and pollution – makes l second, population factors can exacerbate
the U.S. pivotal in the national and global population- climate change’s effects by placing more pressures
climate change debate. on the natural resource base at specific sites, for
In simple terms, the U.S. is the world’s largest example, when there is high population density and
developed nation, consumes energy and resources at continued rapid growth in coastal, urban, suburban,
very high rates, and is growing rapidly. This has major or ecologically vulnerable areas of the U.S.
implications for global climate change because the
In addition, gains made in addressing climate change
American population’s energy consuming habits are so
can be made much more difficult – in some cases even
disproportionate to that of other nations’. While the U.S.
offset altogether – by these population factors, when
represents about 5% of the global population, it consumes
combined with high per capita natural resource
about 25% of the world’s energy, and generates 5 times
consumption.
the world average of CO2 emissions. Because Americans
are high resource consumers in a country with a
large, rapidly growing population base, the U.S.
has a much bigger “per-person” impact on global U.S.-WORLD POPULATION & CLIMATE CHANGE
climate change than any other nation. With about
8,000 people added daily in the U.S., and 3 million
people added each year, there’s real potential to reach Population
1 billion high-energy-consuming Americans by 2100. Energy Consumption
Meeting the energy demands of this large and rapidly CO² Emissions
growing population that consumes elevated levels of
resources and energy – while at the same time reducing
the greenhouse gas emissions contributing to climate
change – will prove daunting in the coming decades.
Even now we are seeing its effects.
The relationship between U.S. population trends
and global climate change is characterized by
several key elements. These include U.S. demographic
factors – relatively high population numbers and rapid
United States World Europe Developing
growth; high and increasing density in coastal and Countries
metropolitan areas; an increase in energy-consuming
Energy consumption in total kilograms of oil equivalent (Kgoe),
households, and; a large “Baby Boomer” population – and CO2 emissions in metric tons, per person.
coupled with high per-capita energy use, fossil fuel
burning, land and vehicle use. These are all linked, and Source: US Census Bureau, US Energy Information Administration,
World Resources Institute, 2008
4 / U.S. Population and Climate Change, www.cepnet.orgIntroduction
We often see “population growth” and “climate The most recent scientific data reveals the answer,
change” as being separate, rather than making the showing that the links between population and climate
connection between the two – and this is particularly true change are particularly acute when you look at the U.S.
in the U.S. The issues are, however, inextricably linked case within the global arena. In short, while America has
and must be understood and addressed at the same time, about 1/20th of the world’s population, it consumes about
as they relate to one another, as two sides of the same 1/4th of the world’s energy.11 And, Americans produce
coin. This science-based report helps to make that almost 20 tons of CO2 per person per year – about five
connection, providing the basic information needed to times the world average – of 4 tons of CO2 per person a
better understand these issues, and to take first steps to year, and also substantially larger than 8 tons of CO2 per
effectively address them, as they are associated. It can be person per year for Europeans, and 2 tons for develop-
used as a tool to demonstrate how U.S. population and ing countries.12
resource consumption trends are linked to climatic These trends in U.S. population, energy consump-
change, in the U.S. and globally. tion, and CO2 emissions are expected to continue, and
even rise, in the foreseeable future. The U.S. population
America’s Role in Global Climate Change is expected to double in one generation, by 2076, and
even reach 1 billion in some of our lifetimes.13 On the
The world’s leading scientists agree that unprec-
energy side, while U.S. greenhouse gas emissions rose
edented changes to the climate of the U.S. and the planet
about 15% from 1990 to 2006,14 by 2020 they are pre-
are underway, due in large part to human-induced
dicted to increase by nearly 30% under a “business as
factors.3 Over the past five decades humans have played
usual” scenario.15
the dominant role in the world’s changing climate, mainly
Taking into account how climate change works – as
through the generation of “greenhouse gases” like carbon
a “global commons”, where the planet’s air and emissions
dioxide (CO2), with “metropolitanization” (metro area and
over a specific location, like the U.S., typically move half-
suburban growth) and land use changes also playing an
way around the world a week later – America’s unique
important part.4
“population and energy” profile place it front and center
The effects of climate change are felt both worldwide
in relation to the world’s climatic changes.16
and here in the nation. Globally, the 11 warmest years on
record have all occurred in the past 13 years,5 and 2006
was the U.S.’ warmest year on record.6 Average annual
U.S. temperatures are over two degrees Fahrenheit higher
than a century ago.7 There is increased frequency of U.S. POPULATION,
severe weather events (such as rainstorms, heat waves CO2 EMISSIONS, & ENERGY CONSUMPTION
and hurricanes), and major shifts in U.S. growing seasons
and in the ranges of plant and animal species. Climatic PER CAPITA
change is causing the spread of vector-borne diseases
rarely seen in the U.S., such as malaria and dengue
fever.8 The nation’s freshwater resources are more prone . . .. .....
.
.....
.. ....
to drought and the consequences of less mountain snow
pack. Glaciers are retreating, sea ice is melting, and sea
.. .....
level is rising.9
. .. . .. .......
. . ..
......
Yet, how is the “U.S. population” – its growth, density,
movement, composition and per-person natural resource Population ......
consumption – connected to climate change in the CO2 Emissions
country, and globally? Today 98% of the world’s popula- Energy Consumption
tion growth is in developing countries, a growth trend 1950 1970 1990 2010 2030
that is expected to continue well into this century.10 With
most population growth occurring in other parts of the Projections based on mid-range data estimates.
world, why focus on the U.S.? And why is America in CO2 emissions in metric tons, and energy consumption
in Btus, per person.
the hot seat of “population-climate change” impacts
worldwide? Source: US Census Bureau, US EIA, WRI, 2008
5 / U.S. Population and Climate Change, www.cepnet.orgSummary
U.S. contributions to climate change are associated with human population through a
combination of factors, including: the number of people and rate of population growth;
where and how they live and consume natural resources, and; energy consumption
patterns and type of energy used to meet the demand.
T hese factors when taken individually may have
small impacts, however, when combined as they
are in the U.S., contribute significantly to the
world’s climate change causes and effects. To understand
how population affects climate change, it is critical to
n “Metropolitanization”, or, the growth in cit-
ies and surrounding suburban areas, characterizes
the nation’s population growth trends consistently
over the past century. By 2000, half of all Americans
lived in suburban areas, and 4 out of 5 lived in
grasp which key U.S. population and energy/resource- broader metropolitan areas.21 Most important with
use factors are involved: regard to the population and climate change link
is that growth outside cities in the suburban and
U.S. Population Factors Linked to surrounding “exurban” areas far outpaces growth
Climate Change within cities. As a result of this trend, land in the
U.S. is converted for development at about twice
The four population factors in the U.S. most
the rate of population growth22, and each American
closely associated with climate change include:
effectively occupies 20% more developed land (for
l Population size and growth rate housing, schools, shopping, roads, and other uses)
l Population density: where the U.S. population than he/she did 20 years ago.23 This is important
lives (Metropolitan areas, Coast, South and West in this context because the way land is most often
regions) developed today in the U.S. to accommodate much
l Per capita resource use: how the U.S. population of the growth is through “sprawl development”.
lives (Land use, Vehicles, Households) This is characterized by spread-out rather than clus-
l Population composition (Age, Baby Boomers, tered residential and commercial land development,
Income) and is the nation’s most predominant form of land
use change today. It results in a marked increase in
Population size and growth rate: the U.S. has by vehicle use and road systems, and in a rise in the
far the largest population amongst industrialized nations number and energy-consumption level of households
in the world17 – it is the third most populous country in – all associated with high levels of energy use and
the world after China (1.3 billion) and India (1.1 billion) fossil fuel burning. It also leads to rapid loss of
– and is the only large developed nation experiencing forest and agricultural land which would otherwise
significant population growth.18 The U.S. population has act as “carbon sinks” (see page 9).
more than doubled since 1950, and will double again in
70 years.19 Today the U.S. is home to over 304 million n “Households” (and what is used within them)
people; this number is expected to reach 400 million by is a key demographic factor in the rise of U.S. per
2043, with potential to reach the billion mark this cen- capita energy use and climate change. In recent
tury.20 This is important because it shows the U.S. has a decades there has been a major increase in: the
relatively high number of people, with rapid growth that number of households (with fewer people per house
is expected to continue throughout this century, and high and the number of second homes on the rise);
levels of per capita energy, land and forest consumption house size (square footage), and; amount of land
– all of which are closely linked to climate change. around each. Each of these factors translate into
Population density (where the population is more energy use and CO2 emissions per person.
distributed and growing) and per capita resource use Also, where the households are placed (in sprawl-
(how the U.S. population lives) on a day-to-day basis are ing rather than clustered communities) and amount
linked to climate change because, these factors: of energy used in each residence are key.24 The U.S.
a) intensify land use changes that directly affect climate residential sector is the largest such energy use
change; b) increase per-capita energy use (i.e. house- sector worldwide, and household appliances
holds and transportation) or each person’s “carbon foot- (refrigerators, microwaves, dishwashers, air condi-
print”; c) transform carbon “sinks” into carbon sources, tioning and heating units) are the fastest grow-
and; d) create “heat islands”. Key issues include: ing energy consumers nationwide, after cars.25
6 / U.S. Population and Climate Change, www.cepnet.orgSummary
In developed nations like the U.S., home appliances
now consume 30% of all electricity used, emitting AMERICA’S GROWING CARBON FOOTPRINT
A
12% of global greenhouse gases.26 By 2015 house-
hold energy use is expected to rise by 15%.27
“carbon footprint” is a measure of
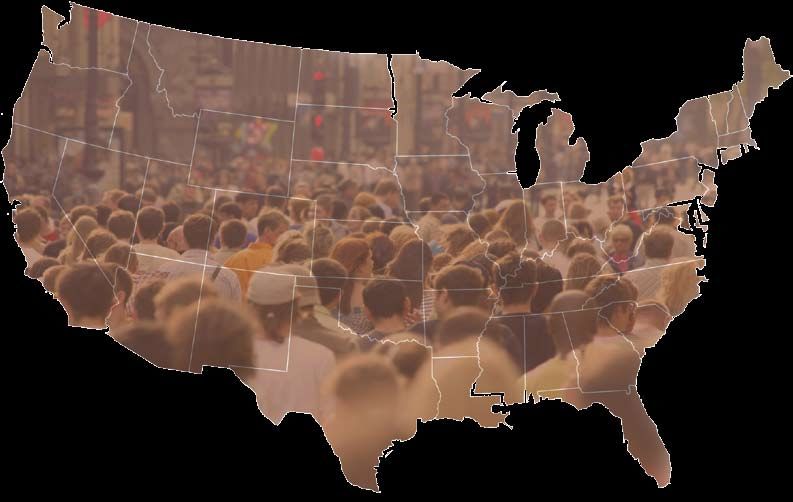
n Densely populated U.S. coasts is a key factor the impact that human activities
in relation to climatic change because more people have on the environment in terms of
are susceptible to the effects of climate change there. greenhouse gases produced, measured in
Over half (53%) of all U.S. residents now live within units of carbon dioxide (CO²). It is used to
50 miles of the coast – on just 17% of the nation’s conceptualize impact in contributing to
total land area – where they are most vulnerable to climate change. Experts say America’s carbon
sea level rise and the severe weather events (such as footprint is expanding, and that with a
hurricanes and flooding) associated with climate growing population and expanding economy,
change.28 Population density on U.S. coasts is five America’s “settlement area” is widening.
times that of other parts of the country.29 An addi- As it does, Americans are driving more,
tional 27 million people, accounting for about half building more, consuming more energy,
of the projected overall U.S. population increase, are and emitting more carbon.
expected to move to the coastal areas in the next 15
Sources: Weidmann & Minx, 2008; Brookings Institution,
years alone.30 And, over 80 million people annually 2008.
visit the coast for recreation, temporarily yet signifi-
cantly swelling coastal populations and pressures on
the area’s natural resources.31
n The South and West are the nation’s most heav- n The “youth” of America’s population is critical
ily populated and fastest growing regions – they now because they represent a large demographic whom
contain over half (59%) of the entire U.S. population – in a departure from generations before them – are
– and these trends are expected to continue in com- making key personal “choices” regarding resource
ing decades. The South and West are among the na- and energy consumption and family size, taking into
tion’s “population-climate change hotspots” because consideration climate change impacts and overall
of their combination of population numbers and “environmental sustainability”.
growth, and ecological vulnerabilities (as associated
with the coastal areas of the South and freshwater n Income is closely associated with energy
resources in the West). For example, of the nation’s consumption and pollution in the U.S. Statistics
top ten fastest growing states, half are in the coastal show that generally the more affluent a person is,
South, and four are in the arid West – both areas of the more resource and energy consumption and
exceptional ecological sensitivity to climate change pollution they are responsible for. For example, in
impacts of sea level rise and altered temperatures America, rising income generally results in a greater
that affect freshwater sources.32 (See “In Your number of larger houses, more vehicle use and avia-
Region”, pages 19-20). tion travel, and, the associated increase in fossil fuel
burning and CO2 emissions. U.S. per capita income
Population composition: The “make-up” of a is nearly $40,000 in contrast to $26,000 for other
population (i.e., its “age” or “income”) often determines developed nations, and $4,000 for less developed
where and how people live, move, vacation and con- nations. On the flip side, affluence can facilitate
sume resources and energy – and these are all linked to positive trends in that it makes the typically more
climate change. For example: expensive energy-efficient technologies (i.e. hybrid
vehicles and appliances) more accessible, but only
n The nation’s “Baby Boomers”, the largest ever to those who can afford them.
of this particular U.S. demographic (26% of the total
U.S. population) are wealthier, spend more money, For more details on this Summary, see page 9.
drive more vehicles and miles, have more homes per-
capita including second homes, and use more energy
per capita than any generation before them.33
7 / U.S. Population and Climate Change, www.cepnet.orgSummary
U.S. Energy Use, Population, and emissions.37 The commercial and transportation
Climate Change sectors are projected to be the fastest growing U.S.
energy use sectors from 2005 to 2030, with 1.4% and
There are two main factors that link U.S. 0.7% annual growth, respectively.38 This has major
energy issues to population and climate change: implications for future increases in fossil fuel burning
l The nation’s energy use, relative to it’s and CO2 emissions.
population size
l The greenhouse gas carbon dioxide (CO2) The Effects: Climate Change and
emissions, per capita Population
An important link between population and
These energy issues are important in this context climate change is from climate change’s “effects,”
because the U.S. is the single largest carbon dioxide i.e., through increased severity and frequency of
(CO2) emitter of the industrialized nations in the major storms, sea level rise, or increased droughts
world, accounting for nearly a quarter of all global which are all occurring in some of the most
emissions.34 These are predicted to increase by 30% by heavily populated and fastest growing areas in
2020.35 With about 5% of the global population, the the U.S. (such as the coasts, and the South and
U.S. consumes approximately 25% of the world’s West regions). The main effects include:
energy.36 The nation has the highest oil consumption
worldwide, and is projected to use 43% more oil than l altered weather and seasonal patterns
current levels by 2025. The U.S. residential sector l rising sea levels
is the largest single consumer of that particular l less available freshwater
type of energy use worldwide, with American homes l habitat and biodiversity loss
generating 25% of global home-related greenhouse gas l human health threats
These are all occurring at present to varying degrees,
and are predicted to continue for the foreseeable future
under a “business as usual” scenario. For example, the
U.S. ENERGY USE BY SECTOR, 2006 average temperature increase in the U.S. over the
next 100 years is predicted to be 5-9oF.39 Temperature
increases by 2100 are predicted to vary by region and
Air Transportation season, with a 4-5oF average increase across the North-
4% Other Transportation
5% east and Midwest, a slightly lower 3-4oF average increase
in much of the South and West, and the greatest warm-
ing, 10oF in winter, predicted for Alaska.40 Sea level rise
and more severe weather events that will impact the
heavily populated coastal areas are predicted, particularly
Highway Residential in the U.S. Mid-Atlantic and Gulf Coasts. Freshwater
Transportation
31%
15% resources in the U.S., especially throughout the West,
are being severely affected by climate change-driven
drought and reduction of mountain ice pack. Ecological
Commercial
11%
and biodiversity changes triggered by climate change
could render 15-37% of all sampled plant and animal
species extinct by 2050, both worldwide and in the U.S.41
Industrial
34% For more details on this Summary, see page 14.
Source: US EIA, 2008.
8 / U.S. Population and Climate Change, www.cepnet.orgIn More Detail
In this section, the main U.S. population, energy use and climate change factors
are described in more detail.
Population and Energy-Use Factors
Linked to Climate Change U.S. POPULATION & URBANIZATION
Metropolitanization and Land Use Population Growth
60
America’s current population growth, movement and Land Urbanized
distribution, and the manner in which people consume 50
land, have created fundamental changes in how land
has been used in the nation today. This is particularly 40
true in recent decades, and as such has contributed to
climate change uniquely occurring in our lifetimes. The 30
type of “land use change” that is central here is directly 20
linked to growth trends in the nation’s metropolitan
areas (a result of the nation’s century-long movement 10
from being primarily rural to urban and suburban), and,
the subsequent “development” that has taken place for 0
residential, commercial, and related infrastructure. This Northeast Midwest South West
“metropolitanization” of the nation is characterized Source: Fulton, W., et al, Who Sprawls Most? How Growth Patterns
Differ Across the US, 1982-97. Brookings Institution, 2001
by the expansion of cities and suburbs outwards, and the
subsequent loss of farmland, forests, prairies, wetlands,
natural coastal areas, and the remaining open spaces.42
large retail complexes surrounded by acres of parking,
America’s land-use changes from population office parks far from homes and shops, and a growing
growth and associated development result in three network of roads linking them together. This type of
main trends that have significant consequences, all development often spurs everyday activities that are
of which are closely associated with climate change: linked to global warming, including:
l Sprawl development • increases in per capita vehicle use and miles
l Increase in vehicle use and road systems traveled, because of the large area that sprawling
l Increase in number and energy consumption communities cover
of households • relatively high energy use and fossil fuel
burning from increased use of vehicles and from
Sprawl Development more, larger, homes to maintain, heat and cool
• open land/space development for residential and
Much of the nation’s land conversion for develop- other infrastructure
ment in the past few decades (for residential and related • high levels of traffic congestion45
services) has triggered an entire set of unique land use
patterns, called “sprawl”. This expansive development Sprawl development involves the conversion of
generally occurs around city and town centers, and into all types of land, including terrestrial and aquatic eco-
surrounding neighborhoods and rural areas. The amount systems (such as forests and wetlands), and farmland.
of land utilized for these sprawling metropolitan areas Many of these land “uses” prior to the development are
has increased faster than their populations are growing. considered “carbon sinks” because they naturally soak
Nationwide, during the 1980’s and 1990’s population grew up more carbon than they emit. Such carbon sinks help
by 17%, yet the amount of developed land grew 47%.43 regulate CO2, the main greenhouse gas contributing to
By 2030, half of the buildings in which we live, work, climate change. However, when these lands are devel-
and shop will have been built after 2000.44 oped, not only are the areas that formerly stored
Sprawl is characterized by high amounts of land carbon (such as the forests) eliminated, but they also
development per unit of human activity. It is reflected in tend to be replaced with land uses (such as roads,
low-density residential subdivisions, commercial strips, parking lots, suburban residential areas) that contribute
9 / U.S. Population and Climate Change, www.cepnet.orgIn More Detail
to or become “carbon sources”, or net emitters of More vehicles are on the road, and the amount of
greenhouse gases into the atmosphere. This is a good American’s driving time has increased at a rapid rate. The
example of how the “U.S. population’s demand for land number of vehicle miles traveled rose by nearly 2.5%
to support growth” scenario plays out across the nation, annually during the 1990s (with a marked increase in the
and is a key part of the climate change equation. final years of the decade), reaching nearly 3 trillion miles
Another key factor is how densely populated and annually for the nation as a whole by 2000.49 And, the
fast growing U.S. metropolitan areas contribute to climate average miles traveled (and fossil fuels burned) is grow-
change by increasing their “heat island effect” – where ing faster than the population: from 1995-2004 when the
temperatures in urban and suburban areas are 2 to 10oF U.S. population grew by less than 10%, the transportation
hotter than nearby rural areas.46 The heat island effect miles traveled by Americans increased by 23%.50
results from several factors, including: displacing trees
and vegetation whose shade and evaporation rates have
natural cooling abilities; the trapping of heat between U.S. VEHICLE USE
tall buildings and narrow streets that reduce air flow, and;
the addition of waste heat from vehicles, factories and 3,000,000,000 25,000,000
air conditioners into the surrounding air. The elevated Vehicle Miles Traveled
temperatures often increase peak energy demand for air 2,500,000,000 Transit Boardings
20,000,000
conditioning, which in turn causes more burning of fossil
fuels that contribute to climate change, and exacerbates 2,000,000,000
heat-related illnesses and mortality.47 15,000,000
Boardings
Miles (in thousands)
1,500,000,000
10,000,000
URBAN HEAT ISLAND EFFECT 1,000,000,000
5,000,000
500,000,000
0 0
Temperature
Source: APTA & FHWA, 2008
With more people taking more and longer trips as
part of daily life, and, a growing number of cars on the
road, congestion has also increased. The average U.S.
Rural Commercial traveler now spends 47 hours each year stuck in traffic
Suburban Downtown delays during rush hour, compared to just 16 hours two
Residential decades ago. There are also now ten times more urban
Source: US Environmental Protection Agency, 2008 areas (51) with more than 20 hours of annual rush hour
delays.51
Looking at the environmental impacts, these trends
have contributed to increased fossil fuel combustion, and
Increase in Vehicle Use and Road Systems higher greenhouse gas emissions. The transportation
sector uses 15% more energy today – primarily from
The U.S. population’s shift into suburban and exur- petroleum – than it did a decade ago.52 It now accounts
ban areas has created modern land use changes that by for one-third of all U.S. carbon dioxide (CO2 ) emissions.53
nature require more vehicle use and increased amounts This reflects an annual increase of over 2% during the
of construction and land transformed to build new 1990’s.54 Most (41%) of the CO2 emissions created by the
highways, roads, and parking lots. Over 81,000 miles of transportation sector are emitted from the miles Ameri-
highway have been built from 1995-2004, bringing the cans travel on highways.55 In addition, an estimated 2.3
total to more than 4 million miles.48 billion gallons of fuel are wasted every year from idling
in traffic, nearly 80% more than in the early 1990s.56
10 / U.S. Population and Climate Change, www.cepnet.orgIn More Detail
Gasoline price rises are due in part to increased Increase in Number and
demand for oil and a reduction in stocks, as well as Energy Consumption of Households
disruptions in supply, such as the damages caused by
storms such as Hurricane Katrina and Rita in the year “Households,” and the resources and energy
2005. Although high gas and oil prices may lead to a Americans consume to support them, is an important
decrease in miles driven and a shift towards more demographic variable in calculating population’s
efficient forms of transportation, they can also pose a climate change linkages.
threat to passing climate change legislation which Every household has a minimum number of
would further increase gas prices. possessions, occupies a certain amount of space, and
Even the U.S. population’s increasing use of air travel emits certain waste and/or pollutants. However, the
is related to climate change. In the last decade, the total extent of environmental stress, including climate change,
miles traveled by U.S. aircrafts has increased 40%, and by that is linked to “households” depends on three main
2025 U.S. air traffic is expected to rise by 60%. In addi- factors: household size (the number of people within
tion to producing significant greenhouse gases, scientists a given household) /number of households; size of
say that the impact of carbon emissions from airplanes in homes (square footage of a house), and; the amount
the upper atmosphere is amplified and at least twice as of land surrounding and used to build homes.
harmful to the environment as those on sea level. 57 In recent decades, while the average U.S. house-
hold size has decreased, the number of households has
increased significantly, and the amount of “living space”
in and around homes has risen. The number of people
VEHICLE OWNERSHIP BY COUNTRY per household was 2.6 people in 2000, down from 3.1 in
140 million 1970 (or one fewer person for every two households),58
and as a result, the number of households has increased
120 million markedly. In 2000, there were nearly 14 million more
housing units nationwide than a decade earlier.59 Be-
100 million tween 1970 and 2000, average household size declined
from 3.1 to 2.6 persons (one fewer person for every two
80 million households), resulting in demand for new housing units
in addition to that already needed to keep pace with
60 million population growth.60 Smaller household size in the face
of population growth is one reason behind a nationwide
40 million building boom: between 2000 and 2006, 10 million
new housing units were built.61 In addition, the number
20 million of second homes is at an all time high: second home
ownership increased from 5,537,000 units to 6,489,000
1 million units, a 17% increase or 2.7% annual increase from
U.S. (2005) Japan (2006) China (2005) India (2003)
1999 to 2005.62
Source: International Road Federation, 2008 The average size of new, single-family homes has
expanded steadily, reaching more than 2,300 square feet
by 2004. Nearly 40% of new single-family homes are
over 2,400 square feet, double the proportion in 1987.63
With more people living in “super-sized” houses that
occupy more land, the amount of resources (from lumber
to plastic) used for new construction is rapidly on the rise,
and more energy is consumed for heating and cooling
(thus more fossil fuels burned). With many houses built
in new sprawling communities – rather than clustered or
city-based development that often uses existing “foot-
prints” to build new homes – development begins from
scratch, and there is higher resource use, and fragmen-
tation of open space. Data shows that increases in the
average “lot” sizes, on which new houses are built, are
11 / U.S. Population and Climate Change, www.cepnet.orgIn More Detail
prevalent in many suburban areas.64 About 55% of Population and the U.S. Coasts
farmland developed since 1994 has gone to houses
One key link between population and climate change
built on lots ten acres or larger.65 More than 3,000
in the U.S. is the high concentration of Americans who
square miles of land is converted annually to residential
live and recreate in coastal areas, because it means
development over one acre in size.66
more people are then vulnerable to the effects of climate
Energy use within each household is also a key
change (such as sea level rise and strong weather events
population-climate change link. The U.S. residen-
like storms).68 Over half (53%) of all Americans now live
tial sector is the largest of that energy use sector
within 50 miles of the U.S. coasts. An additional 27 mil-
worldwide, and household appliances are the
lion people (accounting for about half of the projected
fastest growing energy consumers nationwide.67
U.S. population increase) are expected to move there
in the next 15 years alone, and, there are higher growth
rates on the coasts than the inland areas of the U.S.69 As
GROWTH IN U.S. HOUSEHOLDS a result, the U.S. coastal zone represents a “hot spot”
for population and climate change vulnerability.70
The “coastal vulnerabilities” associated with climate
change include sea level rise, shoreline erosion, flood-
ing, coastal storms, and degradation of coral reefs and
marine ecosystem health.71 These all, in turn, affect the
dense and fast growing coastal populations in the form
of health, accessibility and availability, and property. If
global warming continues as it is, major coastal urban/
metropolitan areas built near sea level (including New
York, Boston, Washington DC and Miami) will be at risk
from the expected sea level rise of 18-20 inches above
current levels by 2100 (see box, page 13). Low lying
infrastructure in these areas such as buildings, roads,
power lines, airports, trains and subway systems are
subject to flooding. Where land is already sinking (such
as along the Gulf Coast including New Orleans, LA and
Galveston, TX) sea level rise will likely be faster. Recre-
Source: US Census Bureau, 2008 ational areas enjoyed by millions, including New Jersey
and California beaches, Long Island and the Hamptons,
Cape Cod, Nantucket, North Carolina and Florida’s Gold
Coast will be subject to beach erosion.72
U.S. Energy Consumption by Income Level
and Square Feet of Household
Household income level Square feet of home Energy consumption of
household (million Btus)
$15,000 - $19,999 1,500 81
$30,000 - $39,999 1,700 87
$75,000 - $99,999 2,700 113
$100,000 or more 3,400 136
Source: US Energy Information Administration, 2008
12 / U.S. Population and Climate Change, www.cepnet.orgIn More Detail
Experts now say that even if storm intensity and positioned to make key choices that will affect the
frequency associated with climate change does not nation’s future with regard to climate change, and various
increase, the expected growth and density in the U.S. population factors. Their choices with regard to fertility
coastal population, in combination with its associated (how many children they decide to have) and resource
land development and the anticipated increase in and energy consumption (including energy, vehicle,
flooding from sea level rise, will undoubtedly cause transportation and land “use”, recycling, etc) are key.
property losses to increase.73 The decisions they make both individually, collectively as
consumers, in academia, research, business and industry,
and, as voters at the local to national levels, will all deter-
mine trends in population and climate change through-
U.S. COASTAL METRO AREAS out this century.
MOST AFFECTED BY SEA LEVEL RISE
Baby Boomers are a key demographic for
resource and energy consumption. The trend towards
aging of the U.S. population as the proportion of older
tBoston people increases is also significant in relation to climate
tNew York
change. Today’s older population is larger than it has
ever been in the nation’s history, and the overall median
tWashington DC
age in 2000 (35.3 years) was also higher than it has ever
been.75
This segment of the population, the nation’s “Baby
Boomers” (born between 1946 and 1964), represent over
78 million or 26% of the total U.S. population.76 They are
wealthier, spend more money, consume more resources
tNew Orleans including energy, have more homes per capita, and move
more often than any generation before them.77 This
tMiami is important because they represent both a large
Moderately Eroding percent of the total American population and high
Severely Eroding energy consumption, the combination of which is
significant in terms of climate and environmental
The US coastal areas most vulnerable to future sea level
rise are those with “low relief” which are already experiencing impact.
rapid erosion rates, from the Northeast to the Gulf Coast. In addition, a substantial share of America’s popula-
Source: US Global Change Research Program, 2008
tion age 65 and older moves to and settles in “retirement
magnet” states such as Arizona, Florida, and Nevada,
where pressure on natural resources (especially water),
and high energy demand, is already evident. Over the
Population Composition: Age and Income next quarter century, the proportion of elderly Americans
The composition of a population – its age, income, is projected to double in at least 14 states in the coastal
educational level, culture/race, and other characteris- South and arid West.78
tics – can determine where and how people live, move,
vacation, and develop land. Many of these demographic Income is critical to resource and energy use
factors can be linked to climate change. because resource and energy consumption is often associ-
“Age” is a prime example of how demographic factors ated with level of income, or affluence. Evidence shows
can have major implications for climate change in the that as a whole, those more affluent in the population
U.S., and it applies to both the younger and older seg- consume more energy resources and generate more
ments of the population. waste and pollution than do lower-income populations.
The median household income in the U.S. was about
Youth are key in the population and climate $44,000 in 2004.79 In international dollars America has a
change equation. The young demographic in the per capita income of nearly $40,000, compared to about
nation today aged 0-24 is about 35%, and those aged $26,000 for more developed countries, $4,000 for devel-
24-44 are an additional 30%.74 This large segment of the oping countries, and $9,000 globally.80
American population is critical because they are uniquely
13 / U.S. Population and Climate Change, www.cepnet.orgIn More Detail
In America, rising income generally brings about
greater motor vehicle use, resulting in more road- Climate Change in Alaska
building, air pollution, and the CO2 emissions that cause
climate change. And, relative to their share of world The state of Alaska is experiencing some
population, Americans consume disproportionately of the most profound climate change impacts
high amounts of meat and dairy products, which now occurring in the nation. Permafrost thawing
require more land, water, and energy (and produce is causing the ground to subside 16-33 feet
more wastes) compared to diets based on grains and in parts of interior Alaska, and the permafrost
vegetables.81 surface has warmed by about 3.5 oF since
On the flip side, however, affluence can facilitate the 1960s. Summer days without snow have
positive trends by encouraging the consumption of goods increased from fewer than 80 in the 1950s to
that are environmentally sound. People with higher more than 100 in the 1990s. Sea-ice extent has
levels of disposable income are often more inclined shrunk by about 5% over the past 40 years, and
to purchase more expensive, energy efficient “hybrid” the area covered by sea ice declined by about
vehicles, appliances, and lighting, and to purchase 6% from 1978 to 1995. A study of 67 glaciers
higher priced yet more energy-efficient solar powered shows that between the mid-1950s and mid-
panels, recycled paper, organic foods, and other 1990s the glaciers thinned by an average of
environmentally-friendly products as they are generally about 1.6 feet per year, and the rate of thinning
not yet priced for mass consumption at all income had increased to nearly 6 feet more recently.
levels. The state’s annual average temperatures have
warmed up to 1.8 oF per decade over the last
Climate Change and Population: three decades, and winter warming has been
as high as 3 oF per decade.
Effects and Impacts The consequences of global warming for
The relationship between population and climate wildlife species will be severe. An example
change is very complex, however, in simple terms: the is the polar bear, which has been placed on
U.S. population contributes both to the causes of climate the U.S. Endangered Species List. It has been
change (through, for example, accumulated land use designated by the U.S. Interior Department as
changes, high per capita energy use and greenhouse “threatened with extinction because of shrinking
gas emissions), and its effects (where, for example, sea ice”, making it the first creature added to
there are large and/or rapidly growing population the endangered species list primarily because
concentrations in areas that are particularly vulnerable of global warming. Experts say that two-thirds
to the effects of climate change – such as the coastal of the polar bear’s habitat may disappear by
or arid areas of the U.S.). 2050. Polar bears are dependent on hunting
This section describes the major environmen- ringed seals and other prey from sea ice. They
tal and health related “effects” relating to climate are so unsuccessful on land that they spend
change with regard to its population linkages. their summers fasting, losing more than 2
They include: pounds a day. This “forced fast” is now about
three weeks longer than it was 30 years ago.
l altered weather and seasonal patterns
This gives the bears less time to hunt and build
l habitat and biodiversity loss
up the fat reserves they need to survive until
l rising sea levels
ice re-forms in the fall and they can resume
l less available freshwater
hunting. As bears have become thinner, the
l human health threats
reproductive rates of females and survival rates
of cubs have declined. As Arctic ice breaks
up earlier and earlier, bears now come ashore
roughly 22 lbs. lighter and in poorer condition.
The bears’ reduced body condition can lead to
lower reproduction rates, which in the long run
could lead to local extinction.102
14 / U.S. Population and Climate Change, www.cepnet.orgIn More Detail
Altered Weather and Seasonal Patterns
Hurricane Katrina: Population and climate
A main impact of climate change is seen in altered change converge on the coast
weather and seasonal patterns throughout the U.S.
Some of these changes are with us today, and others Hurricane Katrina’s effect on the U.S. Gulf
are predicted by experts to occur in the future, depend- Coast in 2005 demonstrated the hazards of
ing on population factors linked to people’s energy and severe weather events on heavily populated and
resource consumption, and whether or not greenhouse developed coastal areas. For example, climate
gases continue to be generated in a business as usual change appears to be associated with the
scenario. increased intensity of hurricanes. The number
One of the weather-related changes now occurring of severe (Category 4 and 5) hurricanes, like
and expected to continue is an altered water cycle result- Katrina, has nearly doubled worldwide, from 10
ing from higher atmospheric temperatures.82 With higher annually in the 1970s to 18 annually in 1990.
temperatures, more precipitation will fall as rain, and Such storms made up 35% of all hurricanes
less as snow. Both reduced snow pack and earlier snow- in the past decade, compared to 20% in the
melt could reduce river and stream flow in the spring 1970s.108 One cause of this change is thought
and summer, times when supplies are needed most, to be rising ocean temperatures. Since 1970,
particularly for irrigation.83 In some parts of the country, the temperature of the world’s oceans has risen
such as in the West and parts of New England, snow one degree Fahrenheit, while the tracking of
already remains on the ground for a shorter time than temperatures in the Atlantic Ocean shows a
in past decades.84 (See page 17). steady increase in the last several decades.109
Greater fluctuation in precipitation also contributes Because warm surface waters are a source of
to a wider disparity between wet and dry seasons, mak- energy for hurricanes, this trend has probably
ing planning for water supplies and use more difficult. contributed to the shift toward stronger
Although overall precipitation is predicted to increase in hurricanes.110
arid states, decreases in summer months are also likely.85
Similarly, extreme weather events would be more
common. Higher temperatures and more rain falling on
snow would result in rapid thawing, which in turn could
spur flash floods as water rushes into rivers and streams Habitat and Biodiversity Loss
or across dry land.86
Nationwide, more rain can increase pollutant runoff The main cause of biodiversity loss in the U.S. is
from agricultural fields and pavement in urban areas “habitat loss” from land use changes for rapidly occur-
into water systems, a significant problem today. Higher ring, widespread development across the country,
temperatures could be exacerbated as pavement for extraction of energy resources, and other means. These
roads, parking lots, and residential and commercial areas are all linked to increases in population numbers and
(which retain and radiate heat more than natural areas) people’s consumption of land and other resources. Most
spreads along with development and population growth. (85%) of the species known to be at risk for extinction
Reduced ice cover will mean that more heat will be in the U.S. are from habitat loss and alteration.88
absorbed rather than reflected by land and water. Warm, Climate change is already having many impacts on
wet conditions also foster carriers or “vectors” (such as the biological diversity of plant and animal species in the
mosquitoes) that spread diseases like West Nile virus, U.S. Among them is its effect on the composition and
malaria, and dengue fever.87 (See box, page 18). range of the nation’s forests. An increase of 2oF over a
Rises in food prices are partly brought about by period of 100 years, well within the range of current
climate change because it hampers agricultural predictions, can force some tree species’ ideal range
production through altered weather patterns and record to shift about 200 miles northwards.89 As temperatures
droughts around the world, including the U.S. South and and moisture levels increase, some forests will expand,
Southwest. In addition, increased food demand from a in particular southern types (such as oak, hickory, and
growing population, increased gas prices, and increased cypress).90 The tree line in alpine regions could also
speculative demand for biofuels whose crops are being move higher, and New England’s sugar maples are
planting in place of staples such as rice, wheat, and corn moving northward. Drier soil conditions would decrease
have all driven up the price of food. the range and density of some forests, which could be
15 / U.S. Population and Climate Change, www.cepnet.orgIn More Detail
replaced with more extensive grasslands and pasture.91
Increased precipitation could spur the growth of trees Species Threatened by Climate Change
and vegetation, but heat could spur the loss of nutri-
ents.92 Plant and animal species in the U.S.
Spring is arriving sooner now than in the past, and and globally are being affected by what
many indicators show spring is occurring 1-3 weeks researchers call the “double hit” of habitat
earlier than usual.93 In New England, for example, this is loss and climate change. The polar bear
shown by data on river flow and runoff, last-frost dates, is the first species ever to be placed on
air temperature, snow melt, and leafing and flowering the U.S. Endangered Species List due to
patterns.94 climate change (see box, page 14). Yet many
Changes in freshwater temperature are also a factor. other species are also at risk. For example,
An increase of 4-5oF over the next 70 years could reduce climate change is pushing one in eight bird
habitat of coldwater fish by one-fourth to one-third species globally to extinction because of
nationwide.95 Higher water temperatures are also linked the combination of widespread habitat loss
with the bleaching and die-off of coral reefs, and algal and the severe droughts, forest fires, and
blooms which deprive aquatic life of oxygen and light. extreme weather events brought about by
Whether and how species adapt to climate change global warming.
will depend on the pace and geography of the climatic In addition, one third of the planet’s
shifts, how the composition and location of habitats are reef-building corals, including those off the
altered, and the availability of habitat. Many species are U.S. coasts, are threatened with extinction.
already adjusting their migration, breeding, and feed- Built over millions of years, coral reefs are
ing habits in order to survive. But because all parts of home to more than 25% of marine species,
an ecosystem do not adjust to climate shifts in the same making them the most biologically diverse
way, many species could face a lack of food-base, of marine ecosystems. Corals produce reefs
or inadequate habitat. For example, some butterfly in shallow tropical and sub-tropical seas
species are moving northwards in response to tempera- and are highly sensitive to changes in their
ture increases in their home ranges, while egg laying environment. Researchers have identified the
among certain birds and the budding of some trees now main threats to corals as climate change and
occur earlier than in previous decades. 96 localized stresses from destructive fishing,
This is also particularly evident in the Arctic declining water quality from pollution, and
(including Alaska), where retreating sea ice is making the degradation of coastal habitats. Climate
it harder for seals and polar bears – now on the U.S. change causes rising water temperatures
Endangered Species list for threat of extinction – to find and more intense solar radiation, which lead
food.97 (see box, page 14). to coral bleaching and disease often resulting
The species most vulnerable to climate change will be in mass coral mortality.
those with habitat needs afforded only by certain ecosys-
tem types. It will be especially hard for wildlife to adjust Source: IUCN, 2008
in the face of human population and development, since
fragmented, built environments prevent migration to
new habitats. Another key population factor here is that,
given current patterns of land use, there will likely be considerable expansion of sprawling development in the
less habitat available, even if birds and animals can future, with significant implications for ecosystems. For
reach it.98 example, forest and prime farmland made up most (60%)
Another key population factor here is that sprawl of the acreage developed nationwide during the 1980s
development “fragments” or breaks up wildlife habitat. and 1990s.100 At current population growth and rates of
This can have detrimental effects on wildlife as well as sprawling development the U.S. could lose 23 million
diminish the services performed by ecosystems, such as acres of forest land to development by 2050, primarily
the ability of wetlands to filter waste and control flood- due to increases in residential areas.101
ing. As this development paves over land, it compacts
soils, increases flooding and polluting chemical runoff,
and reduces groundwater reserves.99 And, forecasts show
16 / U.S. Population and Climate Change, www.cepnet.orgYou can also read