Deliverable 1.1 Assessment of baseline conditions for all case studies
←
→
Page content transcription
If your browser does not render page correctly, please read the page content below

Deliverable 1.1
Assessment of baseline conditions
for all case studies

Disclaimer: This deliverable has not yet been approved by the European Commission
and should be seen as draft!

Author(s): A. Kleyböcker, C. Bruni, A. Naves Arnaldos, S.
Casas Garriga; F. Fantone, J. van den Broeke, D.                                        Date: 31/05/2021
Iossifidis, A. Gimenez Lorang, I. Sabbah, K., M. Pidou, A.
Reguer, L. Lundgaard, S. Bendix Larsen

             The project leading to this application has received funding from the European Union’s
             Horizon 2020 research and innovation programme under grant agreement No 869318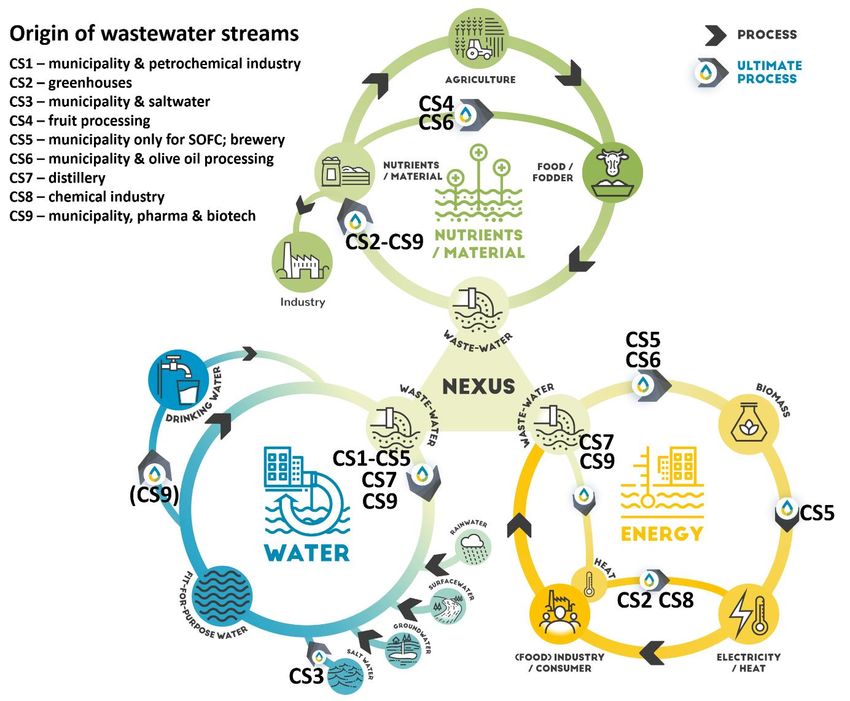
D1.1 Assessment of baseline conditions for all case studies                                                2

Technical References
    Project Acronym                       ULTIMATE
                                          ULTIMATE: indUstry water-utiLiTy symbIosis for a sMarter
    Project Title                         wATer society
                                          Gerard van den Berg
    Project Coordinator                   KWR

    Project Duration                      01.06.2020 – 31.05.2024 (48 months)

    Deliverable No.                       1.1

    Dissemination level 1                 PU

    Work Package                          1

    Task                                  All tasks in WP1

    Lead beneficiary                      KWB

    Contributing                          EUT, UNIVPM, KWR, UCRAIN, AQUALIA, GTG TECH,
    beneficiary(ies)                      SUEZ RR; KALUND, NOVO, GSR

                                          A. Kleyböcker, C. Bruni, A. Naves Arnaldos, S. Casas
                                          Garriga; F. Fantone, J. van den Broeke, D. Iossifidis, A.
    Author(s)
                                          Gimenez Lorang, I. Sabbah, K., M. Pidou, A. Reguer, L.
                                          Lundgaard, S. Bendix Larsen

                                          Sandra Casas Garriga, Christos Makropoulos, Gerard van
    Quality Assurance
                                          den Berg

    Due date of deliverable               May, 31st 2021

    Actual submission date                May, 31st 2021

1   PU = Public
    PP = Restricted to other programme participants (including the Commission Services)
    RE = Restricted to a group specified by the consortium (including the Commission Services)
    CO = Confidential, only for members of the consortium (including the Commission Services)

                  The project leading to this application has received funding from the European Union’s
                  Horizon 2020 research and innovation programme under grant agreement No 869318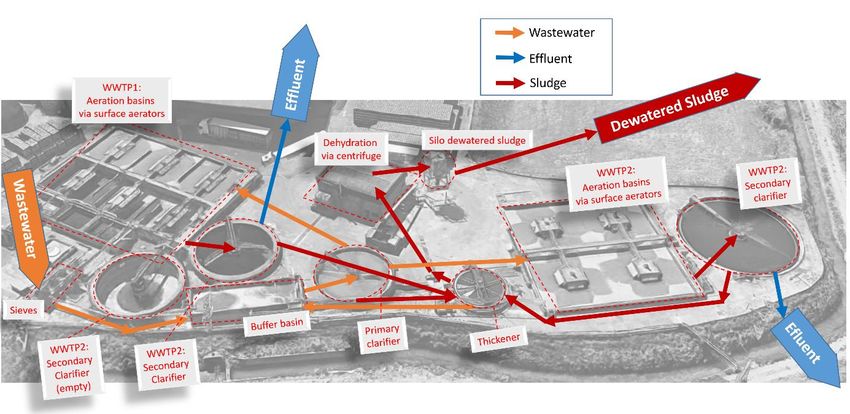
D1.1 Assessment of baseline conditions for all case studies 3
Document history
V Date Author(s) /Reviewer(s) Description
(Beneficiary)
0.1 23rd April A. Kleyböcker (KWB), First version to be submitted to the
C. Bruni (UNIVPM), A. case study leaders
Naves Arnaldos (EUT)
0.2 30th April Case study leaders Reviewed version: each CS leader
reviewed the paragraph of his own
case study
0.3 5th May A. Kleyböcker (KWB), Feedback of the CS leaders
C. Bruni (UNIVPM), A. addressed
Naves Arnaldos (EUT)
0.4 9th May Christian Remy (KWB) Internal review of the whole
document
0.5 14th May A. Kleyböcker (KWB), Feedback of internal reviewer
C. Bruni (UNIVPM), A. addressed
Naves Arnaldos (EUT)
0.6 18th May Christos Makropoulos External review of the whole
(KWR) document
0.7 20th May A. Kleyböcker (KWB), Feedback of the external review
C. Bruni (UNIVPM), A. addressed
Naves Arnaldos (EUT)
0.8 27th May Sandra Casas Garriga Quality control
(EUT), Gerard van den
Berg (KWR)
1 31th May A. Kleyböcker (KWB), Feedback of quality control
C. Bruni (UNIVPM), A. addressed final document
Naves Arnaldos (EUT)
The project leading to this application has received funding from the European Union’s
Horizon 2020 research and innovation programme under grant agreement No 869318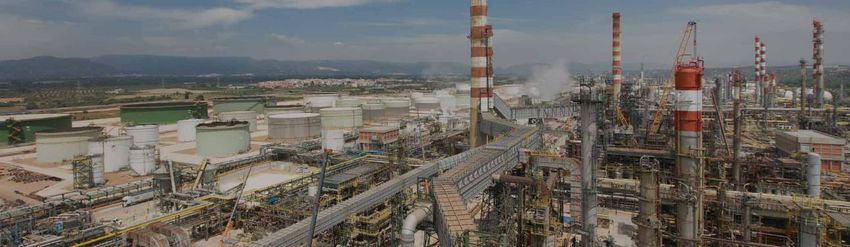
D1.1 Assessment of baseline conditions for all case studies                                         4

Executive Summary
Summary of Deliverable
Ultimate aims to establish and foster water smart industrial symbiosis by implementing
circular economy solutions for water, material and energy recovery. The circular
economy solutions shall create a win-win situation for both the water sector and the
industry. In nine case studies the water sector forms those symbiosis with companies
from the agro-food, beverage, petrochemical, chemical and biotech industry.

Objective of the deliverable and links to other deliverables
This deliverable describes the symbiosis in detail and the situation in the case studies
before the start of Ultimate. A special focus is put on the technological units which were
already in place before Ultimate and the available flow streams as resources for the
new Ultimate solutions.

Relevant data of those flow streams were collected in the frame of this deliverable to
describe the baseline conditions that existed before the start of Ultimate. They will be
used as a basis to quantify the improvements of the case study due to the
implementation of the Ultimate circular economy solutions. The results will be
presented in the deliverables D1.3 –D1.5 New approaches and best practices for
closing the water, energy and material cycles within symbiosis cluster.

Furthermore, other work packages (WP), specifically WP2 and WP5, will need those
data for their life cycle assessments in D2.2 LCA, cost and risk assessment for WSIS
and their KPI tool in D2.5 A KPI Tool for WSIS Performance Assessment as well as
for assessing starting conditions and requirements for other potential replication sites
in D5.6 Three Ultimate WSIS Integrated Assessments, respectively.

The data were collected via excel templates from the case studies. The time period of
the presented data comprises usually one full year of operation. The most important
data are presented in the paragraphs Detailed description of the technological solution
before Ultimate. In the subsequent paragraph Baseline Conditions, those and
additional data are presented in more detail showing average, minimum and maximum
values for each parameter as well as standard deviations. As an outlook for the
expected results from Ultimate, the Ultimate solutions are briefly presented and the
planned key performance indicators, which will be used in the upcoming technological
deliverables (D1.3-D1.5) to evaluate the performance of the Ultimate solutions are
displayed.

Results
The baseline data of the nine case studies showed for all of them high potentials for
the implementation of circular economy solutions. Especially the cooperation of the
industry with the water sector creates a win-win situation for both enabling the
implementation of the Ultimate solutions. Tab. 1 gives an overview of the different
types of resources and their potential for the implementation of recovery technologies
for water, energy and material.

           The project leading to this application has received funding from the European Union’s
           Horizon 2020 research and innovation programme under grant agreement No 869318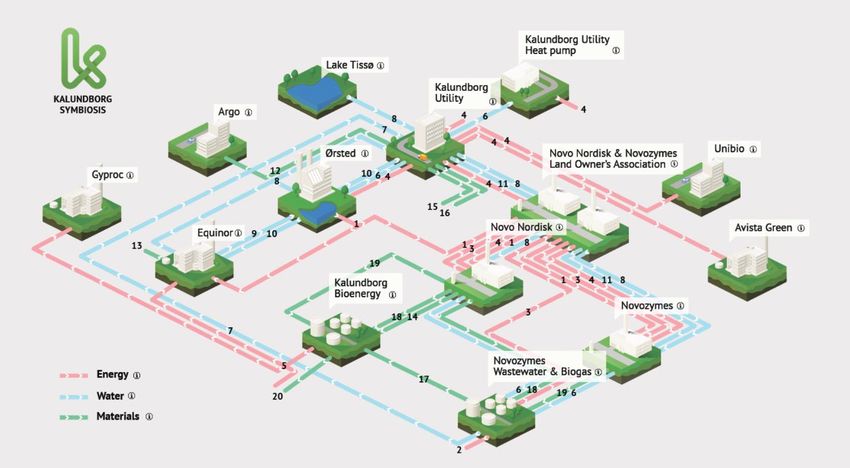
D1.1 Assessment of baseline conditions for all case studies                                                         5

- Water recovery
All types of wastewater ranging from municipal wastewater characterised by the
occurrence of pathogenic organisms up to wastewater from the petro(chemical)
industry with high sulphur and metal concentrations to biotech, beverage and food
industry can be used to recover water. Those wastewaters can be technically treated
until drinking water quality is reached. However, in Europe it is very difficult to use the
reclaimed water for direct potable reuse as the main sources for drinking water
production are surface water and groundwater. Thus, almost all case studies consider
only agricultural irrigation, water supply for cooling towers or for cleaning purposes as
reuse options.

Especially in coastal regions, the intrusion of saltwater in coastal aquifers and sewer
systems increases the chloride concentration in the water and thus, render (salty)
water unsuitable for irrigation. Therefore, to avoid irrigation with salty water, an early
warning system will be developed and implemented to take immediate action during
salinity peaks. As suitable measures, flow splitting and equalisation of the secondary
effluent as well as the potential use of other waters are considered.
Tab. 1 Ultimate case studies and symbiosis with their resources for circular economy concepts
       regarding water, energy and material (WWTP: wastewater treatment plant; SME: small and
       medium enterprise providing water services; WRP: water reclamation plant)

    Case                Water Smart                              Resources                     Closing the cycles
    study           Industrial Symbiosis                                                               of
                                                                                               WATER, ENERGY,
                                                                                                  MATERIAL
 CS1               Internal symbiosis within             Municipal wastewater and
 Tarragona         multi-industry utility:               industrial wastewater from
 (ES)              municipal and industrial              the petrochemical
                   WWTP & urban WRP                      complex
 CS2               Internal symbiosis within             Drain water from
 Nieuw             cooperative:                          greenhouses; residual
 Prinsenland       greenhouses & water                   and geothermal heat
 (NL)              treatment facility
 CS3               Municipal utility, multi-             Municipal wastewater
 Rosignano         industry utility & SME:               mixed with seawater due
 (IT)              Sewer system, municipal               to an undesired intrusion
                   WWTP, WRP                             of the seawater;
                                                         byproducts from industry
                                                         for reuse in water
                                                         treatment
 CS4               Industrial utility & SME:             Wastewater from fruit
 Nafplio           industrial WWTP                       processing industry
 (EL)
 CS5               Municipal utility & multi-            Wastewater from brewery
 Lleida            industry utility:                     & municipal wastewater
 (ES)              industrial WWTP &
                   municipal WWTP
 CS6               Municipal utility & two               Wastewater from olive oil
 Karmiel/          SMEs:                                 production, slaughter-
 Shafdan           two municipal WWTPs &                 houses and wineries &
 (IL)              WRP                                   municipal wastewater

               The project leading to this application has received funding from the European Union’s
               Horizon 2020 research and innovation programme under grant agreement No 869318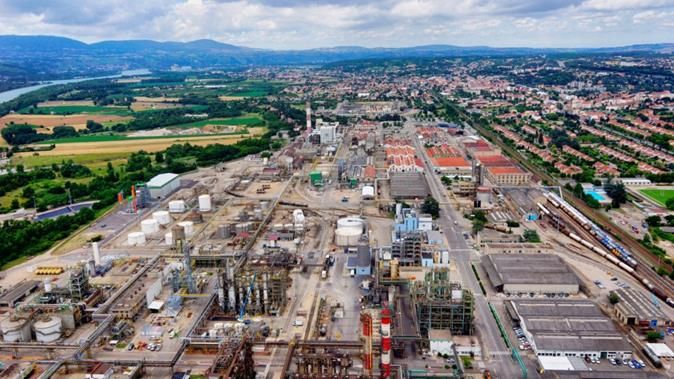
D1.1 Assessment of baseline conditions for all case studies                                             6

 CS7               Distillery, water company,            Wastewater from whiskey
 Tain              & SME:                                distillery
 (UK)              industrial WWTP
 CS8               Internal symbiosis within             Wastewater from
 Chem.             multi-industry utility:               chemical industry
 Platform          industrial WWTP
 Roussillion
 (FR)
 CS9               Municipal utility & multi-            Wastewater from pharma
 Kalundborg        industry utility:                     & biotech industry and
 (DK)              municipal WWTP &                      municipal wastewater
                   industrial WWTP

- Energy recovery
Especially the wastewaters from olive oil production and the distillery contain very high
COD concentrations with 120 g/L and 38 g/L, respectively and thus, are very well suited
for an anaerobic treatment to produce biogas. Also the brewery wastewater as well as
the mix of municipal wastewater with olive mill wastewater are still in a suitable range
for an anaerobic treatment even though their concentrations are much lower and range
between 2 and 4 g/L.

The biogas can further be used to produce electricity and heat via a solid oxide fuel
cell. Hereby, the efficiency of the solid oxide fuel cell is expected to be 1.5-times more
efficient than a combined heat and power unit.

For heat recovery temperatures of wastewaters between 23 °C and 70 °C are
considered and they are found in the biotech and chemical industry, respectively.

- Material recovery
Wastewaters from fruit processing and from olive oil processing plants contain valuable
polyphenols and are suited for the recovery of this high value added product.
Regarding the recovery of nutrients, the ammonium concentration of anaerobically
treated distillery wastewater is promising for ammonia recovery and its further
processing to a fertiliser as ammonium sulphate. The nutrient composition of drain
water from greenhouses is very suitable as a basis to design a fertilising mixture or
product for the greenhouses.

Flue gas washing water resulting from the chemical industry contains enough sulphur
and metals such as copper, zinc, nickel and chromium suggesting their recovery. The
wastewater from the biotech and pharma industry is also characterised by a sufficient
sulphur concentration. In addition, its acetic acid concentration is also high enough to
consider its recovery.

- Reduction of energy and chemicals consumption in plant operation
In wastewater treatment, to avoid fouling processes of the membranes in anaerobic
reactors, an early warning system will be tested in order to save energy due to an
optimised operation of the membranes.

For two neighbouring wastewater treatments plants, a joint control system will be
implemented in order to save energy and chemicals due to a predicted demand driven
oxygen supply and due to the change from a chemical phosphorus removal system to

               The project leading to this application has received funding from the European Union’s
               Horizon 2020 research and innovation programme under grant agreement No 869318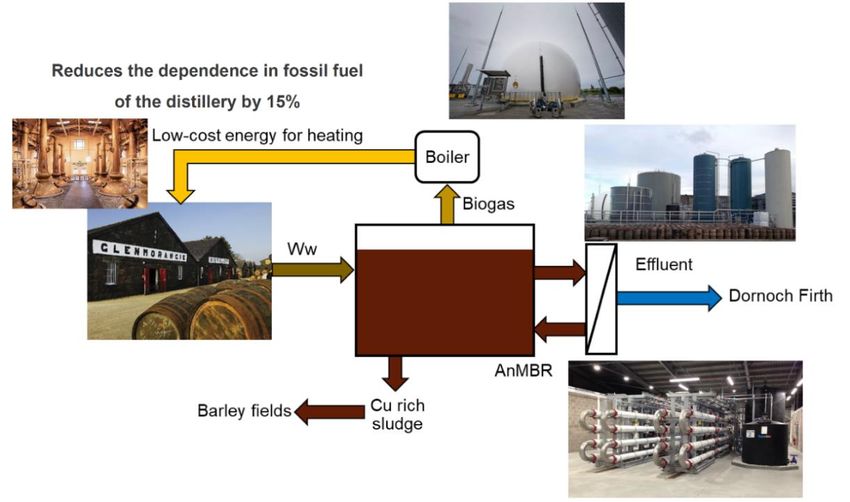
D1.1 Assessment of baseline conditions for all case studies                                         7

an enhanced biological phosphorus removal, respectively. Here the requirement is that
the wastewater treatment plants are connected to each other and that the wastewaters
can be treated together.

Exploitation and Outlook
The presented data that refer to the starting conditions of the case studies will be
further used and presented in the technology evidence base (D1.6 Technology
Evidence Base concept and integration and D1.7 Technology Evidence Base final
version). This technology evidence base will provide valuable information for investors
in such technologies, for operators and engineers as well as for policy and decision
makers, who can use them to define future strategies for boosting industrial symbiosis.
It will be free accessible via the project homepage. After the end of the Ultimate project,
it will be hosted by Water Europe.

           The project leading to this application has received funding from the European Union’s
           Horizon 2020 research and innovation programme under grant agreement No 869318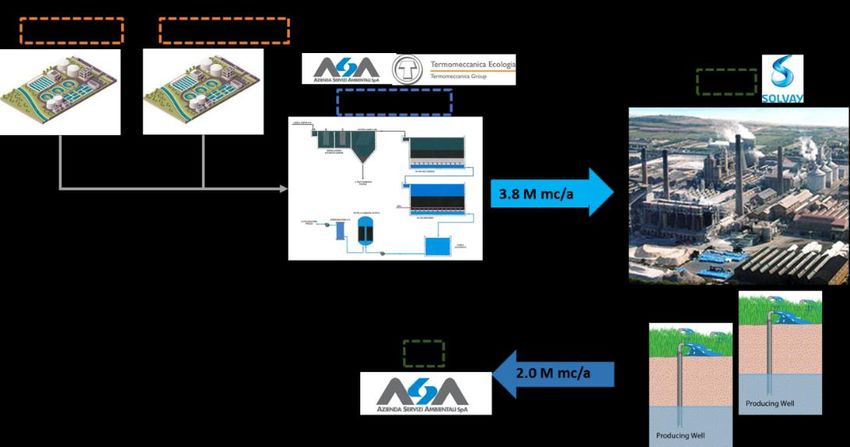
D1.1 Assessment of baseline conditions for all case studies                                         8

Disclaimer
This publication reflects only the author’s views and the European Union is not liable
for any use that may be made of the information contained therein.

           The project leading to this application has received funding from the European Union’s
           Horizon 2020 research and innovation programme under grant agreement No 869318
D1.1 Assessment of baseline conditions for all case studies                                                                        9

Table of Contents

1.         OBJECTIVES AND METHODOLOGY .................................................................... 12
2.         ASSESSMENT OF BASELINE CONDITIONS FOR ALL CASE STUDIES ............. 14
     2.1.   CS1 TARRAGONA (SPAIN) ...................................................................................... 15
     2.1.1.   GENERAL DESCRIPTION OF THE CASE STUDY AND SITE ......................................... 15
     2.1.2.       DETAILED DESCRIPTION OF THE TECHNOLOGICAL SOLUTIONS BEFORE ULTIMATE ... 16
     2.1.3.       BASELINE CONDITIONS ....................................................................................... 17
     2.1.4.       OBJECTIVES OF THE ULTIMATE SOLUTIONS .......................................................... 22
     2.1.5.       SPECIFIC KEY PERFORMANCE INDICATORS (KPIS) OF THE ULTIMATE SOLUTIONS ... 22
     2.2.   CS2 NIEUW PRINSENLAND (NETHERLANDS) ............................................................ 23
     2.2.1.   GENERAL DESCRIPTION OF THE CASE STUDY AND SITE ......................................... 23
     2.2.2.       DETAILED DESCRIPTION OF THE TECHNOLOGICAL SOLUTIONS BEFORE ULTIMATE ... 23
     2.2.3.       BASELINE CONDITIONS ....................................................................................... 26
     2.2.4.       OBJECTIVES OF THE ULTIMATE SOLUTIONS .......................................................... 31
     2.2.5.       SPECIFIC KEY PERFORMANCE INDICATORS (KPIS) OF THE ULTIMATE SOLUTIONS ... 32
     2.3.   CS3 ROSIGNANO (ITALY) ....................................................................................... 34
     2.3.1.   GENERAL DESCRIPTION OF THE CASE STUDY AND SITE ......................................... 34
     2.3.2.       DETAILED DESCRIPTION OF THE TECHNOLOGICAL SOLUTIONS BEFORE ULTIMATE ... 35
     2.3.3.       BASELINE CONDITIONS ....................................................................................... 37
     2.3.4.       OBJECTIVES OF THE ULTIMATE SOLUTIONS .......................................................... 43
     2.3.5.       SPECIFIC KEY PERFORMANCE INDICATORS (KPIS) OF THE ULTIMATE SOLUTIONS ... 43
     2.4.   CS4 NAFPLIO (GREECE) ........................................................................................ 45
     2.4.1.   GENERAL DESCRIPTION OF THE CASE STUDY AND SITE ......................................... 45
     2.4.2.       DETAILED DESCRIPTION OF THE TECHNOLOGICAL SOLUTIONS BEFORE ULTIMATE ... 46
     2.4.3.       BASELINE CONDITIONS ....................................................................................... 46
     2.4.4.       OBJECTIVES OF THE ULTIMATE SOLUTIONS .......................................................... 47
     2.4.5.       SPECIFIC KEY PERFORMANCE INDICATORS (KPIS) OF THE ULTIMATE SOLUTIONS ... 49
     2.5.   CS5 LLEIDA (SPAIN) .............................................................................................. 50
     2.5.1.   GENERAL DESCRIPTION OF THE CASE STUDY AND SITE ......................................... 50
     2.5.2.       DETAILED DESCRIPTION OF THE TECHNOLOGICAL SOLUTIONS BEFORE ULTIMATE ... 50
     2.5.3.       BASELINE CONDITIONS ....................................................................................... 52
     2.5.4.       OBJECTIVES OF THE ULTIMATE SOLUTIONS .......................................................... 55
     2.5.5.       SPECIFIC KEY PERFORMANCE INDICATORS (KPIS) OF THE ULTIMATE SOLUTIONS ... 56
     2.6.   CS6 KARMIEL AND SHAFDAN (ISRAEL) .................................................................... 58
     2.6.1.   GENERAL DESCRIPTION OF THE CASE STUDY AND SITE ......................................... 58
     2.6.2.       DETAILED DESCRIPTION OF THE TECHNOLOGICAL SOLUTIONS BEFORE ULTIMATE ... 58

                  The project leading to this application has received funding from the European Union’s
                  Horizon 2020 research and innovation programme under grant agreement No 869318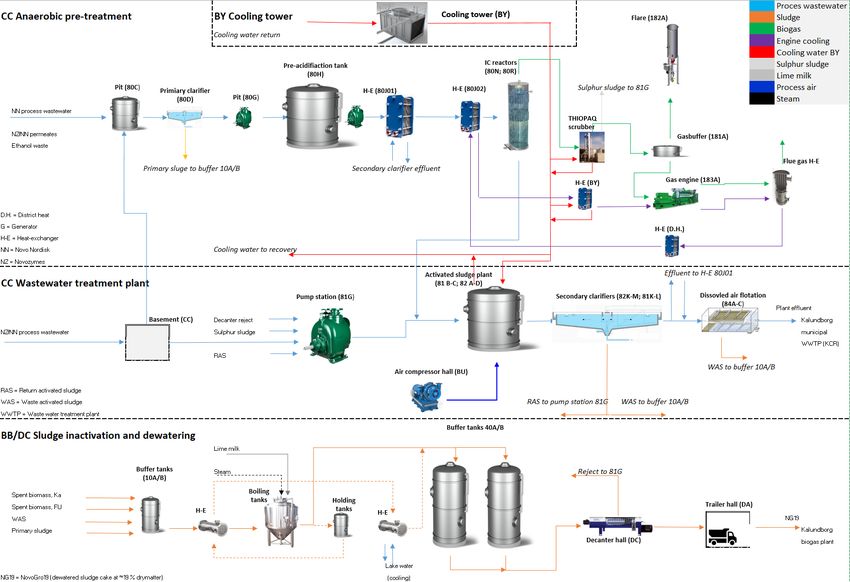
D1.1 Assessment of baseline conditions for all case studies                                                                       10

     2.6.3.      BASELINE CONDITIONS ....................................................................................... 61
     2.6.4.      OBJECTIVES OF THE ULTIMATE SOLUTIONS .......................................................... 64
     2.6.5.      SPECIFIC KEY PERFORMANCE INDICATORS (KPIS) OF THE ULTIMATE SOLUTIONS ... 65
     2.7.   CS7 TAIN (UNITED KINGDOM) ................................................................................ 66
     2.7.1.   GENERAL DESCRIPTION OF THE CASE STUDY AND SITE ......................................... 66
     2.7.2.      DETAILED DESCRIPTION OF THE TECHNOLOGICAL SOLUTIONS BEFORE ULTIMATE ... 66
     2.7.3.      BASELINE CONDITIONS ....................................................................................... 68
     2.7.4.      OBJECTIVES OF THE ULTIMATE SOLUTIONS .......................................................... 71
     2.7.5.      SPECIFIC KEY PERFORMANCE INDICATORS (KPIS) OF THE ULTIMATE SOLUTIONS ... 72
     2.8.   CS8 CHEMICAL PLATFORM OF ROUSSILLON (FRANCE) ............................................ 73
     2.8.1.   GENERAL DESCRIPTION OF THE CASE STUDY AND SITE ......................................... 73
     2.8.2.      DETAILED DESCRIPTION OF THE TECHNOLOGICAL SOLUTIONS BEFORE ULTIMATE ... 74
     2.8.3.      BASELINE CONDITIONS ....................................................................................... 76
     2.8.4.      OBJECTIVES OF THE ULTIMATE SOLUTIONS .......................................................... 78
     2.8.5.      SPECIFIC KEY PERFORMANCE INDICATORS (KPIS) OF THE ULTIMATE SOLUTIONS ... 78
     2.9.   CS9 KALUNDBORG (DENMARK) .............................................................................. 80
     2.9.1.   GENERAL DESCRIPTION OF THE CASE STUDY AND SITE ......................................... 80
     2.9.2.      DETAILED DESCRIPTION OF THE TECHNOLOGICAL SOLUTIONS BEFORE ULTIMATE ... 81
     2.9.3.      BASELINE CONDITIONS ....................................................................................... 84
     2.9.4.      OBJECTIVES OF THE ULTIMATE SOLUTIONS .......................................................... 88
     2.9.5.      SPECIFIC KEY PERFORMANCE INDICATORS OF THE ULTIMATE SOLUTIONS .............. 89

3.         SUMMARY AND CONCLUSIONS .......................................................................... 90

                 The project leading to this application has received funding from the European Union’s
                 Horizon 2020 research and innovation programme under grant agreement No 869318
D1.1 Assessment of baseline conditions for all case studies 11
Abbreviations
AAT Advanced Anaerobic Technology
AD Anaerobic Digestion
AOP Advanced Oxidation Process
BOD Biological Oxygen Demand
CE Circular Economy
CFU Colony-Forming Unit
COD Chemical Oxygen Demand
CTG Cross-cutting Technology Group
ELSARTM Electrostimulated Anaerobic Reactor
GAC Granular Activated Carbon
HT-ATES High-Temperature Aquifer Thermal Energy Storage
IEX Ion exchanger
iWWTP Industrial Wastewater Treatment Plant
KPI Key Performance Indicator
nZLD Near Zero Liquid Discharge
OMW Olive Mill Wastewater
PAC Powdered Activated Carbon
PPP Public Private Partnership
RO Reverse Osmosis
SAT Soil Aquifer Treatment
SBP Small Bioreactor Platform
SCWE Subcritical Water Extraction
SME Small and Medium-sized Enterprises
TOC Total Organic Carbon
UF Ultrafiltration
WP Work Package
WWTP Wastewater Treatment Plant
WRP Water Reclamation Plant
WWRP Wastewater Reuse Plant
The project leading to this application has received funding from the European Union’s
Horizon 2020 research and innovation programme under grant agreement No 869318D1.1 Assessment of baseline conditions for all case studies 12
1. Objectives and methodology
Work package (WP) 1 aims to demonstrate the feasibility of innovative technological
solutions in order to foster circular economy in the water sector. Therefore, so called
water smart industrial symbiosis between the industrial sector and service providers
lead to a mutual advantage of both via a synergetic cooperation. In those symbioses
demonstrated at nine case studies, the water, material and energy cycles are closed
also, considering the nexus between the three cycles. WP1 will provide the necessary
data to assess the benefits of the technologies (WP2) and the evidence to convince
stakeholders of these benefits (WP3), while overcoming the social and governance
barriers and creating new business models to promote the implementation of those
solutions (WP5 & WP6).
This deliverable presents the situation before Ultimate including relevant data of the
different flow streams serving as a resource for the new Ultimate solutions. Hereby, for
each case study, the already existing symbiosis between the water sector and the
industrial sector is explained and presented together with the detailed description of
the technological system before Ultimate started. The relevant parameters referring to
that system are presented in detail as baseline conditions. Based on those conditions
the need and the potential for the innovative technologies to be implemented in the
frame of Ultimate are concluded together with the description of the extension and/or
intensifying of the symbioses that are necessary to implement the Ultimate solutions.
As an outlook for the expected results from Ultimate, the Ultimate solutions are briefly
presented and the planned key performance indicators, which will be used in the
upcoming technological deliverables (D1.3-D1.5) to evaluate the performance of the
Ultimate solutions are displayed.
The data describing the baseline conditions of each case study will be used in the
course of the project as a basis to quantify the improvements of the case study after
the implementation of the Ultimate circular economy solutions. Furthermore, WP2 will
need those data for the evaluation of the circular economy solutions for example by
using life cycle assessments or key performance indicators (KPIs).
For WP5, the starting conditions of each case study will be very interesting, since they
want to find replications sites which should provide similar conditions in order to
successfully implement similar concepts.
The baseline conditions have been obtained through interviews and systematic data
collection through templates, which have been adapted for each site considering its
particularities.
Based on these general aspects, specific KPIs and parameters for each site have been
compiled in spreadsheets, gathering technical data from at least a complete year of
monitoring. The spreadsheets collected have been complemented with information
from the living documents describing the symbioses, the sites and the technical
solutions that were already in place before the start of the project. This information has
been compiled, assessed and summarised in this deliverable.
The project leading to this application has received funding from the European Union’s
Horizon 2020 research and innovation programme under grant agreement No 869318D1.1 Assessment of baseline conditions for all case studies 13
Two types of KPIs were chosen: case study-specific KPIs aim to quantitatively
showcase the impact of the circular economy solutions while technology-specific KPIs
shall show, how efficient a technology is and may enable a comparison to similar
technologies. For the KPIs, based on the first suggestions of the case studies, the CTG
leaders proposed additional KPIs in order to be consistent for the whole work package.
For each case study, the collection of KPIs was listed in a PowerPoint presentation.
Those were presented, send back to the case study and, when necessary, were
discussed with the case study partners. The final version of the KPIs was confirmed
by the case study partners and is presented in this document. However, KPIs might
change during the project, if the partners feel that additional KPIs might be of interest
or better fit the demonstration character of the cases.
The project leading to this application has received funding from the European Union’s
Horizon 2020 research and innovation programme under grant agreement No 869318D1.1 Assessment of baseline conditions for all case studies 14
2. Assessment of baseline conditions
for all case studies
Ultimate aims to promote, establish and extend water smart industrial symbiosis
between service providers from the water sector and the industrial sector. In the
Ultimate case studies, the industrial sector consists of the agro-food, beverage,
petrochemical, chemical and biotech industry. As service providers in the water sector,
municipal utilities, multi-industry utilities, specialised small and medium enterprises
and water service providers are involved. The nine case studies are located in different
European countries and Israel. There, innovative technologies are developed,
demonstrated and optimised to create a win-win situation for both, the industrial and
the water sector (Fig. 1).
Fig. 1 Ultimate case studies
The following chapters provide a detailed description of the case studies and their
baseline conditions before Ultimate started. Furthermore, the technological objectives
are described and specific KPIs for innovative technologies are presented.
The project leading to this application has received funding from the European Union’s
Horizon 2020 research and innovation programme under grant agreement No 869318D1.1 Assessment of baseline conditions for all case studies 15
2.1. CS1 Tarragona (Spain)
2.1.1. General description of the case study and site
The Petrochemical Complex of Tarragona (Spain) is an industrial area that groups
several companies related to the chemical and oil fields (Fig. 2). This complex started
its operation in 1971, with the construction of the first refinery, and since then its activity
has progressively grown until being considered one of the most important of this type
in Catalonia, Spain and southern Europe. The more than 30 companies that form this
complex, from which we can highlight companies like Repsol (chemical, petroleum and
gas), Bayer, BASF, ERCROS, Cepsa, Bic or The Dow Chemical Company, are mainly
focused on the production of chlorine, alkaline salts, oxygen gas, fertilisers,
insecticides, fuels, plastics and synthetic essences.
Fig. 2 Petrochemical complex of Tarragona
Aguas Industriales de Tarragona Sociedad Anónima (AITASA) is a private company
founded in 1965 to supply water to industries, mainly the chemical industries that were
then being stablished in the Tarragona complex. AITASA supplies water for industrial
and drinking uses to the complex from groundwater and reclaimed water production.
In order to meet its water demands in both the industry and households, Tarragona’s
region has traditionally relied on water transfers from the Ebro River via a system that
was built back in 1989. However, the increasing water demand from the industry
outpaced the system’s capacity, which led to the implementation of a reclamation plant
to feed industrial water only and to avoid consuming resources of the drinking water
production.
Since 2012, AITASA operates the Water Reclamation Plant (WRP) of Camp de
Tarragona producing water for boilers and cooling towers (Fig. 3). This locally available
additional water supply replaces surface water supplies that were transferred from the
Ebro River some years ago for the use at the petrochemical park. As a result, an
equivalent volume of surface water is available for urban water supply in the coastal
areas of Tarragona province. By developing this new and locally available water supply
source, industrial growth in a water scarce region has been supported, while promoting
local industry’s sustainability.
Currently, a construction of an industrial wastewater treatment plant (iWWTP) is taking
place (expected to be commissioned in December 2021) to treat industrial wastewater
from the different companies of the complex.
The project leading to this application has received funding from the European Union’s
Horizon 2020 research and innovation programme under grant agreement No 869318D1.1 Assessment of baseline conditions for all case studies 16
Fig. 3 Scheme of the pre-existing system and the partners of the symbiosis before the start of Ultimate
2.1.2. Detailed description of the technological solutions before
Ultimate
The Tarragona and Vilaseca-Salou wastewater treatment plants (WWTPs) were
interconnected by a 4-km pipeline to ensure that the WRP can be supplied with enough
secondary effluent from either or both WWTPs. Secondary effluent undergoes a basic
reclamation process at the WRP (1021 m3/h average inlet flow rate), consisting of a
ballasted clarification step, followed by disc filtration, multimedia filtration and sand
filtration. The effluent undergoes an advanced reclamation process including a two-
pass RO treatment processes and disinfection, using ultra-violet light and chlorine,
before it enters the reclaimed water distribution system (Fig. 4).
Furthermore, chemical reagents such as coagulant, flocculant and antiscaling are
added to enhance the plant performance.
Fig. 4 AITASA WRP process diagram
Cooling water supply has been one of the main expected uses of reclaimed water
produced at the Camp de Tarragona WRP. Reclaimed water for cooling towers supply
had to meet the quality requirements established by the Spanish reclaimed water
regulations (RD 1620/2007) and also the operational specifications applicable to the
cooling water systems considered, like concentration limits for ammonia, phosphates,
5-day biochemical oxygen demand (BOD5), total organic carbon (TOC), chemical
oxygen demand (COD), electrical conductivity, chloride, sulphate, calcium and
alkalinity. One of the parameters most restrictive is ammonia, that is removed in the
reverse osmosis process (970 m3/h average inlet flow rate to this unit), achieving a
removal effectiveness higher than 97%. For the rest of the parameters, the removal
effectiveness after WRP treatment is 98.6% conductivity, 71.6% COD, 82.4% sulphate,
99.1% total alkalinity and 96.2% orthophosphate.
The daily energy consumption of these facilities (WRP) is 27080 kWh.
The project leading to this application has received funding from the European Union’s
Horizon 2020 research and innovation programme under grant agreement No 869318D1.1 Assessment of baseline conditions for all case studies 17
On the other hand, in order to meet future water requirements (BREF limits), an
industrial wastewater treatment plant (iWWTP) will be commissioned by the end of
2021 to polish the aggregated wastewater from the petrochemical complex with an
average water flow rate of 1348 m³/h. The technology train to be implemented in these
new facilities will be:
- Dissolved air flotation
- Biological membranes reactor
- Granular activated carbon
It is assumed that 1.01 m3/h sludge (value from design) will be produced as waste.
2.1.3. Baseline conditions
Tab. 2 shows the relevant parameters to describe the baseline conditions that existed
before the start of Ultimate. Those data were collected in the frame of this deliverable
to make them available to other work packages and to compare them to the results
that will be obtained after the implementation of the Ultimate circular economy
solutions in order to quantify the improvements.
The project leading to this application has received funding from the European Union’s
Horizon 2020 research and innovation programme under grant agreement No 869318D1.1 Assessment of baseline conditions for all case studies 18
Tab. 2 CS1: Baseline conditions of water related parameters
BASELINE - CURRENT SYSTEM
Standard Frequency and no.
Parameter Units Mean value Comments
deviation of measurements
WRP inlet water flow rate m3 /h 1021 704
Daily 1/1-5/4/2021
3
WRP outlet water flow rate m /h 646 108
Water yield of iWWTP inlet water flow rate m3 /h 1348
Current system Design value (nominal)
the system iWWTP outlet water flow rate m3 /h 1348
Advanced RO inlet water flow rate m3 /h 970 133
Daily 1/1-5/4/2021
Advanced RO outlet water flow rate m3 /h 646 79
pH upH 7,8 0,1
Temperature ºC 18,2 1
Conductivity mS/cm 2150 222,2
Redox potential mV 217,8 18,1
Turbidity NTU 10,7 8
MSS mg/L 20,7 12,1
WRP inlet DQO mg O2 /L 52,9 18,8
1/2/2021-31/3/2021
Water quality (Reclamation Total alkalinity ºFr 31,7 2,7
(Monday-Friday)
plant) Dissolved oxygen mg O2 /L 8,7 0,6
Ammonium mg NH4 -N/L 35,9 5,3
Total chlorine mg Cl2 /L 0,2 0,1
Monochloramines mg Cl2 /L 0,1 0
Sulphate mg/L 227,6 54,3
Orthophosphate mg P 2 O5 /L 1,3 0,8
pH upH 5,6 0,3
Temperature ºC 18,7 1
Conductivity mS/cm 30,7 15,7
Redox potential mV 688,8 30,4
Turbidity NTU 0,2 0,1
MSS mg/L 0 0
WRP outlet DQO mg O2 /L 15 0
1/2/2021-31/3/2021
Water quality (Reclamation Total alkalinity ºFr 0,3 0,2 (Monday-Friday)
plant) Dissolved oxygen mg O2 /L 9,4 0,3
Ammonium mg NH4 -N/L 0,9 0,4
Total chlorine mg Cl2 /L 1,9 1,3
Monochloramines mg Cl2 /L 0,5 0,6
Sulphate mg/L 40 0
Orthophosphate mg P 2 O5 /L 0,05 0
The project leading to this application has received funding from the European Union’s
Horizon 2020 research and innovation programme under grant agreement No 869318D1.1 Assessment of baseline conditions for all case studies 19
BASLINE-CURRENT SYSTEM
Standard Frequency and no.
Parameter Units Mean value
deviation of measurements
pH upH 7,1 0,3
Temperature ºC 18,4 0,9
Conductivity mS/cm 2221,2 279
Redox potential mV 504,3 47,1
Turbidity NTU 0,8 0,1
MSS mg/L 7,9 2,5
DQO mg O2 /L 23,8 5,2
Advanced RO Total alkalinity ºFr 20,4 3,1 1/2/2021-31/3/2021
Water quality Dissolved oxygen mg O2 /L 9,2 0,3
inlet (Monday-Friday)
Ammonium mg NH4 -N/L 34 5,4
Total chlorine mg Cl2 /L 2,6 1,4
Monochloramines mg Cl2 /L 0,4 0,2
Sulphate mg/L 218,2 53,4
Orthophosphate mg P 2 O5 /L 0,1 0
Iron mg/L 0,1 0,1
Aluminium mg/L 0,04 0
pH upH 5,6 0,3
Temperature ºC 18,7 1
Conductivity mS/cm 30,7 15,7
Redox potential mV 688,8 30,4
Turbidity NTU 0,2 0,1
MSS mg/L 0 0
Advanced RO DQO mg O2 /L 15 0
1/2/2021-31/3/2021
Water quality outlet (=WRP Total alkalinity ºFr 0,3 0,2 (Monday-Friday)
outlet) Dissolved oxygen mg O2 /L 9,4 0,3
Ammonium mg NH4 -N/L 0,9 0,4
Total chlorine mg Cl2 /L 1,9 1,3
Monochloramines mg Cl2 /L 0,5 0,6
Sulphate mg/L 40 0
Orthophosphate mg P 2 O5 /L 0,05 0
The project leading to this application has received funding from the European Union’s
Horizon 2020 research and innovation programme under grant agreement No 869318D1.1 Assessment of baseline conditions for all case studies 20
BASELINE - CURRENT SYSTEM
Standard Frequency and no.
Parameter Units Mean value Comments
deviation of measurements
pH upH 7,5
Conductivity mS/cm 12091
MSS mg/L 82
Hydrocarbons mg/L 2,5
DBO5 mg/L 89
DQO mg/L 237
TOC mg/L 79
Chromium mg/L 10
Copper mg/L 21
iWWTP inlet
Nickel mg/L 30
Water quality (industrial Design value (nominal)
Zinc mg/L 464
plant)
Lead mg/L 11
Cadmium mg/L 4
Mercury mg/L 1,6
Chloride mg/L 3120
Total nitrogen mg/L 36
Nitrogen inorganic mg/L 8
Total phosphorus mg/L 3
Benzene mg/L 75
AOX mg/L 2,1
MSS mg/L 1
Hydrocarbons mg/L 0,1
DQO mg/L 50,5
TOC mg/L 17
Chromium mg/L 5
Copper mg/L 10,5
Nickel mg/L 28,5
iWWTP outlet
Zinc mg/L 138
(Industrial Calculated design value (nominal)
Lead mg/L 8,8
plant)
Cadmium mg/L 3,2
Mercury mg/L 0,2
Total nitrogen mg/L 16
Nitrogen inorganic mg/L 3,6
Total phosphorus mg/L 1,5
Benzene mg/L 41
AOX mg/L 0,7
The project leading to this application has received funding from the European Union’s
Horizon 2020 research and innovation programme under grant agreement No 869318D1.1 Assessment of baseline conditions for all case studies 21
BASELINE - CURRENT SYSTEM
Standard Frequency and no.
Parameter Units Mean value Comments
deviation of measurements
Energy Current system
Whole system kWh/day 27080 Daily 1/1-5/4/2021
consumption (WRP)
Coagulant (pre-treatmemt) kg/L 1,36 PAX-14
Flocculent (pre-treatment) g/L 1,5 HYDREX 6171 (0,15%)
Reagents Current system Established dosage flow rates
Organic coagulant (filtration) kg/L 1,05 HYDREX 3495 (10%)
required (WRP) (2021)
Antiscaling (Reverse Osmosis) kg/L 1,11 HYDREX 4106
Reclaimed water (outlet) kg/L 1,242 Sodium hypochlorite (15%)
Waste
iWWTP Sludge from iWWTP m3/h 1,01 Designed value (nominal)
produced
The project leading to this application has received funding from the European Union’s
Horizon 2020 research and innovation programme under grant agreement No 869318D1.1 Assessment of baseline conditions for all case studies 22
2.1.4. Objectives of the Ultimate solutions
CS1 aims to extend the water synergies already implemented in the complex by
increasing water availability for future demands with new reclaimed water production
from the industrial WWTP. The aim of CS1 is to further close the loop of water in the
complex, reclaiming water from the future iWWTP with near ZLD systems and
optimising the current urban WRP so to maximise its water production and diminish
the energy consumption. Thus, CS1 will also aim at reducing energy consumption of
the current urban WRP while maximising its recovery.
New near zero liquid discharge (nZLD) treatment system
A new nZLD treatment coupling advanced reverse osmosis and membrane distillation
for reclaiming water from the industrial WWTP will be demonstrated at pilot scale to
obtain a new industrial water source for the complex.
Ammonia removal via a zeolite adsorption-based technology
Additionally, new low-cost treatments based on zeolite adsorption for the removal of
ammonia from the current urban WRP will be demonstrated to diminish the current
reclaimed water production costs and increase the water yield of the system. Those
possible zeolite treatments will be studied at bench-scale and the most economical
and technically feasible will be implemented at pilot-scale
Concept study for fit-for-purpose water
The symbiosis between the industry with 30 companies and the industrially owned
multi-utility will foster the integration of the industrial reclaimed water production into
fit-for-purpose water production for covering the local industrial demand. Therefore, a
concept study will be conducted to study the future uses of the reclaimed water.
2.1.5. Specific key performance indicators (KPIs) of the Ultimate
solutions
The case study specific key performance indicators (KPIs) shown in Tab. 3 will be
determined during the project in order to evaluate the improvement of the technological
solutions to be developed and implemented in Ultimate. They will serve as a basis for
the different assessments to be performed in WP2 such as the life cycle assessments
and life cycle costing analyses and for other WPs.
Tab. 3 Specific KPIs in CS1 and parameters to be determine
Topic Objectives Specific KPIs
Water Fit-for-purpose water - Water yield
reclamation from WWTP - Water quality
effluent and water reuse. - Specific energy consumption
- Reagents and materials required
Ammonia removal with a low- - Waste produced
cost technology
The project leading to this application has received funding from the European Union’s
Horizon 2020 research and innovation programme under grant agreement No 869318D1.1 Assessment of baseline conditions for all case studies 23
2.2. CS2 Nieuw Prinsenland (Netherlands)
2.2.1. General description of the case study and site
Coöperatieve Tuinbouw Water Zuivering de Vlot is a wastewater treatment facility
located at ‘s-Gravenzande treating 160 hectares (60 companies) of drain water from
greenhouses mainly growing ornamental crops (Fig. 5). By exploring water and nutrient
reuse opportunities for their facility, they are optimising their system for internal
symbiosis within their own facility and external symbiosis with neighbouring
greenhouses and industries.
Fig. 5 De Vlot wastewater treatment plant facility
2.2.2. Detailed description of the technological solutions before
Ultimate
The current system treats drain water from 60 greenhouses (160 ha) and has a
capacity for a flow rate of 60 m3/h (Fig. 6). However, the normal flowrate is usually
around 40 m3/h. The inlet water stream from the greenhouses is water with a high salt
content (2.14 mS/cm) and contains pathogens (34 CFU/L E. Coli, 29 CFU/mL
coliforms, 71000 CFU/mL, aerobic colony bacteria, 120 CFU/mL molds/yeast, 240
CFU/mL Enteriobacteriaceae). The process steps are shown in Fig. 6 and as follows:
Pre-filtration by vibrating and rotating filters: suspended solids removal
Coagulation in sedimentation buffers: P removal.
Sand filtration with glycerol dosage: N removal, achieving effectiveness higher
than 28% for ammonia removal and 5% for nitrate. Initially, a target of 75%
nitrogen removal was established with the addition of glycerol, however the
The project leading to this application has received funding from the European Union’s
Horizon 2020 research and innovation programme under grant agreement No 869318D1.1 Assessment of baseline conditions for all case studies 24
dosage of glycerol was stopped prematurely due to a contamination of the slow
sand filter.
Activated carbon: crop protection agent removal
The current status at De Vlot is that they cannot handle this capacity yet. The
sedimentation tanks are working. The sand filters are giving problems which they hope
to tackle if they use gravity for the pass instead of a vacuum. Also, backwashing helped
for a few hours, however, the system is not designed for backwashing so the pump
capacity is not sufficient for a good backwash for all three filters. The pressure is too
low to reach the furthest filter. Only after the sand filter is working, they will start with
the activated carbon to remove plant protection agents first.
The wastewater stream from the greenhouse is currently discharged to the sewer,
although it contains high concentrations of nutrients (worth up to 3.5 €/m³) and also
represents value for the water itself (0.6 €/m³). In 2027, greenhouses in the
Netherlands will need to remove all crop-protection agents and nutrients from their
wastewater, before it can be discharged. Therefore, it is really interesting to have the
possibility to use this re-water and its resources for greenhouse irrigation.
Greenhouses require energy for heating during winter periods. Currently, they are
being heated with fossil energies. The use of more sustainable energy sources for
heating greenhouses is being explored, amongst others driven by the target of climate
neutral horticulture by 2040, as laid down in the horticulture agreement
(Tuinbouwakkoord). Currently, in several areas in the Netherlands, fossil free heating
of greenhouses is prepared by using a geothermal source. To make optimal use of the
residual heat supply, there needs to be a balance in demand and supply. The amount
of geothermal heat available is fairly constant throughout the year, as geothermal wells
are ideally operated under stable conditions, at a stable capacity. Therefore, they
cannot rapidly adjust to changes in heat demand.
In greenhouse areas there are high peak demands during cold periods. Therefore,
balancing demand and supply by storing excess heat produced in times of low demand
(summer) and using it to supplement the supply capacity in times of high demand
(winter time) would allow for optimising of the design of the geothermal plants. A high
temperature aquifer thermal energy storage (HT-ATES) is a possible solution to store
the excess heat produced during the summer months (Fig. 7).
The project leading to this application has received funding from the European Union’s
Horizon 2020 research and innovation programme under grant agreement No 869318D1.1 Assessment of baseline conditions for all case studies 25
Fig. 6 CS2 process diagramme of the pre-existing system
The project leading to this application has received funding from the European Union’s
Horizon 2020 research and innovation programme under grant agreement No 869318D1.1 Assessment of baseline conditions for all case studies 26
Fig. 7 Heat supply vs demand across the year (source: Hartog, N., M. Bloemendal, E. Slingerland and
W. A. van (2017). "Duurzame warmte gaat ondergronds." VV+ sept-okt 17)
2.2.3. Baseline conditions
Tab. 4 and Tab. 5 show the relevant parameters to describe the baseline conditions
that existed before the start of Ultimate. Those data were collected in the frame of this
deliverable to make them available to other work packages and to compare them to
the results that will be obtained after the implementation of the Ultimate circular
economy solutions in order to quantify the improvements.
The project leading to this application has received funding from the European Union’s
Horizon 2020 research and innovation programme under grant agreement No 869318D1.1 Assessment of baseline conditions for all case studies 27
Tab. 4 CS2: Baseline conditions of water related parameters
BASELINE - CURRENT SYSTEM
Mean value Standard Frequency and no,
Parameter Units Comments
2020 deviation of measurements
Based on specific location of the site rainfall can range from 875 -1125 mm/year.
Monthly, 35 stations Source: https://www.knmi.nl/nederland-nu/klimatologie/gegevens/monv,
Rainfall climatology of the area mm/year 937,74 88,04
for region 7 https://cdn.knmi.nl/knmi/map/page/klimatologie/gegevens/monv/jonv_2020.p
df. Data given in CS2 data excel
Water yield of
Current system
Volume of water recovered vs rainfall m3 /year NA
the system
3
Water inlet flow rate m /h 40 _ _ As specified by the water operator at de Vlot, The maximum capacity is 60 m3 /h
As specified by the water operator at de Vlot. Currently, the system is having
Water outlet flow rate m3 /h 20 - 40 _ _ operational issues, The planned value is 40 m3 /h so that they can have (nearly
permanently) 1 street in maintenance if required
COD mg O2 /L Currently not measured
BOD (influent de Vlot) mg O2 /L 3,45 1,51 Weekly, 11 Measurements started in September 2020
BOD (effluent street A) mg O2 /L 4,25 2,5 Weekly, 5 -11 Measurements started in September 2020
pH (influent de Vlot) upH 7,32 0,16 Bi-weekly, 25 Measurements from 2007 onward and after 2020 are given in the CS 2 data excel
pH (effluent street A) upH 7,22 0,11 Bi-weekly, 25 Measurements from 2007 onward and after 2020 are given in the CS 2 data excel
EC (influent de Vlot) mS/cm 2,14 0,43 Bi-weekly, 25 Measurements from 2007 onward and after 2020 are given in the CS 2 data excel
EC (effluent street A) mS/cm 2,17 0,24 Bi-weekly, 25 Measurements from 2007 onward and after 2020 are given in the CS 2 data excel
TSS mg/L Currently not measured
Turbidity NTU Currently not measured
N, Kjeldahl mg /L Currently not measured
Ammonium (influent de Vlot) mg /L 1,94 1,21 Bi-weekly, 25 Measurements from 2007 onward and after 2020 are given in the CS 2 data excel
Ammonium (effluent street A) mg /LD1.1 Assessment of baseline conditions for all case studies 28
BASELINE - CURRENT SYSTEM
Mean value Standard Frequency and no,
Parameter Units Comments
2020 deviation of measurements
Energy
Current system Whole system kWh/m3 0,5 _
consumption 1 Based on information from the operator at de Vlot
Iron Chloride with 40%, consumption at 75% removal of phosphates; based on
Coagulant g/m3 70 _
1 infromation from the operator at de Vlot
Estimated glyserol consumption at 75% nitrogen removal. This target was not
achieved, because the dosage of glyserol was stopped prematurely due to
Glyserol mL/m3 115 _
contamination of the slow sand filter.
1
Reagents
Current system Hydrogen peroxide 35% weekly (= 23 kg) per slow sand filter to keep the sand bed
required Hydrogen peroxide g/m3 3 _
1 open longer
Active carbon NRS 0.5-2.5 consumption as it stands now, looking at the latest
3
analyzes, we can now assume a lifespan of 10,000 bed volumes, that number is
Active carbon g/m 75 _ 1
quite low, in the forecasts we have assumed 20,000 bed volumes, when changing
AK after 10,000 bed volumes, we consume 75g per m3 .
Trilfilter sludge m3 /year 40 _ 1 20 micron filter, solid, mainly organic material as sludge
Doekfilter m3 /year 12 _ 1 40-50 micron filter
Sludge from sedimentation silos will have to be dewatered, a rough estimate is 15
Sedimentaion silos sludge m3 /year 15 _ 1
Waste M3 of solid material per year
Current system Dirty sand, top layer from the slow sand silos, estimate is now 4 cm skimmed off 4
produced Slow sand filltration sludge layer m3 /year 35 _ 1
cm per year, which is 36 M3 of polluted sand per year
3 Active carbon can be regenerated in a pool
Activated carbon m /year 20 _ 1
As it looks now, it will be denitrified after ACF, we assume that this sludge can be
g/m3 100 _ 1
discharged into the sewage system
Post denitrification sludge
The project leading to this application has received funding from the European Union’s
Horizon 2020 research and innovation programme under grant agreement No 869318D1.1 Assessment of baseline conditions for all case studies 29
Tab. 5 CS2: Baseline conditions of material related parameters
BASELINE - current system
Frequency and
Mean Min Max Standard deviation number of Comments
Parameter Unit measurements
As specified by the water operator at de Vlot,
Flow m3 /d 40 _ _ _
_ The maximum capacity is 60 m3 /h
Measurements from 2007 onward and after
pH (influent de Vlot) 7,32 7,00 7,70 0,16
Bi-weekly, 25 2020 are given in the CS 2 data excel
Measurements from 2007 onward and after
pH (effluent street A) 7,22 7,00 7,40 0,11
Bi-weekly, 25 2020 are given in the CS 2 data excel
Measurements from 2007 onward and after
Conductivity (influent de Vlot) µS/cm 2,14 1,10 3,40 0,43
Bi-weekly, 25 2020 are given in the CS 2 data excel
Measurements from 2007 onward and after
Conductivity (effluent street A) µS/cm 2,17 1,80 2,70 0,24
Bi-weekly, 25 2020 are given in the CS 2 data excel
Measurements from 2007 onward and after
Ammonia (NH4-N) (influent de Vlot) mg/L 0,14 0,10 0,50 0,09
Bi-weekly, 25 2020 are given in the CS 2 data excel
Measurements from 2007 onward and after
Ammonia (NH4-N) (effluent street A) mg/L 0,01 0,10 0,10 0
Bi-weekly, 25 2020 are given in the CS 2 data excel
Nitrites (NO2-N) mg/L Not currently measured
Measurements from 2007 onward and after
Nitrates (NO3-N) (influent de Vlot) mg/L 50,1 9,8 91 18,07
Bi-weekly, 25 2020 are given in the CS 2 data excel
Greenhouse Measurements from 2007 onward and after
waste-water Nitrates (NO3-N) (effluent street A) mg/L 47,28 29,4 75,6 13,53
Bi-weekly, 25 2020 are given in the CS 2 data excel
Total Phosphorus (TP) mg/L Not currently measured
Phosphate (PO4-P) (influent de Vlot) mg/L 3,81 1,85 9,91 1,6 Weekly, 5 -11 Measurements started in September 2020
Phosphate (PO4-P) (effluent street A) mg/L 1,21 0,77 3,09 0,7 Weekly, 5 -11 Measurements started in September 2020
Potassium (influent de Vlot) mg/L 71,45 46,90 113,36 19,47 Weekly, 5 -11 Measurements started in September 2020
Potassium (effluent street A) mg/L 73,97 58,63 105,53 12,91 Weekly, 5 -11 Measurements started in September 2020
Calcium (influent de Vlot) mg/L 190,56 140,24 332,58 48,38 Weekly, 5 -11 Measurements started in September 2020
Calcium (effluent street A) mg/L 197,27 168,29 260,45 23,49 Weekly, 5 -11 Measurements started in September 2020
Sulfur (influent de Vlot) mg/L 74,52 43,27 144,24 22,97 Weekly, 5 -11 Measurements started in September 2020
Sulfur (effluent street A) mg/L 81,27 61,3 111,78 12,11 Weekly, 5 -11 Measurements started in September 2020
Chemical oxygen demand (COD) mg/L Not currently measured
Bioloogical oxygen demand (BOD 5) (influent
mg/L 3,45 3 8 1,51
de Vlot) Weekly, 11 Measurements started in September 2020
Bioloogical oxygen demand (BOD 5) mg/L 4,25 3 8 2,5 Weekly, 5 Measurements started in September 2020
Total suspended solid concentration (TSS )
mg/L
(effluent street A) Not currently measured
Turbidity NTU Not currently measured
The project leading to this application has received funding from the European Union’s
Horizon 2020 research and innovation programme under grant agreement No 869318D1.1 Assessment of baseline conditions for all case studies 30
BASELINE - current system
Frequency and
Mean Min Max Standard deviation number of Comments
Parameter Unit measurements
E. Coli concentration (influent de Vlot) CFU/mL 34 _ _ _ 1 Only 1 measurement on 29th March 2021
E. Coli concentration (effluent street A) CFU/mLD1.1 Assessment of baseline conditions for all case studies 31
2.2.4. Objectives of the Ultimate solutions
CS2 aims to close the loops of water, energy and material. In ULTIMATE, the
symbiosis is extended in two ways:
1) De Vlot has ambitions to reach zero liquid discharge and provide symbiotic
internal and potentially external reuse of water and nutrients from greenhouse drain
water (approx. 10% discharge). In this setup, recycling would be provided internally for
the greenhouses in the summer and in the winter months the excess recovered water
and nutrients can be reused in nearby industries or a central water bank. Re-use of
this water for irrigation is hampered by the risk of introducing salinity and plant diseases
upon recycling of this water. ULTIMATE will improve and demonstrate the functionality
of advanced wastewater treatment for reliable removal of salinity and plant pathogens
via electrochemical and disinfection treatment technologies.
2) To provide alternative energy sources for greenhouse heating. Because the
initiative for utilization of residual heat from the chemical complex Moerdijk is stopped,
there is no possibility for HT-ATES in Nieuw Prinsenland. Therefore, the demonstration
of the high-temperature aquifer thermal energy storage system (HT-ATES) system will
be carried out in another greenhouse-area. Currently, in several other areas in the
Netherlands, fossil free heating of greenhouses is prepared by using residual heat or
a geothermal source. For both sources of heat, HT-ATES is used to balance demand
and supply. The combination of a geothermal system and HT-ATES will allow for
optimal utilisation of the available heat and also cost effectively and carbon free supply
of peak demand. ULTIMATE will develop and demonstrate a cost-effective method to
identify and characterise suitable aquifers for HT-ATES, by combining the drilling of a
geothermal well with logging and screening of potential HT-ATES aquifers. In that way,
geohydrological risk aspects are mitigated, without the need of a separate test drilling.
ULTIMATE will also prepare further implementation by establishing a preliminary
design of the well and an integration plan for the total heating system.
Optimising water reclamation from agro-food industries
The main aim of this task is to facilitate the reuse of drain water from greenhouses with
a view on optimising the water reclamation. To do so, an extensive analysis of the
treated wastewater will be conducted. Then, an adequate treatment will be determined
supported by a quantitative microbial risk assessment (WP2), so that pathogen-free
water will be supplied for irrigation in the greenhouses.
In order to validate a reliable way of removing plant diseases from the water, the reuse
of this water will be investigated on pilot scale in a demo-greenhouse.
Finally, a full-scale treatment plant for water will be designed based on the previous
results and the ones of the economic analysis (WP2).
High Temperature Aquifer thermal energy storage and recovery
To improve the use of the residual heat and the economic viability of this heat supply
system, it is considered to store the residual heat in the deeper brackish-saline
groundwater system for its late recovery and use. This would allow a maximisation of
reuse, as surplus heat can be stored (summer) and recovered when the capacity of
the residual heat supply alone is insufficient (winter). For storage, a high-temperature
The project leading to this application has received funding from the European Union’s
Horizon 2020 research and innovation programme under grant agreement No 869318You can also read


