Pathway Study on Transportation in Ottawa - City of Ottawa
←
→
Page content transcription
If your browser does not render page correctly, please read the page content below
Pathway Study on Transportation
           in Ottawa

                         Presented to:
                      The City of Ottawa
                      110 Laurier Ave W
                      Ottawa, ON K1P 1J1

                          In relation to:
    The City of Ottawa’s Energy Evolution Strategy (Phase 2)

                              By:
                Sustainability Solutions Group
                       11 Alex Cox Rd
                     Tatamagouche, NS

                        February 2019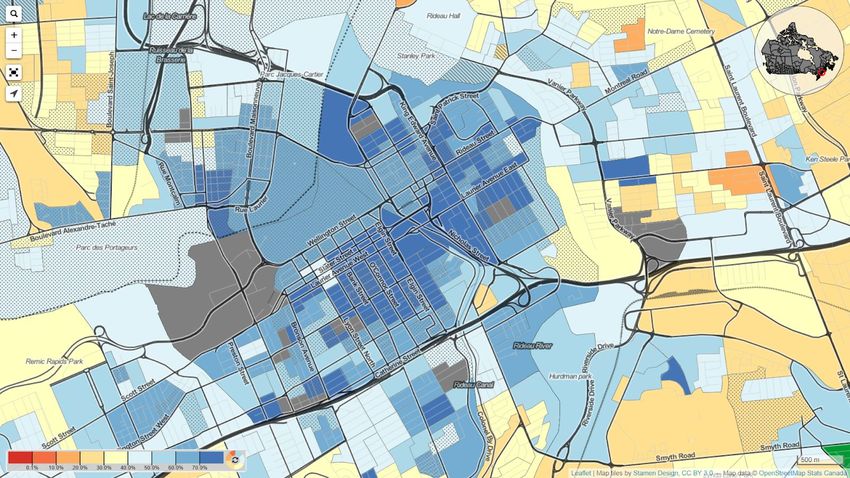
Contents

Executive Summary                                                                                 2

Section 1: Present Assessment of Transportation                                                   3
   Pathway description                                                                            3
   Pathway Boundaries                                                                             3
   Methodology                                                                                    5
   Emission Types and Units                                                                       5
   Background Information                                                                         6
   Strategies Assessment                                                                         10
       Land-use Change                                                                           10
       Electrification of Commercial Vehicles                                                    15
       Transportation Behaviour Change/TDM Program                                               19
       Parking Management                                                                        21
       Car-free Areas                                                                            23
       Congestion Charges                                                                        26
       Enhanced Transit                                                                          30
       Fuel Types in Transit                                                                     31
       Ride Sharing, Car Co-ops                                                                  36
       Bicycle Infrastructure                                                                    38
   Current Pathway Assessment                                                                    44

Section 2: Projected Pathway Assessment                                                          46
   Uptake Projections                                                                            48
       Conservative                                                                              48
       Moderate                                                                                  49
       Aggressive                                                                                50
   Constraints                                                                                   52

Ways to advance this pathway                                                                     53

Appendices                                                                                       54
   Appendix 1: 12 Quality Criteria for Public Spaces and Car Free Areas                          54
   Appendix 2: Car Free Indicators Map (Population Density and Active Transport)                 55
   Appendix 3: Congestion Charging Methods in International Cities                               57
   Appendix 4: Bicycle Lane Types                                                                58
   Appendix 5: Transportation Modelling Assumptions for Business as Planned                      59

References                                                                                       61

                                                       City of Ottawa Energy Transition Strategy | 1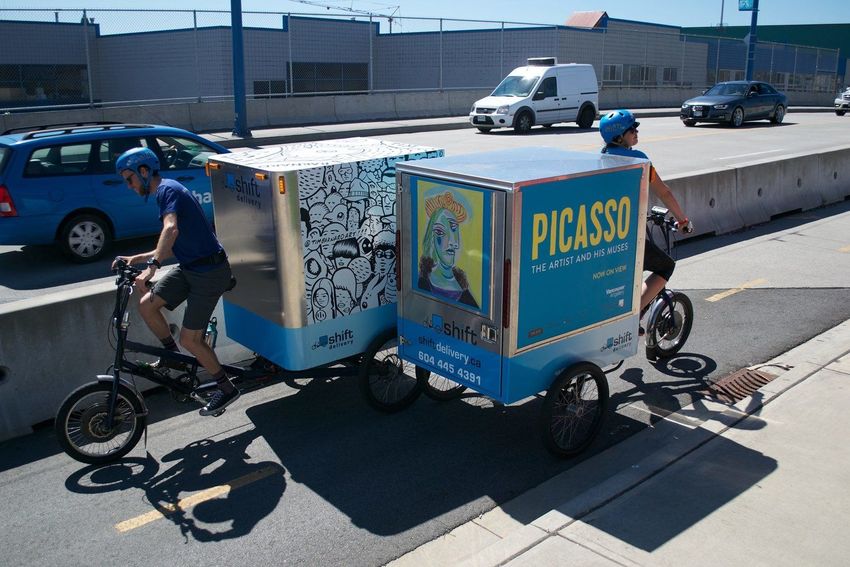
Executive Summary

This pathway paper estimates and models transportation energy use in Ottawa and the associated
GHG emissions, using 2016 as a baseline year. Nine best practice transportation strategies and their
ability to reduce transportation-related emissions are reviewed in three scenarios with increasing
levels of ambition. The conservative scenario reflects a business-as-planned outlook, plus some
acceleration of vehicle electrification. The moderate scenario reflects interventions on enhanced
transit, increased commercial electric vehicles, and increases to car sharing and active
transportation. The aggressive scenario includes electrification of personal and commercial
transportation, car free areas, expanded transit, and greater car sharing and active transportation.

In the moderate scenario, greenhouse gas emissions are reduced to about 50% of their projected
level in a “business as usual” future. In the aggressive scenario, Ottawa’s transportation sector would
be essentially carbon free by 2050.

Vehicle electrification has the largest emissions reduction impact of any single transportation
measure, but given the interdepencies and synergies between the various strategies and measures,
the scenario results are best regarded as the integrated results of all the emission reduction actions
included.

                                                        City of Ottawa Energy Transition Strategy | 2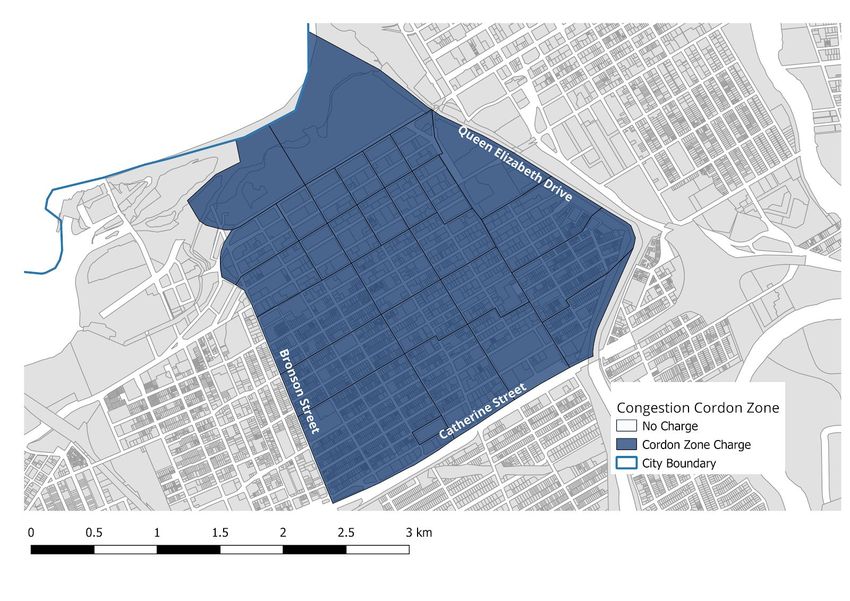
Section 1: Present Assessment of Transportation

Pathway description
This pathway examines transportation technologies and strategies in the City of Ottawa that will
help the sector meet emissions reduction goals in Ottawa’s Energy Evolution Strategy.

Phase 1 of the Energy Evolution Strategy explored a pathway to encourage personal electric vehicles
in the city and modelled how city-wide emissions may be affected. This pathway study expands
upon the initial Phase 1 analysis by identifying and evaluating nine additional strategies that support
energy reductions or fuel switching in the transportation sector, including greater active
transportation, enhanced transit, car sharing, and road pricing. The work in the Energy Evolution
Strategy and this pathway will complement the goals set out in the City’s Transportation Master
Plan.

Pathway Boundaries
Several transportation emission reduction strategies are researched, modelled, and evaluated in this
paper. The table below details the strategies and their key considerations that the modelling tool
(CityInSight) takes into account in projecting energy use and emissions to 2050.

Table 1: Study parameters for transportation.

 Strategy              Summary                              Key Considerations

Impact of land-use    Model the emissions effects of       ● VKT reduction
change                creating compact communities.        ● Increase in walking, cycling, and transit
                                                              usage
Electrification of  Model incentives or regulations        ● Increased market share of electric
commercial vehicles that increase the number of               vehicles and reduction of traditional
                    commercial electric vehicles.             fossil-fuel based vehicles
Transportation        Model various TDM policies to        ● Reduction of VKT
Demand                identify effective methods in        ● Increase in walking, cycling, and transit
Management (TDM)/     changing behaviours to encourage        use
behaviour change      transit use or active transport.
policies
Parking               Model parking management, as a       ● VKT reduction
management            particular dimension of TDM, to      ● Increase in walking, cycling and transit
                      assess how changes to access of         use
                      parking can change transportation
                      behaviours.

                                                        City of Ottawa Energy Transition Strategy | 3
Car-free areas      Model how car-free areas can           ● The location of car-free areas near retail
                    encourage active transportation            or mixed-use neighbourhoods
                    rather than personal vehicles in       ● Number of people who previously
                    different areas of a city.                 accessed the areas by personal vehicle
                                                           ●   VKT reduction where car-free areas are
                                                               introduced
Congestion charge   Estimate assumed transportation        ● The extent to which traffic is diverted to
                    behaviour response to price                other roads, thereby increasing
                    signals (e.g. a mode share shift for       congestion in other locations
                    specific OD pairs) in order to         ●   The response to the increase in the price
                    model the impact on energy use             of driving, which will vary based on the
                    and emissions.                             existing traffic levels and the availability
                                                               of alternatives
                                                           ●   The scope and timing of pricing, which
                                                               may encourage shifts in travel by time of
                                                               day, rather than a reduction in driving
                                                           ●   Whether drivers take shorter trips rather
                                                               than eliminating them completely
                                                           ●   Implications to AV deployment
Enhanced transit    Following the lead of the              ● The number of additional buses in
                    Confederation Line in Ottawa,              operation and their type
                    model the impact of increased          ● The extent to which the new service
                    transit routes, increased                  causes an increase in transit ridership
                    frequency, and different modes.
                                                           ●   The extent to which new transit riders
                                                               previously drove alone
                                                           ●   Length of vehicle trips reduced
Autonomous          Model the effects of autonomous        ● Market share within a community
vehicles (shared)   vehicles and their rates of            ● Impact on car mode share
                    penetration within the
                    community. Using previous
                                                           ● Load factor, utilization and impact on
                                                               size of vehicle stock
                    studies, possible emission
                    reduction strategies will be           ● Rate of electrification for AVs
                    identified.                            ● Impacts of reduced need for parking
Car share/ride      Uptake projections in car share        ● Reduction in personal vehicle ownership
share/car co-ops    companies and trips.                   ● Reduced VKT
                                                           ● Mode shift
Enhanced Bicycle    Various policies and infrastructure    ● Shift vehicle travel toward active
Infrastructure      investments are described and              transportation
                    reviewed for their effectiveness to
                    increase cycling.

                                                       City of Ottawa Energy Transition Strategy | 4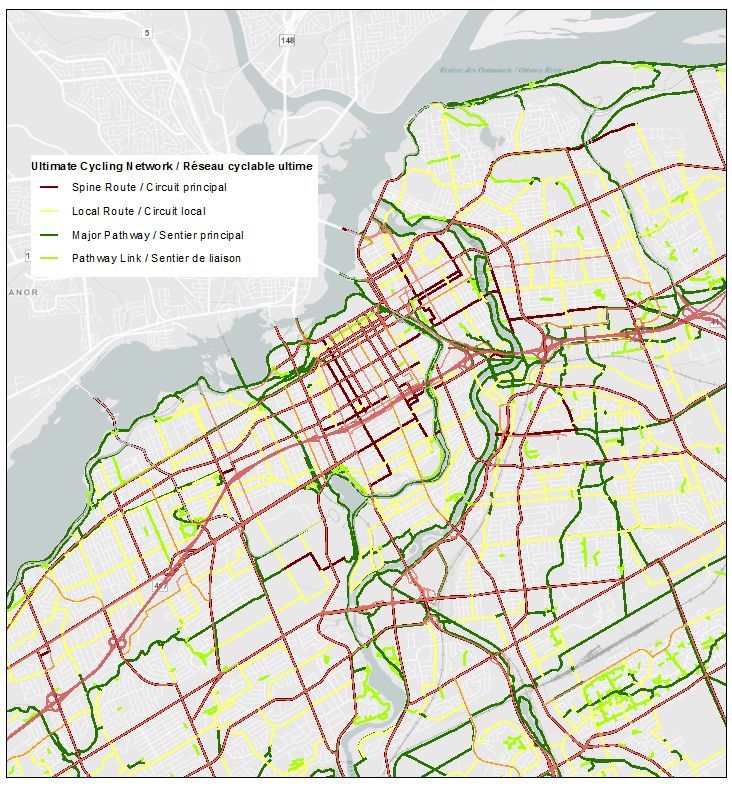
Methodology
The Business As Planned (BAP) scenario parallels the Conservative Scenario and incorporates
current City practice and policy that may affect GHG emissions within the city towards 2050. The
Moderate Scenario begins to scale up actions found in this pathway paper such as intensified
land-use, decreased reliance on fossil fuels for transport and increased active transport. The
Aggressive Scenario further electrifies commercial vehicles, maximizes opportunities for cycling
infrastructure, adds more car share services, and increases the relative amount of infill vs. greenfield
development. More information on these scenarios including summary tables can be found in the
Current Pathway Analysis and Projected Pathway Analysis sections of the paper.

CityinSight modelling includes a spatially explicit passenger transportation sub-model that responds
to or accounts for changes in land-use, transit infrastructure, vehicle technology, travel behavior and
other factors. CityinSight incorporates transportation emissions modelling methodology from the
Global Protocol for Community-Wide GHGs (GPC).

Trips are divided into four types (home-work, home-school, home-other, and non-home-based),
each produced and attracted by different combinations of spatial drivers (e.g. population,
employment, classrooms, non-residential floorspace). Trip volumes are specified for each zone by
origin and zone of destination pairing. For each origin-destination pair, trips are shared over
walk/bike (for trips within the walkable/bikeable distance thresholds), public transit (for trips whose
origin and destination are serviced by transit), and automobile.

The energy use and emissions associated with personal vehicles are calculated by assigning VKT to a
stock-turnover personal vehicle model. All internal and external passenger trips are accounted for
and available for reporting according to various geographic conventions.

Emission Types and Units
Tabel 2 provides common vehicle emissions types and their respective Global Warming Potential.

Table 2: Vehicle emission types.

Name                               Abbreviation                       Global Warming Potential
Carbon Dioxide                     CO2                                1
Methane                            CH4                                28
Nitrous Oxide                      N2O                                298
Air Conditioning Refrigerant       HFC-134a                           1,430

The Global Warming Potential (GWP) determines the relative global warming impact of different
greenhouse gases, on a per unit mass basis. Carbon dioxide has a GWP of unity, and other gases are
measured relative to that benchmark. For example, methane’s GWP is 28, which means that one
tonne of methane has the same global impact as 28 tonnes of carbon dioxide and would be
described as 28 tonnes of CO2e. Note that because carbon dioxide emissions are so much greater
than emissions of the other greenhouse gases, it has by far the greatest impact, even though the
other gases are more powerful on a per tonne basis.

                                                         City of Ottawa Energy Transition Strategy | 5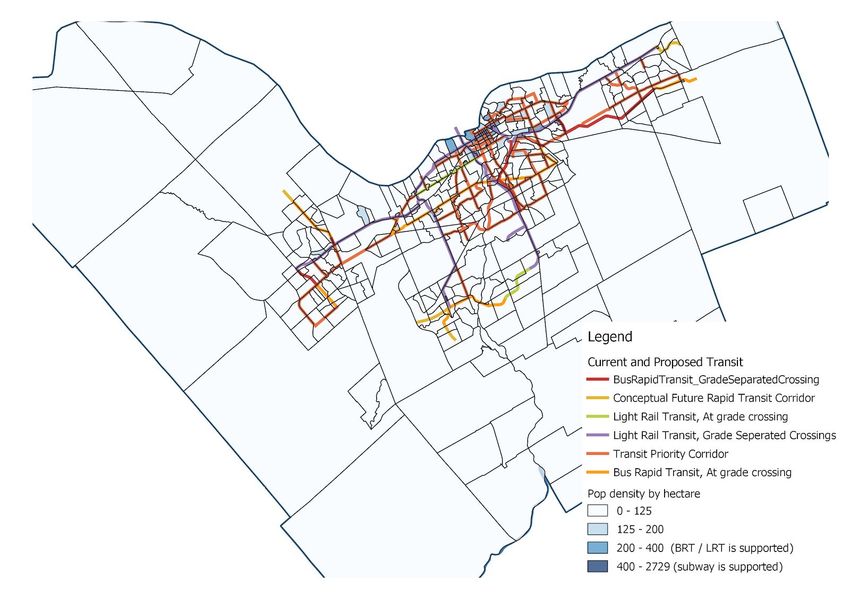
Other Common Unit Types

Terajoule (TJ): a unit of energy generally used to express large quantities of energy used over a
period of a year. In Phase 1 of Ottawa’s Energy Transition Strategy, transportation accounted for
31,200 TJ of energy used out of 114,200 TJ total.

Tonnes/ kilotonnes/megatonnes Carbon Dioxide equivalent (tCO2e or ktCO2e or MtCO2e): a unit of
measurement common in measuring the amount of total emissions over a period of year or years.

Background Information
Transportation Energy Use and Emissions Production

On-road community transportation          Figure 1: Total Emissions by Sector in Ottawa, 2016.
activities generated 2,098
kilotonnes of CO2e in 2016, making
it the second largest source of GHG
emissions in the city, after buildings
emissions (residential + industrial +
commercial). Emissions from the
transportation sector are growing
more quickly than other sources
and in the absence of new
mitigation policies or programs,
transportation emissions will
become the largest GHG source in
Ottawa.1 Transportation accounted
for 30,612 TJ of energy use, or 29%
of total city-wide energy
consumption in 2016.

There are really two transportation systems – one to provide personal mobility and one to support
the movement of goods and services in the economy. They share the same infrastructure, but
otherwise are quite different. There is an overlap with regard to light duty trucks, but personal and
commercial transportation are generally provided by different types of vehicles with different
technological possibilities. More important from a local government policy perspective, the personal
mobility and commercial transportation systems are driven by different motivational dynamics
(household decision making regarding trip-making and travel behaviour vs. business decisions to
manage supply chains and meet customer expectations).

Commercial transportation energy use and emissions are comparable in size to personal
transportation on a national or provincial scale, but in Ottawa, with its post-industrial, service
oriented economy, personal transportation dominates both the energy consumption and the
greenhouse gas emissions from transportation. In 2016, tailpipe emissions of greenhouse gases
1
 Energy and Emissions Plan for the CCP, 2012.
http://www.ottawa.ca/calendar/ottawa/citycouncil/ec/2012/02-21/03-Document%204%20-%20CoF_Energy%20Plan_FINAL%5B
1%5D.pdf

                                                             City of Ottawa Energy Transition Strategy | 6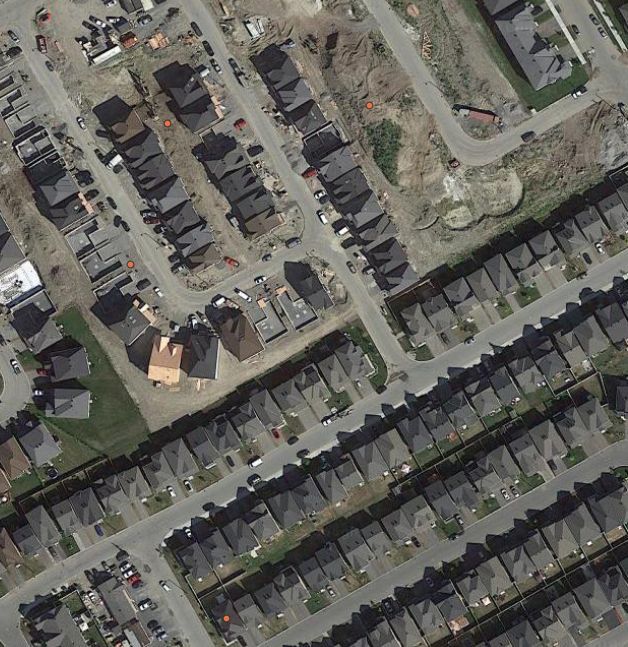
from gasoline-powered cars and light trucks, totalled 1,790 kilotonnes CO2e, fully 85.4% of total
transportation-related emissions in the city, transit buses 5.6% and diesel powered heavy trucks the
remaining 9%. If we assume light vehicle commercial traffic consumes the same amount of energy
as heavy truck transportation in Ottawa2, then 83% of transportation-related greenhouse gas
emissions are due to personal mobility and 17% to commercial transportation.

The figures below summarize energy consumed and emissions by vehicle type in 2016.

Figure 2. Transportation emissions in Ottawa by Vehicle Type and Fuel Ottawa, 2016.

2
  This assumes per capita light vehicle commercial traffic in Ottawa is 25% lower than in the GTHA, based on research done in
the Greater Toronto-Hamilton area, a major hub for continental commercial transport. (McMaster Institute for
Transportation and Logistics, “Estimating Urban Commercial Vehicle Movements in the Greater TorontoHamilton Area”,
prepared for Metrolinx, the share of light July 2010. http://mitl.mcmaster.ca/reports/MITL_Metrolinx_Report.pdf.)

                                                                     City of Ottawa Energy Transition Strategy | 7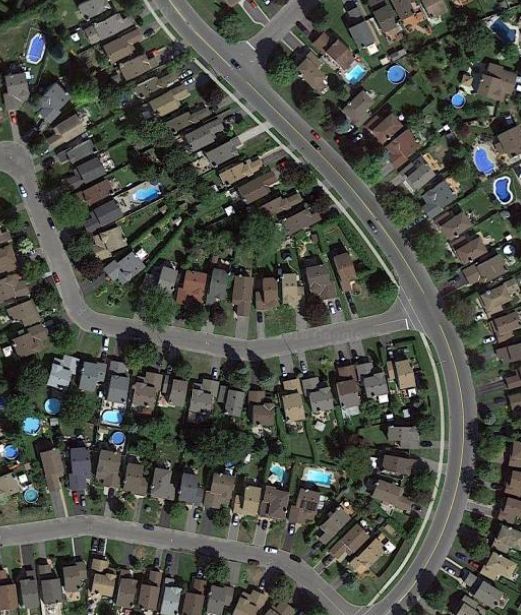
Figure 3: Energy use by vehicle type and Fuel, 2016.

Transportation energy use and emissions are driven by the underlying demands for personal
mobility and the delivery of goods and services, but are equally determined by the carbon intensity
of the vehicles employed. Both of these emissions drivers—the demand for transportation services
and the carbon intensity of the vehicles—are being affected by transformational technological, social
and business model innovations. Vehicle electrification eliminates tailpipe emissions, and provided
the electricity is sourced from carbon-free generation, could single-handedly bring about a
carbon-free transportation sector, at least at the point of end use. The digital revolution is spawning
a range of technologies and business models that could reverse the longstanding trend of growth in
personal and commercial transportation demand, while at the same time increasing the vehicle
utilization rate several-fold from its current average of about five percent. Similarly, trends in urban
settlement patterns and infrastructure design that favour densification, mixed use zoning and active
transportation are contributing further to a reduction in motorized vehicle traffic.

These trends are generally mutually reinforcing. Electrification of the vehicle fleet will be achieved
sooner and at a lower cost in the context of a shift to mobility-as-a-service (Maas) business models.
The mobility-as-a-service model reduces the size of the vehicle fleet and frees up vast amounts of
parking land that can be repurposed to support the growth of more vibrant, mixed use
neighbourhoods, which in turn improve the feasibility of mobility-as-a-service. The growth of
artificial intelligence and telepresence technologies reduces the amount of personal mobility
required for day-to-day access to employment, goods, services and amenities, and can facilitate
growth in neighbourhood-level interactions and economic activity. Other innovations in mobility and
digital technology improve the efficiency of logistics, and reduce the need for commercial
transportation in both supply and demand chains.

With all these interacting moving parts, it is particularly challenging to model low-carbon transition
pathways or to assign emission reduction potentials to individual measures. The nine strategies for
reducing transportation emissions considered in the scenarios presented below should be viewed in

                                                         City of Ottawa Energy Transition Strategy | 8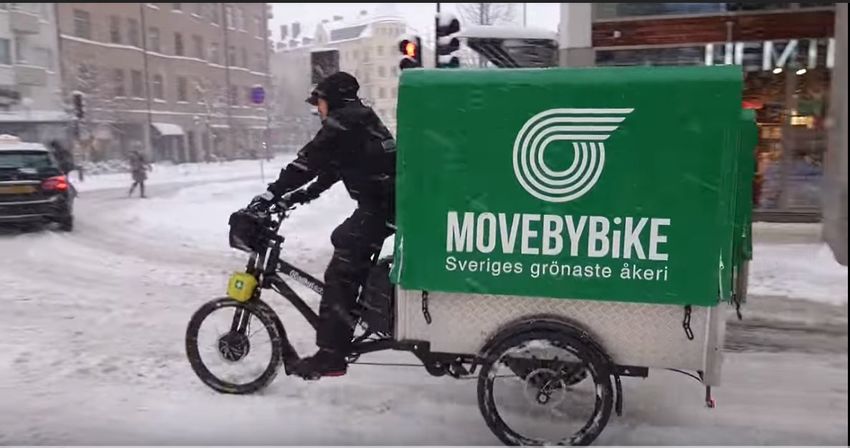
this context. For example, vehicle electrification plays a larger role in these scenarios than other
strategies, and there is no question it is an effective way to reduce emissions provided that the
carbon intensity of the electricity can be kept to zero or very low levels. Calculating the emission
reductions from vehicle electrification is quite straightforward, unlike some other measures whose
impacts are less direct (e.g. land-use changes), where there is still much uncertainty with regard to
their net impact on emissions (e.g. autonomous vehicles), or where their successful implementation
depends on the success of other measures (e.g. the potential for active transportation increases as
urban form and spatial structure allow more goods and services to be obtained with shorter trips).
This does not mean they have low potential for reducing emissions, only that more assumptions are
required in their quantitative analysis, assumptions which tend to err on the side of underestimating
their potential impacts.

Finally, it should be noted that the electrification of transportation is itself a transition of enormous
magnitude that will be occurring simultaneously with efforts to eliminate carbon emissions from
other sectors, efforts that will also put new demands on the electricity supply. The transition to a
low-carbon future generally and the electrification of the vehicle fleet specifically will be greatly
assisted by strategies that reduce the demand for vehicle kilometres of travel or the size of the
vehicle stock.

                                                          City of Ottawa Energy Transition Strategy | 9
Strategies Assessment
This section discusses several strategies and technologies to reduce energy use and the resulting
emissions from the transportation sector. The sub-sections provide background summaries, and
policy and action discussions.
Land-use Change
Mixed land-use allows citizens to live near employment centres, commercial centres, or recreation,
thereby reducing trip lengths. For trips that can be made short enough to facilitate walking and
cycling, emissions can be eliminated altogether. There is currently a mix of infill and greenfield
development in Ottawa. Towards 2050, this mix continues with an assumption that 50% of new
development will be greenfield, and 50% as infill. In the integrated, low-carbon scenario, a shift
towards greater infill development will occur and reduce the VKT correspondingly. The figure below
shows construction of new units occurring as of 2018.
Figure 4: Comparing Infill to Greenfield Development in Ottawa, 2018.
City of Ottawa Energy Transition Strategy | 10Making cities more compact with mixed land-uses at the neighbourhood level results in reduced car
ownership, increased active transportation, makes public transport more attractive, and can reduce
VKT by as much as 15-30%.3,4 Travel surveys of communities can help set benchmarks and show
behavioural and emissions differences between compact and non-compact communities. An
example is shown in Table 3.
Table 3: Travel decisions made by citizens depending on their location and land use.5
Urban Inner Suburb Outer Suburb
Cars Per Household 1.3 1.8 2.2
Number of destinations within 1km 44.3 26.2 12.9
Mean distance to closest retail (km) 0.6 1.5 2.1
Non-auto modes used in a typical week
● Walk to work 33% 4% 2%
● Walk to do errands 47% 20% 12%
● Cycle 44% 24% 24%
● Use Transit 45% 12% 5%
When considering land-use and transportation energy and emissions, the greatest impact that cities
can make over the long run is prioritizing infill and brownfield development, and creating a
transit-oriented development (TOD) strategy. Infill and brownfield development will prioritize
development opportunities on lands that are underutilized, abandoned, or were previously zoned
for one use such as office-commercial. Infill and brownfield development take development
pressure off of the urban periphery and greenfield land. TOD can be implemented in densifying
neighbourhoods, offering transit nodes where frequent service is present.
Sample modelling by the Centre for Clean Air Policy shows the impact of land-use decisions that
prioritize infill development and implement a TOD strategy. Each policy had the potential to
dramatically increase transportation use, reduce trip distance, and cut emissions. A summary table
of this modelling is provided below.
Table 4: Transportation impacts of land use and emissions change.6
VKT (%) Emissions (Mt CO2e)
TOD -21 -717
Infill / Brownfield Prioritization -39 -1375
3
Dierkers, G., Silsbe, E., Stott, S., Winkelman, S., and Wubbem, M. “CCAP Transportation Emissions Guidebook- Part One:
Land-Use, Transit & Travel Demand Management.” Center for Clean Air Policy, 2008.
http://www.ccap.org/guidebook/CCAP%20Transportation%20Guidebook%20(1).pdf.
4
Transport Energy and CO2. 2009. Paris, France: International Energy Agency / OECD.
https://www.iea.org/publications/freepublications/publication/transport2009.pdf.
5
Horning, Jessica, Ahmed El-Geneidy, and Kevin Krizek. 2007. “Perceptions of Walking Distance to Neighborhood Retail and
Other Public Services.” Montreal: Mcgill University. http://tram.mcgill.ca/Research/Publications/distance_perception.pdf.
6
CCAP Transportation Emissions Guidebook- Part One: Land-Use, Transit & Travel Demand Management.
City of Ottawa Energy Transition Strategy | 11Through Ottawa’s Official Plan, policies have already been identified to make the city more compact
and multi-modal. Ottawa identifies these goals under Section 1.6 of the Official Plan: A City of
Distinct Livable Communities:7
● A mix of land uses, housing types, compact and inclusive development, clustering of
neighbourhood facilities and services and excellent pedestrian connections make
communities more complete as well as walkable. Their attractiveness and pedestrian
functions are increased by proactive urban design that improves the relationships between
public and private land uses, built forms and the surrounding landscape.
● Liveability is addressed by accommodating new growth and development in a more
sustainable manner utilizing compact, mixed-use built form principles, including a moderate
increase in density.
● In underdeveloped areas, density is increased by adding more buildings in appropriate
locations.
The Ottawa Pedestrian Plan (2013) identifies the goal to increase walking and walkability in the city.
Along with better infrastructure, changes in land-use can help Ottawa reach 2031 targets, as shown
below:
Figure 5. Ottawa goals for walking as indicated in the Ottawa Pedestrian Plan.
Exhibit 1.6 Walking Mode Shares for Internal Trips: 2011 Observations and
2031 Targets Established in TMP (morning peak period)
Modal shares for 2011 and 2031
Inner Inner Riverside Kanata/
Orleans Barrhaven
Area Suburbs South/ Leitrim Stittsville
Walking 2011 51% 14% 19% 18% 23% 22%
2031 52% 16% 20% 21 % 24% 23%
Transportation decisions interrelate with the above policies and impact the urban environment.
Decisions and policies that favour decentralized land-use (sprawl) will generally favour personal
automobile use and result in the greatest amount of emissions. Contrarily, decisions that favour
compact and mixed use communities served by transit will favour walking, cycling, or transit and
result in fewer emissions.8
7
“Ottawa Official Plan - Volume 1.” Government. Ottawa, May 2003.
https://ottawa.ca/en/city-hall/planning-and-development/official-plan-and-master-plans/official-plan/volume-1-official-plan.
8
Litman, Todd. “Evaluating Transportation Land Use Impacts Considering the Impacts, Benefits and Costs of Different Land
Use Development Patterns.” Victoria Transportation Policy Institute, July 2017. http://www.vtpi.org/landuse.pdf.
City of Ottawa Energy Transition Strategy | 12Uptake Scenarios
Ottawa currently has a mix of infill and greenfield development. Greenfield development has tended
to be low-density, favouring single-detached housing and taking place in areas such as Orleans,
Barrhaven, or Kanata. Ottawa has also pursued infill initiatives such as the
Richmond/Midway/Hartleigh development (Figure 5). The City has also pursued initiatives for TOD
near the Confederation Line Stations. Infill initiatives are projected in the Integrated Scenario.
Figure 6. Sample new developments in Ottawa.
BAP/Conservative Scenarios Moderate / Aggressive Scenarios
Bridlewood, West Ottawa Richmond/Midway/Hartleigh
Units/ha: 16-20 Units/ha: 50-70
Development Type: Single family detached. Development Type: 3-Storey infill, multi-family
Front/back yards and attached/detached garages. rowhouses, and plex, at-grade parking.
Orleans, East Ottawa Metcalf & Argyle, Centretown
Units/ha: 10-17 Units/ha: 300-500
Development Type: Single family detached. Development Type: High Density, 5-15 Storeys,
Front/back yards and attached/detached garages. underground parking, mixed-use.
City of Ottawa Energy Transition Strategy | 13Table 5: Uptake scenarios for land-use.
Action Conservative Moderate Aggressive
Land-use Official plan until 2031 70% of new development 90% of new development is in
is in urban centres or urban centres or adjacent to
adjacent to existing or existing or new LRT, BRT by
new LRT, BRT by 2025. 2025.
Walking No change in city-wide For 2km trips, Mode shift For 2km trips, Mode shift to
modeshift to 20% of the walking and 50% of the walking and
cycling potential away cycling potential away from
from vehicles and driving. vehicles and driving.
City of Ottawa Energy Transition Strategy | 14Electrification of Commercial Vehicles
Commercial vehicles account for a significant proportion of transportation emissions. Without
significant intervention, emissions from commercial vehicles will likely increase as Ottawa’s
population continues to grow.
Roughly all emissions in the commercial Figure 6. Commercial vehicles by energy use, 2016.
vehicle sector could be avoided through
electrification of commercial fleets. Diesel
is the major source of fuel as of 2016 for
commercial vehicles in Ottawa,
accounting for 60% of energy use,
followed by gas at 37%. An insignificant
amount of commercial vehicles were
electric in 2016.
The major technologies for electrifying
transportation include: fuel cell
technology— which can be charged from
multiple energy sources—and
battery-electric. Battery-electric vehicles
are better suited to vehicles making short
trips within the city, while fuel-cell
technology can be more effective for
longer-range trips. Each technology has Figure 7. Comparison of large vehicle electrification
advantages and disadvantages, but both options in BC.9
may be needed to successfully electrify
the majority of commercial vehicles. A
summary graphic of tradeoffs is provided
in Figure 7.
9
Talebian, Hoda, Omar Herrera, Tran Martino, and Walter Merida. 2018. “Electrification of Road Freight Transport: Policy
Implications in British Columbia.” Energy Policy. Vancouver, BC: UBC.
https://pics.uvic.ca/transportation-futures-british-columbia.
City of Ottawa Energy Transition Strategy | 15Infrastructure Options
1. Electric road systems (ERS): This infrastructure works with commercial vehicles that can
receive electricity from installed power stations along the road. Inductive charging places
power stations within the road and vehicles drive over them to charge. This technology is still
being piloted but has shown to be less efficient than overhead lines, and higher costs per
kilometre.10
2. Overhead catenary lines: This technology has already been established in urban areas as it
connects transit lines, including the upcoming Confederation Line. This technology will
require a connection on the trucks themselves, along with regulation stating that trucks
must use them. To date, pilot programs are being run in Sweden, Germany, and the US.11
3. Charging stations: Charging stations might be required for commercial vehicles that are
battery powered and making multiple deliveries in various areas of the city. Demand may
vary depending on the location of warehouses and how companies organize their routes.
Other Actions and Bylaws
Table 6: Policies and actions for electrification of commercial vehicles.
Policy or Description Level of Difficulty to Implement
Strategy
Carbon tax Adding charges for use of carbon-emitting fuels Difficult: This must be led and
can incentivize business to become more efficient implemented by the Province of
and choose carbon-free technology. Ontario or the Federal Government.
Fuel station A bylaw can require new or redeveloped stations Low: Normal city process to create
regulations to provide alternative fuel. The City of Surrey (BC) new bylaws.
has adopted such a regulation.
Off-street Cities can require commercial businesses to be Low: Many cities are adopting new
parking equipped with electric vehicle charging stations as parking bylaws to encourage
requirements a first step toward creating the infrastructure personal and commercial electric
needed for electric vehicles. vehicles.
Street design Cities can design streets to be narrower to Medium-Difficult: Cities can begin
decrease vehicle accessibility or add car-free designing new streets and
areas. These design measures direct companies retrofitting existing streets to be
to choose smaller delivery vehicles such as bicycle more narrow and decrease vehicle
courier or small electric cargo vehicles. Enforcing access. Street retrofits require
parking regulations to prohibit double parking can strategy for consultation and
also signal companies to choose other vehicles. diverting traffic flows.
Transforming City fleets perform several core functions such as Medium: Adding electric vehicles
City Fleets garbage pickup, roads and water servicing and will require a larger budget but may
maintenance. Other vehicles that may fall in city lower life cycle costs.
purview are ambulance, fire, and police.
Transforming city fleets can be a model for
commercial vehicle electrification
10
“The Future of Trucks: Implications for Energy and the Environment.” International Energy Agency, 2017.
www.iea.org/publications/freepublications/publication/TheFutureofTrucksImplicationsforEnergyandtheEnvironment.pdf.
11
Ibid.
City of Ottawa Energy Transition Strategy | 16Figure 8. An electric bike makes a delivery Figure 9. Shift Delivery Co-op uses electric
during winter in Stockholm, Sweden12 bikes in Downtown Vancouver.13
Boundaries and Barriers of Strategy
Barriers to this strategy are noted below, with additional boundaries and barriers provided near the
end of the paper.
Jurisdiction
If strong actions or policies need to be taken, Ottawa must work with Provincial and Federal
governments to establish regulations to electrify a greater proportion of commercial vehicles. There
will also be upfront costs of new infrastructure that may be difficult for Ottawa to finance alone.
Further study is needed to understand capacity issues in providing enough electricity to electrify
50% to 100% of commercial vehicles in Ontario. In British Columbia’s case, 64% of commercial
vehicles will be required to be electric in order to meet climate goals in the transportation sector.14
This will be completed with a combination of fuel-cell and battery-electric technologies. Modelling
for BC projects reports an energy shortfall to reach the 64% target; for every 1% of reduced GHG
emission from commercial trucks, an additional 1.5 to 3.8% of additional hydroelectric, or
renewable, energy is required.15 This amounts to approximately 33 Terawatt hours (TWh) of
additional electricity over 2015 levels.16 In Ontario, the IESO anticipates the ability to meet increasing
electrical demands stemming from electrified transport, but will require continued growth from
low-carbon sources as well as nuclear energy and natural gas to do so.17
Market Barriers and Technology
Commercial vehicles and providers of service have an interest in reducing their costs—including the
cost of gasoline—and should be motivated to make the transition to electricity where feasible.
However, if there is no financial cost to continue operations as usual, there is less incentive to
12
The life of cargo bike delivery heroes during winter in Sweden https://www.youtube.com/watch?v=1UzNI3kgSO4
13
“Women in Urbanism.” Modacity, 12. 20, 2016. http://www.modacitylife.com/blog/women-in-urbanism-robyn-ashwell
14
“Electrification of Road Freight Transport: Policy Implications in British Columbia.” Energy Policy. Vancouver, BC: UBC.
15
Ibid.
16
Ibid.
17
“Preliminary Outlook and Discussion: Ontario Supply/Demand Balance to 2035.” 2016. IESO, March 23.
http://www.ieso.ca/-/media/Files/IESO/Document-Library/sac/2016/SAC-20160323-Ontario-Planning-Outlook.pdf?la=en
City of Ottawa Energy Transition Strategy | 17change to electric vehicles. Cities can add road pricing measures with reduced costs for electric
vehicles, or a carbon tax can change business cases but will require policy from senior levels of
government.
Electrictrifying commercial vehicles presents a larger technological challenge than personal vehicles
due to truck and cargo weights, the distance of daily travel, and the absence of widely-distributed
vehicle charging stations. Commercial vehicles that operate solely within urban areas face lower
barriers due to shorter trips and greater availability of charging stations. The more intensive use of
commercial vehicles (high annual distances travelled) can work in favour of the economics of
electrification. There is promise for new technologies as major companies, such as Daimler and
Tesla, announce the launch of electric semis able to operate over similar distances to most long
distance freight trucks operating today.18
The full network of energy supply must be accounted for when considering electrifying commercial
vehicles. Ottawa and Ontario have the advantage of plentiful hydroelectric energy and other
low-carbon electricity sources, such as nuclear power, which would result in near zero emissions for
electric commercial vehicles.
Scope Limitations
In this strategy, there will be some travel that is out of scope for Ottawa. Trips that originate from
outside the city, and trips that have origins inside the city but destinations outside the city are
difficult to account for and regulate and therefore are not modelled.
Uptake Scenarios
Table 7: Uptake scenarios for commercial vehicles.
Action Conservative Moderate Aggressive
Commercial Vehicles 10% of heavy trucks 20% of heavy trucks 40% of heavy trucks
are zero emissions by are zero emissions by are zero emissions by
2030; 40% by 2040. 2030; 60% by 2040. 2030; 100% by 2040.
City Fleet Municipal fleet is 20% Municipal fleet is 40% Municipal fleet is 60%
electric by 2020; 40% by electric by 2020; 60% by electric by 2020; 100%
2040. 2040. by 2040.
18
Lambert, Fred. “Daimler Unveils Electric E-Cascadia Semi Truck to Compete with Tesla Semi, Launches Electric Truck Group.”
Electrick, June 9, 2018. https://electrek.co/2018/06/07/daimler-electric-semi-truck-ecascadia-tesla-semi.
City of Ottawa Energy Transition Strategy | 18Transportation Behaviour Change/TDM Program
Changing behaviours around transportation is the goal of Transportation Demand Management
(TDM) programs. TDM can be targeted to only reduce peak-hour traffic, or can be part of a city-wide
traffic management program. TDM makes walking or taking transit as appealing as driving. It
originates from the idea that citizens make multiple trips daily and base their travel decisions on
factors including convenience, time, and safety. If driving to meet friends nearby, to get a coffee, to
exercise, or run an errand is accompanied by free and plentiful parking, plentiful travel lanes, and
direct door-to-door access, then a vehicle trip is chosen. The externalities of traffic, congestion,
pollution, and sprawl occur as people choose the vehicle trip. TDM can help alter this mode choice.
A TDM program has the ability to move a city towards a low-carbon future by reducing VKT, reducing
demand for travel, and increasing alternative modes of transportation. Not all actions are equal, but
cities are recommended to take a holistic approach. A list of researched TDM actions is shown in the
table below.
Table 8: Impact of TDM strategies.19
Strategy Details Vehicle Trip Reduction Impact
(for commuting to work)
Parking Charges Paying for parking 20-30%
Information Alone Information on alternatives to 1.4%
driving alone
Services Alone Ridematching, shuttles, 8.5%
guaranteed rIde home (for
emergency)
Monetary Incentives Alone Subsidies for carpool or transit 8-18%
Service & Monetary Incentives Transit voucher and guaranteed 24.5%
ride home
Cash Benefit Cash benefit offered in lieu of 17%
accepting free parking
Ottawa has already recognized TDM as a strategy to change travel behaviour, and notably has a
program for TD Place at Lansdowne Park. With the goal of having vehicle trips account for less than
50% of travel. TD place offers a shuttle service, additional bike parking, and off-street parking away
from the site. Further, since 2010 Ottawa has implemented several city-wide TDM strategies that
include more and safer bicycle infrastructure, advertising programs for cycling, transit passes for the
University of Ottawa, connecting car share service to transit with one pass, ridesharing, and other
actions.20 Ottawa also has TDM guidelines where new development applications for commercial or
mixed-use building must comply. Having a TDM coordinator for the operations of a building is a
notable strategy in Ottawa’s guidelines.21
19
Table Adapted from Nelson/Nygaard, “TDM: State of the Practice” 2013.
20
“Transportation Demand Management Strategy (Draft).” 2012. Noxon Associates Limited: City of Ottawa.
http://ottawa.ca/calendar/ottawa/citycouncil/trc/2012/05-02/02%20-%20Doc%201.pdf.
21
Ibid.
City of Ottawa Energy Transition Strategy | 19TDM Policies and Strategies
Many of the policies described in the Transportation Pathway are included in typical TDM programs,
including congestion charging, car-free areas, and parking management.
1. Fees and Charges: Charging users to use roads and parking is a major way to shift the
balance from personal vehicle trips, especially single occupant trips. Fees such as fuel taxes
or carbon taxes can also be applied to realize full costs of driving.
2. Greater Information: The use of newer technologies, particularly smartphones and
transportation apps, can greatly encourage alternatives to personal automobiles. Transit
riders can get real-time transit data through smartphone applications, create a more
accurate picture of the length of time required to reach a destination, and make travel
decisions accordingly.22
3. Enhanced Bicycle/Pedestrian Infrastructure: Many design considerations can be made to
ensure walking or cycling is comfortable and attractive, including proper, well-maintained
sidewalks and street lighting, attractive landscaping or art, seating, bicycle accommodation
in parkades, secure bicycle storage, and employee shower and changing facilities.23
4. Transit Passes: Employee and student transit passes can be provided by employers and
institutions to encourage transit use. Furthermore, housing developers can provide passes
to new housing developments in lieu of providing parking.
5. Parking Management: This method of TDM removes the convenience of abundant and free
parking, and is analyzed further in the following section.
Uptake Scenarios
The TDM strategy has strong relationships with land-use, road/congestion charging, and parking
management and will be modelled under those strategies.
22
Nelson/Nygaard Consulting. 2013. “Transportation Demand Management: State of the Practice.” Michigan: Smart Growth
America. https://smartgrowthamerica.org/app/legacy/documents/state-of-the-practice-tdm.pdf.
23
Ibid.
City of Ottawa Energy Transition Strategy | 20Parking Management
Parking requirements are within City control and are implemented during the development of new
buildings, homes, temporary structures, events, and transit stations. Cars are parked 95% of the
time, and can use numerous parking spaces within a week. Plentiful and accessible parking
encourages vehicle ownership and operation. Firm policies paired with strict enforcement of parking
regulations can encourage citizens to reduce personal automobile use and ownership. Trip-making
decisions and modal choices are sensitive to both the availability of parking and its costs, making
parking management strategies particularly effective in changing behaviour.
When considering transportation emissions, parking policies have been shown to reduce demand
for personal vehicles trips and reduce community VKT. The table summarizes a study that shows
how different parking policies reduced VKT over different periods of time.
Table 9: Parking policies and measures, and VKT reductions.24
Measure Reduction of VKT Potential Time for Implementation
Resident (priced) parking permits 0-10% 1-2 Years
for on-street
Park and Ride systems 10-25% 2-5 Years
Parking Cash Out for workplaces 10-25% 1-2 Years
Reduce Off-street parking 10-25% 5+ years
requirements for new
construction
Double Parking charges in busy 10-25% 1-2 Years
areas
Car-Free Zones 25%+ 2-5 Years
Compact Communities 25%+ 5+ Years
The parking strategies below can encourage citizens to reconsider trips taken by vehicle, share rides,
or decide against owning a vehicle at all.
1. On-street parking fees: a strong pricing program that is regularly reviewed and studied can
encourage citizens to choose other methods of travel, while improving parking availability in
cities.
2. Implement maximum off-street parking requirements for new developments: reducing or
eliminating parking requirements for residential developments, workplaces and shopping
areas can change norms and encourage behaviours and development patterns that reduce
automobile dependence.
24
Transport Energy and CO2. 2009. Paris, France: International Energy Agency / OECD.
https://www.iea.org/publications/freepublications/publication/transport2009.pdf.
City of Ottawa Energy Transition Strategy | 213. Zero off-street parking requirements near destinations served by transit: developments near
transit, under TOD strategies, can encourage modal shifts from personal vehicles to transit..
4. Parking cash out: employees are offered a cash equivalent to the cost of a free parking spot
at their workplace if they choose not to drive to work.
5. Increase enforcement for illegal parking: within city centres or dense areas, citizens may
attempt to double park in a travel lane beside a parked car, or park in undesignated areas.
This can be a safety concern as emergency vehicles may have trouble getting to their
destination, or other cars may need to maneuver around them.
6. Eliminate or redevelop surface parking lots: surface parking can act as an agent for sprawl,
act as a cue to incentivize driving, and delay more dense developments within a community.
7. Compact communities: parking has a connection to land use. As more destinations and
activities are closer together there is an increase towards walking, cycling, and transit.
Uptake Scenarios
No major change is anticipated in the BAP scenario. An action was developed to increase parking
rates by a factor of 1.5 in City-owned lots and on-street parking using the City’s transportation model
as part of an integrated scenario; the action works in unison with a suite of land use changes. As a
result, the parking management aggressive scenario is modelled as an action under the aggressive
Land-use Actions (Table 10). Further actions to increase walking and cycling and increased
development near transit stations are combined in the Aggressive Land-use Scenario, thereby
reducing the need for personal vehicle trips.
Table 10: Uptake Scenarios for parking management.
Action Conservative Moderate Aggressive
Parking Management No change No change Increase on-street
parking fares during
peak hours by a factor
of 1.5 by 2050.
City of Ottawa Energy Transition Strategy | 22Car-free Areas
A car-free zone/area or pedestrian area/corridor is an area vehicles cannot access. They typically use
barriers or a change in streetscape treatment to indicate restricted vehicle access. Car-free areas
support the goals of sustainable transportation planning by increasing the proportion of citizens
who will walk or cycle to their destination. One such example is Sparks Street in Ottawa, which plays
a role within the community as a cultural and event centre, and where residents can meet for lunch
or dinner, to take in a festival, to relax in the public space, or to walk home.
Car-free areas can often create a sense of place in a neighbourhood. Studies conducted in Krakow,
Poland showed that citizens accessed new public squares and car-free areas increasingly by foot,
bicycle, or transit when compared to non car-free areas. In three car-free areas, approximately 50%
of citizens walked to the areas, 10% cycled, 35% of citizens used public transit , and car use was
below 5% on average.25 This is contrasted against a normal modal split of 43% transit, 29% walking,
27% personal vehicle, and 1% bicycle.26 When surveyed on the reason that people chose to visit the
car-free areas, the most common reason was a lack of vehicles.27
Figure 10. Normal modal split vs. car-free areas, Krakow, Poland.
Another benefit of car-free areas is the creation of more opportunities for planting and landscaping,
therefore reducing urban temperatures resulting from overly paved areas—the “urban heat island
effect”. When landscaped, car-free areas can act as natural air conditioners. Exceptional cases such
as Seoul, South Korea exist where an urban freeway was removed and a naturally occuring river was
uncovered resulting in 3-4 degrees Celsius lower temperatures than nearby areas.28
25
Szarata, Andrej, Katarzyna Nosal, Urszala Duda-Wiertel, and Lukzak Franek. 2017. “The Impact of the Car Restrictions
Implemented in the City Centre on the Public Space Quality.” 20th EURO Working Group on Transportation Meeting, September.
https://ac.els-cdn.com/S2352146517309158/1-s2.0-S2352146517309158-main.pdf?_tid=718b0618-fb06-4f0c-9177-5fbb685812
ee&acdnat=1533133189_9b3bd0d41a650e2da38869272ec17316.
26
Szarata, Andrej. 2013. “Accessibility of Public in Krakow.” Powerpoint, Krakow.
http://www.accessibilityplanning.eu/wp-content/uploads/2014/02/Krakow-presentation_Szarata_23May13.pdf.
27
Ibid
28
Meinhold, Bridgette. 2010. “Seoul Transforms a Freeway Into A River and Public Park.” Inhabitat. 2010.
https://inhabitat.com/seoul-recovers-a-lost-stream-transforms-it-into-an-urban-park.
City of Ottawa Energy Transition Strategy | 23Car-free Policies and Strategies
The City has a vision to make a pedestrian area in Kanata. Kanata has a commercial centre which
favours pedestrian movement in the shopping streets. Future development can densify and mix
uses to include residential development. Future planning can permit full pedestrian infrastructure
that is car-free.
Creating car-free areas in neighbourhoods, recreational or commercial areas that already have
active streetscapes can encourage a shift away from car travel. Indicators can be low-parking
vacancies, full bicycle racks, new shops or restaurants opening frequently, or a high-density of
restaurants or bars.
The Gehl Institute developed 12 Criteria for evaluating public spaces, which can be used as a
strategy to evaluate public spaces or develop them further to make them car-free. The 12 criteria
are listed in Appendix 1 and are based on making pedestrians feel safe, welcome, and protected
from harsh climates and the noise, pollution, and high speeds of vehicles.
Uptake Scenarios
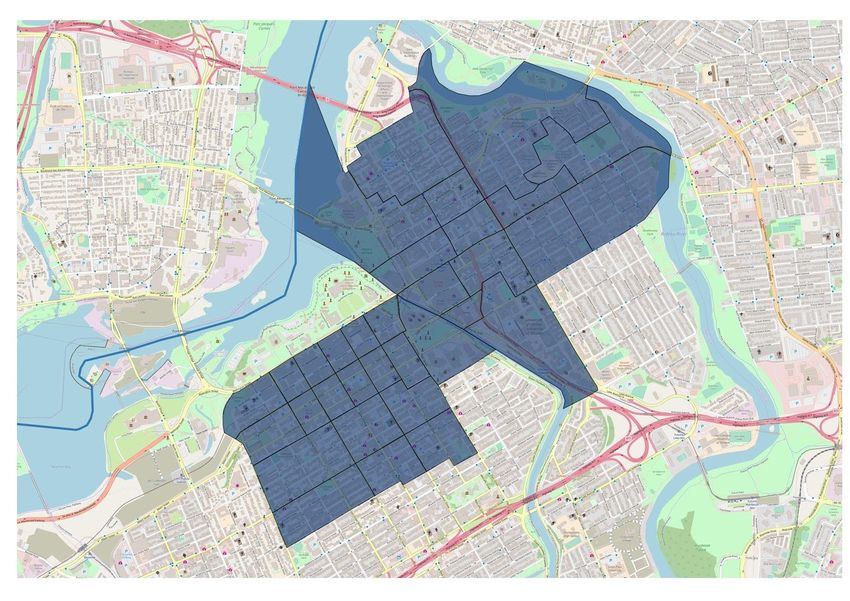
The Integrated Scenario identifies areas in Ottawa with high concentrations of commercial resources
and housing density. Two notable indicators for placement of a car free area include areas where
the population densities exceed 5000 people per square kilometre, and areas where 70% of
residents commute to work by walking or cycling. The map below shows an aggregation of these
indicators to include Byward market and downtown Ottawa, Wellington-Rideau, Sparks and Bank
streets, and the University of Ottawa campus. Appendix 2 provides background maps for population
densities and active transportation.
Table 11: Uptake scenarios for car-free areas.
Action Conservative Moderate Aggressive
Car Free Areas None None Care-free areas in:
Byward Market
Downtown
Wellington-Rideau
Sparks
Bank Street
Ottawa-U campus
City of Ottawa Energy Transition Strategy | 24Figure 11. Car-free areas in Ottawa
City of Ottawa Energy Transition Strategy | 25Congestion Charges
Congestion charges are fees for entering a specific area by car, and are a method of reducing peak
time traffic in a city that is considered a form of Transportation Demand Management (TDM). Traffic
congestion has a cost to motorists because their trip duration increases. Traffic congestion also has
several external costs that should be noted:
● Other road users such as cyclists or transit users may have to bear similar costs of traffic
congestion that are not directly caused by them.
● Pollution and climate impacts caused by traffic congestion are costs borne by an entire
community, not just drivers;
● Busy streets with traffic hinder walking or cycling as there may be perceived danger, poor air
quality, or poor ambience/environmental factors; and
● Economic Costs that are borne by entire cities occur due to congestion. In a previous report,
Transport Canada modelled the economic cost of non-recurrent congestion, where
congestion is caused by irregular events, and found the Ottawa-Gatineau region loses
between $100 and $250 million yearly depending on congestion levels in 2006 dollars.29 A
study of recurring congestion, a result of road capacity and driving behaviour, costs the
region between $39 and $89 million in 2002 dollars.30
Vehicles operate most efficiently when travelling at a constant speed (and that efficiency is highest
around 60 km/hour). Congestion increases greenhouse gas emissions due to vehicle idling, low
speeds and stop-and-go acceleration cycles. A study produced in California modelled emissions
from traffic and various speeds, and is shown in the table below.
Table 12: Climate emissions related to traffic rates.31
Speed Range 8-24 kph (congestion) 32-100 kph 100-130 kph (speeding)
Emissions Rate in 500-800 200-500 300-500
Grams of CO2/km
The same study modelled emissions from traffic and found a possible 7-12% reduction in each of
the three following methods:
29
“Costs of Non-Recurrent Congestion in Canada Report.” 2006. Technical. Transport Canada Economic Analysis. Canada:
Transport Canada. http://www.bv.transports.gouv.qc.ca/mono/0964770/01_Report.pdf.
30
“The Cost of Urban Congestion in Canada.” 2006. Transport Canada.
https://pdfs.semanticscholar.org/ae2c/c8a3231b62525af11e01f2d7e2a4a7c13a80.pdf.
31
Barth, Matthew, and Kanok Boriboonsomsin. 2010. “Real-World Carbon Dioxide Impacts of Traffic Congestion,” May.
https://escholarship.org/uc/item/07n946vd.
City of Ottawa Energy Transition Strategy | 261. Congestion mitigation Figure 12. Strategies to reduce traffic related emissions
strategies (Congestion and the modelled effect.32
Charging) that reduce severe
congestion so higher average
speeds are achieved and
maintained;
2. Speed management
techniques that can bring
down excessive speeds to
more moderate speeds of
approximately 85 kph (e.g., by
enforcement, road design to
limit speeding); and
3. Traffic flow smoothing
techniques that can suppress
shock waves and thus reduce
the number of acceleration
and deceleration events (e.g.,
variable speed limits,
autonomous vehicles).
Stockholm, Singapore, London, and Milan provide notable examples of cities implementing
congestion charges and changing travel behaviour. Each city experimented with different methods
of implementing congestion charges such as charging flat or variable rates, targeting specific roads
(road-pricing) or entire urban areas (cordon pricing), and charging all day or only peak hours. The
experience of these cities is summarized in Appendix 3. Congestion charges require tailoring to
specific city cultures and environments. There are continuous research efforts on how congestion
pricing may affect businesses and what effect it has for people of different incomes.
Each case city described above is different than Ottawa as the populations are generally larger and
there are more people per square kilometre, however congestion charging was successful in
reducing traffic counts by 14% in Stockholm and Milan, and 45% in Singapore.33 The transit mode
share increase ranged from 5% in Stockholm to 13% in Singapore (Table 13).34
32
Ibid
33
Jarl, Valfrid. “Congestion Pricing in Urban Areas - Theory and Case Studies.” Thesis. Lund University: Department of
Technology and Society, 2009. http://www.tft.lth.se/fileadmin/tft/dok/publ/5000/Thesis183_VJ_scr.pdf.
34
Ibid
City of Ottawa Energy Transition Strategy | 27Table 13: Transportation and traffic changes after congestion charges in major cities.35
Singapore London Stockholm Milan
Target Reduction -25-30% -10-15% -10-15% in AM & PM -10%
Actual Reduction:
Traffic-Overall -45% -14% -22% -14%
Traffic - AM Peak -45% No Data -16% No Data
Cars-Overall -75% -36% -22% No Data
Mode-share - AM Peak
Transit / Car Before (AM) 37/63 87.5/12.5 70/30 No Data
Transit / Car After (AM) 50/50 89/11 75/25 No Data
Congestion Charge Policies and Strategies
The following tools, suggested by the Victoria Transport Policy Institute, could be implemented in
Ottawa.
Table 14: Policy tools for traffic congestion and other road pricing systems. (Adapted from
Littman).36
Name Description Objectives
Road toll A fixed fee for driving on a particular road. To raise revenues for transit and
discourage single-passenger trips
Congestion A fee that is higher under congested To raise revenues and reduce traffic
pricing conditions than uncongested conditions, congestion.
(time-variable) intended to shift some vehicle traffic to
other routes, times and modes.
Cordon fees Fees charged for driving in a bounded To reduce congestion in major
area of a city such as City Centre urban centers.
HOV lanes A high-occupancy-vehicle lane that To favour HOVs compared with a
accommodates a limited number of general-purpose lane, and to raise
lower-occupant vehicles for a fee. revenues compared with an HOV
lane.
Distance-based A vehicle use fee based on how many To raise revenues and reduce
fees kilometres a vehicle is driven. various traffic problems.
Pay-As-You-Drive Pro-rates premiums by mileage so vehicle To reduce various traffic problems,
insurance insurance becomes a variable cost. particularly accidents.
35
Ibid.
36
Littman, Todd. n.d. “Road Pricing: Congestion Pricing, Value Pricing, Toll Roads and HOV Lanes.” Victoria Transport Policy
Institute. http://www.vtpi.org/tdm/tdm35.htm.
City of Ottawa Energy Transition Strategy | 28Uptake Scenarios
In the Aggressive Scenario, a Cordon Congestion Charge is applied in Ottawa’s downtown core, with
bounding streets: Bronson (West), Catherine (South), and Queen Elizabeth Drive (East), the north
boundary extends to the Ottawa River (Figure 13). A congestion charge of $20 (higher than London,
UK in order to test the policy)37 is assumed between 6:00 am and 10:00 am on weekdays.
This action was developed using Ottawa’s transportation model in an Integrated Scenario and
responds to a suite of land-use changes.
Table 15: Uptake scenarios for congestion charges.
Action Conservative Moderate Aggressive
Congestion Charges None None $20 congestion charge
applied to the downtown
core between 6:00 am and
10:00 am on weekdays.
Figure 13. Modelled congestion charge zone for Ottawa.
37
“Congestion Charge” Transport for London. https://tfl.gov.uk/modes/driving/congestion-charge
City of Ottawa Energy Transition Strategy | 29Enhanced Transit
Quality transit is the backbone of any sustainable transportation plan and will often impact land-use
decisions, requiring a more dense urban form and mix of land-uses. Quality transit service is a
significant strategy to reduce GHG emissions and keep them low; the Confederation Line as a transit
enhancement in Ottawa will reduce an estimated 94,000 tonnes of GHG emissions by 2031.38 A shift
away from personal vehicle use towards transit usage can reduce household emissions up to 2,177
kg of CO2 per year according to the American Public Transit Institute.39
In addition to reducing greenhouse gas emissions, enhanced transit can have many other important
benefits to a community, including greater public space, a less noisy environment, greater
accessibility for persons with different physical abilities, and less urban space dedicated to roads.
Higher ridership of transit can result in reduced energy use within a community, greater options for
walking and cycling, and reduced VKT.
Well designed transit systems work best in compact and mixed use communities, which implies a
relation to land-use. When transit and land-use work well together, further gains in walking and
cycling use can be realized and community emissions from transportation are further reduced.
Transit Policies and Strategies
Many strategies exist to enhance transit within a community, including:
● Improving system performance through additional routes, coverage area, frequency of
service and hours of operation;
● Increasing efficiency through the introduction bus only lanes during peak times;
● Using Bus-Rapid Transit systems with permanent dedicated bus lanes to increase travel
speed and rider convenience;
● Increasing the share of transit vehicles that are electric;
● Reducing fares for weekends and holidays;
● Keeping fares low;
● Enhancing design of transit stations and stops to provide safety and comfort for riders.
Making efforts for placemaking (see Car-Free Areas);
● Developing phone apps for more rider information, use one-tap cards for transit and other
services; and
● Allowing flexibility in the system for the “last-mile” by introducing better pedestrian design
and bicycle facilities. Partnering with car-share operators to provide parking near transit
stations or use transit tap cards (see car share options).
38
Transforming our Nation’s Capital: The Benefits of Light Rail. City of Ottawa. 2012.
http://www.ligneconfederationline.ca/media/pdf/The%20Benefits%20of%20Light%20Rail%20-%20Web.pdf
39
“Public Transportation Greenhouse Gases and Conserves Energy.” n.d. American Public Transport Association.
https://www.apta.com/resources/reportsandpublications/Documents/greenhouse_brochure.pdf.
City of Ottawa Energy Transition Strategy | 30You can also read