Sustainable Mobility Policy Review - Background Paper 4 Congestion
←
→
Page content transcription
If your browser does not render page correctly, please read the page content below
Sustainable Mobility Policy Review

Background Paper 4
Congestion
Contents

Context and questions for consideration................................................................................................................... 1

1               Structure of the paper .................................................................................................................................. 2

2               Traffic congestion and Ireland .................................................................................................................... 3

3               Existing policy approach ........................................................................................................................... 14

4               Interventions ............................................................................................................................................... 25

5               Supply-focused interventions .................................................................................................................. 33

6               Demand-focused interventions ............................................................................................................... 39

7               Concluding points....................................................................................................................................... 58

Acronyms....................................................................................................................................................................... 63

References..................................................................................................................................................................... 64
List of Case Studies
Decoupling travel demand and private car travel – the London experience................................................... 26
Road space reallocation – the Irish experience ..................................................................................................... 36
Congestion charges – Stockholm ............................................................................................................................. 41
Parking management – Zurich .................................................................................................................................. 44
Parking management – Nottingham ........................................................................................................................ 45
Organisation level mobility management in Ireland ............................................................................................. 50
Personal Travel Planning – the Irish experience ................................................................................................... 52

List of Figures
Figure 2.1:          Causes of congestion across London, 2015.....................................................................................4
Figure 2.2:          M50 AM Peak Traffic ...........................................................................................................................6
Figure 2.3:          M50 AM traffic throughput (southbound, N4-N7 section) ..........................................................7
Figure 2.4:          Forecasted annual average daily traffic in 2023 (published 2014) .............................................8
Figure 2.5:          Actual annual average daily traffic in 2017......................................................................................8
Figure 3.1:          Projected AM commute mode shares in the GDA in 2035 ....................................................... 21
Figure 4.1:          How road capacity expansion generates traffic ........................................................................... 29

List of Maps
Map 2.1:             Greater Dublin Area - Radials into M50 and on the M50 .......................................................... 11
Map 2.2:             Galway - national roads approaching the city centre.................................................................. 12
Map 2.3:             Cork national roads approaching the city centre ......................................................................... 12

List of Tables
Table 2.1:            Rising traffic volumes on N40 corridor ............................................................................................9
Table 4.1:            Congestion alleviation measures/interventions .......................................................................... 28
Table 5.1:            Road development under NDP 2018-2027 ................................................................................. 37
Table 6.1:            International approaches to corporate mobility management ................................................. 48
Context and questions for consideration
This background paper is one of a number of papers that have been prepared by the Department
of Transport, Tourism and Sport to inform a public consultation on Ireland’s sustainable mobility
policy. The review work arises from a commitment in the Programme for a Partnership
Government1 to review public transport policy “to ensure services are sustainable into the future
and are meeting the needs of a modern economy”. The public consultation is designed to give
stakeholders, interested parties and the general public the opportunity to reflect on the
information and analysis in the papers, to share their views, and to contribute to the development
of a Sustainable Mobility Policy Statement.
Sustainable Mobility can be described as linking people and places in a sustainable way by
supporting:
comfortable and affordable journeys to and from work, home, school, college, shops and
leisure;
travelling by cleaner and greener transport; and
a shift away from the private car to greater use of active travel (walking and cycling) and
public transport (e.g. bus, rail, tram).
All elements of sustainable mobility (public transport, cycling, walking) are being considered in the
policy review. Each background paper includes a number of questions to generate ideas about the
extent to which the present approach to sustainable mobility is working well, the areas which are
not, and future priorities.
This background paper sets out trends in Irish traffic congestion, policy interventions to date,
other potential interventions and international examples to address traffic congestion. The
questions below are included as a guide. Participants in the public consultation are not confined to
answering the suggested questions and are invited to offer any other contribution they wish to
make. It is recommended that submissions are confined to circa 2,500 words or less.
4.1 What are the opportunities and challenges around reducing traffic congestion in
our cities and other urban areas and how can sustainable mobility respond to
these?
4.2 Should additional demand management measures be considered, alongside supply
focused measures, to address urban congestion – for example congestion
charging/road pricing?
4.3 Are there international best practice examples to address traffic congestion that
could be applied in an Irish context?
1
1 Structure of the paper
Section 2:   Traffic congestion and Ireland defines road-based traffic congestion and its causes
             and identifies the economic, environmental and social causes of congestion. It
             then focuses on trends in transport demand in Ireland. In order to visualise the
             nature of congestion in Ireland, the Section includes a number of maps looking at
             the performance of a sample of key roadways in the Greater Dublin Area (GDA),
             Cork and Galway.

Section 3:   Existing policy approach sets out the existing policy approach in Ireland to tackle
             congestion at national, regional, metropolitan and local level. It identifies the
             stakeholders who have a role in the alleviation of congestion and the current
             institutional arrangements in place. The relevant strategies both nationally and
             regionally are also outlined along with the existing targets and expected results of
             these strategies.

Section 4:   Interventions looks at the aim of policy interventions to address congestion
             including decoupling the growth of private car use from future growth in travel
             demand.     It lists common demand and supply focused policy interventions to
             reduce traffic congestion and these interventions are expanded on in Sections 5
             and 6.    The Section also considers road capacity and induced demand. Finally it
             sets out the interaction between interventions to alleviate congestion and other
             Government policy areas.

Section 5:   Supply-focused interventions describes supply focused policy options to alleviate
             congestion particularly investment in sustainable mobility capacity. This includes
             development of sustainable mobility infrastructure (public transport, active travel)
             and provision of additional public transport services. The Section also looks at a
             number of supply-focused road measures including road space reallocation and
             road space widening.

Section 6:   Demand-focused interventions describes policy options to alleviate congestion by
             focusing on how and when travellers make journeys. The Section looks at demand
             focused measures such as fiscal measures, parking policies, traffic management,
             mobility management, technology and mobility as a service/shared mobility.

                                              2
2 Traffic congestion and Ireland
2.1 Introduction
This Section defines road-based traffic congestion and its causes and identifies the economic,
environmental and social causes of congestion. It then focuses on trends in transport demand in
Ireland. In order to visualise the nature of congestion in Ireland, this Section includes a number of
maps looking at the performance of a sample of key roadways in the Greater Dublin Area (GDA),
Cork and Galway.
2.2 What is road-based traffic congestion?
Road-based traffic congestion is a condition on transport networks that occurs as use increases. It
is characterised by lower travel speeds, an increased frequency of delays, longer trip times,
increased traffic jams, and a reduction in reliability of travel times. While congestion is a possibility
for any mode of transportation, this paper focuses on motorised vehicle congestion on public
roads.
Congestion is a function of travel demand and supply. Travel demand and supply can be
considered, in this case, to be made up of a combination of road space supply/demand and
sustainable mobility supply/demand. A certain amount of congestion is not necessarily bad as it is
a sign of economic and social activity. ‘Aggravated congestion’, however, is defined as congestion
levels above those which would be expected on a properly functioning road. It occurs when the
number of vehicles on a part of the network is higher than the number which is economically
desirable.
Congestion is caused by a situation where road space supply is not sufficient to adequately cope
with road space demand. This supply and demand imbalance generally takes three forms:
Recurrent Demand Imbalance: This refers to a situation where demand and supply are
relatively consistent, with demand consistently being greater than supply. This is a broad
network issue and suggests that there is a need to invest in long-term programmes to
reduce demand or increase supply. Traffic jams which happen in the same part of a city
every day during the morning peak time are examples of this kind of congestion.
Temporary Excess Demand: This refers to a situation where the need to use particular
routes is temporarily increased beyond normal levels, to an extent which causes
aggravated congestion. An example is when traffic jams happen on routes near a concert
or sporting event. Another might be a case where a route to a beach becomes congested
on a sunny day.
Temporary Supply Decreases: This refers to a situation where particular routes, or some
capacity on those routes, is closed off for a short period of time, forcing traffic onto other
routes, and therefore causing aggravated congestion. The most common examples of this
are road-works, breakdowns and accidents.
Figure 2.1 based on a 2017 report by Transport for London on understanding and managing
congestion2, outlines the causes of congestion across London in 2015. This shows that 55%
3related to recurrent demand, 16% was accredited to excess demand, while 22% was related to
supply decreases such as road-works, collisions, and breakdowns. A further 3% related to control
devices, usually traffic calming measures, traffic lights, etc. It is likely that these control devices are
in locations where safety is being prioritised over stable flow of traffic. The ‘Other’ section is a
combination of various unclassifiable causes.
Figure 2.1: Causes of congestion across London, 2015
Excess demand
(some may
relate to
Other, 4%
incidents), 16%
Control
devices, 3%
Breakdowns, Recurrent
3% Demand, 55%
Collisions, 4%
Road Works,
15%
Source: Transport for London
There is no similar study available for Irish cities or for the GDA but it can be assumed that the
ranking of congestion causes would be similar in an Irish setting – most congestion being caused
by overall network imbalances, and just under a third of congestion being caused by a combination
of road capacity supply issues such as road-works, accidents and breakdowns and occasional non-
pattern increases in demand to travel to a specific place. As such, the most common drivers of
congestion are, arguably, overall travel demand and supply.
Travel demand, in general, is pro-cyclical – it correlates closely with economic performance and
population growth. As population and economic performance grow, more journeys are created –
mostly movement between work places and residential areas and movement to obtain or provide
goods and services.
2.3 Why must we tackle congestion, and why now?
Traffic congestion is a major issue in Ireland’s cities and other urban areas and creates a range of
economic, environmental and social costs. The focus of transport policy is primarily on the
sustainable and efficient movement of the transport network’s users and, as a result, ensuring that
congestion does not reach unacceptable levels is of key importance. Associated costs of
congestion include lost time, increased vehicle operating costs, emissions and other environmental
impacts such as air quality and pollution. Congestion is closely related to increased private car
usage and causes increased time on the road for these cars. The combination of more cars
4spending more time on the road leads to a significant growth in aggregate emissions from private
cars.
In addition, aggravated congestion leads to costs to the wider economy by increasing the costs of
doing business and a resulting reduction in the relative attractiveness of an area as an option to
locate a business. Longer and more unpredictable journey times mean that people spend more
time travelling and less time in the places they are trying to get to. This can increase levels of
personal stress for commuters and impact negatively on health and quality of life. Congestion also
causes issues for place-making in urban areas. Urban roads filled with cars create pressures to
increase road space, and reduce the flexibility of planners to create more public spaces for other
use.
The 2017 Department of Transport, Tourism and Sport’s (DTTAS) Costs of Congestion, An Analysis
of the Greater Dublin Area3 report provides an important landmark in putting a cost on congestion
at present, and into the future. It identified annual costs of €358 million in the GDA in 2012 and
forecast annual costs of €2.08 billion per year in 2033, in the absence of intervention. These costs
are based on time lost through increased journey times. At a pivotal point for Ireland’s growth,
rising aggregate delays for commuters and other road users can only negatively affect
competitiveness.
Congestion significantly impacts quality of life, community spaces, the ability to engage
economically, and the health of the air and climate. It is increasing, and increasing faster than
forecasted to. It is necessary to take decisive action to reverse this trend.
2.4 Transport demand
The advent of Ireland’s economic downturn in 2008 impacted significantly on transport demand
across the country. Largely reflecting the growth in unemployment, aggregate transport demand
in the GDA, in particular, fell between 2008 and 2012. However, after that period of reduced
transport usage, transport activity and demand has been steadily growing again, and is expected to
expand further in future years in line with forecasted economic growth rates. Public transport
usage and private car usage have risen in parallel with each other, to support this rising demand.
While this rise in economic activity is positive for almost all areas of the economy, it places a great
deal of pressure on the transport network. In addition, the planning and development of new
housing over the last few decades has led to dispersed population settlements and urban sprawl in
the cities. This has contributed to congestion problems.
Journeys times are getting longer, peak travel periods are starting earlier and ending later, while
time spent commuting each day is growing. From 2014, for the first time since the completion of
the M50 upgrade, users of the motorway began to experience a pattern of increasing journey
times during peak hours as the volume of traffic in some of the motorway lanes approached the
capacity of those lanes. Aggravated congestion in certain sections of the M50 during peak hours
is now a daily event.
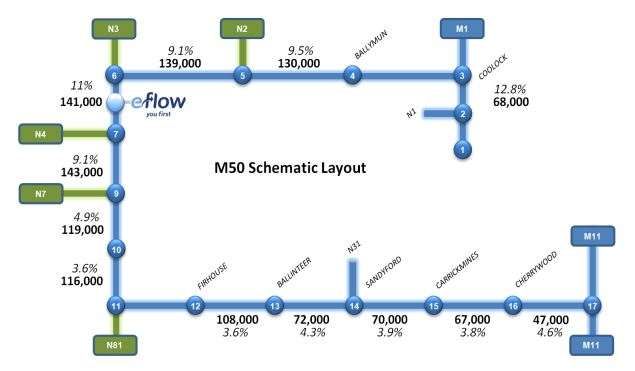
5Transport Infrastructure Ireland (TII) has operational responsibility for the M50 and, in 2014, in
conjunction with the four Dublin local authorities, published the M50 Demand Management
Report4. This report looked at trends on the M50 including a comparison of weekday average
morning peak hour traffic flows for January 2010 and February 2013, as shown in Figure 2.2.
Figure 2.2: M50 AM Peak Traffic
Source: M50 Demand Management Report
Figure 2.3 from TII shows the impact of congestion on traffic throughput on the N4 to N7
southbound section of the motorway and that morning congestion is suppressing peak traffic
throughput on this section. The morning peak throughput in 2015 was below 2014 levels, in spite
of higher demand. The graph shows that fewer cars are travelling during the traditional “peak”,
which may be due to congestion on the roads. However, this is probably not due to shifts of
modes but to drivers choosing to start journeys outside of traditional peak hours. This may seem
like an example of market conditions leading to an efficient distribution of road capacity.
However, the impact is that commuters are choosing to alter their schedules to allow them to
continue to drive their cars but avoid congestion instead of choosing to adapt to other modes.
6Figure 2.3: M50 AM traffic throughput (southbound, N4-N7 section)
Source: Transport Infrastructure Ireland
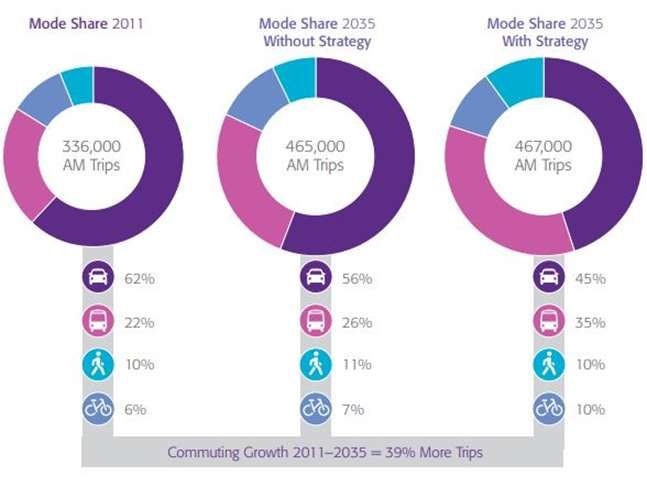
TII also modelled expected growth in traffic volumes on the M50 in 2023 as part of the M50
Demand Management Report. In the model, Annual Average Daily Traffic (AADT) figures were
outlined which showed the forecasted average daily number of vehicles at each junction on the
M50 in 2023. These forecasts were modelled in 2014 from a 2011 baseline. However, in TII’s
National Roads Network Indicators 20175, the actual AADT performance of the M50 showed that,
on every stretch of the motorway, the 2017 figures were higher than the 2023 predicted volumes.
The forecast and actual volumes are shown in Figure 2.4 and Figure 2.5. This highlights the rapid
rise in travel demand, and the importance of reviewing modelling data regularly, especially when
underlying expectations change. The percentages shown in Figures 2.4 and 2.5 represent the
number of heavy goods vehicles (HGVs) as a percentage of the total number of vehicles. For
example in Figure 2.5, there is an AADT of 22,000 vehicles between junctions 1 and 2 (the port
tunnel) of which 41% are HGVs.
7Figure 2.4: Forecasted annual average daily traffic in 2023 (published 2014)
Source: M50 Demand Management Report
Figure 2.5: Actual annual average daily traffic in 2017
Source: National Roads Network Indicators 2017
The National Transport Authority (NTA) and Dublin City Council (DCC) publish an annual Canal
Cordon Report6 which looks at trends in vehicles and people travelling into Dublin city centre in the
morning peak period. The 2018 report shows a reduction in the number of cars entering the city
every morning from over 59,000 in 2008 to over 48,000 in 2018. However, the total number of
journeys has grown from over 181,000 journeys in 2010 to almost 214,000 journeys in 2018. In
2015, the NTA and DCC published the Dublin City Centre Transport Study7. This study estimated
that by 2023, the transport network of Dublin city will be required to cater for approximately
40,000 additional journeys each morning, an increase of almost 20% on 2015 levels. The study
considered that it is not possible to cater for this increase by private vehicles alone, as if even 20%
8of these additional trips were made by car it would represent an increase of 8,500 cars on the
road during the morning peak. This would effectively return the traffic volumes and congestion in
the city to levels last seen in the early 2000s.
In relation to the travel demand in the other cities, the 2016 Galway Transport Strategy8 showed
that Galway city experiences peak hour congestion and journey time unreliability for all motorised
transport. The 2013 Cork City Centre Movement Strategy identified that 66% of city centre traffic is
through-traffic with destinations outside the city centre9. TII in consultation with Cork City
Council, Cork County Council and various other stakeholders published the N40 Demand
Management Report10 in 2017. The analysis in that report, as shown in Table 2.1, noted
considerable growth in traffic flows observed along the N40 corridor over the years 2013 to
2016.
The draft Cork Metropolitan Area Transport Strategy11, which was published in May 2019 for public
consultation, noted traffic congestion and delays at key locations on the national road network
during peak periods, such as the Dunkettle Interchange (junction of the N8, M8, N25 and N40)
and on sections on the N40.
Table 2.1: Rising traffic volumes on N40 corridor
Location 2013 AADT 2016 AADT % Change
N25 at Little Island 48,800 53,200 +9.0%
N40 at Jack Lynch Tunnel 59,100 65,000 +10.0%
N40 between N28 & Mahon 58,500 69,500 +18.8%
N40 between N27 and N28 76,700 84,400 +10.0%
N40 between N22 and N71 33,300 39,800 +19.5%
N22 at Ovens 18,800 20,900 +11.2%
Assuming that economic growth will remain a priority aim of Government and that, in general, the
current economic performance will continue, it is reasonable to assume consistently rising travel
demand across the country, particularly in the cities and in the GDA. The DTTAS 2015 ‘Strategic
Framework for Investment in Land Transport’12 advised that, based on conservative population and
employment growth scenarios, commuting trips nationally are expected to rise by 35% over
current levels by 2040.
Road space supply increased significantly in Ireland in the latter parts of the 20th century and the
early parts of the 21st with large public investment in expanding and upgrading the road network
nationally. However, urban road space is unlikely to increase dramatically, particularly in the GDA,
in the coming years. Space to expand roads is becoming scarcer, and competition for that space is
high. Without intervention, rising demand to use private cars, coupled with largely static road
space supply will exacerbate the congestion issues that are evident today.
92.5 Visualising congestion in Irish cities
In order to visualise the nature of congestion in Ireland, this paper looks at the performance of a
sample of key roadways in the GDA, Cork and Galway. This is not to suggest that congestion does
not happen in any other locations. Congestion also occurs in the other cities, as well as other
urban areas throughout the country.
Map 2.1, Map 2.2 and Map 2.3, provided by TII, demonstrate congestion through showing Level
Of Service on national roads. Level of Service (LOS) is a quality measure used to describe
operational conditions within a traffic stream. In general, LOS is a measure of a combination of
service indicators such as speed, travel time, freedom to manoeuvre, traffic interruptions, comfort
and convenience. Six LOS are defined from A to F, with LOS A representing fully stable flow
operations and LOS F representing complete breakdown in vehicular flow. A brief definition of
each LOS is as follows:
LOS A – describes stable flow operations. Stable flow speeds prevail. Vehicles are almost
completely unimpeded in their ability to manoeuvre within the traffic stream. The effects
of incidents or point breakdowns are easily absorbed at this level.
LOS B – represents reasonably stable flow, and stable flow speeds are maintained. The
ability to manoeuvre within the traffic stream is only slightly restricted, and the general
level of physical and psychological comfort provided to drivers is still high. The effects of
minor incidents and point breakdowns are still easily absorbed.
LOS C – provides for flow with speeds at or near the stable flow speeds of the motorway.
Freedom to manoeuvre within the traffic stream is noticeably restricted, and lane changes
require more care and vigilance on the part of the driver. Minor incidents may still be
absorbed, but the local deterioration in service will be substantial. Queues may be
expected to form behind any significant blockage.
LOS D – is the level at which speeds begin to decline slightly with increasing flows and
density begins to increase somewhat more quickly. Freedom to manoeuvre within the
traffic stream is more noticeably limited, and the driver experiences reduced physical and
psychological comfort levels. Even minor incidents can be expected to create queuing,
because the traffic stream has little space to absorb disruptions.
LOS E – describes operation at capacity. Operations at this level are volatile, because
there are virtually no usable gaps in the traffic stream. Vehicles are closely spaced leaving
little room to manoeuvre within the traffic stream at speeds that still exceed 80 km/h. Any
disruption of the traffic stream, such as vehicles entering from a ramp or a vehicle
changing lanes, can establish a disruption wave that propagates throughout the upstream
traffic flow. At capacity, the traffic stream has no ability to dissipate even the most minor
disruption, and any incident can be expected to produce a serious breakdown with
extensive queuing. Manoeuvrability within the traffic stream is extremely limited.
10 LOS F – describes breakdowns in vehicular flow. Such conditions generally exist within
queues forming behind breakdown points.
It is important to note that the LOS definition is not necessarily related to traffic flow. It also refers
to the ability to manoeuvre within a traffic stream. This is particularly prevalent between LOS E
and LOS F where it is more likely at LOS F that there will be a lower overall traffic volume than
LOS E due to a bottle-neck resulting from a breakdown.
Map 2.1 for the GDA shows unstable flow or forced or breakdown flow at many points of the
M11 and N7, on the N81 leading through Tallaght and Firhouse, in areas around Lucan on the M4,
from Mulhuddart into the Dublin city centre on the N2, at points on the M1 such as Swords and
Balbriggan, and between junctions 12 and 13 on the M50 itself. Most of the M50 itself shows
signs of approaching unstable flow.
Map 2.1: Greater Dublin Area - Radials into M50 and on the M50
Source: TII
The Galway map (Map 2.2) shows unstable flow or forced or breakdown flow into the city centre
from Galway Technology Park (N6), Two Mile Ditch (N83), Ballindooley (N84), and Oranswell
(N59). All travel into the city centre via national road would pass through these areas. A number of
points on these same roads further from the city are also approaching unstable flow.
11Map 2.2: Galway - national roads approaching the city centre
Source: TII
The Cork map (Map 2.3) shows unstable flow or forced or breakdown flow at multiple points
leading in to the city centre, from Monees (N28), the Cork Airport Business Park (N27), from Spur
Hill (N71), from Blackpool Shopping Centre (N20), from the Tivoli Docks (N8) and along the R641,
which leads past Cork University Hospital. Levels approaching unstable flow can be seen at
multiple points along these roads. All travel into the city centre via national road would pass
through these areas.
Map 2.3: Cork national roads approaching the city centre
Source: TII
12Section 2 key points
Traffic congestion is a major issue in Ireland’s cities and other urban areas.
The primary focus of transport policy is on the sustainable and efficient movement of the
network’s users and ensuring that congestion does not reach unacceptable levels.
Associated costs of congestion include lost time, increased vehicle operating costs and
environmental impacts such as emissions, air quality and pollution.
Wider costs to the economy include increased costs of doing business and a resulting
reduction in the attractiveness of areas to locate businesses.
The annual cost of time lost due to aggravated congestion in the Greater Dublin Area is
forecasted to rise from the current estimated cost of €358 million to over €2 billion in
2033, in the absence of interventions.
Congestion can increase levels of personal stress for commuters and impact negatively on
health and quality of life.
The historic planning and development of new housing has led to dispersed population
settlements and urban sprawl in cities which has contributed to congestion problems.
Transport demand has been growing steadily in recent years and is expected to grow
further in the future in line with forecasted economic growth rates.
Public transport usage and private car usage have risen in parallel with each other and this
is placing a great deal of pressure on the transport network.
In Dublin, daily aggravated congestion in certain sections of the M50 motorway during
peak hours is increasing and traffic volumes on the motorway are now higher than
forecasted.
Traffic and congestion levels are also growing on radial routes approaching Dublin city,
inside the M50.
There are similar traffic and congestion patterns in other cities, regions and towns.
By 2040, commuting trips nationally are expected to rise by 35% over current levels.
Without intervention, rising demand to use private cars, coupled with largely static road
space supply will exacerbate the congestion issues that are evident today,
133 Existing policy approach
3.1 Introduction
This Section sets out the existing policy approach in Ireland to tackle congestion at national,
regional, metropolitan and local level. It identifies the stakeholders who have a role in the
alleviation of congestion and the current institutional arrangements in place. The relevant
strategies both nationally and regionally are also outlined along with the existing targets and
expected results of these strategies.
3.2 Institutional arrangements
There are a number of stakeholders with different roles and responsibilities in relation to
alleviation of congestion at national, regional, metropolitan and local level. These are:
Department of Transport, Tourism and Sport
National Transport Authority
Transport Infrastructure Ireland
Regional Assemblies
Local Authorities
An Garda Síochána
An inter-agency approach has been adopted by stakeholders on a number of congestion related
issues. Examples of this inter-agency approach are outlined later in this Section.
Institutional arrangements in Ireland Scope
Stakeholders Department of Transport, Tourism and Sport (DTTAS) National
National Transport Authority (NTA) Regional (GDA)
Transport Infrastructure Ireland (TII) National
Regional Assemblies Regional
Local Authorities Local
An Garda Síochána National
Strategies Smarter Travel - A New Transport Policy for Ireland 2009-2020 National
Strategic Investment Framework for Land Transport (2015) National
NTA Transport Strategy for the Greater Dublin Area 2016-2035 Regional
Galway Transport Strategy Metropolitan
Draft Cork Metropolitan Area Transport Strategy Metropolitan
Target Reduce the share of people commuting by private car (nationally) National
from 65% to 45% by 2020 (Smarter Travel)
The institutional arrangements in Ireland are similar to those in other countries whereby transport
agencies work with local authorities to tackle congestion issues and within a broad policy and
statutory framework set at Government level. In most countries, the police also play a role in road
safety and traffic management issues. Similar to the institutional arrangements in Ireland for the
GDA, a number of other countries have developed regional/city transport strategies. While these
strategies cover a range of transport policy issues, addressing urban congestion is a common
theme across the strategies. Examples include the Mayor of London’s Transport Strategy (2018)13,
14Stockholm’s Urban Mobility Strategy (2012)14 and the Helsinki Region Transport System Plan (2015)15.
Each of these strategies identify targets to increase the mode share for public transport trips over
the lifetime of the strategy – e.g. a target of 80% sustainable mode share for trips by 2041
(London); public transport’s shares of motorised transport journeys during peak hours to be 80%
by 2030 (Stockholm); and public transport mode share trips to increase by 6% (Helsinki).
Targets are useful to support the setting and reaching of public policy goals and – provided they
are credible - they also have a symbolic function, in that they signal commitment to a goal. The
DTTAS Common Appraisal Framework for Transport Projects and Programmes16 states that objectives
should be SMART (specific, measurable, accurate, realistic and timely). For example, a commitment
to improving something may be a positive step, but the success of policies aimed at, say, a 20%
improvement, can be monitored and evaluated. An ability to show that the improvement of
around 20% happened shows that the policy or strategy was justified and engenders trust in
future plans and investments. Working towards targets also allows policy makers to judge
medium-term progress of strategies, and to re-strategise where necessary.
3.2.1 Department of Transport, Tourism and Sport (DTTAS)
The Department of Transport, Tourism and Sport (DTTAS) is responsible for the development of
land transport policy and legislation. Ireland’s land transport system comprises the road, rail,
cycling and walking networks, together with bus, rail and taxi services. The DTTAS’ high-level goal
for land transport, as set out in its Statement of Strategy 2016-201917, is “to best serve the needs of
society and the economy through safe, sustainable and competitive transport networks and services”.
The two existing national policies relevant to the alleviation of congestion are Smarter Travel: A
Sustainable Transport Future 2009-202018 and the 2015 Strategic Investment Framework for Land
Transport (SIFLT). Further details on these two policies are outlined in Section 3.3.
The DTTAS has a number of agencies under its remit in the land transport sector. Those with roles
around the alleviation of congestion are the National Transport Authority and Transport
Infrastructure Ireland.
3.2.2 National Transport Authority (NTA)
The NTA was established as a non-commercial State body under the Dublin Transport Authority Act
200819, as amended. Its purpose is to bring a more focussed and integrated approach to the
planning and delivery of transport infrastructure and services both on a national basis generally
and especially in the GDA where the NTA has a more detailed remit. The legislation sets out the
functions of the NTA in the GDA which includes the following functions particularly relevant to
the alleviation of congestion:
undertake strategic planning of transport;
promote the development of an integrated, accessible public transport network;
promote increased recourse to cycling and walking as a means of transport;
secure the:
o provision of public transport infrastructure,
o effective management of traffic,
o effective management of transport demand;
15The NTA also has responsibility for the preparation of:
a strategic transport plan for the GDA for a period of between 12 and 20 years;
a six-year integrated implementation plan;
a traffic management plan;
traffic management guidelines.
Under the Act, the NTA also has responsibility for implementation of demand management
measures in the GDA. Demand management measures have been defined as measures which
promote a reduction in the total amount of travel or reduced growth in the total amount of travel
and include measures to:
reduce the need to travel;
reduce the use of mechanically-propelled vehicles and particularly private cars;
increase travel by public transport, bicycle or on foot as an alternative to the private car;
encourage travel at less congested periods other than by means of a congestion charge;
reduce trip length.
The present Transport Strategy for the Greater Dublin Area 2016-203520, which the NTA drew up in
fulfilment of its statutory responsibility, provides a framework for the planning and delivery of
transport infrastructure and services in the GDA over the next two decades. The 20-year strategy
will be supported and given effect over the course of its lifetime through a sequence of 6-year
implementation plans – these succeeding the NTA's present Integrated Implementation Plan 2013-
201821 – and these shorter term implementation plans will set out the investment priorities and
proposals for the relevant period.
3.2.3 Transport Infrastructure Ireland (TII)
TII is a non-commercial State body and was established through a merger of the National Roads
Authority and the Railway Procurement Agency under the Roads Act 201522. TII has statutory
responsibility to secure the provision of a safe and efficient network of national roads. For this
purpose, it has overall responsibility for planning and supervision of construction and maintenance
works on these roads in conjunction with the relevant local authorities.
TII has operational responsibility for the M50 and along with a number of other stakeholders is
continuing to implement a number of measures to manage demand and optimise operational
efficiency on the M50. The specific measures introduced are referred to in Section 6 of this paper.
3.2.4 Local authorities
Local authorities are the road authorities for their respective administrative areas and the
improvement and maintenance of regional and local roads is the statutory responsibility of each
local authority. Local authorities are also statutorily responsible for traffic management within
their areas of responsibility. This can cover a wide range of measures some of which include bus
priority improvements, junction upgrades, speed management, traffic-calming, safety measures
and parking management.
163.2.5 An Garda Síochána
An Garda Síochána has responsibility for the enforcement of road traffic law. The Gardaí work
closely with the Road Safety Authority and local authorities in addressing all road incidents.
Improving road safety and significantly reducing the incidence of fatal and serious injury on Irish
roads is the main responsibility of an Garda Síochána’s Roads Policing Unit.
Examples of inter-agency coordination and cooperation on congestion related issues
2014: TII in conjunction with the four Dublin local authorities published the M50 Demand
Management Study which examined a range of short-term and longer-term measures
to “manage demand and optimise operational efficiency on the M50”.
2015: TII initiated the Interagency Incident Coordination Group which includes the principal
stakeholders involved in the management of the M50 and its approach roads. The
members include An Garda Síochána, the Dublin Fire Brigade, the four Dublin local
authorities, the Motorway Traffic Control Centre and TII.
2015: Dublin City Council and the NTA jointly published the Dublin City Centre Transport
Study which sets out the various measures proposed for Dublin's city centre to
ensure the efficient functioning of transport in the area.
2017: TII in consultation with Cork City Council, Cork County Council and various other
stakeholders published the N40 Demand Management Study which identified a
number of indicative scheme-specific demand management measures that
“demonstrated the need for demand management on the N40, provided a rigorous
assessment of potential demand management interventions specifically for the N40 and
demonstrated the feasibility of the demand management measures.”
2018: The NTA, in conjunction with the four Dublin local authorities, established a Traffic
Coordination Group to ensure that adequate arrangements are in place to
effectively manage traffic in the region in a coordinated manner.
3.3 National policy
The DTTAS’ Smarter Travel: A Sustainable Transport Future set out national transport policy for
2009-2020. One of the key goals of the strategy was to “improve economic competitiveness through
maximising the efficiency of the transport system and alleviating congestion and infrastructural
bottlenecks”. The Policy contained 49 actions, including a number of congestion alleviation
measures. Some of these individual actions are referred to later in Sections 5 and 6. In the context
of its work in reviewing sustainable mobility policy, DTTAS has undertaken a review of the
implementation status of each of the 49 actions that were put forward in the 2009 documents.
This review is being published alongside the background papers for public consultation.
Smarter Travel included a target that work-related commuting by car would be reduced from a
current modal share of 65% to 45% in 2020. Based on Census 2016 results, it is unlikely that this
target will be met on a national level. Census 2016 found that, in the State overall, 61.4% of
17working commuters drove to work in 2016. However, just under half of Dublin city and suburbs
workers commuted by car, which was the lowest across the State. The highest car use was in rural
areas, where 76% of commuters used the car to get to work.
In 2015, DTTAS published the Strategic Investment Framework for Land Transport (SIFLT) which
identified three key priorities for future investment in land transport. One of these priorities was
to address urban congestion and to improve the efficiency and sustainability of the urban
transport systems. The SIFLT considered that this must be guided by demand/capacity
assessments and recognise the role of urban centres as key drivers of economic activity, nationally
and regionally. The framework identified the following measures:
improved and expanded public transport capacity;
improved and expanded walking and cycling infrastructure;
the use of Intelligent Transport Systems to improve efficiency and sustainability and to
increase the capacity of existing urban transport systems.
The Framework noted that investments to improve the quality and time competitiveness of
alternatives to the car often play an important role as a driver of modal shift and should be
supported. It recognised that demand management measures may also prove necessary to, inter
alia, maximise the value of transport infrastructure. To receive investment, the SIFLT considered
that projects must be implemented in conjunction with supportive spatial planning policies.
The SIFLT identified ten actions for land transport across the following areas:
incorporating SIFLT transport priorities in investment plans;
integrating land use and transport planning;
identifying a Strategic Road Network;
developing a new Rail Policy;
maintaining a key role for careful project appraisal;
applying SIFLT research in future transport policy development.
Transport policy, including policies to address congestion, is closely linked with land use planning
policy and Background Paper 6 – Land Use Planning and Transport Planning considers this alignment
in more detail. Project Ireland 2040 (National Planning Framework and National Development Plan
2018-2027)23 is the Government’s high-level strategic plan for shaping the future growth and
development of the country out to 2040. The National Planning Framework (NPF) recognises that
previous dispersed and fragmented housing development has compounded issues such as
congestion and has increased commuting times. It commits to expand attractive sustainable
mobility alternatives to car transport to reduce congestion.
Alongside the policy review of sustainable mobility, DTTAS is carrying out a further piece of
analysis – the Planning, Land Use and Transport Outlook (or PLUTO) 2040 study. PLUTO 2040 will
take the objectives of Project Ireland 2040 (as set out in the NPF and the NDP) and the priorities
set out in the SIFLT, and develop high-level objectives for investment in Ireland’s roads and public
transport infrastructure on the basis of them. One of the key challenges PLUTO 2040 will set out
to address is the fact Ireland’s transport system faces a number of, at times competing policy and
18investment priorities (such as expanding transport infrastructure while keeping the existing
infrastructure in good condition). The purpose of PLUTO 2040 is to develop a transport
investment framework which delivers a land transport network that meets the travel needs of the
population in the coming decades and which supports the National Strategic Outcomes of Project
Ireland 2040.
3.4 Regional and metropolitan policy
3.4.1 Regional Spatial and Economic Strategies/Metropolitan Area Strategic Plans
At a regional level, Ireland is divided into the following three regional assembly areas:
Eastern and Midland;
Southern; and
Northern and Western.
The regional assemblies are tasked to coordinate, promote and support the strategic planning and
sustainable development of the regions. The primary vehicle for this is the preparation and
implementation of Regional Spatial and Economic Strategies (RSES) for a period of between 12
and 20 years. The RSESs will provide regional level strategic planning and economic policy in
support of the implementation of the NPF. For each of the three regions, the Regional Assemblies
are required to prepare their own RSES in accordance with the framework set by the NPF. The
RSESs should address a range of economic and spatial elements including the promotion of
sustainable transportation strategies in urban and rural areas.
The five cities each involve more than one local authority area, with the metropolitan area of
Dublin covering all or part of the area of seven local authority areas. While the three RSESs will be
developed to coordinate local authority plans at a strategic and regional assembly level, the span
of each regional assembly is too broad to be able to sufficiently focus on city and metropolitan
issues. So, in tandem with and as part of the RSES process, five separate coordinated Metropolitan
Area Strategic Plans (MASPs) will be prepared for the Cork, Dublin, Galway, Limerick and
Waterford Metropolitan Areas.
There is a statutory requirement for the Eastern and Midland Region RSES to be consistent with
the National Transport Authority’s (NTA) Transport Strategy for the Greater Dublin Area (GDA).
3.4.2 NTA Transport Strategy for the GDA
The NTA’s Transport Strategy for the Greater Dublin Area 2016-2035 is the primary strategy
document which is intended to deal with managing transport demand in the GDA. The overall aim
of the strategy is to “contribute to the economic, social and cultural progress of the Greater Dublin
Area by providing for the efficient, effective and sustainable movement of people and goods.” The
Strategy identified the following patterns and trends for the region:
Suburbanisation and spread of population, employment and other land uses has continued;
Mode share of car use continues to increase;
Car ownership – a key determinant of car use – is likely to increase further, up to
saturation levels;
Cycling has increased significantly in numbers and in mode share;
Recovery is occurring in public transport use, but not in its mode share;
19 Encouraging non-car use for trips to education is a significant challenge;
There is no spare capacity on the M50 motorway;
Protecting and enhancing access to the ports and Dublin Airport is a strategic priority; and
Current economic growth will mean that within the next few years, overall levels of travel
demand are likely to exceed the travel demand experienced in 2006 and 2007.
Addressing urban congestion is a priority of the Strategy and it proposed to achieve this through
the following:
The provision of alternative sustainable mobility infrastructure (heavy and light rail; bus;
cycling; walking);
Maintain, renew, manage and operate the road network infrastructure and undertake a
limited number of new projects on the road network;
The introduction of complementary demand management measures; and
Develop a network of park and ride facilities.
Proposed investments in sustainable mobility infrastructure and the roads network over the short
to medium term will be addressed further in Section 5 which looks at the focus of congestion
alleviating policy to date. The NTA Strategy considers that increased public transport provision,
coupled with enhanced cycling and walking facilities in urban areas, will provide the means to
cater for much of the projected increased travel demand in the GDA. However, the Strategy also
considers that, without complementary demand management measures, the full benefits of the
strategy will not be achieved. Over the period to 2035, the Strategy proposes to implement the
demand management measures set out below.
Demand Management measures proposed in GDA Transport Strategy
Encourage land use policies which support the provision of development in locations and
at densities which enable the efficient provision of public transport services;
Set maximum parking standards for all new developments, with the level of parking
provision applied being based on the level of public transport accessibility;
Reduce the availability of workplace parking in urban centres to discourage car
commuting, where alternative transport options are available;
Implement demand management measures on the M50 motorway to ensure that it
retains sufficient capacity to fulfil its strategic functions;
Implement, at the appropriate time, demand management measures to address
congestion issues on the radial national routes approaching the M50 motorway, to
ensure that these routes retain sufficient capacity to fulfil their strategic functions;
Secure the introduction or expansion of on-street parking controls, and charging
structures, that seek to reduce commuter parking and which contribute to greater
parking turnover for non-commuting purposes;
Introduce parking charges at out-of-town retail centres, to reduce the congestion
potential at these locations; and
20Demand Management measures proposed in GDA Transport Strategy
Support and facilitate the implementation and expansion of:
o Workplace Travel Plans for all large employers;
o Tailored travel planning information provision for residential and
commercial/retail areas;
o Travel Plans for schools, colleges and all education campuses; and
o Car club schemes, car-pooling and car sharing.
The GDA Strategy does not have a defined target for travel mode share but does include
modelling work on the forecasted mode share for commuting trips in 2035 based on ‘with
Strategy’ interventions and ‘without Strategy’ (Figure 3.1). It predicts that full implementation of
the Strategy will result in 45% of work commutes in the GDA undertaken by car by 2035. This is
not cited as a target of the Strategy, but is an expected result. The modelling is based on 2011
travel mode shares (which may be outdated, as evidenced by the rapid rise of GDA traffic in
recent years). A point to note is that the total number of car journeys is forecast to increase under
the Strategy. It may be appropriate to remodel for up to date expectations, in line with population
growth forecast in Project Ireland 2040, and to set a number of mode share targets and milestones
to drive delivery performance.
Figure 3.1: Projected AM commute mode shares in the GDA in 2035
Source: NTA Transport Strategy for the Greater Dublin Area 2016-2035
While the NTA’s statutory responsibility for transport planning applies only to the GDA, the
Authority has worked on an administrative, non-statutory basis to assist several local authorities in
other cities in preparing transport related strategies. Project Ireland 2040 commits to extend the
NTA’s statutory responsibility for transport planning beyond the GDA to cover all of Ireland’s
21cities. An example of the existing cooperation is the Galway Transport Strategy and the draft Cork
Metropolitan Area Transport Strategy. A key issue identified in both Strategies is urban congestion.
3.4.3 Galway Transport Strategy
The 2016 Galway Transport Strategy was developed on a joint basis by the NTA and Galway City
and County Councils as an integrated transport plan. The Strategy sets out an overall framework
for the development of transport infrastructure and services in Galway City and its environs over a
20-year period. Key issues identified in the Strategy include:
An over-reliance on private car travel;
Significant peak-hour congestion and journey time unreliability;
Significant dispersed traffic movements to, through and around the city centre area;
Constraints to national, regional and local transport movements, all of which funnel
through Galway City, including all movement to and from Connemara;
Limited bridge crossings on the River Corrib;
Key junctions operating over-capacity;
An inappropriate mix of transport modes within the city centre due to limited road space;
A public transport service and network in need of enhanced capacity and additional
priority;
A limited, discontinuous cycle network;
Restricted footpaths, poor accessibility for disabled/mobility impaired people; and
Associated safety issues due to poor walking and cycling infrastructure.
The Strategy identified key transport infrastructure projects and service changes to address the
existing transportation issues and provides a framework for their phased implementation, subject
to funding. The infrastructural projects include:
An enhanced city traffic network;
An improved bus network with a minimum frequency of 15 minutes or better at peak time
and improved residential and commercial access in a 10 minute walk (BusConnects);
Improved bus priority measures;
New Park and Ride services; and
Improved walking and cycling routes.
The Strategy proposes a number of other measures to support the infrastructural proposals. These
include:
Smarter Mobility – Smarter Mobility and Intelligent Transport Systems (ITS) will be
incorporated into the Strategy measures to support infrastructural proposals. This includes
expanding the existing City Urban Traffic Control network, using ITS to manage parking
efficiently, improving wayfinding around the city, upgrading street lighting and improving
and upgrading junctions.
Land Use Integration – The Strategy recognises that integrating land use with transport
demand is a fundamental requirement for creating a sustainable city.
Behavioural Change – Alternatives to the private car will be promoted for the workforce
and for students to raise awareness of the travel choices available and to underpin a shift
22to sustainable modes of transport. It is intended to continue the development of mobility
management plans at major employment and educational institutions.
Demand Management – The Strategy recognises that in order to shift the focus within the
city centre to walking, cycling and public transport, demand management measures are
needed to enhance the function of the city for these users. This may include measures
such as managing and controlling the availability and cost of parking, restricting traffic flow
from certain streets, reducing speed limits, providing additional pedestrian crossings at key
locations and having a reduced emphasis on facilitating through traffic.
3.4.4 Cork Metropolitan Area Transport Strategy
A draft Cork Metropolitan Area Transport Strategy was published in May 2019 for public
consultation. The draft strategy was developed by Cork City Council and Cork County Council, in
partnership with the NTA. Submissions received under the public consultation will be reviewed
and incorporated, where relevant, in the final Strategy which will be published by end 2019.
The Strategy will provide a framework for the planning and delivery of transport infrastructure and
services across the Cork Metropolitan Area, for the period up to 2040. The draft Strategy covers
proposals relating to all modes of transport including:
Improvements to Cork’s bus infrastructure through BusConnects Cork which will
introduce a revised, more extensive and higher capacity bus system;
Enhancements to the commuter rail service, including additional stations;
A light rail transit corridor to reflect the more ambitious growth targets of Project Ireland
2040;
A number of bus and rail-based park and ride sites;
Cycling and walking infrastructure; and
Improvements to the road network.
3.4.5 Limerick and Waterford Transport Strategies
Work is underway on the development of the Limerick Shannon Metropolitan Area Transport
Strategy and work will begin by end 2019 on the development of the Waterford Metropolitan Area
Transport Strategy.
Section 3 key points
A number of stakeholders have different roles and responsibilities for congestion
alleviation at national, regional and local level (DTTAS, NTA, TII, local authorities, Gardaí).
An inter-agency coordinated approach has been adopted, similar to other countries.
Internationally, addressing urban congestion is a common theme of metropolitan
transport strategies along with targets to increase the mode share for public transport
trips.
It is unlikely that Ireland’s Smarter Travel Policy target to reduce work-related commuting
by car to 45% in 2020 will be achieved at a national level.
23You can also read