Coal Requirement in 2020: A Bottom-up Analysis - ANURAG SEHGAL RAHUL TONGIA BROOKINGS INDIA - Brookings ...
←
→
Page content transcription
If your browser does not render page correctly, please read the page content below

BROOKINGS INDIA
                                         QUALITY. INDEPENDENCE. IMPACT

Coal Requirement in 2020:
A Bottom-up Analysis
ANURAG SEHGAL
RAHUL TONGIA

RESEARCH CONTRIBUTOR | ABHISHEK MISHRA

                                                  RESEARCH PAPER 072016-2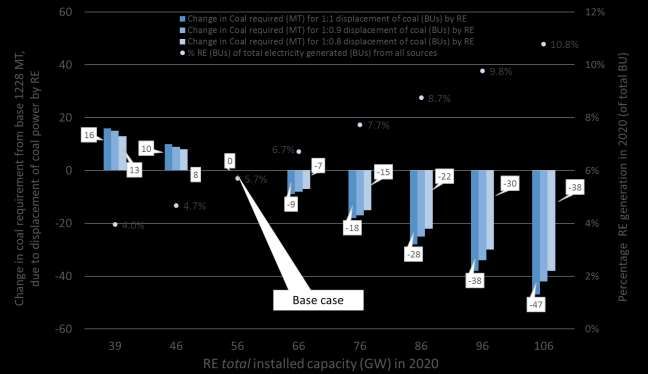
BROOKINGS INDIA
                                                                            QUALITY. INDEPENDENCE. IMPACT

© 2016 Brookings Institution India Center
No. 6, Second Floor, Dr. Jose P Rizal Marg
Chanakyapuri, New Delhi - 110021
www.brookings.in

Recommended citation:

Sehgal, Anurag; Tongia, Rahul (2016). “Coal Requirement in 2020: A Bottom-up Analysis,” Brookings India
Research Paper No. 072016-2.

The Brookings Institution India Center serves as a platform for cutting-edge, independent, policy-relevant
research and analysis on the opportunities and challenges facing India. The Center is based in New Delhi,
and registered as a company limited by shares and not for profit, under Section 25 of the Companies Act,
1956. Established in 2013, the Center is the third and newest overseas center of the Washington, D.C.-
based Brookings Institution. Our work is centered on the Brookings motto of “Quality, Independence,
Impact.”

All content reflects the individual views of the author(s). Brookings India does not hold an institutional view
on any subject.
BROOKINGS INDIA | RESEARCH PAPER 072016-2
IMPACT SERIES 072016-2
QUALITY. INDEPENDENCE. IMPACT
Coal Requirement in 2020:
A Bottom-up Analysis
ANURAG SEHGAL
RAHUL TONGIA
RESEARCH CONTRIBUTOR: ABHISHEK MISHRABROOKINGS INDIA | RESEARCH PAPER 072016-2 Acknowledgements and disclaimers The authors gratefully acknowledge a range of people who have helped with data, feedback, ideas, etc., including leaders at the Ministry of Coal, participants at a Roundtable discussion held at Brookings India in March 2016, as well as Partha Bhattacharyya, Vivek Sahai, Rohit Chandra, Daljit Singh, and multiple others. We also benefited from detailed feedback from leaders at the Ministry of Power, Ministry of New and Renewable Energy, Central Electricity Authority, Power System Operation Corporation, and other operational and statutory bodies in the sector. We also acknowledge feedback from a number of reviewers. Support for this publication was generously provided by Tata Steel Ltd. Brookings India recognises that the value it provides is in its absolute commitment to quality, independence, and impact. Activities supported by its donors reflect this commitment and the analysis and recommendations found in this report are solely determined by the scholar(s). The authors remain responsible for the content. 1| Coal Requirement in 2020: A Bottom-up Analysis
BROOKINGS INDIA | RESEARCH PAPER 072016-2

 Table of contents
 ACKNOWLEDGEMENTS AND DISCLAIMERS .................................................................................................................. 1
 LIST OF ABBREVIATIONS ................................................................................................................................................. 4
 LIST OF TABLES ................................................................................................................................................................ 5
 LIST OF FIGURES .............................................................................................................................................................. 6
 1        SUMMARY .............................................................................................................................................................. 8
     1.1           COAL TARGETS WERE PURPOSELY AMBITIOUS, BUT MAY BE UNNECESSARILY SO................................. 8
     1.2           2020 DOMESTIC COAL REQUIREMENTS TO RANGE BETWEEN 900 AND 1,200 MT ........................... 9
     1.3           THE HAND FOR 2020 HAS ALREADY BEEN DEALT..................................................................................10
 2        INTRODUCTION AND OBJECTIVES..................................................................................................................... 14
 3        COAL IN INDIA ................................................................................................................................................... 15
     3.1           COAL DEMAND AND AVAILABILITY ..........................................................................................................15
     3.2           QUALITY AND QUANTITY CONSTRAINTS OF INDIAN COAL TYPES ........................................................15
     3.3           NEAR MONOPOLY POSITION OF PUBLIC SECTOR COAL MINING COMPANIES.....................................16
     3.4           AMBITIOUS COAL PRODUCTION TARGETS FOR THE FUTURE? ...............................................................17
     3.5           RESEARCH OBJECTIVE AND METHODOLOGY ...........................................................................................17
 4        POWER SECTOR OVERVIEW ............................................................................................................................... 19
     4.1           COAL DOMINATES ELECTRICITY GENERATED (79 PER CENT IN FY’14-15) .........................................20
     4.2           LAGGING IN TECHNOLOGY USE ................................................................................................................20
     4.3           LOW EFFICIENCY VALUES FOR EXISTING PLANTS ....................................................................................21
     4.4           FUTURE COAL-BASED POWER CAPACITY: A LOT MORE OF THE SAME? ...............................................21
 5        SECTORAL COAL CONSUMPTION (POWER AND NON-POWER, FY’14-15) ................................................. 23
 6        SECTORAL ASSUMPTIONS FOR FUTURE COAL DEMAND CALCULATIONS ..................................................... 24
     6.1           POWER SECTOR ASSUMPTIONS................................................................................................................24
          6.1.1        PLF ........................................................................................................................................................ 24
          6.1.2        EFFICIENCY............................................................................................................................................ 25
          6.1.3        COAL LEAKAGE ..................................................................................................................................... 28
     6.2           NON-POWER SECTOR ASSUMPTIONS .....................................................................................................28
          6.2.1        STEEL (+ BOILER) ................................................................................................................................. 29
          6.2.2        CAPTIVE POWER .................................................................................................................................. 29
          6.2.3        CEMENT ................................................................................................................................................ 29
          6.2.4        FERTILISER ............................................................................................................................................. 29
          6.2.5        OTHER USERS OF COAL ....................................................................................................................... 29
     6.3           CALCULATING POWER CAPACITY EXPECTED ONLINE TILL 2020 ...........................................................29
     6.4           FUTURE COAL IMPORTS (CALCULATED) ...................................................................................................32
          6.4.1        POWER PLANTS SEGMENTATION METHODOLOGY ........................................................................... 32
          6.4.2        PROCEDURE FOR SEGMENTATION...................................................................................................... 32
          6.4.3        ASSESSING PROBABILITIES OF FUTURE IMPORTS .............................................................................. 34
 7        CALCULATIONS – COAL REQUIREMENTS, THERMAL POWER PLANT CAPACITY BASIS ................................. 38
     7.1           COAL REQUIREMENT IN 2020..................................................................................................................38
 8        SENSITIVITY ANALYSIS – FUTURE THERMAL POWER PLANT CAPACITY BASIS............................................... 39
     8.1           SLIPPAGE SENSITIVITY ANALYSIS ..............................................................................................................39
     8.2           PLANT EFFICIENCY SENSITIVITY ANALYSIS ...............................................................................................40

2| Coal Requirement in 2020: A Bottom-up Analysis
BROOKINGS INDIA | RESEARCH PAPER 072016-2
8.3 PLF SENSITIVITY ANALYSIS .......................................................................................................................41
9 ASSUMPTIONS FOR ENERGY DEMAND PROJECTIONS IN 2020: A LIMITING FACTOR ................................. 44
9.1 ASSUMPTIONS FOR CALCULATING ELECTRICITY DEMAND IN 2020 .....................................................44
9.1.1 GDP ELASTICITY OF ELECTRICITY ........................................................................................................ 44
9.1.2 MEANINGFUL ELECTRIFICATION FOR HOUSEHOLDS......................................................................... 45
9.1.3 REMOVING ALL LOAD SHEDDING ....................................................................................................... 45
9.1.4 REDUCTION IN TECHNICAL LOSSES .................................................................................................... 46
9.1.5 DISPLACEMENT BY RE ......................................................................................................................... 46
10 CALCULATIONS: COAL REQUIREMENTS, ELECTRICITY DEMAND PROJECTIONS BASIS .................................. 47
10.1 ENERGY DEMAND PROJECTIONS IN 2020 ..............................................................................................47
10.2 COAL REQUIRED FOR ENERGY DEMAND IN 2020 ..................................................................................47
10.2.1 OTHER ASSUMPTIONS .................................................................................................................... 47
11 SENSITIVITY ANALYSIS: FUTURE ELECTRICITY DEMAND BASIS ....................................................................... 49
11.1 SENSITIVITY ANALYSIS - IMPORTS............................................................................................................49
11.2 FUTURE IMPORT SCENARIOS ....................................................................................................................49
11.3 GDP SENSITIVITY .......................................................................................................................................51
12 TRIANGULATION: POWER DEMAND AND FUTURE CAPACITY THROW UP DIVERGENT COAL REQUIREMENT
NUMBERS ...................................................................................................................................................................... 52
12.1 COAL DEMAND (THERMAL POWER CAPACITY V/S POWER DEMAND) .................................................52
12.2 IMPLICATIONS OF POWER SUPPLY-DEMAND MISMATCH ON PLFS .....................................................52
12.3 IMPACT ON COAL ......................................................................................................................................54
13 DISCUSSION: ROBUST CALCULATIONS FOR LOWER COAL REQUIREMENTS ................................................. 55
13.1 CAN AN INCREASE IN WASHERY CAPACITY REDUCE QUANTUM OF IMPORTS? ...................................55
13.2 LOW TRANSPORTATION CAPACITY COULD BE AN ISSUE? .....................................................................55
13.3 RE INTEGRATION .......................................................................................................................................56
13.4 IMPLICATIONS – 2020 AND BEYOND......................................................................................................57
13.4.1 DO TWO WRONGS MAKE A RIGHT? NO EASY “BYE” FOR CIL.................................................... 57
13.4.2 OTHER IMPLICATIONS OF A TARGET MISMATCH ......................................................................... 58
14 APPENDIX A........................................................................................................................................................ 60
15 REFERENCES ........................................................................................................................................................ 61
THE AUTHORS ......................................................................................................................................................... 64
3| Coal Requirement in 2020: A Bottom-up AnalysisBROOKINGS INDIA | RESEARCH PAPER 072016-2 List of abbreviations AT&C Aggregate Technical and Commercial (losses) BU Billion Units (kWh) CAGR Compounded Annual Growth Rate CEA Central Electricity Authority CIL Coal India Limited COP21 Convention of Parties 21 (Paris Conference on Climate Change) CSE Centre for Science and Environment CUF Capacity Utilisation Factor FSA Fuel Supply Agreement FY Fiscal Year GCV Gross Calorific value GDP Gross Domestic Product GoAP Government of Andhra Pradesh GoI Government of India GW Gigawatt IGEN Indo-German Energy Program INDC Intended Nationally Determined Contributions kWh kilowatt-hour MNRE Ministry of New and Renewable Energy MoC Ministry of Coal MoP Ministry of Power MT Million Tonnes PLF Plant Load Factor PTI Press Trust of India RE Renewable Energy ROI Return on Investment SCCL Singareni Collieries Company Limited UMPP Ultra Mega Power Projects YOY Year-On-Year 4| Coal Requirement in 2020: A Bottom-up Analysis
BROOKINGS INDIA | RESEARCH PAPER 072016-2

 List of tables

 TABLE 1: SUMMARY OF COAL DEMAND GROWTH RATES FOR VARIOUS SCENARIOS (IN MTS). .................................... 9
 TABLE 2: COAL REQUIREMENTS FOR DIFFERENT SCENARIOS (BASED ON POWER SECTOR DEMAND OVERRIDING
 POWER PLANT CAPACITY AVAILABILITY). ............................................................................................................................10
 TABLE 3: COKING COAL IMPORT (FY’11-12-FY’14-15). .............................................................................................16
 TABLE 4: COAL SNAPSHOT FOR INDIA FY’14-15. .........................................................................................................16
 TABLE 5: SUMMARY TABLE OF UPCOMING PROJECTS BY 2020. .....................................................................................21
 TABLE 6: COAL USED IN VARIOUS INDUSTRIES IN 2015. ...............................................................................................23
 TABLE 7: COAL SUPPLY TO SECTORS (OFFICIAL THROUGH FY’14-15). ........................................................................24
 TABLE 8: REGRESSION STATISTICS FOR REGRESSION BETWEEN OPERATING EFFICIENCY (DEPENDENT VARIABLE) AND
 AVERAGE AGE AND PLANT TYPE (INDEPENDENT VARIABLES). ..........................................................................................25
 TABLE 9: ANALYSIS ON OPERATING AND DESIGN EFFICIENCIES ESTIMATED FOR 74 OF THE 85 POWER PLANTS
 COVERED IN THE REPORT BY IGEN. ..................................................................................................................................26
 TABLE 10: GCV CALCULATIONS FOR SUB-CRITICAL AND SUPER-CRITICAL COALS. ......................................................27
 TABLE 11: GDP ELASTICITIES FOR SPECIFIC SECTORS USED FOR CALCULATION. .........................................................28
 TABLE 12: METHODOLOGY FOR FILTERING VARIOUS PROJECTS ON THE STATUS OF COMPLETION OF THEIR
 RESPECTIVE APPROVALS. ......................................................................................................................................................31
 TABLE 13: BINNING OF PRESENT CAPACITIES, IN COASTAL STATES ON THE BASIS OF TECHNOLOGY AND DISTANCES
 FROM THE NEAREST PORT. ...................................................................................................................................................33
 TABLE 14: 2X2 CLASSIFICATION OF EXISTING POWER PLANTS ON TECHNOLOGY AND SPATIAL LOCATIONS.............33
 TABLE 15: BINNING OF FUTURE CAPACITIES, IN COASTAL STATES ON THE BASIS OF TECHNOLOGY AND DISTANCES
 FROM COAST. ........................................................................................................................................................................34
 TABLE 16: BINNED FUTURE CAPACITIES POST SLIPPAGE, IN COASTAL STATES, ON THE BASIS OF TECHNOLOGY AND
 DISTANCES FROM COAST. ....................................................................................................................................................34
 TABLE 17: 2X2 CLASSIFICATION OF EXPECTED (FUTURE) POWER PLANTS ON TECHNOLOGY AND SPATIAL LOCATIONS.
 ................................................................................................................................................................................................34
 TABLE 18: PORTS HANDLING BULK OF NON-COKING COAL IMPORTS. ........................................................................36
 TABLE 19: ASSIGNED PROBABILITIES TO COASTAL CAPACITIES FOR COAL IMPORTS. ....................................................36
 TABLE 20: CURRENT COAL POWER PLANT CAPACITIES EXPECTED TO IMPORT COAL IN 2020.....................................37
 TABLE 21: FUTURE CAPACITIES EXPECTED TO IMPORT COAL IN 2020. ..........................................................................37
 TABLE 22: CALCULATED COAL DEMAND 2020 IN MT (BASED ON PROJECTED THERMAL CAPACITY COMING ONLINE).
 ................................................................................................................................................................................................38
 TABLE 23: TOTAL COAL DEMAND (BASED ON POWER DEMAND AS THE LIMITING FACTOR) BY 2020. ......................48
 TABLE 24: DIFFERENT SCENARIOS OF IMPORTS AND THEIR EFFECTS ON DOMESTIC COAL REQUIREMENTS (MILLION
 TONNES). .............................................................................................................................................................................50
 TABLE 25: DETAILS OF VARIOUS IMPORTS SCENARIOS. ...................................................................................................50
 TABLE 26: COMPARATIVE ANALYSIS OF COAL REQUIRED FOR POWER CAPACITY AND POWER DEMAND IN 2020. ..52
 TABLE 27: CIL MODES OF COAL TRANSPORTATION. ........................................................................................................56

5| Coal Requirement in 2020: A Bottom-up Analysis
BROOKINGS INDIA | RESEARCH PAPER 072016-2

 List of figures

 FIGURE 1: IMPACT OF RE DISPLACING COAL DEMAND IN 2020 BASED UPON VARIOUS RE CAPACITY ACHIEVEMENTS
 BY 2020.. ...............................................................................................................................................................................11
 FIGURE 2: IMPACT OF GDP ON COAL REQUIREMENTS. ................................................................................................... 12
 FIGURE 3: GDP ELASTICITY OF POWER GENERATION VS GDP GROWTH RATE (1998 – 2015).................................. 12
 FIGURE 4: TOTAL INSTALLED POWER CAPACITY IN INDIA (2014 – 2016) ................................................................... 19
 FIGURE 5: FY’14-15 ELECTRICITY GENERATION (BU) BY SECTOR. ................................................................................. 20
 FIGURE 6: COAL DEMAND [MT] FOR 2020 WITH DIFFERENT SLIPPAGES OF POWER PLANT CONSTRUCTION. .......... 39
 FIGURE 7: COAL DEMAND IN 2020, WITH CHANGES IN FUTURE PLANT SUB-CRITICAL (PER CENT) AND SUPER-
 CRITICAL (PER CENT) EFFICIENCIES. ..................................................................................................................................... 41
 FIGURE 8: INDIA AGGREGATE MONTHLY PLFS (COAL AND LIGNITE BASED PLANTS ONLY) .......................................... 42
 FIGURE 9: COAL REQUIREMENTS [MT] WITH PLF SENSITIVITY OF POWER CAPACITY EXPECTED BY 2020 ................ 43
 FIGURE 10: GDP ELASTICITY OF POWER GENERATION VS GDP GROWTH RATE (1998 – 2015) ............................ 45
 FIGURE 11: IMPORTED COAL SCENARIOS AND THEIR IMPACTS ON TOTAL DOMESTIC COAL REQUIREMENTS............ 51
 FIGURE 12: IMPACT OF GDP SENSITIVITY ON COAL REQUIREMENTS. ............................................................................ 51
 FIGURE 13: DISPLACEMENT OF PLF OF OLDER PLANTS DUE TO HIGHER PLFS OF NEWER PLANTS. ........................... 53
 FIGURE 14: IMPACT OF RE DISPLACING COAL DEMAND IN 2020 BASED UPON VARIOUS RE CAPACITY
 ACHIEVEMENTS BY 2020. .................................................................................................................................................... 57

6| Coal Requirement in 2020: A Bottom-up Analysis
BROOKINGS INDIA | RESEARCH PAPER 072016-2
Key findings
India is heavily dependent on coal based power for its electricity needs, 79 per cent of total
electricity generation is coal/thermal based. This is not expected to change drastically in the
near future.
Thermal power generation consumes around 76 per cent of total coal available in the country
(imports included). Given its high coal consumption, power sector has a disproportionate
impact on future coal demand.
Imported coal constituted 26 per cent of total coal supply in FY’14-15 (212 MT of the total
supply of 820.3 MT), however, the imports were 6 per cent lower (than 212 MT) in FY’15-16.
Given that boiler technology locks in to a specific type of coal (imports/blending inclusive), it
is unlikely that imports will ever be zero.
The ambitious target of producing 1.5 billion tonnes of domestic coal is too high, vis-a-vis the
expected increase in coal requirement(s) by 2020. The actual coal requirements are expected
to be (at a maximum) around 1.2 billion tonnes in 2020 (subject to certain optimistic
assumptions of growth in demand).
In addition to GDP growth rates, the Renewable Energy capacity targets of 175 GW by 2022
could also impact coal demand in 2020, pushing it further down, displacing thermal generated
kWh.
Huge thermal power capacities are expected online by 2020. This will impact PLFs, with
economic and technical implications for the new capacities. And, if financial reforms in the
distribution companies do not work as expected, there could be stressed assets as well,
impacting liquidity in the banking sector.
Railways capacity augmentation is a related investment within the same timeframe (till 2020)
to enable actual coal offtake for increased mining capacity. To enable capacity augmentation,
it is essential to look holistically at the total capital requirements for both these sectors
simultaneously.
7| Coal Requirement in 2020: A Bottom-up AnalysisBROOKINGS INDIA | RESEARCH PAPER 072016-2
1 Summary
1.1 Coal targets were purposely ambitious, but may be unnecessarily so
In FY’14-15, the government announced an ambitious plan to produce 1.5 billion tonnes of coal
domestically by 2020, an annual growth of almost 20 per cent. The announcement came at the
back of the then chronic shortfall of coal. However, by the end of FY’15-16 India’s coal shortfall
ended. In fact, power plants—which are the largest users of coal—reported an oversupply of coal,
a situation mirrored in terms of power, with plant capacity growth outstripping power demand
growth.
The 1.5-billion tonne target was split between Coal India Limited (CIL) (and other smaller PSU
producers) producing 1,000 MT and private (captive) producers contributing the remaining 500 MT
by 2020. For the given target, we have envisioned three sets of growth rates (compounded annual
growth rates, or CAGRs)
Estimated requirements of coal in 2020:
Scenario 1 – upper bound for coal requirement, based upon power plant capacity: Non-power
sector demand was extrapolated based on GDP and elasticity assumptions,1 and power
demand was bounded based on upcoming thermal power capacity (examining all plants
under construction, their locations, technology, and status, assuming a plant load factor
(PLF) same as in FY’14-15.
Scenario 2 – Offtake based on power demand: Keeping non-power demand the same as
scenario 1, a detailed power demand calculation2 for 2020 led to coal demand estimates
based on assumptions on share of thermal generation.
The target and estimates however, do not align, as shown in Table 1
1
Assumptions for non-power sector include the following: A base assumptions of 8 per cent GDP growth,
respective sectoral GDP elasticities and continued imports proportionate to imports in the base year FY’14-
15.
2
Base power demand calculations assume: additional demand linked to GDP, zero load-shedding by 2020,
“meaningful” electrification to hitherto unconnected rural consumers and reduction in technical losses.
8| Coal Requirement in 2020: A Bottom-up AnalysisBROOKINGS INDIA | RESEARCH PAPER 072016-2
FY’14-15 2020
Targets for coal production in 2020 CAGR
[MT] [MT]
Coal requirements (targeted)
Total domestic coal 609 1500 19.8%
All public
(CIL + Others,
Public sector growth required 567 1000 12%
proportional)
Private sector growth
required Private 45 500 61%
FY’14-15 2020
Scenarios for coal requirements in 2020 CAGR
[MT] [MT]
Scenario 1: thermal power Domestic coal 609 996 10.3%
plant based coal
requirements
(keeping PLFs as FY’14-15, ~ Total coal 820 1311 9.8%
64%)
Scenario 2: Power demand Domestic coal 609 929 8.8%
based coal requirements
(more realistic) Total coal 820 1228 8.4%
Table 1: Summary of coal demand growth rates for various scenarios (in million tonnes). These have base
assumptions of 8 per cent GDP growth, modest RE growth, and continued imports due to economics and power plant
technology choices (plus imports of coking coal). Note that one tonne of imported coal isn’t the same as one tonne of
domestic coal due to different quality of coal (heating value).
1.2 2020 domestic coal requirements to range between 900 and 1,200
MT (based heavily on electricity demand scenarios and import
choices)
Table 1 shows the base calculations based on assumptions. The capacity based analysis is an
intellectual exercise to show an upper bound on the coal required. Given demand-based
projections are lower, these become the bottleneck and provide a more realistic range of coal
requirements. If one ignores demand for power, the implication would be further “overcapacity” of
power plants, and a fall in PLFs.
All calculations are based on assumptions, and sensitivity analysis indicates what factors matter,
and by how much. High and Low demand scenarios indicate a range as shown in
Table 2, still lower than the nominal target of 1,500 MT. The ‘High coal’ scenario is optimistic and
assumes zero imports of thermal coal (coking coal imports, however, are assumed to continue), a
high GDP growth of 8 per cent, 100 per cent electrification with zero load-shedding, and a modest
9| Coal Requirement in 2020: A Bottom-up AnalysisBROOKINGS INDIA | RESEARCH PAPER 072016-2
growth of Renewable Energy (with no additional displacement of coal share versus today, which
would undershoot the target of 175 GW RE). The ‘Low coal’ scenario assumes a partial improvement
in supply quality with imports in the same proportion as were in FY’14-15.
Total
Total coal Domestic
imports Comments
Scenario required (MT) supply (MT)
(MT)
Imports proportionate to
Base 1228 929 299 existing ratio
End all imports except coking
High coal 1291 1225 67 coal
Conditional upon demand side
limitations and continued
Low coal 1139 868 272
imports
Table 2: Coal requirements for different scenarios (based on power sector demand overriding power plant
capacity availability). Low coal scenario assumes slightly lower GDP growth (7.5 per cent), imports remain in the
same proportion to the domestic supply as FY’14-15, 50 per cent electrification of hitherto un-electrified households
(slight but incomplete improvement), and a 3 per cent power supply shortfall (versus 3.6 per cent in FY’14-15) and
renewable share of power generated is 10.8 per cent.
1.3 The hand for 2020 has already been dealt: Not much flexibility in
displacing imports for existing/planned power plants as targeted, and
high RE targets
Almost 76 per cent of coal is consumed by the power sector, and 79 per cent of electricity
generated from thermal power plants. Given that coal power plants take years to materialise, we
can assume that plants in 2020 are either under operation or already planned or under
construction. Given that boiler technology requires specific coal quality—sometimes fully
imported, other times with blending—it is unlikely that imports will be zero by 2020 or even later.
The report details how coal requirements were calculated across plants, factoring in their location,
technology, status, etc.
We find that the number of coal power plants under advanced planning or construction is far
higher than likely required. This indicates that overall system PLFs will fall even further, or place
financial stress on plants. As per Central Electricity Authority calculations and planning estimates,
the earlier high PLFs of upwards of 73 per cent are very difficult, if not impossible, to realise in
future.
Economics would warrant existing plants be utilised to the highest level possible (high PLFs), but
the power position in India of surplus at some times in a day reinforces the challenge of peaking
power (mostly in the evening). This indicates that coal-based plants, which are baseload plants,
10| Coal Requirement in 2020: A Bottom-up AnalysisBROOKINGS INDIA | RESEARCH PAPER 072016-2 aren’t the only need for India’s power sector, and neither is solar power. In addition to not meeting the peak demand, RE also places other system burdens, such as high ramping requirements in the evening (the so-termed “duck curve”). An “optimal” portfolio of power plants is assumption-driven based on the objective function: lowest cost vs. energy security vs. environmental improvement etc. As an example of sensitivity analysis, Figure 1 shows the impact of different RE capacities on coal demand. This assumes a fixed (exogenous) demand for power, and a 19 per cent PLF for RE. The impact of very ambitious RE targets is modest, in the tens of millions of tonnes of coal per annum. Figure 1: Impact of RE displacing coal demand in 2020 based upon various RE capacity achievements by 2020. The 2022 target of 175 GW implies the need to reach 106 GW by 2020, which would increase the RE share of total projected electricity (BUs) to 10.8 per cent. Any level of RE share growth (or fall) could displace coal BUs at varying levels, from 1:1 to perhaps less (assuming other generation also backs down in favor of RE). GDP growth rates and future electricity demand are among the key variables or wild cards that can likely pull down the coal requirement compared to the base case assumption of 8 per cent GDP growth and 100 per cent electrification, zero load-shedding, etc. Figure 2 shows the impact of GDP on demand from not just power sector growth but non-power sector growth like for cement and steel industries etc. A 1 per cent (absolute) reduction in anticipated GDP growth rate reduces the coal requirement in 2020 by about ~4 per cent. 11| Coal Requirement in 2020: A Bottom-up Analysis
BROOKINGS INDIA | RESEARCH PAPER 072016-2
1400 10%
1228 1252
1181 1205 9%
1200 1136 9%
8%
8% 8%
Total coal CAGR (%)
8%
1000 7%
Coal (MT) 7%
800 913 929 946 6%
864 896
5%
600 4%
400 3%
2%
200
1%
0 0%
6.0% 7.0% 7.5% 8.0% 8.5%
GDP growth rate
Total coal demand Domestic coal CAGR Base case
Figure 2: Impact of GDP on coal requirements.
Power demand is a major factor for India’s coal requirement. There are multiple future electricity
demand exercises conducted by various organisations, including by the Central Electricity Authority
(CEA). In one such exercise, CEA found that the combination of rapid capacity growth in the last
few years and modest demand growth means a fall in power plant PLFs and/or stranded (if not
abandoned) capacity. One possibility is system equilibrium that encourages retirement of older
coal plants, on environmental and/or efficiency grounds.
Figure 3 shows the complexity of calculating demand elasticity with GDP. Higher GDP growth rates
indicate a possible lower elasticity, which also cannot be separated from issues of autocorrelation
(prior year lows/highs indicate compensation the next year), the impact of the monsoon, not to
mention targeted growth of manufacturing.
1.6
1.4
GDP elasticity of power
1.2
generation
1.0
0.8
0.6
0.4
0.2
0.0
0.0 2.0 4.0 6.0 8.0 10.0 12.0
GDP growth rate percentage (%)
Figure 3: GDP elasticity of power generation vs GDP growth rate (1998 – 2015). This is based on MoP/CEA
data for generation (BU) and Ministry of Finance data for GDP.
Other wild cards (unknowns) that could impact coal demand in the future include:
Imports for both coal and end-products such as steel. These depend on macroeconomic
conditions, global prices, etc.
12| Coal Requirement in 2020: A Bottom-up AnalysisBROOKINGS INDIA | RESEARCH PAPER 072016-2
Growth (or not) of alternative sources of power
Demand from power distribution companies and consumers. Factors other than GDP based,
reforms such as UDAY should help improve the demand for power, but some of this is already
captured in the base assumptions on power demand.
Logistics, especially railways, can be a bottleneck. Also, the costs involved can determine if end-
users want to use domestic versus imported coal.
Ultimately, the calculations are for the demand of coal, which still leaves enormous challenges for
its supply (i.e., mining). Even the lowered estimates for demand, far lower than 1,500 MT, still leave
pressure to perform. Given that the private/captive sector has dramatically higher growth targets
for mining and has not grown anywhere near envisaged through FY’15-16, this still leaves
enormous pressure on Coal India Limited to grow output by 2020.
13| Coal Requirement in 2020: A Bottom-up AnalysisBROOKINGS INDIA | RESEARCH PAPER 072016-2 2 Introduction and objectives In this report, we aim to examine the demand for coal in India in 2020 (using FY’14-15 as a base year), focusing on domestic coal production. Coal is predominantly used in power production, and hence answering this question requires a deep dive into (1) Demand for power; (2) Alternatives for power generation, especially Renewable Energy (RE), which has ambitious growth targets in the short term; and (3) ability to produce coal-based power (looking at virtually all the power plants under construction/planned, examining their location, technology, status of clearances, etc.) Clearly, this is not an easy exercise. First of all, there are inter-relationships between variables, and hence the holistic look at this topic (one cannot do simple extrapolations only). Second, there is enormous uncertainty, even in just a few years (forget a more complex exercise such as modelling for 2030, the year for the carbon commitments for Paris COP21, through India’s Intended Nationally Determined Contribution (INDC)). Therefore, we apply not just wide sensitivity analysis, but also have released the model3 used, so that analysts/scholars/decision-makers can modify key assumptions to visualise its impacts. 3 The model is available online at the Brookings India website: http://www.brookings.in/coal-requirement-in-2020-a-bottom-up-analysis/ 14| Coal Requirement in 2020: A Bottom-up Analysis
BROOKINGS INDIA | RESEARCH PAPER 072016-2

 3         Coal in India
 3.1 Coal demand and availability
 Coal contributed to around 79 per cent of the total generated electricity in India in FY’14-15. The
 total gross power generation stood at 1,110.2 BU4 (CEA, CEA Monthly Executive Summary Power
 Sector, April, 2015) till 31 March 2015, of which 1,048.67 BU was from non-RE (mostly coal), while
 61.78 BU was from RE5. Preliminary data till 31 March 2016 indicates that total generation has
 increased by 5.7 per cent YoY, the comparable value in FY’15-16 was 1,173.2 BU total, with 1,107.38
 BU from non-RE sources and 65.78 BU from RE (CEA, CEA Monthly Executive Summary Power
 Sector, March, 2016) (CEA, CEA Monthly Executive Summary Power Sector, April, 2016). Considering
 the high share of coal-powered electricity, it is safe to say that India is heavily dependent on coal
 for its electricity requirements and, as we shall see later in this report, most of the coal used is
 indigenous.

 In addition to its use for electricity generation, coal is also the base fuel for many other industries
 such as iron and steel, aluminium, and cement. The role of coal in powering multiple segments of
 India’s industry puts it firmly in the vanguard for achieving India’s economic growth potential.

 In the above context, the total demand for coal in India for FY’14-15 was ~787 MT (Ministry of
 Coal, 2014-15), whereas the total indigenous supply of coal was in the range of ~608 MT, an
 additional ~212 MT was imported in FY’14-15. Imported coal accounted for ~26 per cent of all
 available6 in India in FY’14-15, despite India holding the fifth-largest coal reserve (Technology,
 2014) in the world, seemingly sufficient for many decades of consumption.

 3.2 Quality and quantity constraints of Indian coal types
 Indian coal has a lower average GCV (gross calorific value) ~4,000 kcal/kg and a higher average
 ash content ~34 per cent compared with international coal7. High ash content reduces the amount
 of heat available for use per tonne coal input8. This also has negative economic implications if high
 ash coal is transported long distances and also causes pollution, as combusted coal inevitably
 releases some ash into the environment.

 Imports from foreign destinations, mainly Indonesia (only steam/thermal coal) and Australia
 (largely coking coal) are one way of compensating for lower heat value of Indian coal, on a joule

 4
    Billion Units (BU), or Billion kilowatt-hours (kWh). This generation is gross as from utilities and grid
 connected, and excludes captive or back-up power.
 5
    RE as defined by India is “New Renewables” such as solar, wind, micro-hydro, and excludes traditional
 hydropower.
 6
   Coal availability and consumption are separate, all coal that is mined/imported may not be consumed in
 the same year as some is stockpiled at either the pithead or the plant stockyard. However, while recording
 the total available coal, all coal that enters the system is recorded. The authors recognize this nuance for
 accounting of coal in future, but given the lower level of stockpiles in FY’14-15, have not applied it for the
 base year calculations. However, in 2015-16, some of the “consumption” by a sector can include measurable
 stockpiles. And, this would also impact the specific coal consumption calculations.
 7
   Indonesian coal has ash content between 5 and 12 per cent (Indonesia, Rich coal, 2015) and Australian
 coal between 8 per cent to 20 per cent (Australia, Rail Page, 2015)
 8
   As opposed to imported coals which has higher average GCVs and lower average ash content resulting in
 higher available heat per tonne.

15| Coal Requirement in 2020: A Bottom-up Analysis
BROOKINGS INDIA | RESEARCH PAPER 072016-2
per kg basis, and this is one reason, in addition to using solely imported coal, that a number of
power plants import coal to blend with domestic coal. Also, until recently, there was a restriction
on the coal import with ash content higher than 12 per cent, which was recently amended (PTI,
2015) for the UMPPs (Ultra Mega Power Projects) to introduce competition by opening up imports
from countries other than Indonesia9.
India has insufficient coking coal reserves, which was why only 31 per cent of the total coking coal
demand in FY 2015 (~56 MT) was indigenously available. Coking coal is required for steel making,
through the blast furnace route. With increasing urbanisation, it is anticipated that there would be
an increased requirement of steel in the future (for construction and also white goods and other
products). However, insufficient domestic reserves of coking coal necessitate imports. This is
however, before considering macro demand issues for finished products, for example; Chinese
overcapacity of steel coupled with a slowdown in domestic consumption leading to surplus
capacity of finished steel in China, which may then be imported by India regardless of alleged
dumping. Table 3 captures the increase in coking coal imports between FY’11-12 and FY’14-15.
Financial year(s) FY’11-12 FY’12-13 FY’13-14 FY’14-15
Coking coal imports (MT) 31.80 35.56 36.87 43.71
Table 3: Coking coal import (FY’11-12-FY’14-15). Source: (Ministry of Coal, 2015)
3.3 Near monopoly position of public sector coal mining companies
CIL (Coal India Limited), the largest coal mining company in the world by volume and the
predominant coal miner in India (through its operating subsidiaries), along with SCCL (Singareni
Collieries Company Limited), contributed ~90 per cent to the total coal production of India (Table
4).
Organisation name Total production in FY’14-15 (MT)
Coal India Ltd. (CIL) 494.2
Singareni Collieries Company Ltd. 52.5
Other public 20.7
Private (captive) miners 45.0
Total Production 612.4
Total consumption 608.2
Table 4: Coal Snapshot for India FY’14-15. Consumption is officially marginally lower than production, but
additional losses are often booked to the consumer. Sources: (Ministry of Coal, 2014-15); Authors estimates
The private sector mined only ~45 MT of coal in FY’14-15 (captive consumption), and the private
miners are not allowed to sell coal commercially, their production is intended for a notified end
9
Majority of Indian thermal coal/steam coal imports are from Indonesia. In FY‘14-15 India imported 70%
(118.215 MT) of steam coal/thermal coal from Indonesia (Ministry of Coal, 2014-15).
16| Coal Requirement in 2020: A Bottom-up AnalysisBROOKINGS INDIA | RESEARCH PAPER 072016-2
use only (which can be regulated: power generation for utilities—or non-regulated: power
generation for operating cement/steel/aluminium/any other notified end use based manufacturing
unit). The monopoly position of public sector firms makes coal a controlled good—without an
independent regulator—limiting private capital and even new technologies. This is despite CIL
being a publicly listed company, a step which was initially met with resistance by the miners, but
was later enforced resulting in transparency and improvement in much of its operations.
3.4 Ambitious coal production targets for the future?
The Ministry of Coal (Government of India) recently announced a target of 1.5 billion tonnes of
coal production by 2020 (IANS, 2015), of which CIL is expected to contribute 1 billion tonnes, while
the remainder is expected from the private (captive) miners. Given the very low output from private
miners today, ~45 MT of the total indigenous production (7.4 per cent of the total coal production
of India in FY’14-15), it appears a herculean, if not unfeasible, task requiring 11 times growth, or a
CAGR of ~61 per cent to reach 500 MT by 2020.
On the other hand, CIL (and the other mining PSUs) needs to increase production as well through
new capacity or increased production from existing mines. To reach its 1 billion tonne target for
2020, the public sector as an aggregate needs to grow at 12 per cent CAGR, however if the growth
target is only for CIL and not the entire public sector then the CIL (only) CAGR stands at 15 per
cent. Although CIL did achieve 8.5 per cent growth YoY in FY’15-16, its best ever, it still missed its
guidance by 12 MT, settling for 538 MT in the last fiscal (CIL, 2016). Based upon past performance,
even the 12 per cent required growth for CIL seems ambitious and possibly unlikely, especially in
the future on a larger base. A 12 per cent growth on a 500 base is a lot easier than on an 800 base.
Having said that, CIL is the only organisation that has the scale and ability to reach the targeted
coal production by 2020.
However, even before one gets to the point of discussing how to reach the target, there are
important questions that need to be answered: Are coal production targets for 2020 realistic? Does
India actually need to mine as much coal by 2020? Will it be able to absorb all of the additional
production? Is there a baseline import requirement that would still be required, even if indigenous
coal production increases?
3.5 Research objective and methodology
The objective of this paper is to examine the 1.5 billion tonnes of coal production target, using a
mathematical model to arrive at a realistic value of coal requirement in 2020. The step-wise
methodology is below:
Examine all present demand of coal from various sectors and look into possible growth
over coming years
Make data and assumption-driven extrapolations of demand across various sectors
o Use FY’14-15 as the base financial year unless stated otherwise
o Power sector dominates consumption, hence is the main focus of the study
17| Coal Requirement in 2020: A Bottom-up AnalysisBROOKINGS INDIA | RESEARCH PAPER 072016-2
o GDP growth rate is nominally pegged at 8 per cent between 2015 and 2020 (study
period), sensitivity has been used on top to analyse alternative performance scenarios
as well.
o Analyse plant-level data on power plants planned/upcoming
o Apply assumptions based on location (coastal/non-coastal), technology (sub-
critical/super-critical) and age of plants
o Utilise data from CEA, other GoI sources, news reports, and paid (subscription) industry
analysis
Among the many sectors where coal is used, the majority of coal demand (~77 per cent in FY’14-
15) is from thermal power plants for electricity generation, and the remaining sectors contribute
only ~23 per cent of coal demand in India. This research uses the actual data for FY’14-15 to arrive
at assumption-driven estimates of coal required for expected increase in thermal generation
capacity in 2020. For the remaining (~23 per cent in FY’14-15) coal demand, projections based on
sectoral growth rates, calculated from historical values of GDP elasticities of the respective sectors,
are used to complete the analysis.
For triangulating, similar calculations for coal requirement are made on the demand side, based
mainly on detailed projections of expected increase in electricity demand by 2020 keeping the
values of non-power coal consumption as is from the supply-side estimates. A comparison
between demand and supply side requirements of coal provides an objective assessment of the
coal production targets set by the government for 2020.
18| Coal Requirement in 2020: A Bottom-up AnalysisBROOKINGS INDIA | RESEARCH PAPER 072016-2
4 Power sector overview
Since the power sector (electricity) constitutes the bulk of coal demand, we begin with a detailed
overview of the current status of the power sector (especially coal-based power sector).
Figure 4 shows the change in total capacity between years 2014 and 2016 by type. Out of the
overall 11 per cent capacity increase (between 2015 and 2016), the maximum capacity addition
(absolute value terms between 2015 and 2016) was in thermal (coal) power plants (~20 GW) and
thereafter in RE (~7 GW). As on 31 March 2015, the share of renewable and nuclear was only 14
per cent by capacity. Coal-based thermal power units made up 61 per cent of the total installed
capacity (GW) at the end of FY 2015, but have a much higher share based on generation (kWh), 79
per cent10.
185.2
200
164.6
180
145.3
160
140
Capacity (GW)
120
100
80
42.7
41.3
40.5
38.8
60
31.7
29.5
24.5
23.1
21.8
40
5.8
5.8
4.8
20
1.2
1.2
1
0
Thermal (GW) Thermal (GW) Gas Thermal (GW) Nuclear (GW) Hydro (GW) RE (GW)
Coal Disel
India total installed power capacity 2014 India total installed power capacity 2015
India total installed power capacity 2016
Figure 4: Total installed power capacity in India (2014 – 2016). Sources: (CEA, CEA Monthly Executive
Summary Power Sector, April 2014) (CEA, CEA Monthly Executive Summary Power Sector, April, 2015) (CEA, CEA
Monthly Executive Summary Power Sector, April, 2016).
10
While official data (CEA) lists total thermal share as 79 per cent of generation in FY’14-15, Almost 3.7 per
cent of this (absolute share) is from gas. For 2020, as a starting point, we assume 79 per cent of BUs from
coal for the following reasons: (1) hydropower capacity growth has been limited, and its share of generation
is likely to fall (it also varies significantly with the monsoons); (2) Gas share depends heavily on both gas
availability/pricing as well as its chosen duty city (baseload vs. peaking). If it runs as a peaker, more capacity
can be utilized, but with low PLFs; (3) this is a conservative number from a coal requirement number - any
growth of other thermal (or hydro) would decrease the coal requirement.
19| Coal Requirement in 2020: A Bottom-up AnalysisBROOKINGS INDIA | RESEARCH PAPER 072016-2
4.1 Coal dominates electricity generated (79 per cent in FY’14-15)
As Figure 5 shows, coal dominates generation11, whereas the share of generation is low for hydro
and even lower for Renewable Energy (RE). For the former, India is reliant on limited (seasonal)
rains, but RE has an inherent limitation in its ability to generate, and expected Plant Load Factors
(PLFs), also termed Capacity Utilisation Factors (CUFs), are only in the range of 20 per cent.
There are ambitious plans to install 175 GW of renewable capacity in India by 2022 (PTI, 2015) but
the growth rate required to reach this target by 2022 (at a steady rate of increase) is 27 per cent
CAGR while the past years (FY’15-16) growth in RE capacity has been around 22 per cent, a jump
over the previous year’s 8 per cent (FY’14-15). High growth rates may be easier on a relatively low
existing base of installed RE capacity in the country but the challenge is in replicating if not
enhancing this growth rate over multiple years.
878.3
943.4
1000
791.8
900
800
700
Genration (BU)
600
500
400
300
134.7
129.1
121.3
200
65.8
61.8
53.1
37.4
36.0
34.2
100
0
Thermal Hydro Nuclear Renewables
2014 2015 2016
Figure 5: FY’14-15 Electricity generation (BU) by sector. Note: There is no breakup shown for different thermal
sources; but coal dominates and its share may be higher given the low use of (expensive) gas. Source: CEA data
4.2 Lagging in technology use
As shown earlier, India had ~165 GW of installed capacity of coal based thermal power plants
(FY’14-15) of which only around 16.3 per cent (26.8 GW) are based on super-critical technology,
rest being sub-critical (138.2 GW). There are no ultra-supercritical technology based thermal power
plants at the moment and none are expected till 2022 (India Energy Government, 2014). These
technologies improve the plant efficiency reducing coal requirements, also reducing environmental
impacts, both in terms of pollution and water requirements. The high quantum of sub-critical
thermal power plants (~84 per cent) could partly be due to a legacy of public sector led
11
CEA combines coal with other fossil fuels as thermal in most publications, but the total is mostly coal; gas
use by share has not risen as planned due to costs/availability
20| Coal Requirement in 2020: A Bottom-up AnalysisBROOKINGS INDIA | RESEARCH PAPER 072016-2
development and its lack of capital and innovation. The government has recently come up with a
mandate (Press Bureau, 2015) to add only super-critical thermal generation capacity subsequent
to 2017. With increased participation of the private sector and an increased focus on environmental
damage, the future for efficient boiler technologies looks promising, but India is not at the forefront
of plant technologies.
4.3 Low efficiency values for existing plants
Indian power plants lag in average operational efficiency values. The global efficiency values for
coal based thermal plants vary widely between 30 and 45 per cent (IEA, 2012), domestic plants
have managed to achieve a maximum of 33 per cent for sub-critical and 38 per cent for super-
critical (Chandra Bhushan, 2015), respectively, with the lowest efficiency values for sub-critical
power plants at ~29 per cent. A detailed 2008 study of a sample of sub-critical power plants (85)
indicated an average operational efficiency values of ~31 per cent (IGEN, 2008). To be fair, there
are technical limits to achieving higher operational efficiency values in India due to differences in
climactic conditions from global comparisons.
While efficiency is foremost limited by plant technologies (largely via operating temperatures and
pressure), there are other factors that are relevant for India, including operating duty cycle and
whether the plants operate at ~full load or not. Any plant operating at part load loses efficiency,
and this gets far worse with cycling, loading up and down (also increases the wear and tear). While
it is beyond the scope of this paper to examine such issues in detail (especially grid operator load
despatch), these are known to exist and demand greater analysis.
4.4 Future coal-based power capacity: A lot more of the same?
With a lot of new proposed thermal power plants (200+) (India Inframonitor, 2015-16) in various
stages of development and completion, there seems to be massive growth on the anvil for thermal
power capacity by 2020. Table 5 shows the projects and the capacity in the pipeline by 2020. Even
though the number of proposed future power projects is large (a total of 268 projects translating
into 325 GW), about 147 GW of the total has projected commissioning dates before 2020, as shown
below.
Projected capacity
Project count Capacity total (GW)
(GW) by 2020
Announced
(no construction reported as of 200 255.8 77.8
September 2015)
Under construction
68 69.2 69.2
(as of September 2015)
Grand total 268 325.0 147
Table 5: Summary table of upcoming projects by 2020. Source: (India Inframonitor, 2015-16)
21| Coal Requirement in 2020: A Bottom-up AnalysisBROOKINGS INDIA | RESEARCH PAPER 072016-2 However, on a closer look, many of the proposed projects are yet to achieve financial closure or the necessary environmental and land clearances to apply for funding. Removing all such plants from the lot throws up ~147 GW of thermal capacity expected to come up by 2020 (at various stages of construction and/or advanced stages in the approval process), doubling the FY’14-15 thermal capacity by 2020. In Section 6.3, we examine growth of new power plants in much more detail. Future plants are not the same as existing plants. The overwhelming majority will be super-critical, which means they will be more efficient. They are also not randomly distributed, and their location determines their preferred if not optimal source of coal i.e.; not only imported versus domestic, but also the grade of coal, transportation requirements, etc. New capacity also impacts existing capacity in the sense that a finite demand (total coal sector PLF) need not be distributed equally across plants by vintage or location, ownership, etc. Taking into account historical project slippage rates, all of the capacities in Table 5 are unlikely to make it online by 2020. Even then, the residual capacity coming online could potentially have a material impact on the existing plant PLFs, unless older and inefficient plants are retired. 22| Coal Requirement in 2020: A Bottom-up Analysis
You can also read