The State of the Science on Operational Minimization to Reduce Bat Fatality at Wind Energy Facilities - Tethys
←
→
Page content transcription
If your browser does not render page correctly, please read the page content below
The State of the Science on Operational
Minimization to Reduce Bat Fatality at
Wind Energy Facilities

 Prepared for:
 The National Renewable Energy Laboratory

 Prepared by:
 Michael D. Whitby, Michael R. Schirmacher, Winifred F. Frick
 May 2021
ACKNOWLEDGEMENTS
Support for this document was provided by the Alliance for Sustainable Energy, LLC, Managing and
Operating Contractor for the National Renewable Energy Laboratory. Funding was provided by the U.S.
Department of Energy Wind Energy Technologies Office. Manuela Huso contributed expertise that
greatly enhanced the methodology and interpretation of the meta-analysis. We thank Ross Renshaw for
contributing to literature searches and reviews.

 SUGGESTED CITATION
 Whitby, M. D., M. R. Schirmacher, and W. F. Frick. 2021. The State of the Science on Operational
 Minimization to Reduce Bat Fatality at Wind Energy Facilities. A report submitted to the
 National Renewable Energy Laboratory. Bat Conservation International. Austin, Texas.

 — i—
EXECUTIVE SUMMARY
 Wind energy is rapidly growing in the United States and around the world. The growth of wind
energy is stimulated by a desire to reduce carbon emissions from the electric power sector and reduce
the effects of climate change. Projected industry growth and evolving turbine technology (i.e., taller
turbines with larger rotor-swept areas and turbines with lower cut-in speeds) have heightened concerns
about cumulative impacts on bat populations. In 2008, the Bats and Wind Energy Cooperative (BWEC) –
an alliance of experts from government agencies, private industry, academic institutions, and non-
governmental organizations – was formed to address these concerns. Since its formation, the BWEC has
sought to develop and disseminate solutions to measure and mitigate the impacts of wind turbines on
bats, while maintaining the ability to develop and operate wind energy facilities in a competitive and
cost-effective manner. In 2008, the BWEC identified operational minimization, also referred to as
curtailment, as a top priority for research. Since that time multiple studies testing the efficacy of various
operational minimization techniques have been conducted. We assess the cumulative evidence of these
studies by quantifying the efficacy of operational minimization using quantitative meta-analysis.
 Publicly available studies that evaluated operational minimization across 19 treatments
implemented at 8 wind energy facilities were summarized. These studies indicate that operational
minimization is an effective strategy for reducing bat mortality at wind turbines and that the efficacy is
measurable. We estimate that total bat fatalities are reduced by 33% with every 1.0 m/s increase in cut-
in speed. Estimates of the efficacy of fatality reductions for every 1.0 m/s increase in cut-in speed on the
three migratory tree-roosting species in North America are similar (28% for hoary bats [Lasiurus
cinereus], 32% for eastern red bats [L. borealis], and 32% for silver-haired bats [Lasionycteris
noctivagans]). Extrapolating these data across multiple facilities and years, a 5.0 m/s cut-in speed is
estimated to reduce total bat fatalities by an average of 62% (95% CI: 54–69%). We estimate total bat
fatality reductions at individual facilities in any given year to fall between 33%–79% (95% prediction
interval). For individual species, average fatality reduction at 5.0 m/s cut-in speed was estimated as 48%
(95% CI: 24%–64%) for hoary bats, 61% (95% CI: 42–74%) for eastern red bats, and 52% (95% CI: 30%–
66%) for silver haired bats. Most variation in efficacy is attributed to inter-annual differences. The
interannual differences in efficacy observed at the studies in our analysis outweighed any spatial
difference in efficacy.
 Several efforts that seek to improve the efficiency of operational minimization by minimizing
both power loss and bat fatalities could not be included in this quantitative meta-analysis. We provide a
narrative review of the current literature regarding other factors such as temperature, nocturnal timing,
bat activity, and wind direction on improving the efficiency of operational minimization. We also review
findings related to the reduction of fatalities due to feathering below the manufacturer’s recommended
cut-in speed and on species of regulatory concern.
 We conclude with a section summarizing the publicly available data regarding the loss in annual
energy production (AEP) associated with operational minimization. Data on the loss in AEP is limited to
five wind energy facilities across 11 operational minimization comparisons. The reported loss in AEP
ranges from 0.06–3.20%, and is influenced by several factors, such as the prescribed cut-in speed,
number of nights implementing operational minimization, turbine model, and wind regime. Additional
considerations include, but are not limited to, the financial (e.g., market and price structure),
technological (e.g., technology replacement and maintenance), and contractual liability (e.g., power
purchasing agreements) associated with lost generation. Therefore, the loss of AEP is not the only
constraint on the wind energy industry. Moreover, the circumstances at one site may have limited
applicability to others and it is not appropriate to generalize cost or liability across facilities. Therefore,
developing strategies that meet both economic and conservation goals is necessary.

 — ii —
TABLE OF CONTENTS
Executive Summary........................................................................................................................... II
Table of Contents ............................................................................................................................. III
Introduction ......................................................................................................................................1
Objective 1: Quantifying The Efficacy of Operational Minimization to Reduce Fatalities of Bats at Wind
 Turbines ..........................................................................................................................................3
 Overview of Quantitative Meta-analysis ......................................................................................... 3
 Section Objectives............................................................................................................................ 4
 Methods ......................................................................................................................................6
 Data Collection and Curation ........................................................................................................... 6
 Meta-analysis and Meta-regression ................................................................................................ 9
 Results....................................................................................................................................... 11
 Representation of Installed Turbines............................................................................................. 11
 Total Bat Fatalities ......................................................................................................................... 13
 Hoary Bat ....................................................................................................................................... 14
 Eastern Red Bat .............................................................................................................................. 14
 Silver-haired Bat............................................................................................................................. 15
 Discussion.................................................................................................................................. 30
Objective 2: Narrative Review of Studies of Operational Minimization to Reduce Bat Fatalities at
 Wind Energy Facilities .................................................................................................................... 32
 Use of Temperature to Improve Efficiency of Operational Minimization ..................................... 33
 Use of Nocturnal Timing to Improve Efficiency of Operational Minimization .............................. 34
 Use of Bat Activity to Improve Efficiency of Operational Minimization ........................................ 34
 Use of Wind Direction to Improve Efficiency of Operational Minimization .................................. 35
 Improving Measurements of Wind Speed to Improve Efficiency of Operational Minimization ... 35
 Feathering below Manufacturer’s Cut-in Speed as Operational Minimization ............................. 36
 Efficacy of Operational Minimization on Individual Species.......................................................... 38
 Inter-annual Variation in Fatality Rates Limits Comparing Efficacy of Operational Minimization 39
 Factors Influential for Statistical Inference in Operational Minimization Studies ......................... 40
Objective 3: Power Loss Associated with Operational Minimization .................................................. 43
 Publicly Reported Power Loss ........................................................................................................ 43
Conclusion ....................................................................................................................................... 46
References....................................................................................................................................... 47
Appendix I Definitions ...................................................................................................................... 51
Appendix II Abstracts from Operational Minimization Studies ........................................................... 52
 Anonymous 1............................................................................................................................. 53
 Anonymous 2............................................................................................................................. 55
 Alberta, Canada ......................................................................................................................... 56
 Beech Ridge Wind Farm, West Virginia ....................................................................................... 57
 Blue Creek Wind Energy Facility, Ohio USA ................................................................................. 58
 Blue Sky Green Field, Wisconsin, USA ......................................................................................... 59
 Casselman Wind Project, Pennsylvania, USA ............................................................................... 60
 Criterion Wind Project, Maryland ............................................................................................... 61

 — iii —
Fowler Ridge Wind Farm, Indiana, USA ....................................................................................... 62
 Study Year 2010 ............................................................................................................................. 62
 Study Year 2011 ............................................................................................................................. 64
 Summary 2010-2017 ...................................................................................................................... 65
 Hawaii, USA - Kaheawa and Auwahi ........................................................................................... 67
 Mount Storm, West Virginia , USA .............................................................................................. 69
 Study Year 2010 ............................................................................................................................. 69
 Study Year 2011 ............................................................................................................................. 71
 Ontario, Canada ......................................................................................................................... 73
 Pinnacle Wind Farm, West Virginia, USA ..................................................................................... 74
 Study Year 2012 ............................................................................................................................. 74
 Study Year 2013 ............................................................................................................................. 76
 Study Year 2015 ............................................................................................................................. 78
 Sheffield Wind Facility, Vermont, USA ........................................................................................ 80
 Wildcat Wind Farm, Indiana, USA ............................................................................................... 81
 Wolfe Island, Ontario, Canada .................................................................................................... 82
 Wolf Ridge, Texas, USA .............................................................................................................. 83
 North American Values Comparison ........................................................................................... 84
Appendix III: Caclulation of Fatality Rate from Raw Data ................................................................... 85
 Blue Creek, Ohio 2017 ................................................................................................................ 85
 Fowler Ridge, Indiana 2010 ........................................................................................................ 85
 Fowler Ridge, Indiana 2011 ........................................................................................................ 86
 Pinnacle, Pennsylvania 2012....................................................................................................... 86

 — iv —
INTRODUCTION
 Wind energy generation is a rapidly growing sector in the electric generation market in the
United States that is driven by an effort to produce electricity and reduce global carbon emissions. In the
United States, the installed capacity of wind turbines grew over 2.5 times between 2010 and 2019
(AWEA 2019). The U.S. Department of Energy (DOE) estimated that wind energy generation reduced
fossil fuel energy carbon emissions by 6% in 2015 (DOE 2015), demonstrating that sustained growth in
wind energy can reduce national emission levels. The increasing number of wind energy facilities in the
United States and around the world has raised concerns regarding unintended impacts to wildlife.
 The impact of wind turbines on bat populations is of particular concern (Kunz et al. 2007, Arnett
and Baerwald 2013, Arnett et al. 2016). Hundreds of thousands of bats are estimated to die each year in
collisions with wind turbines in the United States and Canada (Arnett and Baerwald 2013, Hayes 2013,
Smallwood 2013). North America’s migratory species, the hoary bat (Lasiurus cinereus), eastern red bat
(L. borealis), and the silver-haired bat (Lasionycteris noctivagans) comprise 72% of fatalities with hoary
bats representing approximately 38% of fatalities (Arnett and Baerwald 2013). Given our current
understanding of bat demographic parameters, range of plausible population sizes for hoary bats in
North America, and installed wind capacity in 2014, this level of mortality could lead to rapid population
declines or extinction of hoary bats (Frick et al. 2017). The possible population level impact of wind
turbines on hoary bats underscores the need to develop and implement practicable solutions that
reduce bat fatalities at wind energy facilities. Developing practicable solutions that acknowledge
economic constraints can help assure the wind energy sector can persist and continue to reduce global
carbon emissions without negative impacts to vulnerable species.
 One strategy for reducing bat mortality at wind turbines is to alter turbine operations (i.e.,
feather turbine blades and raise the cut-in speed of wind turbines) during periods of high risk for bats.
To implement, blades are rotated parallel to the wind in a process called feathering. This slows or stops
the blades from rotating, thus eliminating risk of collision with bats. Raising the cut-in speed (i.e., the
speed at which electricity is generated) above the manufacturer’s setting limits blade rotation during
times they would normally produce electricity (see Appendix 1 for formal definitions). Operational
minimization, or curtailment, are umbrella terms for this strategy, but can be further refined depending
on the data used to inform turbine operations. Blanket or standard curtailment refers to altering turbine
operation based solely on wind speed. In 2013, Arnett et al. conducted a narrative synthesis of 10
operational minimization studies and concluded:
Operational Minimization | Introduction

 ... increasing cut-in speed between 1.5 and 3.0 m/s or feathering blades and slowing
 rotor speed up to the turbine manufacturer’s cut-in speed yields substantial reductions
 in fatality of bats.

 At that time, publicly available information on power loss was only available from two
operational minimization studies. Both reported that less than 1% of power loss was likely if operational
minimization was implemented during periods identified as high risk for bats (i.e., at night, autumn
seasonal period when wind speeds are less than approximately 5.0 m/s). However, variability in wind
speed regimes, markets, price structure, and numerous other factors make it difficult to extrapolate
these results to other wind energy facilities. Furthermore, even 1% power loss may not be economically
feasible for some projects. Therefore, developing strategies that maximize energy production while
minimizing bat fatalities is necessary. Refining periods of high risk may help meet both economic and
conservation goals and was recognized as a priority by Arnett et al. (2013) when they recommended
that:
 Research efforts should continue to focus on incorporating additional variables, in
 addition to wind speed (e.g., temperature, time of night, bat activity) into treatments
 and explore using automated systems to maximize wind production while still
 minimizing bat fatalities.

 Incorporating variables, such as weather (e.g., temperature) or bat activity, in addition to wind
speed is referred to as smart curtailment. Since Arnett et al. (2013), two smart curtailment studies have
been conducted incorporating additional weather variables into the decision-making process (e.g., Hale
and Bennett 2014, Martin et al. 2017). One study included both weather and real-time bat activity when
deciding when to curtail wind turbines (Hayes et al. 2019).
 In 2004, the Bats and Wind Energy Cooperative (BWEC; www.batsandwind.org) was formed to
develop solutions to measure and mitigate the impacts of wind turbines on bats that meet both
economic and conservation goals. The BWEC identified operational minimization (i.e., feathering turbine
blades and raising cut-in speeds during periods of high risk for bats to reduce collision mortality) as a top
priority for research (BWEC 2009). In 2018, the BWEC recommended an update to Arnett et al. (2013)
synthesis (BWEC 2019). Here, we provide a review of publicly available operational minimization studies.
We incorporate recent studies completed since Arnett et al. (2013) and quantifying the effectiveness
(amount of bat fatality reduction) using quantitative meta-analysis (USFWS 2012). Specifically, our
objectives were to:

 1. Quantify the effectiveness of operational minimization using quantitative meta-analysis,

 Page | 2
Operational Minimization | Introduction

 2. Provide a narrative summary of key findings from studies completed since Arnett et al. (2013),
 and
 3. Review the reported power loss associated with operational minimization.

OBJECTIVE 1:
 QUANTIFYING THE EFFICACY OF
 OPERATIONAL MINIMIZATION TO REDUCE
 FATALITIES OF BATS AT WIND TURBINES
 Evaluating the efficacy of operational minimization to reduce fatalities of bats at wind turbines
has been the goal of multiple studies (Appendix II). However, the unique conditions of each study make
it difficult to extrapolate and compare results of studies from different facilities. One common way to
compare results has been to correlate reported percent reduction in bat fatalities with a treatment cut-
in speed (e.g., Figure 1.1). However, simply correlating reductions in bat fatalities across studies, ignores
important factors of each study such as: turbine characteristics (e.g., start-up speed of different turbine
models), the sample size of turbines assigned as treatment and controls, and the variation in observed
fatalities. Ignoring these factors limits our ability to quantify the expected effect of operational
minimization to reduce bat fatalities under specific conditions. We address these challenges by using
quantitative meta-analysis to estimate trends in the efficacy of curtailment of wind turbines to reduce
bat fatalities while accounting for the variation documented within and among a range of individual
studies.

Overview of Quantitative Meta-analysis
 Quantitative meta-analysis is used to describe the overall effect of an action by aggregating and
comparing data from multiple studies (Lipsey and Wilson 2001). For control/treatment studies, such as
those used to analyze the effectiveness of operational minimization to reduce bat fatalities at wind
turbines, we use quantitative meta-analysis to calculate an effect size. The effect size has both a mean
and variance to account for uncertainty in estimated effects of a treatment. Each study is given a weight
based on the variation in the observed data with greater weight given to studies with less variation since
the results of these studies are often more reliable. This weight is used to assign a contribution of each
study to the later meta-regression.
 The effect size of a continuous response such as bat fatality rate can be calculated using various
standardized measures (Lipsey and Wilson 2001). In this instance, the effect size was measured as the

 Page | 3
Operational Minimization | Meta-analysis

difference of the log fatality rates between control and treatment scenarios. Because the fatality rate is
on the log scale, this metric is the same as the ratio of control and treatment fatality rates. This metric
can be transformed to a percent reduction in fatalities, which is a standard and easily interpreted metric
to measure the efficacy of the treatment of operational minimization on reducing bat fatality rate.
 One advantage to meta-analysis is the ability to examine the consistency of the effect sizes
among studies. If among-study variation is greater than within-study error (i.e. sampling error), results
are considered heterogeneous. Heterogeneity can be introduced by sampling differences (e.g.,
experimental design, geography, treatment differences, etc.). The presence of heterogeneity is
determined by a Q test, while the size of variation can be calculated using the I2 measure of variability. If
heterogeneity is present, a random effect model can be used to search for moderators that explain the
variation in a process referred to as meta-regression (Koricheva et al. 2013). Moderators can include any
categorical or numerical factor differentiating studies. Commonly used moderators include factors
related to study design, known differences between studies (e.g., temperature), spatial relationships
(e.g., latitude and longitude or region), and temporal factors (e.g., if a treatment is more effective now
or in the past). Mean effect size for specific scenarios is predicted by explaining how moderators
influence effect size.

Section Objectives
 We examine the effect of operational minimization on bat fatalities using meta-regression to
account for variation across individual studies that experimentally tested the efficacy of curtailment. By
coupling quantitative meta-analysis with meta-regression, we combined studies and explore moderators
of between-study differences in a statistically robust way.
 Specifically, our objectives are to:
 1) Standardize study results across available operational minimization studies by
 calculating the effect size (log ratio of the means (ROM)) between estimated fatalities
 under control and curtailed conditions,
 2) Identify moderators that explain the variation in observed effect size of operational
 minimization using meta-regression, and
 3) Examine species-specific efficacy of operational minimization.

 Page | 4
Operational Minimization | Meta-analysis

 Figure 1.1: Reported percent fatality reduction for available studies of operational minimization.
 Studies on operational minimization occurred over an 11-year period (2007–2017), include a range of
 cut-in speed treatments (3.5–8.0 m/s), and had variable precision in estimates of fatality reduction. All
 studies are listed in Appendix II. Not all studies were used in the meta-analysis.

 Page | 5
Operational Minimization | Meta-analysis

Methods

Data Collection and Curation
 Calculating ROM for each study requires the mean and associated uncertainty (standard error,
confidence interval, etc.) and sample size for both the treatment (i.e., the curtailment strategy) and
control (i.e., normal operation). We manually extracted these values from each study using all
information available for each study, including posters, presentations, reports, and/or published
literature, when available. We gathered literature from the BWEC Bats and Wind Energy Bibliography
and by using a Google Scholar search of ‘bats wind curtailment.’ To be included in the meta-analysis,
documents had to report the fatality rate and associated measure of uncertainty (standard deviation,
variation, standard error, or confidence interval) for a control and treatment conducted in the same
year (or provide data that could be used to calculate these values).
 Nineteen treatments at eight study sites reported appropriate data to be included in the meta-
analysis, including peer-reviewed studies at four facilities (Table 1.1; Appendix II). For studies that did
not report results of fatality rates, we used their raw data to calculate the estimated fatality rate for
each treatment (Table 1.1). Details on our calculation of fatality rates using raw data are provided in
Appendix III.
 We log transformed fatality rates and associated confidence intervals prior to calculating effect
size. Log transformation is necessary since fatality rates cannot fall below zero; it also helps account for
many modeling techniques that use a log-link to calculate confidence intervals. We calculated effect size
by taking the difference of the log transformed values of treatment and control turbines. We calculated
the variance of each effect size on the log scale using Equation 1.1.

 Equation 1.1: Calculation of variance for studies that provided fatality rates and confidence intervals,
 where t represents the value of the t distribution with n-1 degrees of freedom and p probability (90%
 or 95% depending on reported confidence levels. n = the number of turbines in the treatment, uci =
 upper confidence limit, lci = lower confidence interval.

 2

 −
 ̂ = ( )
 −

For the Baerwald et al. (2009) study, we used Equation 1.2 and Equation 1.3 to calculate effect size
mean and variance because they reported standard error estimates instead of confidence intervals.

 Page | 6
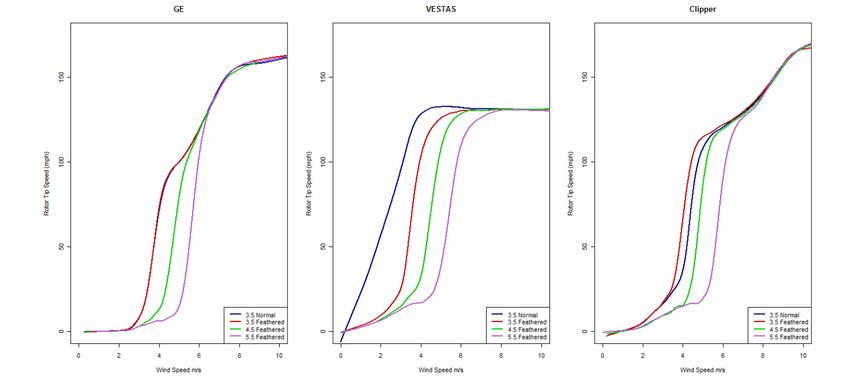
Operational Minimization | Meta-analysis

 ̅ ) and n turbines in sample when mean and
 Equation 1.2: Calculation of variance when the mean (
 standard error (SE) is provided
 ̅ ∗
 ̂ = (
 + )
 ( ̅)

 ̅ ) on log scale when mean and standard error are provided
 ̂
 Equation 1.3: Calculation of mean (
 ̂ = (
 ̅ ) − /
 ̂
 Variance of the mean effect size for a treatment was calculated with Equation 1.4.,
implemented by the escalc function in metafor package (version 2.4; Viechtbauer 2010) in Program R
(version 4.0; R Core Team 2020). We used the effect size calculation for mean difference (measure =
“MD”) since the difference of log values is equivalent to the log of the ratio of the means.

 Equation 1.4: Calculation of the variance of the effect size given the control (subscript 1) and
 treatment (subscript 2) variance and sample size (N; number of turbines).

 ̂
 ̂
 ̂ =
 +

 We removed two studies from the meta-analysis and meta-regression because they each had
curtailment strategies that were not used in other studies, thus not comparable with meta-analysis. At
the Sheffield wind facility, curtailment was only implemented when temperatures were above 10°C
(Martin et al. 2017). The curtailment treatment at BlueSky–Green Field was only implemented when
bats were detected in the area with acoustic sensors (Hayes et al. 2019). Nonetheless, we include the
effect size of these two sites in graphs to allow qualitative comparison of their results to other
curtailment strategies. We also excluded the wind-speed and direction treatments at the Wolf Ridge
facility (Hale and Bennet 2014) since this treatment was not repeated at another facility.
 We examined how representative the meta-analysis dataset is of the fleet of utility scale wind
turbines (>1.5MW and more than 1 turbine at a location) currently in operation (Hoen et al. 2018) that
began operation during the same years as the study facilities (2007–2012). We used kernel density plots
of the distribution of hub-height and rotor swept areas of turbines used in minimization studies to
visually examine the distribution of these turbine characteristics compared to available turbines
operating in the U.S. fleet. We used the overlap function of the overlapping package (version 1.6;
Pastore 2018) to estimate the percentage overlap between the kernel density plots as a measure of
similarity between turbines used in operational minimization studies and all turbines in the U.S.
Geographic representation was examined visually by plotting facilities where studies were located and
wind energy installations on a map.

 Page | 7
Operational Minimization | Meta-analysis
 Table 1.1: Publicly available operational minimization studies that include bat fatality rates at control and treatment turbines for the same year. Sources
 include all reports and peer-reviewed publications (*) that describe the study. The data source indicates the document that provided fatality rates used in the
 meta-analysis.
 Facility Year Location Source(s) Data Source Treatments Species
 Blue Creek 2017 Ohio, Schirmacher 2020 Calculated from raw data1 5.0 m/s L. cinereus
 USA L. borealis
 L. noctivagans
 Blue Sky – 2015 Wisconsin, Hayes et al. 2019* Hayes et al. 20192 7.9 m/s L. cinereus
 Green Field USA EPRI 2017 (if bats present) L. borealis
 L. noctivagans
 Casselman 2008 Pennsylvania, Arnett et al. 2011*3 Arnett et al. 2009 5.0 m/s
 USA Arnett et al. 2009 6.5 m/s
 2009 Arnett et al 2010 Arnett et al. 2010 5.0 m/s
 6.5 m/s
 Fowler Ridge4 2010 Indiana, Good et al. 2011 Calculated from raw data in report1 5.0 m/s5 L. cinereus
 USA 6.5 m/s5 L. borealis
 L. noctivagans
 2011 Good et al. 2012 Calculated from raw data in report1 3.5 m/s6 L. cinereus
 4.5 m/s L. borealis
 5.5 m/s L. noctivagans
 Pinnacle 2012 West Virginia, Hein et al. 2013 Combined species from Schirmacher et al. 6.0 m/s L. cinereus
 USA 20163 L. borealis
 Species-specific from BCI raw data1 L. noctivagans
 2013 Hein et al. 2014 Hein et al. 2014 6.0 m/s L. cinereus
 L. borealis
 L. noctivagans
 Sheffield 2012 Vermont, USA Martin et al. 2017*3 Martin 20152 6.0 m/s
 2013 Martin 2015
 Summer View 2007 Alberta, Baerwald et al. Baerwald et al. 2009* 5.5 m/s L. cinereus
 CA 2009* Low wind speed idle L. noctivagans
 Wolf Ridge 2011 Texas, Hale and Bennett Provided by authors 5.0 m/s L. cinereus7
 2012 USA 2014 L. borealis7
 2013
 2014
 1
 See Appendix III for methods used to calculate fatality rates from raw data; 2Data presented for comparison purposes only. Data are not used in the meta-analysis due to
 unique study design that involves acoustic detections (Blue Sky – Green Field) and temperature (Sheffield); 3This later report included standardized results from multiple
 years; 4Data from Fowler Ridge was split into to an effect size for each of 3 turbine models (GE, Vestas, and Clipper) that were used in the study to allow for meta-regression
 using turbine specific characteristics; 5Treatments at Fowler Ridge in 2010 did not feather below the cut-in speed; 63.5 m/s at Fowler Ridge 2011 was simply feathering of
 blades below the cut-in speed; 7Species fatality rates from Wolf Ridge were only available for 2013 and 2014.

 Page | 8
Operational Minimization | Meta-analysis

Meta-analysis and Meta-regression
 We conducted the meta-analysis and meta-regression for all bat fatalities combined and for
three species that had enough data on species-specific fatalities: eastern red bats (Lasiurus borealis),
hoary bats, and silver-haired bats (Lasionycteris noctivagans). Analysis for all species combined was
conducted with 29 control-treatment comparisons at 6 facilities. Six facilities with 21 control-treatment
comparisons reported data usable for analysis of curtailment efficacy for eastern red bats. For hoary
bats, data from 21 control-treatment comparisons at seven facilities were used. Data from 19 control-
treatment comparisons from six facilities were used when evaluating silver-haired bats.
 We fit a multi-level null random effects model with intercept using the metafor package
(Viechtbauer 2010) in Program R (R Core Team 2020) for each analysis set. We specified a nested
random effect of year within facility to examine variation between years at the same facility and among
facilities. We used the default process to assign weights to each comparison based on the inverse of the
variability (sampling and random effects, accounting for covariance) of each comparison (Viechtbauer
2010).
 Random effects models without moderators indicated heterogeneity in results (Q test p-value <
0.05) for all species combined and each species individually. We performed meta-regression to evaluate
the influence of study-specific moderators on the variability in effect size using a set of candidate
models. Moderators added to the null multi-level model represented four hypotheses to explain
variation: study design differences, geographic variation, turbine characteristic variation, and treatment
differences (Figure 1.2). Treatment differences were split into multiple models to explore which
treatment measure best accounted for variation. Possible measures to describe treatments and control
included the non-linear effect of treatment curtailment speed, feathering of blades, and cut-in speed of
treatment and control turbines.

 Page | 9
Operational Minimization | Meta-analysis

 Table 1.2: Candidate model set (n = 17) to account for variation in effect size of curtailment studies. Moderators are the numerical and factor variables used
 to model the described prediction. All models included the same random effect of year nested within facility and a covariance matrix to account for multiple
 treatments being compared to a single control.
 Model Name Moderators Prediction
 1
 Study design Plot Size + Treatment Allocation The study design will determine the strength of the results
 Geographic Latitude*Longitude Curtailment effect will vary based on location of the wind
 facility
 Turbine characteristics Rotor Swept Area + Hub Height Curtailment effect will vary based on the size of the
 turbine
 Treatment Difference Models
 Cut-in Speed & Feathering Control Cut-In Speed + Higher cut-in speeds and feathering reduce fatality levels
 Control Feathering +
 Treatment Cut-In Speed +
 Treatment Feathering
 Cut-in Speed Control Cut-In Speed + Higher cut-in speeds reduce fatality levels
 Treatment Cut-In Speed
 Non-linear Treatment Cut-in Natural Spline of Treatment Cut-In Speed with 3 degrees of Increasing cut-in speed has a diminishing effect on fatality
 Freedom reduction
 Treatment Cut-in Treatment Cut-In Speed Increasing cut-in speed has a linear effect on fatality
 reduction
 1
 Randomized Block Design—treatments were rotated so every turbine received all treatment or Completely Randomized Design—each turbine had a fixed
 treatment

 Page | 10
Operational Minimization | Meta-analysis

 All candidate models were fit using the maximum likelihood estimator with t-test for
significance of fixed effect moderators. We compared support for candidate models using an
information-theoretic model selection criteria approach (AICc; Burnham and Anderson 2002). The top
model based on lowest AICc value was refit using restricted maximum likelihood estimation (REML) to
produce unbiased estimates of variance and covariance parameters. This top model was used to
describe the relationship of the relevant moderators to the effect of curtailment.
 Studies with a stronger statistical result tend to be published more frequently than studies
without statistically significant results (Møller et al. 2001, Song et al. 2000). This can bias the results of
meta-analysis by overestimating the effect size. We used gray literature in addition to peer-reviewed
studies, which may help protect against publication bias. We examined publication bias using funnel
plots and rank correlation test (Begg and Mazumdar 1994).

Results

Representation of Installed Turbines
 Facilities used in the meta-analysis are primarily located in the eastern Midwest (Indiana, Ohio)
and Mid-Atlantic regions (West Virginia, Pennsylvania), with the addition of one facility in Texas and one
in Alberta, CA. The greatest amount of installed turbines in the United States are located in the western
Midwest (e.g., Iowa) and Southern Great Plains (e.g. Texas; Figure 1.2A). Therefore, facilities in the
southwestern and northwestern United States are not well represented by available studies. Geographic
distribution of facilities built in 2007–2012 (Figure 1.2D) is similar to the current fleet (Figure 1.2A),
suggesting that lack of geographic representation in western regions is not due to recent trends in build-
out.
 The kernel density of rotor swept area of turbines used in minimization studies and turbines
built during 2007–2012 overlap by 56% (Figure 1.2:E) and overlap by 42% with the current fleet (Figure
1.2:B), suggesting turbines used in operational minimization studies are generally smaller in term of
rotor swept areas to turbines operating in the U.S. fleet. Similarly, the kernel density of hub height of
turbines in the meta-analysis and the fleet built between 2007–2012 show an overlap of 35% (Figure
1.2:F) and 33% overlap with the current fleet (Figure 1.2C). Turbines with 100-m hub height tended to
be over-represented while turbines of 80 m tended to be under-represented (Figure 1.2C).

 Page | 11
Operational Minimization | Meta-analysis

 Figure 1.2: Comparison of geography (A,D), turbine rotor swept area (B, E), and hub height (C,F) for all utility scale wind turbines (>1.5 MW) in the United
 States Wind Turbine Data Base (A-C) and turbines from facilities that began operation in 2007-2012(D-E), the time period when facilities where operational
 minimization studies took place began operating. Our meta-analysis included an additional site in Alberta, Canada not shown here since we lack similar
 comparative data for Canada.

 Page | 12
Operational Minimization | Meta-analysis

Total Bat Fatalities

 The mean effect size (log Ratio of Means) was transformed to percent reduction in fatalities
with a given treatment. For all but one study, the mean effect size was greater than 35.3% (Figure 1.3.
The lower confidence intervals for six studies (including Sheffield and Blue-Sky-Green Field) overlapped
zero. Wolf Ridge 2011 was the only study with a negative mean effect size (increase in fatalities at
treatment turbines), however the results were not statistically significant. Hale and Bennett (2014)
noted that there was an extreme drought in 2011 and overall fatality rates at Wolf Ridge were 1/10 to
1/20 of previous years. The greatest reduction was a 91.3% reduction in fatalities at Fowler Ridge when
Vestas turbines cut in speed was raised from 3.5 to 6.5 m/s in 2010 (Figure 1.1).
 As expected, there was significant heterogeneity in fatality reductions among operational
minimization studies when no moderators were used (Q28 = 68.12, p-value
Operational Minimization | Meta-analysis

The expected reduction at a given cut-in speed includes the effect of feathering below the cut-in speed.

Hoary Bat

 Twenty control-treatment comparisons had data appropriate to analyze the efficacy of operational
minimization for hoary bats (Figure 1.7). Three additional comparisons were made by studies; however,
the variance estimates included infinity and could not be used in the meta-analysis (see Appendix III).
Four comparisons had an effect size greater than or equal to zero. Positive effect sizes ranged from a
Operational Minimization | Meta-analysis

reduction in fatalities. Eight studies had confidence intervals overlapping zero (Figure 1.9). A random
effects model indicated significant heterogeneity between study results without the inclusion of
moderators (Q20 = 37.65, p-value = 0.010).
 The top model with moderators included the linear effect of treatment cut-in speed and carried
76% of the weight in the candidate model set (Table 1.3). There was no residual heterogeneity in effect
size after accounting for cut-in speed of treatments (Q19 = 28.7, p-value= 0.07). Heterogeneity between
studies accounted for 47% (I2) of the variation while sampling variation accounted for 53% of the
variation. Among facility heterogeneity accounted for 17% of the variance. Inter-annual heterogeneity
accounted for 30% of variation. No publication bias was detected (Kendall’s tau = 0.18, p-value = 0.27;
Figure 1.4C).
 Increasing treatment cut in speed significantly increased the efficacy of operational
minimization at reducing eastern red bat fatalities (β ±SE = 0.38 ± 0.117, p-value = 0.004). Every 1.0 m/s
increase in treatment cut-in further reduces fatalities by 32% (95%CI 13-47%; Figure 2.5C; Table 1.6).

Silver-haired Bat

 A total of 17 control-treatment comparisons were used to evaluate the efficacy of operational
minimization at reducing silver-haired bat fatalities. Models of silver-haired bat fatalities at Clipper
turbines at Fowler Ridge Wind Facility in 2011 did not converge (Appendix III) and were not used in the
meta-analysis. Four comparisons reported a mean effect size less than zero, indicating an increase in
fatalities with treatments. All four had extremely wide confidence intervals that included zero. The
remaining 15 comparisons reported a minimum mean effect size of 25% and a maximum of 93%. Eight
of these had confidence intervals including zero (Figure 1.10). There was significant heterogeneity
among results when no moderators were used in a random effects model (Q17 = 27.46, p-value = 0.05).
 The top model to account for heterogeneity included the linear effect of treatment cut-in speed
(weight = 43%; Table 1.3). The next model (ΔAICc = 0.5, weight =3 4%) included the linear effect of
treatment cut-in speed and the cut-in speed of the control. While this model had similar support, the
effect of the control cut-in speed was not statistically significant (p-value = 0.08). Therefore, we chose
the most parsimonious model that only included the linear effect of treatment cut-in speed. This model
had no publication bias (Kendall’s tau = -0.15, p-value = 0.41; Figure 1.4D). Heterogeneity accounted for
23% of variation (I2). All but 2.2e-7% of variation was attributable to inter-annual heterogeneity (i.e.,
2.2e-7% of variation was attributable to among facility heterogeneity).

 Page | 15
Operational Minimization | Meta-analysis

 There was no residual heterogeneity in silver-haired bat fatality reduction when using treatment
cut-in speed as a moderator (Q16 = 19.9, p-value = 0.22). Increasing cut-in speed had a significant effect
on reducing silver-haired bat fatalities (β ± SE = 0.39 ± 0.17, p-value = 0.04). Raising cut-in speed by 1.0
m/s is estimated to reduce silver-haired bat fatalities by 32% (95%CI 3%-53%; Figure 2.5D; Table 1.7).

 Page | 16
Operational Minimization | Meta-analysis

 Figure 1.3: Effect size (log ratio of means transformed to percent decrease) of reduction in total bat fatalities from tested operational minimization strategies.
 Ratios are converted to percentages for interpretation. A higher percent indicates a greater reduction in fatality due to curtailment. A negative percentage
 indicates an increase in fatalities. Squares represent mean percent difference for individual studies; lines represent the 95% confidence interval. Results from
 the Sheffield and Blue Sky-Green Field facilities are included for reference only and were not used in the meta-analysis or meta-regression.

 Page | 17
Operational Minimization | Meta-analysis

 Table 1.3: Model ranks and delta AICc values (from top model) for candidate model set (n = 17) tested for each species and total bat fatalities. See Table 1.2
 for model descriptions. All models included the same random effect of year nested within facility and a covariance matrix to account for multiple treatments
 being compared to a single control.

 Total Bats Hoary Bat1 Eastern Red Bat Silver-haired Bat

 Model Name Rank ΔAICc Weight Rank ΔAICc Weight Rank ΔAICc Weight Rank ΔAICc Weight
 Treatment cut-in speed 1 0 0.72 1 0 0.41 1 0 0.76 1 0 0.44
 Cut-in speed 2 2.25 0.23 4 2.34 0.13 2 3.12 0.16 2 0.51 0.34
 (control & treatment)
 Non-linear 3 6.05 0.04 5 6.24 0.02 4 6.86 0.02 4 1.81 0.18
 treatment cut-in
 Cut-in speed & feathering 4 8.33 0.01 8 11.21
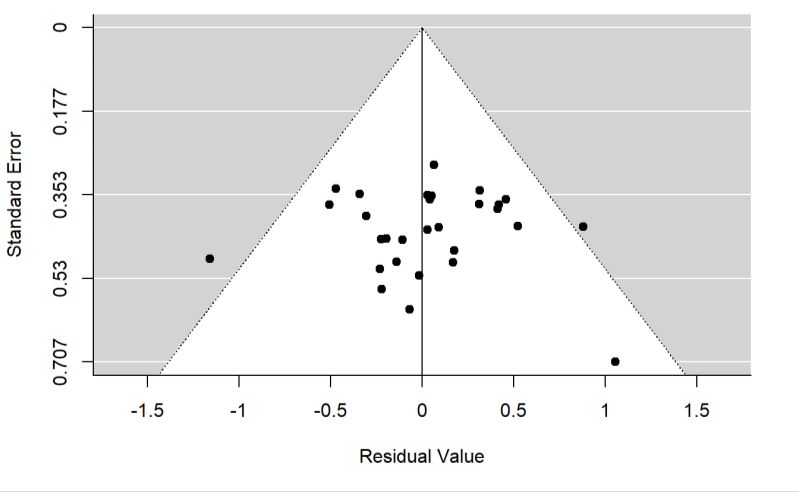
Operational Minimization | Meta-analysis

 Total bat Hoary bat

 Eastern red bat Silver-haired bat

 Figure 1.4: Funnel plots of studies used in meta-analysis and meta-regression of reduction in bat fatalities at operational
 minimization studies for total bat, hoary bat, eastern red bat, and silver-haired bat fatalities. The symmetry of study standard error
 and residuals around 0 shows lack of publication bias, confirmed by the rank correlation test (total bat fatalities: Kendall’s tau =
 0.08, p= 0.54; hoary bat fatalities: Kendall’s tau = -0.05, p = 0.77; eastern red bat fatalities: Kendall’s tau = 1.8, p = 0.27; silver-
 haired bat fatalities: Kendall’s tau = -0.15, p = 0.41).

 Page | 19
Operational Minimization | Meta-analysis

 Total bat Hoary bat

 Eastern red bat Silver-haired bat

 Figure 1.5: Percent reduction of bat fatalities for operational minimization strategies with different treatment cut-in speeds (x-axis) for total bat, hoary bat,
 eastern red bat, and silver-haired bat fatalities. Mean reduction is represented by the solid line, the 95% confidence interval is represented by the gray ribbon,
 and a 95% prediction interval (area where 95% of values will fall) is shown by the dashed lines. Data points represent the ratio of mean (ROM) from studies
 used in the model. No data were available for control or treatment cut-in speeds below 3.5 m/s. Hoary bat (B) fatality reduction is shown at the median rotor
 swept area of study turbines.

 Page | 20
Operational Minimization | Meta-analysis

 Figure 1.6: Predicted log ratio of control to treatment total bat fatalities for operational minimization strategies with different
 treatment cut-in speeds (x-axis). This figure represents the same data as Figure 3; however, the Y-axis is not transformed to
 percent reduction to show that the relationship between the ratio of fatalities and treatment speed is linear. Mean reduction is
 represented by the solid line with confidence interval represented by the gray ribbon. Prediction interval is shown by the dashed
 lines. Points represent the ratio of mean of studies used to build the model.

 Page | 21
Operational Minimization | Meta-analysis

 Table 1.4: Predicted total bat fatality reduction for operational minimization cut-in speeds.
 Mean percent decrease and 95% confidence interval of the mean represent the expected
 overall decrease in total fatalities at all facilities implementing operational minimization of
 that treatment cut-in speed. The prediction interval represents the range of values that might
 be observed at individual facilities.

 Treatment Confidence Interval
 Cut-in Mean of Mean Prediction Interval
 Speed Percent
 (m/s) Decrease Lower Upper Lower Upper
 3.5 31% 4% 50% -30% 63%
 4.0 43% 26% 56% -3% 69%
 4.5 54% 43% 63% 17% 74%
 5.0 62% 54% 69% 33% 79%
 5.5 69% 62% 75% 45% 82%
 6.0 75% 68% 80% 54% 86%
 6.5 79% 72% 85% 61% 89%

 Page | 22
Operational Minimization | Meta-analysis

 Figure 1.7: Effect size (log ratio of means transformed to percent decrease) of reduction in hoary bat fatalities from tested operational minimization
 strategies. Ratios are converted to percentages for interpretation. A higher percentage indicates a greater reduction in fatality due to curtailment. A negative
 percentage indicates an increase in fatalities. Squares represent mean percent difference for individual studies; lines represent the 95% confidence interval.
 Blue Sky-Green Field results are included for reference only and were not used in the meta-analysis or meta-regression.

 Page | 23
Operational Minimization | Meta-analysis

 Table 1.5: Predicted fatality reduction of hoary bats (L. cinereus) across
 various operational minimization cut-in speeds. Mean percent decrease and
 confidence interval of the mean represent the expected overall decrease in
 total fatalities at all facilities implementing operational minimization of that
 treatment cut-in speed. The prediction interval represents the range of values
 that might be observed at individual facilities.

 Treatment Confidence Interval Prediction
 Cut-in Mean of Mean Interval
 Speed Percent
 (m/s) Decrease Lower Upper Lower Upper
 3.5 14% -57% 53% -106% 64%
 4.0 27% -19% 56% -62% 67%
 4.5 38% 8% 59% -30% 71%
 5.0 48% 24% 64% -9% 75%
 5.5 56% 33% 71% 6% 79%
 6.0 63% 38% 77% 16% 83%
 6.5 68% 41% 83% 23% 87%

 Page | 24
Operational Minimization | Meta-analysis

 Figure 1.8: Relationship between rotor swept area and predicted percent reduction of hoary bats when turbines were curtailed at
 5.0 m/s. Mean reduction is represented by the solid line with confidence interval represented by the gray ribbon. Prediction
 interval is shown by the dashed lines. Points represent the percent reduction of studies with operational minimization of 5.0 m/s.

 Page | 25
Operational Minimization | Meta-analysis

 Figure 1.9: Effect size (log ratio of means transformed to percent decrease) of reduction in eastern red bat fatalities from tested operational minimization
 strategies. Ratios are converted to percentages for interpretation. A higher percentage indicates a greater reduction in fatality due to curtailment. A negative
 percentage indicates an increase in fatalities. Squares represent mean percent difference for individual studies; lines represent the 95% confidence interval.
 Blue Sky-Green Field results are included for reference only and were not used in the meta-analysis or meta-regression.

 Page | 26
Operational Minimization | Meta-analysis

 Table 1.6: Predicted fatality reduction of eastern red bats (L. borealis) across operational
 minimization cut-in speeds. Mean percent decrease and confidence interval of the mean
 represent the expected overall decrease in total fatalities at all facilities implementing
 operational minimization of that treatment cut-in speed. The prediction interval represents
 the range of values that might be observed at individual facilities.

 Treatment Mean Confidence Interval
 Cut-in Speed Percent of Mean Prediction Interval
 (m/s) Decrease Lower Upper Lower Upper
 3.5 32% -19% 61% -85% 75%
 4.0 43% 8% 65% -47% 78%
 4.5 53% 28% 69% -18% 81%
 5.0 61% 42% 74% 3% 85%
 5.5 68% 51% 79% 20% 87%
 6.0 74% 58% 83% 32% 90%
 6.5 78% 63% 87% 42% 92%

 Page | 27
Operational Minimization | Meta-analysis

 Figure 1.10: Effect size (log ratio of means) of reduction in silver-haired bat fatalities from tested operational minimization strategies. Ratios are converted to
 percentages for interpretation. A higher percent indicates a greater reduction in fatality due to curtailment. A negative percentage indicates an increase in
 fatalities. Squares represent mean percent difference for individual studies; lines represent the 95% confidence interval. Blue Sky-Green Field results are
 included for reference only and were not used in the meta-analysis or meta-regression. Clipper Turbines at Fowler Ridge in 2011 had almost zero silver-haired
 bat fatalities at control turbines and an increased fatality rate at treatment turbines; this resulted in large percent increases in fatalities that cannot be
 reasonably graphed or included in analysis.

 Page | 28
Operational Minimization | Meta-analysis

 Table 1.7: Predicted fatality reduction of silvered-haired bats (Lasionycteris noctivagans)
 across operational minimization cut-in speeds. Mean percent decrease and confidence
 interval of the mean represent the expected overall decrease in total fatalities at all facilities
 implementing operational minimization of that treatment cut-in speed. The prediction
 interval represents the range of values that might be observed at individual facilities.
 Treatment Mean Confidence Interval
 Cut-in Speed Percent of Mean Prediction Interval
 (m/s) Decrease Lower Upper Lower Upper
 3.5 13% -75% 57% -123% 66%
 4.0 29% -24% 59% -66% 69%
 4.5 41% 9% 62% -27% 73%
 5.0 52% 30% 66% -1% 77%
 5.5 60% 42% 73% 16% 81%
 6.0 67% 47% 79% 28% 85%
 6.5 73% 51% 85% 35% 89%

 Table 1.8 Summary of important statistics from top model explaining the heterogeneity of
 operational minimization for total bat fatalities and fatalities of individual bat species.
 Silver-
 Hoary Eastern haired
 Total bat bat red bat bat
 Beta coefficient (slope)
 of treatment cut-in speed 0.40 0.33 0.39 0.38
 % reduction every +1 m/s 33% 28% 32% 32%
 Expected reduction in fatalities
 with a 5.0 m/s treatment 62% 48% 61% 52%
 2
 I – sum of facility + inter-annual 40% 23% 47% 23%
 I2 from Facility
Discussion
 We show that operational minimization is an effective strategy for reducing bat fatalities at wind
energy facilities in the United States. The efficacy is measurable, reducing total fatalities by 33% with
every 1.0 m/s increase in cut-in speed and was similar for three individual species (28% for hoary bats,
32% for eastern red bats, and 32% for silver-haired bats). Our results show that a 5.0 m/s cut-in speed
can reduce total bat fatalities across facilities and time periods by an average of 62% (95% CI: 54–69%).
Similar declines in fatality for a 5.0 m/s cut-in speed was estimated for hoary bats (48%; 95% CI: 24%–
64%), eastern red bats (61%; 95% CI: 42–74%), and silver-haired bats (52%; 95% CI: 30%–66%).
 Our results from the meta-regression analysis demonstrate that efficacy of operational
minimization to reduce bat fatalities was not highly variable among facilities nor among turbine types
(i.e., rotor swept areas or hub height), suggesting that operational minimization can be expected to be
effective at reducing bat fatalities across facilities and turbine types. For hoary bats, efficacy of
operational minimization at reducing fatalities increased slightly with rotor swept area size. However,
sampling is minimal especially at low RSA’s. These results suggest slightly greater reduction in hoary bat
fatalities as larger turbine sizes become used in operational minimization; however more research is
needed to investigate this possible relationship.
 Individual studies of operational minimization often lack the statistical power to detect
decreases in fatalities between multiple curtailment speeds or species given natural variability in fatality
rates coupled with experimental design constraints (e.g., number of observed fatalities and low sample
sizes (number of turbines)). Using meta-analysis, we were able to leverage the combined efforts of
individual studies to determine the overall efficacy of operational minimization as well as understand
key sources of variability that are helpful in determining the general applicability of operational
minimization to reduce bat fatalities. We could not include individual studies that failed to report
measures of variation in their estimates of fatality reduction in the meta-analysis, limiting their utility to
inform broader inference and identify important sources of variation.
 Our approach provides a framework that can incorporate results from future studies to make
comparisons of regional differences or compare the efficacy of different minimization strategies (e.g.,
are acoustic sound emitters as effective as operational minimization?). Various research efforts are
currently focused on improving ways to predict fatality risk to enable more precise conditions under
which operations are minimized to reduce bat fatality rates (e.g.,
https://www.energy.gov/eere/articles/energy-department-awards-68-million-wind-energy-research-
You can also read