A prospective study on the geothermal potential in the EU - Geoelec
←
→
Page content transcription
If your browser does not render page correctly, please read the page content below
Deliverable n° 2.5
              Date : November 2013

A prospective study on the geothermal
         potential in the EU

                        The sole responsibility for the content of this publication etc.lies with
                        the authors. It does not necessarily reflect the opinion of the European
                        Union. Neither the EACI nor the European Commission are responsible
                        for any use that may be made of the information contained therein.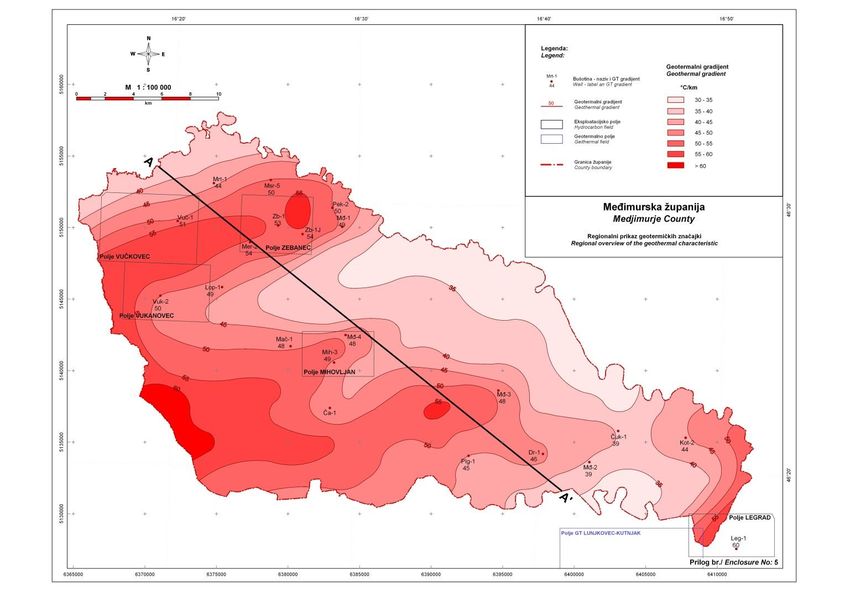
Executive summary .......................................................................................................................... 3

Introduction ....................................................................................................................................... 5

1. Resource Assessment: Definitions and Best practises ......................................................... 10

2. Resource assessment methodology in GEOELEC ................................................................. 16

3. Overview of Geothermal electricity potential in Europe ......................................................... 25

Country Outlook.............................................................................................................................. 29

Austria .............................................................................................................................................. 30

Belgium ............................................................................................................................................ 32

Bulgaria ............................................................................................................................................ 34

Croatia .............................................................................................................................................. 36

Czech Republic ............................................................................................................................... 38

Denmark........................................................................................................................................... 40

Estonia ............................................................................................................................................. 42

France .............................................................................................................................................. 44

Germany .......................................................................................................................................... 46

Greece .............................................................................................................................................. 49

Hungary ........................................................................................................................................... 52

Ireland .............................................................................................................................................. 55

Italy ................................................................................................................................................... 57

Latvia................................................................................................................................................ 60

Lithuania .......................................................................................................................................... 62

Luxemburg ...................................................................................................................................... 64

Poland .............................................................................................................................................. 66

Portugal ........................................................................................................................................... 68

Romania ........................................................................................................................................... 70

Slovakia ........................................................................................................................................... 72

Slovenia ........................................................................................................................................... 74

Spain ................................................................................................................................................ 76

                                                                        1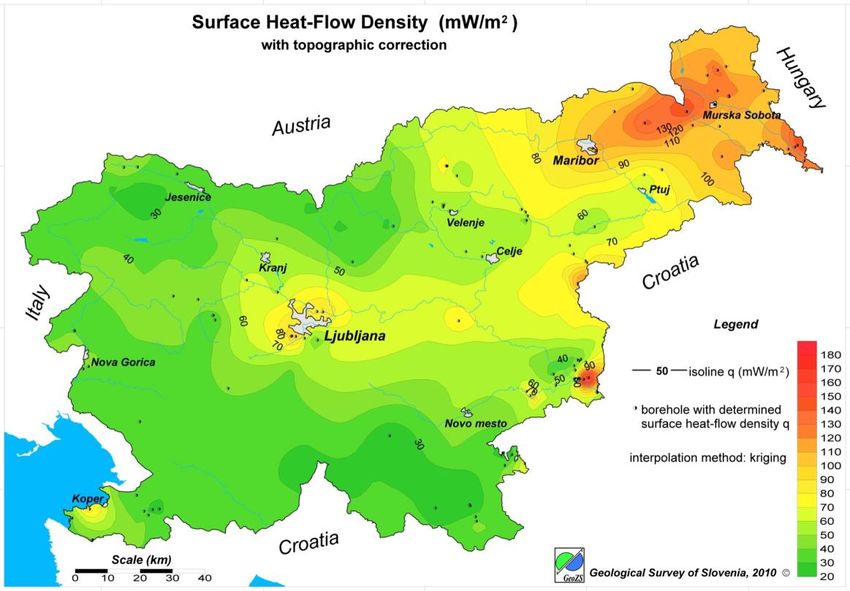
The Netherlands .............................................................................................................................. 78

  United Kingdom .............................................................................................................................. 80

  Iceland .............................................................................................................................................. 83

  Switzerland ...................................................................................................................................... 85

  Turkey .............................................................................................................................................. 87

  Recommendations for policy-makers: How to realise the geothermal electricity potential in
  Europe .............................................................................................................................................. 89

  ANNEX I: Modelling results - 2030 ................................................................................................ 93

  ANNEX II: Modelling results - 2050 ............................................................................................... 94

  ANNEX III: Geothermal Share in the electricity mix .................................................................... 95

  ANNEX IV THE GEOELEC CONSORTIUM .................................................................................... 96

AUTHORS:

Jan-Diederik van Wees, Thijs Boxem (TNO), Luca Angelino, Philippe Dumas (European Geothermal
Energy Council)

List of main abbreviations and acronyms used

    AGEA                     Australia Geothermal Energy Association
    CanGEA                   Canadian Geothermal Energy Association
    CHP                      Combined Heat and Power
    EGEC                     European Geothermal Energy Council
    EGRIF                    European Geothermal Risk Insurance Fund
    EGS                      Enhanced Geothermal Systems
    HIP                      Heat in Place
    HSA                      Hot Sedimentary Aquifer
    LCoE                     Levelised Cost of Energy
    NREAPs:                  National Renewable Energy Action Plans
    ORC                      Organic Rankine Cycle
    TC                       Theoretical Capacity
    TP                       Technical Potential
    TPLCoE_p                 Economic Technical Potential

                                                                         2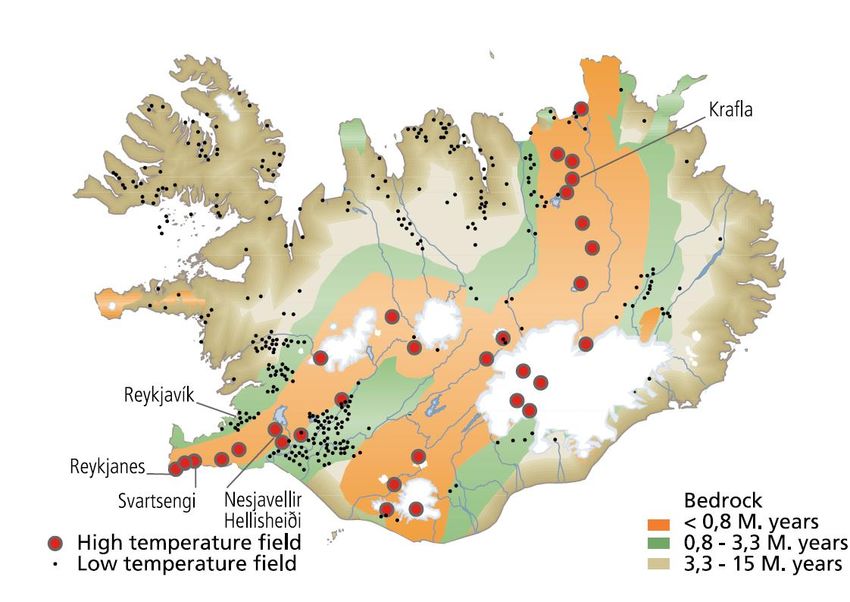
Executive summary

Geothermal power generation has its roots in Europe, where the first test in 1904 and the
real beginning of power generation in 1913 took place in Italy. Since then, the development
of geothermal technology has been slow but continuous.

Since a decade, thanks to the optimisation of the new binary system technology,
geothermal electricity can be produced using lower temperatures. Moreover, with
Enhanced Geothermal Systems (EGS), a breakthrough technology proven since 2007,
geothermal power can in theory be produced anywhere in Europe.

According to the trajectories set out in the National Renewable Energy Action Plans
(NREAPs) of the EU Member States, the capacity will grow from 0.9 GWe installed in 2013 to
1.4 GWe in 2020. The production of geothermal electricity in 2020 is planned to be 11 TWh.

These are very conservative targets as the actual potential is much larger. Indeed,
information about geothermal potential is not always available (no geological data below 2-
3 km from previous exploration campaign for oil, gas etc.) or it is scattered in different
ministries, universities, national institutes, oil & gas companies and various private entities.

For this reason many policy-makers are simply not aware they stand on a frequently
untapped source of local renewable energy. And this is also why geothermal power is not
always taken sufficiently into consideration in some NREAPs and other strategic documents
on the future electricity mix.

                                                                     EURO/MWh

                                              3
Minimum levelised costs of Energy in 2030 (in EUR/MWh)
The present GEOELEC study makes a first step to fill the existing gap. It provides an outlook
of the potential by country; the resource assessment is the product of the integration and
interpretation of existing data and a newly defined methodology building on Canadian,
Australian, and American methodology.
The geological potential (heat in place) for geothermal power has been translated to an
economical potential, using a Levelised Cost of Energy (LCoE) value of less than 150
EUR/MWh for the 2030 scenario and less than 100 EUR/MWh for the 2050 scenario:
The total geothermal electricity potential in the EU-28 is 21,2 TWh for the year
2020;
In 2030 this amounts to 34 TWh or 1% of the projected total electricity production
in the EU;
Thanks to economies of scale, innovative drilling concepts and substantial cost
reduction, the economic potential in the EU grows to approximately 2570 TWh in
2050 potentially covering as much as 50% of the projected electricity produced in
the EU) and more than 4000 TWh including Iceland, Turkey and Switzerland.
4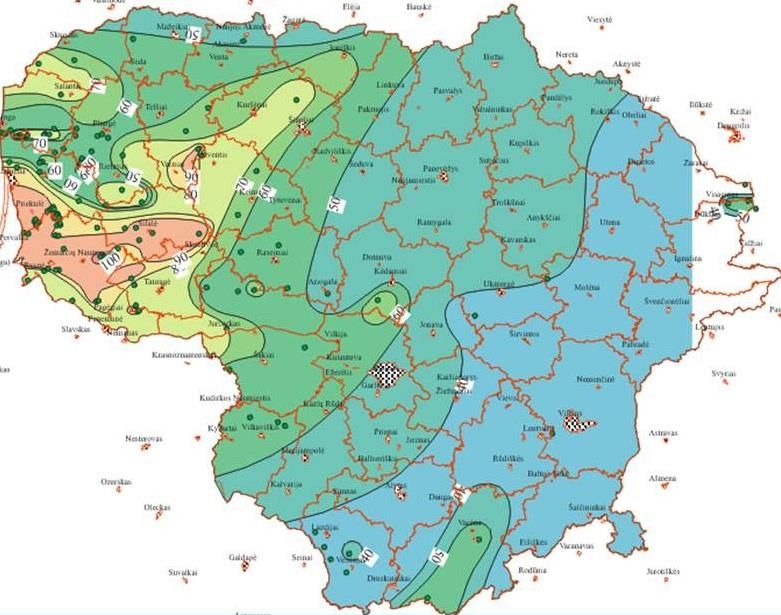
Introduction
What is geothermal electricity?
Until little over a century ago, the exploitation of geothermal resources was primarily for
leisure purposes; hot springs and geothermal baths. It was at the beginning of the 20th
century that the active development of geothermal resources for electricity supply began.
Successful production of electricity from geothermal heat was first achieved in Larderello,
Italy, in 1904.
Since then, the production of geothermal electricity has steadily increased. The methods by
which hydrothermal resources are developed for electricity production can be divided in
two categories: conventional (dry steam and flash steam turbines) and low temperature
(binary) geothermal electricity.
Conventional geothermal electricity: dry steam and flash steam turbines
Operating with large hydrothermal reservoirs at high temperature, i.e. above 150°C, such as
those found in Tuscany (Italy) and Iceland, this technology has 100 years of history and is
fully competitive today with a full cost of about 0.07 EUR/kWh including systems costs and
externalities. Regrettably, it is very unlikely that new large geothermal reservoirs will be
discovered in Europe. Therefore new projects need to be adapted to smaller and cooler
resources.

Low temperature, hydrothermal geothermal electricity: Binary: ORC and Kalina Cycle
Binary, known also as Organic Rankine Cycle (ORC) or Kalina Cycle, plants operate usually
with waters in the 100°C to 180°C temperature range. Working fluid selection, in
cooperation with beneficial conditions such as access to effective cooling, may allow power
production from as low temperatures as 80°C.

In a binary system, the heat of water is transferred to a separate liquid with a lower boiling
temperature. The separate liquid is called a ‘working fluid’. When the hot geothermal water
is brought to surface from deep underground, it is run through a ‘heat exchanger’ which
transfers the heat from the geothermal water to the liquid working fluid. Because the
working fluid boils at a low temperature, it vaporises readily with less geothermal heat, and
this vaporisation produces enough pressure to drive a turbine. What makes a binary system
unique is that it operates a two closed-loops (hence, binary); neither the geothermal water
nor the working fluid are exposed to the surface environment. All the water that is brought
to surface has to be re-injected, and after vaporising, the working fluid is cooled to its liquid
state, so it may repeat the process. There are no-emissions in the binary geothermal cycle.

                                              5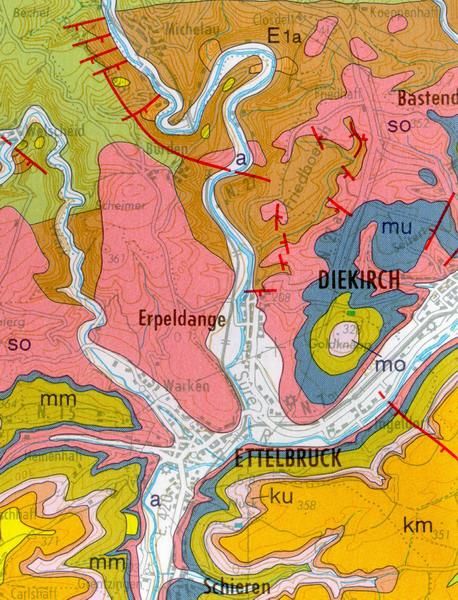
Beyond Hydrothermal: Enhanced Geothermal Systems – EGS
Geothermal energy has the potential to make a more significant contribution to the
European electricity mix through the development of advanced technologies, especially the
development of hot rock resources using EGS techniques that would enable thermal energy
recovery from outside of traditionally favourable regions. An EGS is an underground
reservoir that has been created or improved artificially.

The EGS concept is going to greatly increase geothermal potential as it allows for the
production of geothermal electricity nearly anywhere in Europe with medium and low
temperature.

This concept involves:
•      Using the natural fracture systems in basement rocks
•      Enlarging permeability through stimulation
•      Installing a multi-well system
•      Through pumping and lifting, forcing the water to migrate through the fracture
       system of enhanced permeability ("reservoir") and use the heat for power
       production.

Main benefits of geothermal electricity
A base load and flexible renewable energy source (no intermittency)…
Geothermal energy has many obvious qualities. A remarkable one is that it is not dependent
on climate conditions as wind or solar energy may be. As a result, base load can be
provided. This makes geothermal one of the most reliable amongst all renewable energies,
as plants are able to operate up to 95 per cent of the time. Such a load factor makes some
geothermal plants already competitive with fossil fuel and nuclear power plants. But
geothermal electricity is also flexible as it can be ramped up or down on demand, thereby
contributing to the stability of the grid.

Ensuring price stability and increasing security of supply…
Developing and utilising geothermal resources for electricity can help to protect against
volatile and rising electricity from fossil fuels. As a renewable and domestic resource,
geothermal enables a diversification of the electricity mix. Making use of this local source of
energy reduces the amount of fuel that countries have to import and thereby increases their
security of supply.

Providing Clean Electricity…
All human activity has an impact on nature, but compared to other energy sources,
Geothermal has a negligible environmental footprint (see GEOLEC report “Environmental
study on geothermal power”). Indeed, Geothermal power systems emit only a small amount
of greenhouse gases; if one takes CO2 as a benchmark, then geothermal closed-loop-binary

                                             6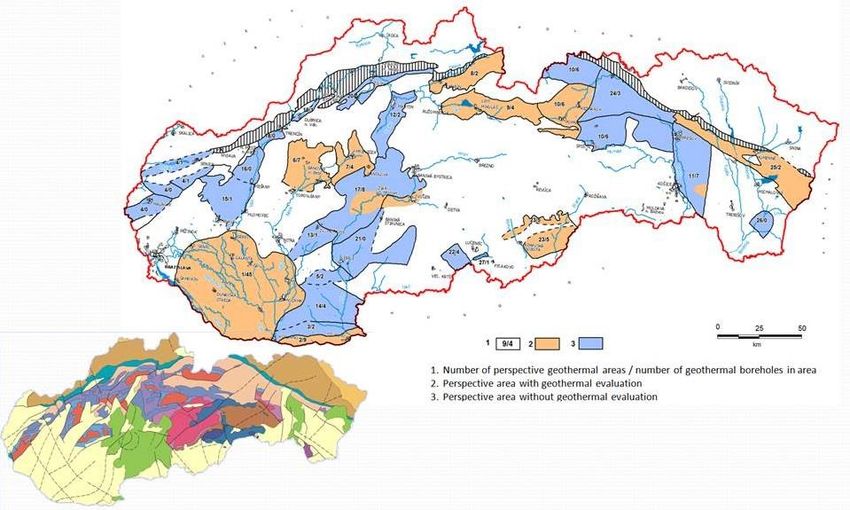
plants emit 0 CO2. Furthermore, Geothermal power plants produce only a small amount of
air emissions compared to conventional fossil fuels, and unlike other renewable energies
such as solar or biomass, have very small land-use footprint.

Or Combined Heat and Power…
In a combined process the geothermal resources can be used to generate electricity and
heat. Producing heat and electricity means optimising the efficiency factor of the energy
production and upgrading cash flows.

… And Supporting Local and Sustainable Economic Development
Using geothermal resources can provide economic opportunities for countries in the form of
taxes, royalties, technology export and jobs. Because of specific geological conditions, these
jobs require a thorough knowledge of the local conditions and cannot be exported.
Therefore, investments in geothermal power can boost local economies and improve urban
environment conditions alike.

Tackling the first barrier: Lack of awareness and data
Geothermal energy can be a key source in helping EU Member States to achieve their 2020
targets for renewable energy as well as their long-term decarbonisation objectives.
According to the trajectories set out in the National Renewable Energy Action Plans
(NREAPs) of the EU Member States, the capacity will grow from 0.9 GWe installed in 2013 to
1.4 GWe in 2020. The production of geothermal electricity in 2020 is planned to increase
from the current 6 TWh to 11 TWh. However, the actual potential is much larger.

Whilst some Member States acknowledge the possibility of developing geothermal power in
their NREAPs, many others simply did not carry out any studies to assess the geothermal
potential. Indeed, information is not always available, for example where there was no
previous exploration campaign for oil, gas, etc. Where information for locating and
estimating the geothermal resource does exist, it is scattered about in different ministries,
universities, national institutes, oil & gas companies and various private entities. This has
resulted in very conservative targets for geothermal power.

With this study the GEOELEC project aims to take the first step in filling the existing gap and
providing an input for the national energy strategies of European countries, with a focus on
the 2020, 2030, and 2050 horizons. The resource assessment is the product of the
integration and interpretation of existing data provided by most of the EU-28 countries
(data was not available for Cyprus, Finland, and Malta) plus Iceland, Switzerland and Turkey,
and a newly defined methodology building on Canadian, Australian, and American
methodology.

                                             7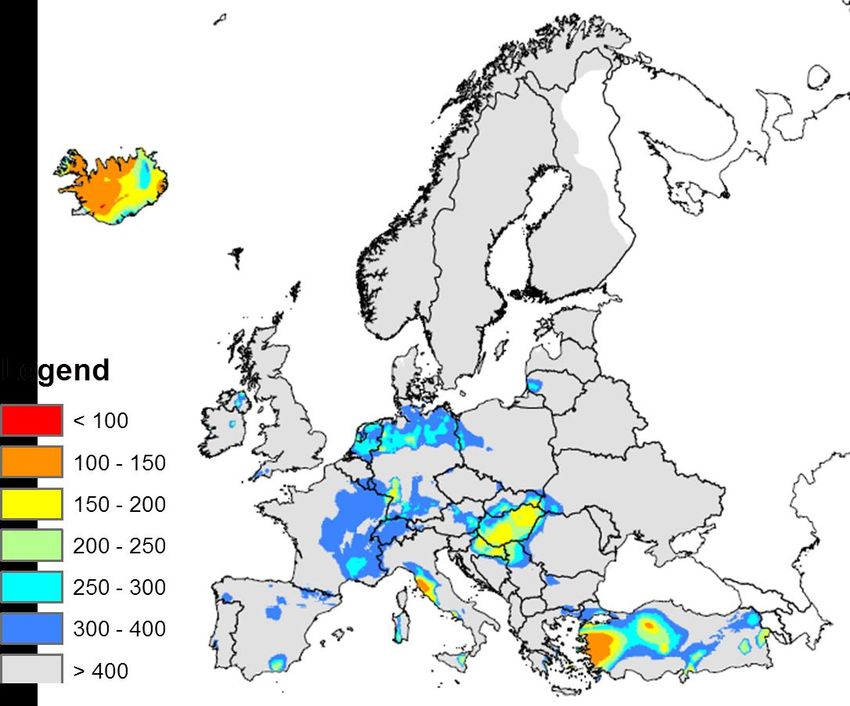
Structure of this report
The first part of this report is dedicated to providing the reader with a quick overview of
basic definitions and best practises for resource assessment (Chapter 1), and to present the
methodology and assumptions used for the resource assessment in GEOELEC (Chapter 2).

The second part of the report presents the results of the GEOELEC resource assessment,
both at an EU and national level. For each country covered, this report provides some
background information on the geological conditions and on the market development.
Looking at the 2020 horizon, it compares potential with national targets for 2020 as set out
in the National Renewable Energy Action Plans (NREAPs). Where significant differences or
gaps in terms of regulatory framework emerge, recommendations for the amendment of
the NREAPs are put forward.

Each country outlook also analyses the longer-term economic potential, i.e. in 2030-2050
for the deployment of geothermal electricity and compare such a potential with the
projected demand in each country. This can feed the current debate on the long-term
energy strategies ongoing in many countries in Europe.

Finally, this Prospective Study puts forward a set of recommendations for policy-makers on
how to establish favourable conditions so as to concretely realise the geothermal potential.

Sources and methodology
Data and information in this report stem from different sources. To begin with the supply
side, current information on geological conditions and market development are mainly
extrapolated from the Country Update Reports submitted for the European Geothermal
Congress 2013 and EUROSTAT. In addition, figures for the calculation of the economic
potential for geothermal power in 2030-2050 are calculated according to the methodology
laid down in Chapter 2 and entirely reported in Annexes, I, II, and III. Finally, national targets
for geothermal electricity are taken from the NREAPs submitted to the European
Commission1.

As far as the total projected electricity production in 2050, the cumulative figures for the
EU-27 are taken from the Current Policy Initiatives Scenario of the Energy Roadmap 2050.
Regarding the projected electricity production per each EU-27 country, we have broken
down at national level the average trend observed at EU level between 2010 and 2030 and
between 2030 and 2050. It should be noted here that the projected electricity demand is
not available for non-EU countries (Iceland, Switzerland, and Turkey) and for Croatia, which

1
    Available online: http://ec.europa.eu/energy/renewables/action_plan_en.htm .

                                               8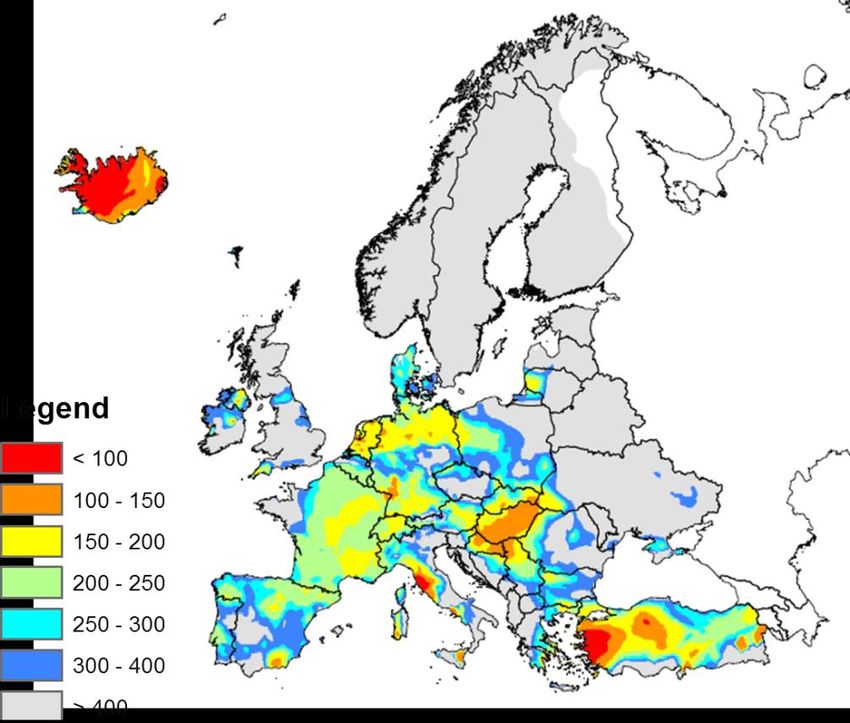
was not yet a member of the EU in December 2011 (date of publication of the Energy
Roadmap 2050).

                                       9
1. Resource Assessment: Definitions and Best practises
This chapter gives a definition for resource assessment and is a basis for a pan-European
map showing the resources which could be developed in 2020, 2030, and 2050. The
GEOELEC resource assessment protocol is based on resource assessment concepts
developed in the oil and gas industry, which have been adopted in an adjusted form for
geothermal resource assessment and reporting. This protocol has been based on the
following work:
Beardsmore et al., 2010. A protocol for estimating and mapping the global EGS
potential.
AGEA, 2010. Australian code for reporting of exploration results, geothermal
resources and geothermal reserves: the geothermal reporting code
CanGEA, 2010. The Canadian geothermal code for public reporting
These documents describe a protocol to classify and estimate geothermal reserves and
resources. Further, input from resource classification approaches developed in the oil and
gas industry (Etherington et al., 2007) were used.
1.1 Basic definitions
McKelvey (Figure 1) and project approach: Key to resource assessment and classification is
the concept of the McKelvey diagram, and a project oriented approach in which resources
develop progressively from being inferred at an early exploration stage towards becoming
discovered after drilling and finally economically recoverable at the production stage. In the
exploration the transition from an inferred (undiscovered) to a discovered resource is
determined by drilling the reservoir, which is can prove the presence of the resource and to
appraise the productivity.
Plays, leads and prospects (Figure 2): In the geothermal exploration workflow prior to
drilling, the identification of a prospective reservoir location starts off with a so-called play
concept. A geothermal play is a geographically (and in depth) delimited area where specific
subsurface conditions allow the obtaining of a sufficiently high flow rate of a sufficiently high
temperature, with suitable pressure and chemical conditions. A lead is a particular
subsurface reservoir which has been identified by surface exploration studies (e.g. MT). A
prospect is a location which has been studied thoroughly by surface exploration and has
been earmarked to be drilled.
10Conversion efficiency and power (Figure 3)
( )
Tx = production temperature [C]
Ts = average surface temperature [C]
= relative efficiency compared to carnot efficiency [-]
( ) ( ) (in MW)
Q = flow rate [m3/s]
Tr = re-injection temperature [C]
= fluid density [kg/m3]
= fluid specific heat [J/kg/K]
The first equation is based on Tester et al. (2006) and Di Pippo (2008). Their analysis shows
that for a large variety of conversion designs covering a spectrum from using produced
steam directly to drive turbines (flash) as well as binary systems, that = 0.6 (Figure 4).
For binary systems Tr is about 8°C above average surface temperature (Beardsmore et al.,
2010).
Figure 1: McKelvey diagram representing geothermal resource and reserve terminology in the context of geologic
assurance and economic viability (from Williams et al., 2008)
11hot sedimentary aquifer Magmatic play hot rock play
Figure 2: Example of different play types for geothermal systems (modified from Hot Rock ltd). Hot sedimentary aquifers
and magmatic plays can be mostly developed without enhancing the reservoir, relying on natural aquifer and fracture
permeability. Magmatic plays can generally produce very high temperatures at shallow depth. Low permeable rock
plays are located in regions of elevated temperatures (caused by radiogenic heat production, elevated tectonic heat
flow, or vertical heat advection trough deep fault zones).
Natural flow
magmatic & HSA
power
Hot rock
20
Depth [ km ]
EGS
S 20 Supercritica;
EG
2050
EG S
Temperature [°C]
Figure 3: Relative positioning in depth and temperature gradients of the different play types, and positioning of EGS
development (hot rock/EGS correspond to low permeable rock. HSA to hot sedimentary aquifers (which can also be
located deeper up to 4km).
12Figure 4: Practically achieved conversion efficiencies of various geothermal production installations (left), including both
binary and flash systems (right) (after Tester et al., 2006). The best fit curve fitting eq.1 for Ts =10C is achieved with η_c
=0.6.
1.2 The hydrocarbon best practice
Resource classification in the hydrocarbon industry is very mature and serves as an excellent
starting point for geothermal classification and reporting. The publication of Etherington
and Ritter (2007; Figure 5) forms the latest extension of the Petroleum resource
management system accepted by oil and gas industry. Here we summarise the main aspects
of the classification scheme which can be useful for geothermal energy. It should be
emphasised that geothermal resources in geothermal systems differ from both minerals and
petroleum resources as they are renewable through recharge, albeit usually at a slower rate
than that at which energy is extracted. The rate of this recharge can vary significantly from
system to system, and can be stimulated to a varying degree by production.
Prospective Resources are those quantities estimated to be commercially recoverable from
yet unexplored accumulations assuming a discovery is confirmed. While there is always a
grey area, a discovery is declared in the oil and gas industry when results of one or more
exploratory wells support existence of a significant quantity of potentially moveable
hydrocarbons. Geothermal resources are also confirmed through drilling. Discovered
quantities should be initially classified as Contingent Resources. The portion of these
quantities that can be recovered by a defined commercial project may then be reclassified as
13Reserves. Commerciality requires that the project form part of an economic venture and an
organization claiming commerciality has a firm intention to develop and produce these
quantities. Firm intention implies that there is high confidence that any current constraining
contingencies will be overcome and that development will be initiated within a reasonable
time frame. A reasonable time frame for the initiation of development depends on the
specific circumstances and varies according to the scope of the project. In oil and gas
industry five years is recommended as a benchmark, however in geothermal development
and especially EGS a longer time frame may be applied.
Figure 5: uncertainty ranges for resource and reserves estimates, and commerciality axis of projects moving them up
from prospective resources to contingent resources to reserves (from Etherington and Ritter, 2007). 1,2,3 relates to
levels of uncertainty representing low, mid, and high estimates respectively.
14REFERENCES
AGEA-AGEG, 2010. Australian Code for Reporting of Exploration Results, Geothermal
Resources and Geothermal Reserves, The Geothermal Reporting Code, Second
Edition, 28 p.
BIBLIOGRAPHY
Beardsmore, G.R., Rybach, L., Blackwell, D., and Baron, C., 2010. A protocol for
estimating and mapping the global EGS potential, July 2010 edition, p. 11
Etherington, J.R., and Ritter, J.E., 2007. The 2007 SPE/AAPG/WPC/SPEE Reserves and
Resources Classification, Definitions, and Guidelines: Defining the Standard!, 2007
SPE Hydrocarbon Economics and Evaluation Symposium, Dallas, Texas, USA, 1-3 April
2007. SPE 107693, p. 9.
152. Resource assessment methodology in GEOELEC
In this chapter guidelines for estimating theoretical and technical potential (TP) for
enhanced low permeability high enthalpy systems are defined in detail for different stages
in the workflow (play, lead, prospect, contingent resources, and reserves) and for different
play types. Resource assessment in GEOELEC is focused on prospective resources. Reporting
can be subdivided in three levels (Figure 6):
Level 1: Global European prospective resource assessment for producing electricity
Level 2: Prospective undiscovered resource assessment for different play types
Level 3: Contingent (discovered) resources and reserves
1. Global European prospective European wide assessment (cf. Beardsmore et al., 2010).
resource assessment for Determine TP for different depth ranges for EGS, key input are
producing electricity base maps of temperature, and rock type to identify theoretical
potential. Filter maps with information on natural reserve areas etc.
Assume relatively low ultimate recovery in agreement with whole
depth column (cf. IPCC, 2011). distinguish relative attractiveness,
low, mid, high estimates according to drilling depth required to
reach temperature
2. Prospective undiscovered Identify delimited areas with a particular play type (e.g. Hot
resource assessment for Sedimentary Aquifer (HSA), magmatic and low permeability).
different play types Include data relevant to exploration of particular play types and
exploration outcomes (cf. AGEA-AGEC, 2010) for exploration data
relevant to resources assessment
3. Contingent (discovered) From industry and government reporting obtain information on
resources and reserves drilled prospects and producing reserves, play types, development
2
type
Figure 6: Representation of the various levels of resource categorisation progressing from global (level 1), to prospect
based (level 2), to drilling and production (level 3).
2
However, it can be problematic to gather and disclose publically confidential information from private industry. A
minimum period of non-public disclosure applies to the most recent or on-going geothermal projects. For each of these
projects authorisation from several private organisations (owner, contractor, sub-contractor) will have to be requested. A
regulatory framework on that matter will have to be developed, for instance by the International Geothermal Association,
similar to what may already be in force in mining and hydrocarbon explorations.
16In depth the resource assessment is limited to 5 or 6.5 km for present developments, but
may increase in the future. The development of two timelines is therefore proposed, one
based on 7 km for 2020 and 2030, one based on 10 km for 2050.
A global Level 1 was conducted by GEOELEC assessment. The information gathering for the
assessment was accomplished through data workshops and a data request sheet. It was
concluded that insufficient data was available for a level 2 or 3 assessment, none was
conducted. The level 1 resource assessment has been performed on a regular 3D hexahedral
grid with a horizontal resolution of 20 km and a vertical resolution of 250 m. The areas
covered by this voxet cover the EU-28 countries including various other countries in Eastern
Europe. The area is delineated in Figure below showing the temperature model.
For each sub volume theoretical to practical potential is calculated, schematically illustrated
in Figure 7 of the schematic workflow going from theoretical potential to realistic TP. These
calculations are performed for each sub volume of the grid. The calculations are detailed
below.
Heat in place (HIP): The heat in place is calculated as the heat energy available in the
subsurface. The calculation for a subvolume V:
( )
where
V=volume [m3] of the subsurface subvolume
ρrock = Density = 2500 kg m-3
Crock = Specific heat = 1000 J kg-1 K-1
Tx = temperature at depth in the subvolume
Ts = temperature at surface
The map of HIP [PJ/km2] is calculated as the vertical sum of the vertically stacked sub-
volumes divided over the surface area of the grid cells in km2.
Theoretical capacity (TC): the theoretical capacity [TC] is in agreement with the heat energy
in place multiplied by an (electricity) conversion factor which depends on the application:
TC=H *ƞ
Where
( ) ( )
17The HIP (HIP) also takes into account the fact that not all energy can be utilised. A return
temperature (Tr) is used, which equals the previously mentioned cut-off production
temperature for the application. For electricity production, following Beardsmore et.al.
(2010):
To obtain a Theoretical potential map the values in the 3D-grid are vertically summed.
For heat production Tr is significantly lower than for electricity production
Technical potential:
Technical potential (TP) denotes the expected recoverable geothermal energy [MW] (e.g.
Williams et al., 2008). The TP assumes that the resource will be developed in a period of
thirty years. The conversion from Theoretical capacity to Technical potential is therefore:
TP [MW/km2] = 1.057* TC[PJ/km2] * R.
Where R is the recovery factor which is underlain by various steps, depending also on the
delineation of the volume for the TC. For a global assessment, such as that performed for
chapter 4 on geothermal energy of the IPCC (2011) and Beardsmore et al. (2010), TP
considers HIP of all the sediments and crust beyond a threshold depth in agreement with a
cut-off temperature for electricity production systems. In Beardsmore et al., 2010, the
ultimate recovery (R) corresponds to:
R=Rav Rf RTD,
and includes available land areas, limited technical ultimate recovery from the reservoir
based on recovery of heat from a fracture network (Rf) and limitation of operations as an
effect of temperature drawdown (RTD). Globally this can result in a recovery of about 1% of
the theoretical capacity (IPPC, 2011). The recovery factor of EGS as demonstrated by
Beardsmore et al. (2010) does not delineate the reservoir in depth beyond the threshold
temperature. For a volumetric delineation which is based on particular play levels, leads,
and prospects (e.g. an aquifer), the recovery factor is generally much higher in the order of
10-50%, whereas the underlying TC involves a significantly lower amount of rock volume.
We propose to use three different levels of TP:
TPtheory: this is the maximum possible (theoretical) technical potential (R=1.00)
TPreal: realistic underground Technical Potential according to typical predictive
reservoir engineering approaches and empirical practice. This is the equivalent of
Rf*RTD in Beardsmore et al., 2012. According to Beardsmore Rf is on average 0.14. RTD
is estimated at 90%, resulting in R=0.125. For geothermal aquifers in the Netherlands
R is estimated to be 33%
18 TPbm: Technical Potential according to Beardsmore et al., 2010 (R=0.01)
Economic technical potential: The economic potential (TPLCoE_p) is calculated from the
TPreal, accepting only those subvolumes where the levelized cost of energy (LCoE) is less
than a given threshold. The LCoE depend on the application (power, power and co-heat).
The economics input the expected flow rate takes as. In TPLCoE_p, p denotes the
cumulative probability (0..100%) of exceeding the flow rate and temperatures used. The
economic evaluation considers the achievable flow-rate as major technical uncertainty
Figure 7: Schematic workflow to go from theoretical potential to realistic technical potential.
For the maps the sub volume results are vertically summed, and subsequently divided over
the area of the grid cell in km2. The following maps have been calculated
Table 1: Type of potential maps in the information system
Map Name Unit
2
HIP Heat in place PJ/km
2
TC Theoretical capacity PJ/km
2
TPtheory Theoretical Technical Potential (R=1) MW/km
2
TPbm Technical Potential according to MW/km
Beardsmore et al., 2010 (R=0.01)
2
TPreal Technical Potential (R=0.125) MW/km
2
TPLCoE_c Realistic Technical Potential (LCoETable 2: Additional maps based on the 3D grid calculations
Map Name Unit
LCoE Minimum LCoE in a vertical stack of the 3D EUR/MWh
grid
LCoEDEPTH Depth of the Minimum LCoE in a vertical km
stack of the 3D grid
For the country outlooks it is assumed that 25% of the economic (realistic technical)
potential in MWe can be installed on a country basis, due to restrictions in land use. For the
conversion from installed capacity to TWh a load factor of 90% is adopted.
LCoE analysis and sensitivities
For the economic analysis of the LCoE a cash flow calculation is performed. A dominant cost
item in the analysis is the cost of drilling and stimulation. For the costs of drilling we assume
three different scenarios for the 2020, 2030 and 2050 timelines, based on an exponential
and linear well cost model. More detailed information on well, stimulation and plant costs
and performance aspects is given in Chapter 3.3.
Figure 8: Well costs (for EGS 2 wells have been assumed) and sensitivities of predicted LCoE to input parameters for the
2030 scenario at a potential EGS location at 5 km depth with forecasted resource temperature of 200°C.
Uncertainty and CHP
Within the 2030 scenario we considered the effect of uncertainty in flow rate and the
effects of combined heat and power (CHP) on the resource base.
For uncertainty in flow rate we assumed a deviation of +-30% of the default flow rate and its
effects. For CHP it has been assumed that heat sales are 9 EUR/GJ and account for the
thermal power which can be generated from Tr to a reinjection temperature of 35°C. CHP
can result in a reduction of the LCoE of about 50 EUR/MWh, whereas increase in flow rates
(50l/s – 70 l/s – 100 l/s) can decrease LCoE typically by 10-50 EUR/MWh.
20Temperature maps
The potential calculations take as input a newly constructed model of subsurface
temperatures up to 10 km depth. The methodology for constructing these temperatures has
been described in Limberger and Van Wees (2013). The adopted model in GEOELEC
corresponds to their model C.
Figure 9: Modelled temperature at 1,2,3,4,5,7, 10km depth
To give a best representation of the prospects for geothermal electricity, it is essential to
choose the proper scenarios. Adjusting the scenarios severely alter the outcome of the
prospects. The most influential parameter for an economical prospect is the chosen cut-off
value, e.g. feed-in tariff, price of electricity - including premiums. With a very high cut-off
value, eventually all targets can be developed economically.
To get a best representation, the following scenarios are chosen. For the years 2020, 2030
and 2050 the cut-off value decreases. In other words, the feed-in tariffs decrease. For the
near future (2020) we assume a cut-off of 200 EUR/MWh, which corresponds to 0.2
EUR/kWh. Ten years further in the future, we assume feed-in tariffs or premiums are less
necessary in comparison to 2020. Here a cut-off of 150 EUR/MWh is chosen. Towards 2050
this decreases further down to 100 EUR/MWh.
These chosen cut-off values only represent the economic boundaries for the prospects. But
also on the technical side of the scenarios developments are defined which favour the
prospects. The assumptions are shown in the Table below. The maximum depth range
increases, due to assumed improved drilling techniques, from 7 kilometres depth to 10
kilometres depth in 2050. Also the flow rates increase due to better stimulation techniques
21from 50 L/s to 100 L/s in 2050. As the effect of stimulation increases in flow rate, the costs
for stimulation of a project remain the same: EUR 10 Mio. To reach the maximum drilling
depths, improvements in drilling techniques lead to a different, more beneficial well cost
model. Where the well cost model increases exponential with depth in 2020, it is assumed
to be less depth dependent in 2050, resulting in a more linear relation. The efficiency in
both the system and in conversion increases. The coefficient of performance increases from
30 in 2020 to 50 in 2030 and 1000 in 2050. The relative Carnot efficiency3 increases from
60% in the near future to 70% in 2050. In addition the use of heat to convert to electricity is
more efficient and the CHP outlet remains equal.
Table 3: Assumptions for the prospective study (COP = Coefficient of Performance | CHP = Combined Heat and Power)
Parameter Unit 2020 2030 2050
Maximum Depth km 7 7 10
Flow Rate L/s 50 70 100
COP - 30 50 1000
Well Cost Model - Wellcost Scaling 1.5 + Wellcost Scaling 1.5 Linear 1500 EUR/m
Exponential
Stimulation Costs EUR 10 10 10
Mio.
Relative Carnot Efficiency - 0.6 0.6 0.7
Tinc for Tr ⁰C 80 80 50
(Tr=Tsurface + Tinc)
CHP outlet ⁰C 35 35 35
The cut-off values, e.g. feed-in tariffs, may change per country and be adapted to national
circumstances and according to the maturity of the technology and/or the market.
Therefore more than one cut-off value is represented. Also Table 3.4 displaying a range of
cut-off values, stacking the gained potential with increasing cut-off values:
Table 4: Overview of cut-off values for the defined scenarios
SCENARIO Cut-off range Steps
2020 Less than 100 EUR/MWh to a maximum of 300 100 – 150 – 200 – 300
EUR/MWh
2030 & 2050 Less than 50 EUR/MWh to a maximum of 200 50 – 100 – 150 – 200
EUR/MWh
The cut-offs apply for power-only, and do not include CHP. Finally the economic geothermal
potential for electricity production is presented as maps of the LCoE and at which these cut-
off values can be reached. See below an overview of all available maps and scenarios:
3
A theoretical thermodynamic cycle proposed by Nicolas Léonard Sadi Carnot in 1823. It can be shown that it
is the most efficient cycle for converting a given amount of thermal energy into work. A relative carnot
efficiency is a percentage compared to the carnot efficiency with around 150 °C
22Table 5: Overview of available maps in the report (for all maps produced in this project, go to
www.thermogis.nl/geoelec (TP = Technical Potential)
Scenario 2020 2030 2050
Maps LCoE LCoE LCoE
LCoEDEPTH LCoEDEPTH LCoEDEPTH
TP for cut-off lower than TP for cut-off lower than TP for cut-off lower than
300 EUR/MWh 200 EUR/MWh 150 EUR/MWh
TP for cut-off lower than TP for cut-off lower than TP for cut-off lower than
200 EUR/MWh 100 EUR/MWh 100 EUR/MWh
TP for cut-off lower than TP for cut-off lower than TP for cut-off lower than
100 EUR/MWh 50 EUR/MWh 50 EUR/MWh
REFERENCES
AGEA-AGEG, 2008. Australian Code for Reporting of Exploration Results, Geothermal
Resources and Geothermal Reserves, The Geothermal Reporting Code, 2008 Edition,
26 p.
AGEA-AGEG, 2010. Australian Code for Reporting of Exploration Results, Geothermal
Resources and Geothermal Reserves, The Geothermal Reporting Code, Second
Edition, 28 p.
CanGEA, 2010. The Canadian Geothermal Code for Public Reporting, Reporting of
Exploration Results, Geothermal Resources and Geothermal Reserves, 2010 Edition,
32 p.
IPCC, 2011. IPCC Special Report on Renewable Energy Sources and Climate Change
Mitigation – Geothermal Energy, Intergovernmental Panel on Climate Change (IPCC),
Working Group III – Mitigation of Climate Change, 50 p.
BIBLIOGRAPHY
Beardsmore, G.R., Rybach, L., Blackwell, D., and Baron, C., 2010. A protocol for
estimating and mapping the global EGS potential, July 2010 edition, 11 p.
Cloetingh, S., v. Wees, J.D., Ziegler, P.A., Lenkey, L., Beekman, F., Tesauro, M.,
Förster, A., Norden, B., Kaban, M., Hardebol, N., Bonté, D., Genter, A., Guillou-
Frottier, L. Voorde, M.T., Sokoutis,, D. Willingshofer, E., Cornu, T., and Worum, G.,
2010. Lithosphere tectonics and thermo-mechanical properties: An integrated
modelling approach for Enhanced Geothermal Systems exploration in Europe. Earth-
Science Reviews, vol. 102, p. 159-206.
Davies, J.H. and Davies, D.R., 2010. Earth’s surface heat flux. Solid Earth, 1, 5–24.
23 Etherington, J.R., and Ritter, J.E., 2007. The 2007 SPE/AAPG/WPC/SPEE Reserves and
Resources Classification, Definitions, and Guidelines: Defining the Standard!, 2007
SPE Hydrocarbon Economics and Evaluation Symposium, Dallas, Texas, USA, 1-3 April
2007. SPE 107693, 9 p.
Hurtig, E., Cermak, V., Haenel, R., and Zui, V.(eds.), 1992. Geothermal Atlas of
Europe, International Association for Seismology and Physics of the Earth's Interior,
International Heat Flow Commission, Central Institute for Physics of the Earth, Scale
1:2,500,000.
Williams, C.F., Reed, M.J., and Mariner, R.H., 2008. A Review of Methods Applied by
the U.S. Geological Survey in the Assesment of Identified Geothermal Resources, U.S.
Department of the Interior, U.S. Geological Survey, Open-File Report 2008-1296,
p.27
Williams, A.F., Lawless, J.V., Ward, M.A., Holgate, F.L., and Larking, A., 2010. A code
for geothermal resources and reserves reporting, Proceedings World Geothermal
Congress 2010, Bali, Indonesia, 25-29 April 2010, 7 p.
World Petroleum Council. Petroleum Resources Managment System, SPE-AAPG-
WPC-SPEE, p.47
243. Overview of Geothermal electricity potential in Europe
At this point the scenarios are described and the maps of Europe presented. The question
which logically may arise is what that means per country. In this and in the following
sections we present the outlook per country. The table below shows the potential per
country in TWh for the 2020, 2030 and 2050 scenarios. This is the economic potential based
on the above mentioned assumptions and no application of co-heat (for the effects of the
application of co-heat, see next chapter). For the chosen scenarios we assume an LCoE of
less than 200 EUR/MWh for 2020, of less than 150 EUR/MWh for the 2030 scenario of less
than 100 EUR/MWh and for 2050.
As the current and projected financial support may differ per country, below the economic
geothermal potential is presented in stacked potential of all assessed cut-off values. The
ranges are shown in Table 3.6. A very low cut-off value results in a minimal economic
potential, whereas very high cut-off values make more geothermal resources within
economic reach.
In the previous chapter you can find a sensitivity diagram showing the effects of different
variables on the LCoE. The majority of the parameters have both a positive and negative
effect; e.g. the required temperature can be both lower and higher. A higher required
temperature means a well at greater depths, hence higher drilling costs resulting in a higher
LCoE. Two elements can indisputably lower the LCoE: when no stimulation is needed or
when co-heat is applied.
The application of co-heat involves a cascading system of first electricity generation using
the high temperature geothermal source, followed by the use of lower temperature residual
heat for the use of direct heat (spatial heating, greenhouses, etc.).
The sensitivity diagram shows in a best case scenario a lowering of the LCoE by EUR 50. In
the diagram the LCoE drops from 160 EUR/MWh to approximately 110 EUR/MWh. This
same principal can be applied to the country outlooks and the maps. Assuming a co-heat
scenario may increase the potential in each country from the < 150 EUR/MWh scenario to a
< 100 EUR/MWh scenario.
25Table 6: Economic Potential per country (2020 = LCOE < 200 EUR/MWh; 2030 = LCOE < 150 EUR/MWh; 2050 = LCOE <
100 EUR/MWh)
Country Economic Potential (in TWh)
2020 2030 2050
AUSTRIA 0 0 67
BELGIUM 0 0 22
BULGARIA 0 0 72
CROATIA 1 3 50
CZECH REPUBLIC 0 0 31
DENMARK 0 0 29
ESTONIA 0 0 2
FRANCE 0 0 653
GERMANY 0 1 346
GREECE 0 0 81
HUNGARY 9 17 174
ICELAND 73 74 322
IRELAND 0 0 27
ITALY 11 12 226
LATVIA 0 0 3
LITHUANIA 0 0 19
LUXEMBOURG 0 0 3
POLAND 0 0 144
PORTUGAL 0 0 63
ROMANIA 0 0 105
SLOVAKIA 0 1 55
SLOVENIA 0 0 8
SPAIN 0 1 349
SWEDEN 0 0 1
SWITZERLAND 0 0 43
THE NETHERLANDS 0 0 52
TURKEY 50 62 966
UNITED KINGDOM 0 0 42
GEOTHERMAL POTENTIAL IN EUROPE:
The production of geothermal electricity in the EU in 2013 is 6 TWh
The NREAPs forecast a production in the EU-28 of ca. 11 TWh in 2020
The total European geothermal electricity potential in 2030 is 174 TWh
The economic potential grows to more than 4000 TWh in 2050
26The resource assessment exercise produced maps of the geographical distribution and
extent of the potential, which are shown in the next pages. For a full overview of all
produced maps, go to www.thermogis.nl/geoelec.
The maps are sorted by scenario (2020 to 2050) and first display the distribution of the
LCoE, followed by the corresponding minimum depths at which the LCoE can be obtained
and concluded with the maps of the TP for a certain LCoE. The used cut-off values are in line
with the values mentions in Table 3.6 and mentioned in the caption.
Figure 10: Minimum LCoE in 2020 (in EUR/MWh)
27Figure 11: Minimum LCoE in 2030 (in EUR/MWh)
Figure 12: Minimum LCoE in 2050 (in EUR/MWh)
28Country Outlook
29Austria
Background
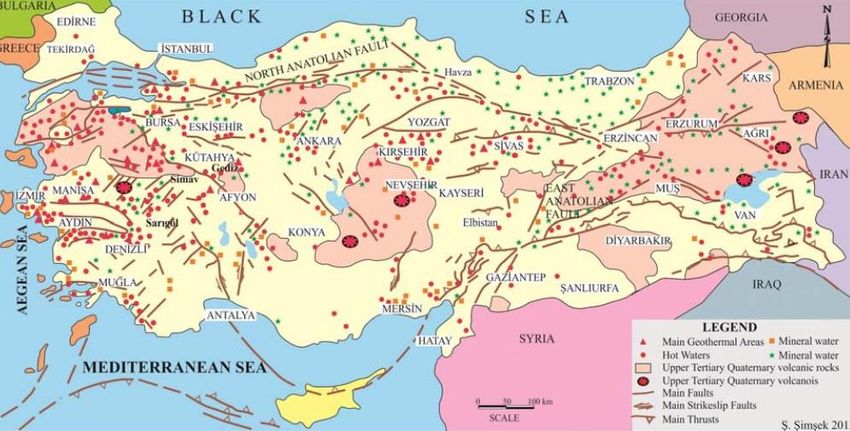
Austria exhibits varying thermal conditions which are influenced by the Alpine Orogeny and
by the neighbouring Pannonian Basin. Elevated geothermal conditions are found in the
Eastern part of Austria, particularly in the south-eastern Styrian Basin, exhibiting heat flaw
density values of more than 100 mW/m². These favourable conditions are related to a
significant geothermal anomaly at the Pannonian Basin due to lowered lithospheric
thickness.
Figure 13: Average Surface Heat Flow Density ~ 70 mW/m², Range: 45 to 130 mW/m². Source: Geological Survey of
Austria, 2007 in Goldbrunner, J. and Goetzl, G.
Recently executed joint modelling and interpretation of HFD data from Austria, Hungary,
Slovakia and Slovenia within the Interreg IV project Transenergy showed, that the highest
HFD values are located at the margin areas of the Western Pannonian Basin. The
geothermal conditions at the Austrian parts of the Molasse Basin can be described as
average to slightly elevated (70 - 80 mW/m²). Regions of enhanced terrestrial heatflow
densities are associated to regional hydrothermal flow systems predominately located at
basement reservoirs (Malmian limestones and Dogger sandstones). These local to regional
30scale anomalies can be found both in the western part of Austrian Molasse (Upper Austrian
Molasse Basin) and the eastern margin of the Molasse Basin close to the transition zone to
the Vienna Basin (Lower Austria). The geothermal conditions at the intra-mountainous
regions of the Eastern Alps are quite heterogenic and not entirely investigated yet due to
the lack of deep drillings.
Market Development
Austria already has three geothermal cogeneration (combined heat and power) plants.
However, the Austrian NREAP does not propose any target or dedicated measures to
increase the share of geothermal electricity by 2020. A feed-in tariff of EUR 0.07 is in place,
but is lower than for other technologies and does not appear to be adequate to trigger any
investment.
Economic Potential
Gross Geothermal Geothermal Geothermal Share of Geothermal
Geothermal Electricity Economic Economic geothermal Economic
Electricity Target in Potential Potential in gross Potential –
Generation the NREAP (TWh) (TWh) electricity Installed
(TWh) (TWh) production Capacity
(MWe)
2010 2020 2030 2050
0.002 0.002 0.1 67.1 69% 8 511
Assuming cost reduction and the full development of the EGS technology, the GEOELEC
resource assessment shows that promoting the technology today can allow geothermal to
be fully competitive in 2030. In 2050 geothermal power has the potential to provide plenty
of clean, reliable and affordable electricity and cover up to 69% of the total electricity
consumption projected in Austria (i.e. 67 TWh).
REFERENCES
Goldbrunner, J. and Goetzl, G.: Geothermal Energy Use, Country Update for Austria,
Proceedings of the European Geothermal Congress 2013, Pisa, Italy,(2013), CUR-02,
1-7.
European Geothermal Energy Council, EGEC Market Report 2012, Brussels, 2012.
31Belgium
Background
The Geology of Belgium is dominated by partially metamorphosed, clastic to carbonate
formations of Palaeozoic age related to the Caledonian Brabant Massif which are covered by
clastic and carbonate rocks of Devonian to Triassic age. Dinantian anhydrite rocks in the
Hainaut Basin (South of the country), Triassic sandstone and Dinantian limestone in the
Campine and Liege Basin (North-Eastern and Eastern Belgium) contain aquifers which
represent the highest potential for the exploitation of hydro-geothermal resources
(European Commission, 1999).
VITO and the Geological Survey of Belgium recently completed surveys on deep geothermal
resources assessment and new investigation campaigns (2D seismics, thermometry studies
and 3D modelling) have been performed to assess the Belgian deep geothermal reservoirs
(Hoes, H. and Petitclerc, E. and Declercq, P. Y. and Laenen, B., 2013).
Figure 14: Map of publicly available data at the Geological Survey of Belgium (GSB). Source: GSB.
32Market Development
There is no geothermal power plant in Belgium. However, the recent investigations on deep
geothermal potential have resulted in two projects currently under development in Balmatt
(Flanders) and in the Mons basin (Wallonia).
Economic Potential
Gross Geothermal Geothermal Geothermal Share of Geothermal
Geothermal Electricity Economic Economic geothermal Economic
Electricity Target in Potential Potential in gross Potential –
Generation the NREAP (TWh) (TWh) electricity Installed
(TWh) (TWh) production Capacity
(MWe)
2010 2020 2030 2050
0 0.002 0 22.28 17% 2 826
The GEOELEC resource assessment, based on currently available data, clearly shows that
geothermal electricity can potentially be developed at a competitive cost in Belgium. In
2050 nearly 3 GW can be installed in the country to provide some 22 TWh of electricity per
year produced at ≤ 100 EUR/MWh. Geothermal power could cover up to 17% of projected
electricity demand.
REFERENCES
European Commission: Blue Book on Geothermal Resources, Luxembourg: Office for
Official Publication of the European Communities, Luxembourg, 1999
Hoes, H. and Petitclerc, E. and Declercq, P. Y. and Laenen, B.: Geothermal Energy
Use, Country Update for Belgium, Proceedings of the European Geothermal Congress
2013, Pisa, Italy,(2013), CUR-04, 1-7.
33Bulgaria
Background
In Bulgaria today thermal waters with temperatures of up to 98°C have direct application,
e.g. for heating of buildings and greenhouses, balneology, etc. Higher temperatures of
about 150° C are expected to be found in the deeper seated sedimentary water bearing
layers of Devonian and Triassic age in the Moesian plate, particularly in the Velingrad and
Sapareva Banya geothermal fields (Bojadgieva, K. and Benderev, A. and Berova A. and
Apostolova, I., 2013).
Figure 15: Map of hydrothermal deposit of Bulgaria. Source: Bojadgieva, K. and Hristov, H. and Hristov, V. and
Benderev, A. and Toshev, V., 2005).
34Market Development
No electricity is produced from geothermal resources in Bulgaria. This is due to a lack of
data from drilling activities and to the relatively low temperature of geothermal waters
discovered.
Bulgaria did not propose any target for geothermal electricity in its NREAP; although a feed-
in tariff exists, this is not applicable in practice. Indeed the climate for developing
geothermal and other renewable energy sources is not favourable. In 2012 the State Energy
and Water Regulatory Commission implemented retroactive measures for producers of
electricity from renewable sources, which will significantly hamper any further
development. The grid connection of projects with preliminary contracts was postponed
until 2016, while a moratorium on new projects was adopted.
Economic Potential
Gross Geothermal Geothermal Geothermal Share of Geothermal
Geothermal Electricity Economic Economic geothermal Economic
Electricity Target in Potential Potential in gross Potential –
Generation the NREAP (TWh) (TWh) electricity Installed
(TWh) (TWh) production Capacity
(MWe)
2010 2020 2030 2050
0 0 0.1 71.66 112% 9 089
Although there is no geothermal power plant in operation or under investigation so far,
Bulgaria has a huge potential for EGS. This opportunity however has never been studied in
depth. According to the GEOELEC Resource Assessment, by 2030 it will be possible to
produce electricity from geothermal resources at 100 EUR/MWh or less. Subsequently
geothermal power could be widely developed. The geothermal economic potential for
electricity generation, i.e. at ≤ 100 EUR/MWh, amounts to 71.7 TWh in 2050, which would
even exceed the projected electricity demand in the country.
REFERENCES
Bojadgieva, K. and Benderev, A. and Berova A. and Apostolova, I.: Country Update
for Bulgaria 2007-2012, Proceedings of the European Geothermal Congress 2013,
Pisa, Italy,(2013), CUR-06, 1-8.
35Croatia
Background
In Croatia there are two regions with a geothermal energy potential. The Southern area (the
Dinarides) has lower geothermal energy potential. The Northern part, belonging to the
Pannonian sedimentary basin, has an average geothermal gradient of 0.049°C/m. In this
area several geothermal reservoirs, discovered during hydrocarbon exploration, have
already been extensively tested (European Commission, 1999).
Figure 16: Map of geothermal potential of Croatia. Source: ENER- SUPPLY project
Market Development
There are no existing geothermal power plants in Croatia, however, two projects are
currently under development in the counties of Podravina and Bjelovar-Bilogora. At the time
of writing, the Croatian Government has not yet submitted its NREAP to the European
Commission. Therefore, it is not possible to evaluate the Croatian plans to promote
36You can also read