20 ENERGY IN NEW ZEALAND - MBIE
←
→
Page content transcription
If your browser does not render page correctly, please read the page content below
MARKETS – EVIDENCE AND INSIGHTS BRANCH

ENERGY IN
NEW ZEALAND

20
2019 CALENDAR YEAR EDITION

Comprehensive information on and analysis of
New Zealand’s energy supply, demand and prices
Energy in New Zealand 2020 provides annual information on and analysis of New Zealand’s
energy sector and is part of the suite of publications produced by the Markets team of the
Ministry of Business, Innovation & Employment (MBIE).

The 2020 edition includes information up to the end of the calendar year 2019.

Full data tables may be downloaded from the Energy in New Zealand webpage:

www.mbie.govt.nz/building-and-energy/energy-and-natural-resources/energy-statistics-
and-modelling/energy-publications-and-technical-papers/energy-in-new-zealand/

Prepared by:                                                  Important                                     Acknowledgements
Markets                                                       Use of this publication in paper or           The authors are grateful to the
                                                              electronic form implies acceptance of the     individuals, companies and organisations
Evidence and Insights
                                                              conditions of its release, which are that     that provided information and gave
Ministry of Business, Innovation                              if the information is made available to       generously their time to assist with the
& Employment                                                  others, its source must be acknowledged       work reported here.
PO Box 1473, Wellington 6140                                  as the Ministry of Business, Innovation &
                                                                                                            Authorship
                                                              Employment 2018 or by reference to the
New Zealand
                                                              publication title and date.                   This publication was prepared by
Email: energyinfo@mbie.govt.nz                                                                              the Markets team within the Evidence
                                                              Although every atempt has been made
                                                                                                            and Insight Branch of the Ministry of
                                                              to ensure the information is accurate,
                                                                                                            Business, Innovation and Employment.
                                                              neither the Crown nor any Minister,
                                                                                                            The authors would like to thank
                                                              employee or agent of the Crown:
                                                                                                            New Zealand Petroleum and Minerals
                                                              ›   warrants the accuracy, completeness       and the MBIE Design team for their
This work is licenced under a                                     or usefulness for any particular          contribution to this report.
Creative Commons Atribution 4.0                                   purpose of the information contained
International Licence.                                            in this publication in paper or           Availability
                                                                  electronic form; or                       A free electronic version of this
                                                              ›   accepts any liability for any loss or     publication can be downloaded from:
                                                                  damage, however caused, from the          www.mbie.govt.nz/info-services/sectors-
                                                                  reliance on or use of that information,   industries/energy/energy-
                                                                  or arising from the absence of            data-modelling/publications/
                                                                  information or any particular
                                                                  information in this publication in
                                                                  paper or electronic form.

ISSN 2324-5913 (web)
August, 2020

© Crown Copyright 2020
The material contained in this report is subject to Crown
copyright protection unless otherwise indicated. The
Crown copyright protected material may be reproduced
free of charge in any format or media without requiring
specific permission. This is subject to the material being
reproduced accurately and not being used in a
derogatory manner or in a misleading context. Where
the material is being published or issued to others, the
source and copyright status should be acknowledged.
The permission to reproduce Crown copyright protected
material does not extend to any material in this report
that is identified as being the copyright of a third party.
Authorisation to reproduce such material should be
obtained from the copyright holders.
Contents

   A.                                                                 B.
   Energy                                                             Energy
   Overview                                                           Balances
   PAGE 1                                                             PAGE 7

   C.                                                                 D.
   Electricity                                                        Renewables
   PAGE 12                                                            PAGE 28

   E.                                                                 F.
   Oil and                                                            Coal
   Gas
   PAGE 37                                                            PAGE 56

   G.                                                                 H.
   Transport                                                          Methodological
                                                                      Improvements
   PAGE 62                                                            PAGE 67

*All statistics are year-ending annual measures. “Dec-on-Dec” refers to absolute changes between annual values.
MINISTRY OF BUSINESS, INNOVATION AND EMPLOYMENT ENERGY IN NEW ZEALAND 2020
Quick facts for 2019
Light EV ownership up by
˜°.˝˙
of our primary
energy supply
˜°˛
came from
renewable
sources
Hydro electricity generation was Total solar generation in was
THE THIRD HIGHEST enough to power every household in
New Zealand for nearly
IN THE
LAST TEN
YEARS
˜ DAYS
New Zealand New Zealand’s share
produced enough of renewable electricity
generation was
75%
energy to meet
THE THIRD
HIGHEST
IN THE
of its energy OECD
requirements
Transport Climate Change Response
accounts
(Zero Carbon) Amendment Act
for around
institutionalises a target of
˜°˛
of national
net-zero carbon emissions
by
energy
demandA. ENERGY OVERVIEW The 2019 calendar year was between two major events that had signifcant impact on the energy sector – the Pohokura gas feld outages in 2018, and the coronavirus (COVID-19) pandemic in 2020. Despite being sandwiched between two signifcant years, 2019 was flled with noteworthy movements towards a sustainable energy sector. The Climate Change Response (Zero Carbon) Amendment Act came into force, and established an independent Climate Change Commission. The share of renewable energy sources came off last year’s peak, but is still the second highest in the series. Renewable electricity generation decreased while the total energy supply increased in 2019. International energy prices play a key role in New Zealand’s energy system. Fluctuations in commodity prices and international geopolitics led to a rise in crude oil prices and domestic transport fuel prices. As at the time of writing, disruptions to demand due to COVID-19 have signifcantly impacted parts of the energy sector. However, the sector has been resilient. This publication will largely cover the 2019 calendar year. For more information on the impact of COVID-19 on the energy sector please refer to the Energy Factsheet published on the Ministry’s website.
MINISTRY OF BUSINESS, INNOVATION AND EMPLOYMENT                                           ENERGY IN NEW ZEALAND 2020

2
    Renewable shares down due to poor hydro conditions
    Most of the country had a dry year in 2019, with a central Pacifc El Niño event lasting from January to
    July. This led to low infows and a three per cent drop in hydro generation from 2018. However, 2019
    reached the third highest hydro generation record in the last ten years.
    Wind power was used to make up for the low hydro generation, however it was not enough to ofset
    the drop in hydro. At times of low renewables sourced generation, non-renewable sources are used
    to meet the shortfall between supply and demand. As gas and coal are normally used to meet this
    shortfall, electricity generation from gas increase 2.6 per cent, while electricity generation from coal
    increased by 43 per cent.
    The combination of low hydro generation and high coal-fred generation led to a lower share of
    renewables in total electricity generation. The renewables decreased from 84 per cent in 2018 to 82.4
    per cent in 2019. The share of renewables in total primary energy1 was 39.5 per cent in 2019.
    While wholesale electricity prices decreased from a high in 2018, the combination of low renewable
    generation and some additional gas production outages saw prices remain high compared to 2017.

    Volatile international commodity prices fowed through to
    New Zealand markets
    Geopolitical tensions were high in 2019, with events such as the drone atacks on oil facilities in
    Saudi Arabia. This led to volatile international crude oil prices. Increased crude oil prices fowed
    through to New Zealand markets, with retail petrol ending the year 10 per cent higher and diesel
    4 per cent higher than at the same time a year earlier. However, prices in 2019 were still lower
    compared to the peak reached in October 2018.
    Global prices for South African and Australian thermal coal fell by 27 per cent from 2018, and hard
    coking coal prices followed a downward trend too. However, strong demand from the Asia Pacifc
    region led to an increase in coal exports.

    A green future for transportation
    The transportation sector currently accounts for 39 per cent of all energy demand, and 20 per cent of
    all greenhouse gas emissions. 2019 saw several announcements regarding using renewable energy
    for transportation. The interim Climate Change Commission released the Accelerated Electrifcation2
    report which recommends that the government prioritises the electrifcation of transport and
    process heat3 over decarbonising the electricity generation sector.4
    There were signifcant advances in the hydrogen powered transportation sector. The frst hydrogen
    powered SUV was launched in New Zealand, and two companies announced their intention to jointly
    develop New Zealand's frst nationwide hydrogen refuelling station network. Electric vehicle uptake
    is still growing strongly, with over 7,000 new registrations in 2019.

    Gas supply and consumption mostly back to normal
    In 2018, bubbling was found during a regular inspection of ofshore pipelines from the Pohokura
    gas feld. This led to an immediate halt to production at the feld while maintenance was carried out.
    Afer a year of outages, 2019 saw gas production return to near normal levels as Pohokura returned
    to operation. Pohokura, one of the country’s largest oil and gas felds, increased production by 28
    per cent from the year before. However production did not return all the way to 2017 levels. Gas
    consumption on the other hand, increased by 14 per cent following Pohokura reopening.
    Methanex, one of the country’s largest gas users, increased their production by 16 per cent in 2019 afer a
    year of gas supply constraints and maintenance at their sites.5 Despite shuting down one of their plants
    for maintenance in 2019, Methanex drove a six per cent increase in national industrial sector demand.

    1 Total primary energy supply is the amount of energy available for use in New Zealand, accounting for imports
    and exports.
    2 Source: Interim Climate Change Committee (2019), Accelerated Electrifcation
    3 Process heat is heat energy used for industrial processes, manufacturing and space heating, often in the form
    of steam, hot water or hot gases.
    4 For more information, see pop-out box C.2 for modelling done on accelerated electrifcation.
    5 www.methanex.com/sites/default/fles/investor/annual-reports/2019%20Methanex%20Annual%20Report.pdf
MINISTRY OF BUSINESS, INNOVATION AND EMPLOYMENT ENERGY IN NEW ZEALAND 2020
3
National average energy intensity continues to improve
Energy intensity provides an indication of the relationship between energy use and economic
growth. It is calculated as energy use divided by gross domestic product (GDP), and tells us the
amount of energy required to produce each dollar of GDP. A fall in the indicator, where less energy is
required to produce each dollar of GDP, is viewed as an improvement.
National energy intensity has improved by an average of 1.4 per cent per annum since 1990. This has
been driven by continued economic growth in the Commercial sector, which being service-based is
relatively less energy intensive than other parts of the economy.
In 2017, the latest year for which data is available, New Zealand’s energy intensity was the 6th
highest in the OECD, and 18 per cent higher than the OECD average.
Figure A.1 Energy intensity
Figure: National average energy intensity expressed as an index (based to 1990)
120
100
80
Index (1990 = 100)
60
40
20
0
1990 1995 2000 2005 2010 2015
Three-quarters of the country’s energy requirements were met with
domestic production
Self-sufciency is a measure of a country’s ability to meet its own energy supply requirements, and
is calculated as domestic production divided by total primary energy supply. A self-sufciency value
of 100 per cent indicates that a country produces all the energy it needs, whereas values above or
below 100 per cent indicates it is a net exporter or importer of energy, respectively.
New Zealand meets all of its energy needs for gas, renewables, and waste heat through indigenous
production. For other energy types, New Zealand engages in trade through exporting and importing.
This means that changes in New Zealand’s self-sufciency indicator are driven by changes in the
balance between imports and exports of tradable commodities.
› While crude oil is produced in New Zealand, nearly all of this is exported as it is not suited to
current refning capabilities and can achieve a higher price on international markets. This means
all domestic use of oil needs to be met by imports.
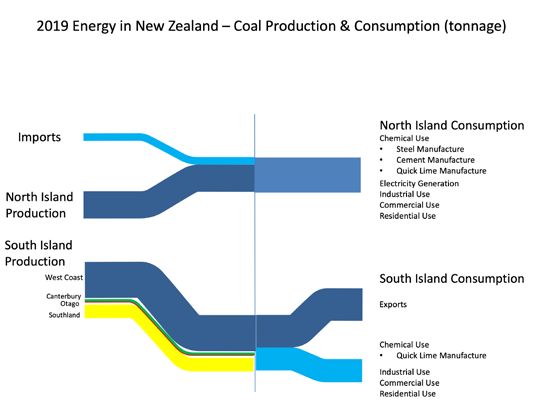
› Coal produced on the West Coast is mainly exported, with approximately half of national coal
production exported annually. Some large users in New Zealand choose to import coal for
numerous reasons, including the quality of the coal they require for their processes and for cost
competitiveness.MINISTRY OF BUSINESS, INNOVATION AND EMPLOYMENT ENERGY IN NEW ZEALAND 2020
4 Overall, New Zealand’s energy self-sufciency in 2019 was unchanged at 75 per cent as changes
in the self-sufciency for oil and coal ofset each other. Oil self-sufciency fell due to a continued
reduction in domestic production, and an increase in imports. Lower domestic production driven by
ongoing natural feld decline meant that there was less oil available to be exported. The country’s
only oil refnery at Marsden Point underwent a maintenance shutdown in 2018 for an extended
period. As 2019 saw the refnery back to full production, refnery output was up 1.67 million barrels
on 2018 levels. With increased activity at the refnery, imports of refned oil products decreased. This
contributed to a 3 per cent decrease in diesel imports, and an 11 per cent decrease in petrol imports.
In 2018, the latest year for which data is available, New Zealand’s energy self-sufciency was the
ninth highest in the OECD, and six per cent lower than the OECD average.
Coal self-sufciency decreased in 2019 in response to favourable export conditions and to meet
higher domestic demand.
Figure A.2 New Zealand's Self-suffciency
250%
200%
150%
100%
50%
0%
1990 1995 2000 2005 2010 2015
Coal Oil TotalMINISTRY OF BUSINESS, INNOVATION AND EMPLOYMENT ENERGY IN NEW ZEALAND 2020
5
Box A.1 COVID-19 Impact
In February 2020, COVID-19 arrived on our shores. While this publication only covers the
2019 calendar year, COVID-19 has heavily impacted the energy sector. As part of MBIE’s COVID
response, a bi-weekly publication was launched. The Energy factsheet6 uses a range of real
time data to present a current state picture on electricity demand, oil stocks, retail fuel and
gas use and production.
Box A.1 Figure 1 COVID electricity demand
Daily electricity demand for New Zealand
16 March - 8 June 2020
125 Level four Level three Level two
100
Daily demand (GWh)
75
50
25
0
23 Mar 06 Apr 20 Apr 04 May 18 May 01 Jun
Grey line shows historical demand based on 2015-2019 data
Blue line shows seven-day average
Data source: Electricity Authority
New Zealand’s electricity demand was at 89 per cent of historical levels (an average of
demand on each day across 2015-2019) when the country entered alert level four. At the time
of writing this publication, electricity demand has recovered to pre-lockdown levels.
Box A.1 Figure 2 Oil imports
Weekly oil imports
Data to 26 April 2020
250
200
Weekly imports (kt)
150
100
50
0
Jan Feb Mar Apr
Green line shows four-week rolling mean
Data source: MBIE oil statistics
6 Available at www.mbie.govt.nz/business-and-employment/economic-development/sector-reports-
series/#energyMINISTRY OF BUSINESS, INNOVATION AND EMPLOYMENT ENERGY IN NEW ZEALAND 2020
6
While New Zealand continued to maintain oil stocks to ensure that the country has at least
ninety days of net oil imports available, there was a decline in oil imports in April 2020. This
was due to reduced demand for oil products during alert levels three and four.
Box A.1 Figure 3 Aggregate gas
Aggregate gas production and use
Data to 8 June 2020
Level Level Level
500 four three two Gas
production
400
Gross terajoules
300
Industrial
use
200
Energy
transformation
100
0
09 Mar 23 Mar 06 Apr 20 Apr 04 May 18 May 01 Jun 15 Jun
Faint line shows historical activity based on 2017-2019 data
Production data based on the Gas Industry Company's interpretation of available data
Data source: MBIE calculations from First Gas data
Similar to the movements in oil and electricity demand, gas production and use both dropped
as the country moved into alert level four. It should be noted that the historical average
(an average of demand on each day across 2015-2019) includes 2018, which saw reductions
in production and use for both planned and unplanned reasons. For more information, please
visit MBIE’s website.B. Energy balances New Zealand’s energy production derives from both renewable and non-renewable sources. The energy balance tables refect how energy supply and demand by sector varies by energy fuel type. Domestic energy supply is derived from either indigenous production or imported from overseas sources. In turn, fuel types can be transformed into different forms of energy, at the cost of losses and ineffciencies which vary by transformation process. Supply, demand, losses and ineffciencies are refected in balanced energy supply and demand tables. Both the energy supply and demand dimensions of the energy balance tables are derived from surveys spanning different sources. An imbalance exists between the value of consumer energy calculated from supply, and the value of consumer energy observed from statistical measure.
MINISTRY OF BUSINESS, INNOVATION AND EMPLOYMENT                                   ENERGY IN NEW ZEALAND 2020

8   Table B.1: Default Electrical Transformation Factors

     Fuel                                       Default Effciency

     Biogas                                     30%

     Coal                                       30%

     Gas (Single cycle)b                        30%

     Geothermalc                                15%

     Hydro                                      100%

     Oil                                        30%

     Waste heat                                 15%

     Wind                                       100%

     Wood                                       25%

    Interpretation of Energy Balance Tables
    Supply
    Total primary energy is the amount of energy available for use in New Zealand. Much of it is
    converted into other forms of energy before it is used. By convention, fuel used for international
    transport is excluded from total primary energy. Indigenous gas production does not include gas that
    is fared, reinjected, or LPG extracted. The primary energy fgures presented are actual data, except
    for some that go into electricity generation as detailed under energy transformation.

    Energy transformation
    Includes generation of electricity (including cogeneration), oil production (including refnery
    operations and the manufacture of synthetic fuel from natural gas – New Zealand Synthetic Fuels
    Corporation Limited ceased methanol to petrol production in April 1999) and other transformation,
    primarily steel production.
    In the Energy Transformation section of the balance tables, “energy in” is shown as negative values
    and “energy out” as positive values in the appropriate fuel columns. Transformation of energy
    from one form to another always results in conversion losses, particularly in thermal electricity
    generation, as much energy is lost as heat.
    Transformation losses in electricity generation are derived from the net electricity generated, with
    the actual fuel input being used where available and the conversion factors shown in Table B.1 used
    otherwise. Fuel input to biogas, hydro, wind and waste heat are fully estimated. Quarterly fgures
    for electricity generation are made up of data from major generators and the Electricity Authority.
    Estimates are made where actual data are unavailable at the time of publishing.
    Liquid biofuel production (bioethanol and biodiesel) appears as renewable energy supply in the energy
    balance tables. As bioethanol and biodiesel are generally blended with motor petrol and diesel before
    consumption, liquid biofuel also appears in Energy Transformation under Fuel Production.
    Losses and own use in the energy balances include losses before and afer transformation, losses
    and own use in production, transmission and distribution losses, electricity industry own use free
    of charge, and oil industry losses and own use (which includes distribution tankage losses, stocks,
    accounts adjustment and own consumption). Transformation losses are excluded.
    Non-energy use is primary energy used for purposes other than combustion, e.g. bitumen used in
    road construction, and natural gas used as chemical feedstock in the production of methanol and
    ammonia/urea.
MINISTRY OF BUSINESS, INNOVATION AND EMPLOYMENT ENERGY IN NEW ZEALAND 2020 Treatment of Solar Photovoltaic Panels 9 Estimates of the amount of electricity generated using solar photovoltaics (PV) are included in the energy balance tables in this edition of Energy in New Zealand. The total primary energy supply of solar is the sum of the direct use of solar thermal (i.e. for hot water heating), and the amount of solar energy directly converted into electricity via PV panels. Solar PV electricity generation is estimated using data on the total installed capacity of grid-connected solar PV installations in New Zealand , and then converted to output using an assumed annual capacity factor of 14 per cent (i.e. the solar panels produce their full output 14 per cent of the time). The capacity factor is then scaled using solar-hour data from NIWA to introduce seasonal variation. Consumption of solar thermal is included in the demand section of the energy balance table under Renewables – Solar, whereas the consumption of electricity generated by solar PV panels appears under Electricity. Solar PV consumption by sector is apportioned using data from the Electricity Authority. Demand Consumer energy is the amount of energy consumed by fnal users. It excludes energy used or lost in the process of transforming energy into other forms and in bringing the energy to the fnal consumers. For example, natural gas is a primary energy source (see Total Primary Energy Supply), some of which is transformed into electricity, of which some is lost in transmission to consumers. Consumer energy statistics can be either calculated from supply-side data or observed from usage data. Consumer energy (calculated) forms the top half of the energy balance tables and is calculated as TPES less the sum of energy transformation and non-energy use. Consumer energy (observed) forms the botom half of the energy balance tables and it represents reported demand in the agriculture, forestry and fshing; industrial; commercial; transport and residential sectors. With the exception of domestic/national use of energy for on-road, rail, sea and air transport in the transport sector, these sectors follow the Australia New Zealand Standard Industrial Classifcation 2006 defnitions. Annual fgures presented for consumer energy (observed) are actual data except for thermal fuels used for cogeneration in the industrial and commercial sectors and biogas, wastes and wood. Estimates of on-site cogeneration demand are included in electricity end use. Where the energy end-use is not available or confdential, the “unallocated” category is used. International transport includes international sea and air transport. It excludes coastal shipping, national air transport and all land transport. Statistical diferences shows the diference between “consumer energy (calculated)” and “consumer energy (observed)”. This diference is shown at the botom of the energy balance tables.
MINISTRY OF BUSINESS, INNOVATION AND EMPLOYMENT ENERGY IN NEW ZEALAND 2020
10 Figure B.2 Energy balance table
Coal Oil
Converted into Petajoules using Gross
Crudes/
Calorific Values Bituminous & Av. Fuel/
Bituminous Sub-bitum. Lignite Total Feedstocks/ LPG Petrol Diesel Fuel Oil
Sub-bitum. Kero
NGL
S
Indigenous Production 39.19 35.61 74.80 5.19 79.99 50.93 8.07
+ Imports 3.40 23.55 26.95 0.00 26.95 236.17 1.08 42.13 57.55 0.98 9.30
- Exports 43.71 0.24 43.95 - 43.95 51.12 - - 1.28 8.47 -
- Stock Change - - (1.28) 0.03 (1.25) (11.22) 0.01 1.96 2.26 0.49 (0.02)
- International Transport - 1.90 11.94 56.41
of
TOTAL PRIMARY ENERGY (1.12) 58.92 59.08 5.17 64.24 247.20 9.14 40.17 52.10 (19.92) (47.08)
SUPPLY
ENERGY TRANSFORMATION (0.04) (35.46) (35.49) (0.26) (35.76) (249.48) (0.00) 69.85 88.18 26.70 61.58
Electricity Generation - (16.36) (16.36) - (16.36) (0.04) -
Cogeneration - (8.15) (8.15) (0.26) (8.41)
Fuel Production (249.48) 66.99 87.66 25.87 61.56
Other Transformation - (10.26) (10.26) - (10.26)
Losses and Own Use (0.04) (0.68) (0.72) - (0.72) - (0.00) 2.86 0.56 0.83 0.02
Non-energy Use
CONSUMER ENERGY (calculated) (1.16) 23.46 23.58 4.90 28.49 (2.28) 9.14 110.02 140.28 6.78 14.50
Agriculture, Forestry and Fishing 0.05 2.15 2.19 0.01 2.21 0.11 1.02 14.36 1.02 -
Agriculture 0.05 2.15 2.19 0.01 2.21 0.11 1.01 10.93 0.04 -
Forestry and Logging - - - - - 0.00 1.68 0.07 -
Fishing - - - - - 0.01 1.75 0.91 -
Industrial 3.96 15.15 19.11 4.72 23.83 3.68 0.07 17.25 1.08 -
Mining - - - - - 0.00 4.49 0.07 -
Food Processing 0.34 13.72 14.06 4.64 18.70 - 0.00 - -
Textiles 0.16 0.06 0.22 - 0.22
DEMAND
Wood, Pulp, Paper and Printing 0.05 0.46 0.51 0.00 0.51
Chemicals - 0.02 0.02 - 0.02
Non-metallic Minerals 3.40 0.80 4.20 0.08 4.28
Basic Metals - - - - - - 0.00 - -
Mechanical/Electrical Equipment - - - - -
Building and Construction - - - - - 0.01 7.38 - -
Unallocated 0.01 0.10 0.10 - 0.10 3.68 0.07 5.37 1.01 -
Commercial 0.10 0.55 0.65 0.23 0.88 1.75 0.74 5.72 0.47 -
Transport - - - - - 0.14 111.33 104.19 4.50 12.45
Residential 0.00 0.23 0.23 0.03 0.27 3.73 0.00 0.13 - -
o
CONSUMER ENERGY (observed) 4.11 18.07 22.18 4.99 27.18 - 9.41 113.17 141.64 7.08 12.45
Statistical Differences 1.40 (0.09) 1.31 (2.28) (0.27) (3.15) (1.37) (0.30) 2.05MINISTRY OF BUSINESS, INNOVATION AND EMPLOYMENT ENERGY IN NEW ZEALAND 2020
11
Natural Gas Renewables Electricity Waste Heat
TOTAL
Solid
Others Total Total Hydro Geothermal Solar Wind Liquid Biofuels Biogas Total Total Total
Biofuels
59.00 184.39 92.07 195.80 0.82 8.12 0.18 3.63 55.45 356.06 1.17 680.61
13.69 360.90 0.10 0.10 387.95
- 60.88 104.83
(0.60) (7.13) (0.70) (9.07)
- 70.25 70.25
14.29 295.90 185.09 92.07 195.80 0.82 8.12 0.18 3.63 55.55 356.16 1.17 902.55
5.67 2.50 (56.92) (92.07) (187.76) (0.45) (8.12) (0.18) (3.30) (4.23) (296.11) 145.53 (1.17) (241.91)
(0.04) (37.03) (92.07) (186.33) (0.45) (8.12) (2.48) (289.45) 152.84 (190.04)
(12.56) (1.42) (0.82) (4.23) (6.48) 8.02 (1.17) (20.60)
7.62 0.23 - (0.18) (0.18) 0.05
(10.26)
(1.95) 2.31 (7.33) (15.33) (21.06)
(18.73) (18.73) (50.79) (69.52)
1.23 279.67 77.38 8.04 0.36 - - 0.33 51.31 60.05 145.53 - 591.12
16.52 1.35 0.45 0.45 9.16 29.69
12.10 1.35 0.45 0.45 8.80 24.90
1.76 0.00 0.22 1.98
2.67 - 0.14 2.81
22.08 67.86 4.78 0.05 43.78 48.62 54.46 216.85
4.56 0.16 1.62 6.34
0.00 21.74 10.11 50.54
0.69 0.35 1.25
4.68 9.28 14.47
34.85 2.88 37.75
2.13 0.99 7.40
0.00 2.77 23.68 26.45
0.25 0.50 0.75
7.39 0.49 1.37 9.25
10.13 0.11 4.78 0.05 43.78 48.62 3.69 62.66
8.69 8.51 2.60 0.28 2.88 34.27 55.22
232.60 - - - 0.39 232.99
3.86 6.83 0.21 0.36 7.53 8.11 45.54 64.61
- 283.75 84.55 - 8.04 0.36 - 0.33 51.31 60.05 143.83 - 599.35
1.23 (4.08) (7.17) 0.00 - - - - - 1.70 - (8.24)C. Electricity Electricity demand and generation increased slightly in 2019. While electricity generation from wind increased, the total share of renewables in electricity generation fell to 82.4 per cent in 2019 from 84 per cent in 2018. It was primarily due to low rainfall in the North Island and as a result less hydro electricity generation than usual. To compensate for the lower hydro generation, coal and gas use for electricity generation increased. Generation from coal increased in particular, up 43 per cent from 2018 due to relatively tight gas supply. Electricity consumption in the agricultural sector increased by 11 per cent in 2019 over 2018. It was driven by higher demand for electricity in irrigation due to 2019 being a dry hydrological year compared to 2018. Wholesale prices remained elevated from historical averages over 2019, falling sharply in December as heavy rain in the South Island increased already high lake levels there.
MINISTRY OF BUSINESS, INNOVATION AND EMPLOYMENT                                                             ENERGY IN NEW ZEALAND 2020

                                                                                                                                           13
Generation matching growing demand
The annual electricity generation for 2019 increased slightly by 0.8 per cent over 2018. Although
there was not much change to the total generation, there was a signifcant change in the fuel mix
compared to the previous year. Figure C. 1 illustrates electricity generation by diferent fuel types.
The share of renewables came down to 82.4 per cent from 84 per cent in 2018. It sufered primarily
due to a decline in hydro generation. The frst half of the year saw hydro generation fall due to a dry
spell in the North Island. Annual rainfall in the Waikato catchment fell below the long term average
afecting hydro generation on the Waikato River. In March 2019, hydro storage in New Zealand hit the
1% Electricity Risk Curve.7 However, it was not as low as 2017 when New Zealand experienced much
drier conditions.

Figure C.1 Generation by type

                     160

                     140

                     120
  Gross petajoules

                     100

                     80

                     60

                     40

                     20

                      0
                      1990    1995                2000            2005                    2010                   2015

                                             Hydro   Gas   Geothermal    Coal      Wind      Other*
                                                                                *Other includes oil, waste heat, biogas, wood, and solar

Electricity generation from geothermal remained static. Generation from wind showed an upward
trend through most of the quarters in 2019 taking the annual growth to 9.1 per cent For the frst
time in a September quarter, generation exceeded 600 GWh. During the same period, the capacity
factor8 for wind also grew by about 9.0 per cent over 2018 when refurbishment work at the Te
Āpiti wind farm led to reduced capacity . Overall, it was a good year for wind power afer successive
drops in generation over the last two years. However, the increase in wind generation, among other
renewable sources, was not enough to ofset the 2.7 per cent drop in hydro generation, leading to a
1.6 per cent drop in renewable electricity generation as a share of total generation.
The growth in solar photovoltaic (PV) uptake for electricity generation has been steady. However,
the rate of growth in New Zealand is lower than it is globally. With 126 GWh of solar electricity
generation, 2019 saw an increase of 27 per cent over 2018. Last year saw two big announcements
on new solar power investments in New Zealand. Arataki Honey, one of New Zealand’s largest honey
producers, has invested $169,000 in a new solar system at its Havelock North processing facility.
Also, Refning NZ announced plans to build what would be the country’s largest solar farm at the
Marsden Point oil refnery near Whangārei. But, with the recent developments due to COVID-19,
uncertainty looms over the future of the solar farm. In April 2020, Refning NZ announced the
commencement of a strategic review of its operations at Marsden Point due to losses sufered
during the pandemic.

7 Risk Curves refect the risk of extended energy shortages. www.transpower.co.nz/system-operator/security-
supply/electricity-risk-curves
8 Capacity factor is the amount of electricity generated in relation to the maximum output capable of being
generated over a period of time assuming no fuel constraints and no downtime for maintenance.
MINISTRY OF BUSINESS, INNOVATION AND EMPLOYMENT ENERGY IN NEW ZEALAND 2020
14
Increased use of non-renewables
Electricity generation from gas was up 2.6 per cent from 2018. Since 2019 was considered a dry
hydrological year for hydro generation, an increase in gas use is expected. However, as a result of
planned and unplanned outages and maintenance shutdowns, gas use in electricity generation was
lower than it could have been. Chief among these shutdowns was the Pohokura feld maintenance
which began in the third quarter of 2018 and continued until the second quarter of 2019. This
was the main reason electricity generation from gas fell by 15 per cent in the March quarter 2019
compared with March 2018.
In contrast, electricity generation from coal increased by 43 per cent in 2019. This was due to the
need for non-renewable generation as a result of less favourable hydrological conditions, and gas
outages meaning that there was less gas available for electricity generation use. Figure C.2 shows
the upward trend of electricity generation by coal, gas and wind. With further maintenance outages
taking place at Pohokura and the inter-island High Voltage Direct Current (HVDC) link during the early
part of 2020, electricity generation is likely to be afected again.
Figure C.2 Generation by wind, coal and gas
30
Gross petajoules
15
0
1990 1995 2000 2005 2010 2015
Gas Coal WindMINISTRY OF BUSINESS, INNOVATION AND EMPLOYMENT ENERGY IN NEW ZEALAND 2020
15
Steady demand
Consumption of electricity remained relatively static in 2019, with a slight increase of 0.6 per cent
over 2018 which was driven mainly by higher demand in the agricultural, industrial and transport
sectors. Demand in the commercial and residential sectors remained quite stable. Figure C.3
illustrates electricity consumption by sector.
Demand from the agricultural sector increased by 11 per cent over 2018. Dry conditions during 2019
compared to the previous year, when rainfall was around normal levels, led to increased demand for
electricity in irrigation. However, the demand in 2019 was about two per cent less than what it was in
2017 when the weather was drier.
Figure C.3 Consumption by sector
150
Gross petajoules
100
50
0
1990 1995 2000 2005 2010 2015
Agriculture, Forestry, and Fishing Commercial Industrial Residential
Industrial consumption increased by 1.5 per cent in 2019, driven by higher demand in the food
processing and basic metals industries. Demand in the food processing has been growing since 2013,
and expected to grow further with a move towards electrifcation of industrial processes. Synlait, a
dairy processing company, announced it had commissioned New Zealand’s largest electrode boiler in
2019. Another dairy processor, Fonterra, previously announced its intentions to switch to electricity,
and since July 2019 stopped installing new coal boilers.
New Zealand Aluminium Smelter (NZAS) is the single largest consumer of electricity in New Zealand.
It uses about 35 per cent of total industrial demand and 13 per cent of total electricity demand in
New Zealand (for 2019). Figure C.4 presents electricity demand by NZAS and other industrial sectors.
With the reopening of the fourth potline at Tiwai Point in December 2018, increased demand from
the smelter had increased national demand for electricity. However, in October 2019, Rio Tinto, which
owns about 80 per cent stake in the NZAS, announced a strategic review of its interest to determine
the viability of its ongoing operations. With the recent decision in 2020 to close the smelter due to
unproftability, electricity demand is likely to have a signifcant impact when the smelter closes.MINISTRY OF BUSINESS, INNOVATION AND EMPLOYMENT ENERGY IN NEW ZEALAND 2020
16 Figure C.4 Industrial demand
60
50
Gross petajoules
40
30
20
10
0
1995 2000 2005 2010 2015
Tiwai Point Food Processing Wood, Pulp, Paper, and Printing Other Industrial Use
Residential electricity use remained stable in 2019. Increasing uptake of energy efcient technologies
such as LED lighting and heat pumps is likely to bring down electricity demand in the future. Further,
the impact of minimum insulation requirement for rental homes that came into force on 1st of July
2019 is yet to become visible. However, factors that lower demand can be ofset by residential users
switching to electric appliances from wood or coal burners as well as by increasing uptake of electric
vehicles (EVs) having charging facilities at home.
Electricity demand in the transport sector has been showing an upward trend for the last fve years
driven by rail and electric vehicles. In 2019, it increased by 17 per cent over 2018. While EV registration
in 2019 grew by 59 per cent over 2018, demand for electricity in transport increased by 16.7 per cent
over the same period. In 2019, the uptake of new light EVs grew by 88 per cent. While on average the
number of new light EV registrations per month was about 200, during September alone it increased
to 608. In the coming years, use of electricity for transportation is expected to continue increasing
refecting growing popularity of new modes of transportation like electric bikes and scooters, and
plans to introduce electric ferry services and more electric buses for public transport.
New Zealand vs Other OECD countries - Renewable electricity and Security, Equity,
Sustainability
Renewable energy generation takes the centre stage in the discourse on climate change and
the transition to a low emissions economy. Increasing the share of electricity generation from
renewable sources and meeting energy end-uses with electricity are both in focus. According to the
International Energy Agency (IEA), the share of renewables in electricity generation globally reached
almost 27 per cent in 2019 and the renewable electricity generation capacity is expected to expand
by 50 per cent between 2019 and 2024, driven by solar PV.9 New Zealand too is making strides with
it being one of the leading nations, ranked third in the OECD, in using renewables for electricity
generation.
9 IEA (2019), Renewables 2019: Analysis and forecasts to 2024, IEA, ParisMINISTRY OF BUSINESS, INNOVATION AND EMPLOYMENT ENERGY IN NEW ZEALAND 2020
Figure C.5 Energy trilemma comparison 17
100
90
Switzerland
Energy trilemma score in 2019
Sweden Denmark
United Kingdom
France Finland Austria
80
Slovenia Germany
Luxembourg
United States Spain New Zealand Norway
Canada
Australia Italy Iceland
Portugal
Ireland Lithuania
Japan
70 Korea Greece Chile
Poland
Turkey
60
50
0% 10% 20% 30% 40% 50% 60% 70% 80% 90% 100%
Renewable share of electricity generation in 2018
The World Energy Council’s Energy Trilemma Index, which ranks countries based on their ability to
provide sustainable energy, ranks New Zealand at the tenth position. The ranking shows how well
a country has managed the trade-ofs of the trilemma of achieving energy security, energy equity
and environmental sustainability. During the past decade New Zealand’s energy equity index,
which measures accessibility and afordability of energy, has remained quite stable. While energy
security has experienced some fuctuations due to dependence on imported oil products and a minor
reduction in fossil fuel stocks, the sustainability index has seen a stable growth due to increasing
generation from renewables as well as New Zealand’s ability to manage emissions. Figure C.5 shows
ranking of New Zealand and selected OECD countries for their share of renewables in electricity
generation and Energy Trilemma score.
New developments in Electricity Generation
The 2019 calendar year saw numerous developments in new and existing electricity generation
capacity. There was a mix of announcements around the intention of companies as well as the
commencement of construction of some plants.
It is important to note that some renewable sources of electricity generation, such as wind and solar,
are intermitent. With new solar and wind capacity announced and underway, increasing penetration
of these generation types further highlights the need to manage the intermitency of renewable
resources as part of New Zealand’s electricity generation mix.MINISTRY OF BUSINESS, INNOVATION AND EMPLOYMENT ENERGY IN NEW ZEALAND 2020
18 Figure C.6 Electricity generation developments
Start of 2019
Wind
End of 2019
Start of 2019
Geothermal
End of 2019
Start of 2019
Gas
End of 2019
Start of 2019
Hydro
End of 2019
0 500 1000 1500 2000
Megawatts
Under construction Consent applied for Consented
This chart is based on information published by the Electricity Authority, supplemented with public
announcements by companies. The Ministry has atempted to ensure the information presented
is correct, however there may be instances where generation capacity and consent stage is
misreported.
The following summarises the developments by fuel type since the beginning of 2019 and up to
August, 2020. It is important to note that all of the developments listed below are subject to
change due to a range of factors that may either bring forward their implementation or put them on
hold. This includes changes in electricity demand (such as the closure of the Tiwai Point aluminium
smelter, or increased electrifcation), and the risk appetite of investors.
Wind
› Mercury has commited to the construction of a two stage 221 MW, $464 million wind farm at
Turitea near Palmerston North. The frst stage (expected to be operational in late 2020) will be 119
MW, while the second stage (expected to start construction in early 2021) will be 103 MW.
› The Waipipi Wind farm (formerly known as the Waverley Wind Farm) in South Taranaki is being
constructed at a cost of $277 million. The 133 MW wind farm is expected to be operational in the
frst quarter of 2021.
› Tilt Renewables is planning to repower the frst two stages of its Tararua wind farm in the coming
years. It is expected that this will increase the capacity from 68 MW to 140 MW.
› MainPower announced its $200 million, 93 MW Mt Cass project in Hurunui. This is expected to
be commissioned by late 2021, with fnancial close and take-of arrangements expected to be
fnalised around late 2020 to early 2021.MINISTRY OF BUSINESS, INNOVATION AND EMPLOYMENT ENERGY IN NEW ZEALAND 2020
Geothermal 19
› In May 2019, Contact Energy started a $30 million drilling programme of four appraisal wells at
their planned 250MW Tauhara site near Taupō. As at the time of writing, it was shovel-ready but
was put on hold due to Rio Tinto’s announcement in July 2020 about the future of the Tiwai Point
aluminium smelter. Construction would take over three years if given the go-ahead.
› In Northland, Top Energy is looking to expand its current 28 MW Ngāwhā geothermal power
station with two new 32 MW units. The expected investment is $175 million. Drilling of new
wells has been completed and commissioning of the frst 32 MW binary unit is expected to be
completed before the end of 2020. The additional 32 MW unit is expected to be ready by 2026.
Hydro
› The Upper Fraser project, an 8 MW power station was commissioned in September 2019 by
Pioneer Energy. It is located three kilometres upstream of the existing Fraser Dam and cost
between $15-20 million.
Coal and Gas
› Todd Generation began construction of its 100 MW peaking plant near Junction Road just south of
New Plymouth. Work on the plant began in early 2019.
Solar
› Arataki Honey invested $169,000 in a new solar system at its Havelock North processing facility.
› Refning NZ, the operator of the Marsden Point oil refnery, has put its plans for a 26.7 MW solar
array on hold
› Hawke’s Bay Airport and Centralines are planning a 10MW solar farm next to the runway. The
partners expect the initial stage of construction would be operational by the end of 2021.
› Genesis Energy announced in February 2020 that it was in advanced talks to construct a 300 MW
solar farm in North Waikato with a planned completion of 2023.MINISTRY OF BUSINESS, INNOVATION AND EMPLOYMENT ENERGY IN NEW ZEALAND 2020
20
Box C.1 Electricity wholesale spot prices
Electricity wholesale spot prices have been unusually high recently
The annual average wholesale electricity spot price reached a new high of $125 per MWh
in 2019 which is almost a 120% increase from a low of $58 per MWh in 2016. Low levels of
hydro storage and a lack of gas supply are possible explanations for the elevated wholesale
electricity spot prices in 2019.
Box C.1 Figure 1 Monthly wholesale price
300
250
200
Dollars per MWh
150
100
50
0
2010 2011 2012 2013 2014 2015 2016 2017 2018 2019 2020
How is the wholesale electricity spot price determined?
Generators make ofers to supply electricity at 52 grid injection points, and retailers and
major industrial users made bids for each half-hour trading period. If generators set their
ofer prices too low, they risk not making enough revenue to cover costs and make a return
on their investment. If they set their ofer prices too high, they risk losing potential sales to
competitors.
In New Zealand, the market operator ranks all the ofers from generators and sets the market
clearing price at the level needed to meet the demand. In other words, the clearing price (also
called the system marginal price) is set by the ofer price of the last producer needed to cover
all load.
In general, plants with the lowest variable operating costs are dispatched frst, subject to
availability, and plants with higher variable operating costs are dispatched next as electricity
demand increases Dispatching generation in this way minimizes the cost of electricity
production.
However, the exact order of dispatch is rather complex and there are many factors that may
lead it to deviate from this hypothetical outcome. For example, wind has very low operating
costs but the intermitent nature of wind afects their availability. Similarly, hydroelectric
generators have also very low operating costs. However hydroelectric dispatch patern can
be complex because hydroelectric generators with controllable storage may set their ofer
prices taking into account the opportunity cost of their stored water (whether to use water to
generate today or store water for use later when it may be more valuable). For these reasons,MINISTRY OF BUSINESS, INNOVATION AND EMPLOYMENT ENERGY IN NEW ZEALAND 2020
21
wholesale electricity spot prices are infuenced by each generator’s expectations about
future market conditions, including future demand, infows, planned generation outages and
planned transmission outages.
Marginal cost of electricity production
The following fgure summarises the price ofered by hydro generators for each trading
period in 2019 and 2016. The horizontal axis represents the cumulative electricity generation
ofered by hydro generators. There are 17,520 trading period each year.
Box C.1 Figure 2 Hydro generation offers
5000
4000
Offer price ($ per MW)
3000
2000
1000
0
20 40 60 80
Cumulative TW
2016 2019
In 2016, hydro generators supplied 60 per cent of total annual production but hydro
generators set the system marginal price 87 per cent of the time. Even during peak-demand
hours (7:00am to 9:00am and 5:00pm to 7:00pm), hydro generators set the marginal price
86 per cent of the time.
In 2019, hydro generators accounted for 58 per cent of total annual production. Hydro
generators set the marginal price 84 per cent and 83 per cent of all the trading periods and
peak-demand periods respectively. Overall, electricity generation mix by fuel source as a
percentage has not changed much from 2016 to 2019.
However, on average the marginal ofer price of hydro generators in 2019 is 120 per cent
higher than that in 2016. The data confrms that higher electricity wholesale spot prices in
2019 were mainly due to higher marginal ofer prices of hydro generators. Note that although
average wholesale electricity spot prices have been persistently elevated, retail electricity
price increases in 2019 remained subdued.MINISTRY OF BUSINESS, INNOVATION AND EMPLOYMENT ENERGY IN NEW ZEALAND 2020
22
Box C.2 Electricity Demand and Generation Scenarios
MBIE released updated Electricity Demand and Generation Scenarios (EDGS) in July 2019.10 The
purpose of the EDGS is to enable the Commerce Commission to assess Transpower’s planning
proposals for future capital investment in the electricity transmission grid.
In comparison with previous EDGSs, the range of projections in this report is large, refecting
uncertainty in technological progress, policy and economic growth. The highest demand scenario
shows total electricity demand is expected to grow 78 per cent over the projection period 2018 to
2050. In the lowest demand scenario, total electricity demand rises just over 18 per cent. Under
the Reference scenario which assumes a continuation of current trends, total electricity demand
grows on average at a rate of 1.1 per cent per year and increases 43 per cent by 2050.
Box C.2 Figure 1 Electricity demand projections
100
75
TWh
50
25
0
Reference Growth Global Environmental Disruptive
Scenarios
New Zealand is on the way toward a greener future
The Government has passed the Climate Change Response (Zero Carbon) Amendment Act and
set a target of net-zero carbon emissions by 2050 (except biogenic methane). Future demand
for electricity will depend heavily on the path of decarbonisation and the extent of changes in
electricity using technologies and supply technologies over the next 30 years.
Process heat is the energy used as heat mainly by industrial and commercial sectors for industrial
processes, manufacturing, and warming spaces. Process heat contributes about 8 per cent
of New Zealand’s total greenhouse gas emissions. Therefore, the ability of organisations to
switch to lower-emission fuel is crucial for New Zealand to meet the target of net-zero carbon
emissions. However, the ability and incentives for organisations to switch to electricity is
dependent on both the relative price of electricity and the future of process heat technology.
Getting a price signal right
Apart from the Environmental scenario, carbon prices are assumed to increase from NZD$25
per tonne of carbon dioxide in 2019 to NZD$66 per tonne by 2050 in all the scenarios. In the
Environmental scenario, carbon prices rise to NZD$154 (USD$100) per tonne by 2050. In all
10 Available at www.mbie.govt.nz/building-and-energy/energy-and-natural-resources/energy-statistics-and-
modelling/energy-modelling/electricity-demand-and-generation-scenarios/MINISTRY OF BUSINESS, INNOVATION AND EMPLOYMENT ENERGY IN NEW ZEALAND 2020
23
scenarios, we assume that some low grade heat will be electrifed. Much of this electrifcation
can be accomplished using heat pumps that have a relatively high coefcient of performance.
In the Environmental and Disruptive scenarios, we assume that additional measures are
introduced that further increase the level of electrifcation.
New Zealand is electrifying its vehicle feet
Another approach to reduce CO2 is to electrify our vehicle feet as nearly 20 per cent
of emissions in New Zealand come from road transport. The uptake of new transport
technologies such as EV and hydrogen fuel cell cars, and biofuels, will have important impact
on CO2 emissions as well as the future demand for electricity.
The Reference scenario assumes that EVs comprise 44 per cent of the light vehicle feet, and
13 per cent of the heavy vehicle feet by 2050. In the Disruptive scenario, EVs comprise 74 per
cent of the light vehicle feet, and 45 per cent of the heavy vehicle feet by 2050, refecting
the falling costs of both bateries and EVs. High uptake of EVs in the Environmental scenario
is driven by policy and regulations.
The share of renewable generation is projected to rise
An increase in electricity demand means we need to build more generation capacity on top
of replacing aging generation plants. The combination of continued declines in the cost of
solar and wind technology, and limited supply of gas, means that the majority of new build
generation is expected to be renewable.
The share of electricity generation from renewable sources is expected to rise from 84% in 2018
to over 90 per cent and 95 per cent by 2035 and 2050 respectively. Owing to the intermitent
nature of wind power, there is a limit to the share of wind in total generation without overbuilding
wind capacity or without other economic means to compensate for that intermitency.
Cleaner future is promised but with a cost
In the Reference scenario, 6,250 MW of electricity generation capacity is needed by 2050, with
55 per cent of the new build being wind generation. All of the gas new build capacity operates
as peaking plants, generating electricity when peak demand needs to be met. The capital
expenditure for all the new generation capacity is estimated to be around $13b in 2017 dollars. For
other scenarios, the new build generation capacity needed ranges between 3,800 MW and 10,600
MW across other scenarios in 2050. The capital expenditure lies in the range of $7b to $24b.
Box C.2 Figure 2 Cumulative new build generation
6000
Capacity(MW)
4000
Other
Load
Gas
Hydro
Geothermal
Wind
2000
0
2015 2020 2025 2030 2035 2040 2045 2050MINISTRY OF BUSINESS, INNOVATION AND EMPLOYMENT ENERGY IN NEW ZEALAND 2020
24
Changes in electricity pricing
Wholesale electricity prices remained elevated for most of 2019, plunged in December
Afer high spikes in electricity spot prices in 2018, wholesale prices were elevated over most of 2019
relative to the historical average, before falling signifcantly toward the end of the year.
Wholesale prices had trended upwards over 2018, driven by a combination of planned and unplanned
gas production outages and low infows to hydro generation reservoirs. Elevated prices continued
for most of 2019. Additional gas production outages in 2019 due to ongoing maintenance at gas
felds meant that supply of gas remained relatively tight. Dry weather also continued across the
country for the beginning of the year.
Hydro storage decreased so far as to reach the threshold for moving the New Zealand Hydro Risk
Meter from “Normal” to “Watch” status in March 2019. However signifcant rain events in the South
Island saw levels recover to above average in the same week. In contrast, dry conditions in the North
Island continued.
Wholesale prices fell dramatically in December 2019, as heavy rain in the South Island increased
already high lake levels there. Nationally hydro storage levels rose to 162 per cent of the 20 year
average.
Figure C.7 Weekly wholesale electricity price
250
200
Dollars per MWh
150
100
50
0
2010 2012 2014 2016 2018 2020MINISTRY OF BUSINESS, INNOVATION AND EMPLOYMENT ENERGY IN NEW ZEALAND 2020
Slight fall in average electricity prices for industrial users, relatively steady for commercial users 25
MBIE uses sales-based data to calculate average residential, commercial, and industrial electricity
costs. This data is collected from electricity retailers and calculated by dividing income from electricity
sales by the volume of electricity sold. The retail income includes prompt payment discounts, lower
fxed term prices, loyalty rewards, and acquisition/retention payments. This analysis is referred to as
the cost per unit as it is what was actually paid relative to the quantity of electricity consumed
While the wholesale price was elevated over 2019, the average nominal cost faced by industrial users
over the 2019 calendar year11 was 2.8 per cent lower than in 2018. This decrease follows two years
of increasing prices for the industrial sector. There are a number of other factors that infuence the
average price that industrial consumers pay. These factors include distribution and transmission
lines charges, the wholesale price paid for any electricity purchased on the wholesale market, and the
contracted price for electricity that is purchased from retailers.
The average nominal cost faced by commercial users increased by 1.7 per cent from 2018. Nominal
commercial costs have been relatively stable since 2011, and have been decreasing in real terms over
the same period.
Figure C.8 Average electricity costs, industrial and commercial sector
20
15
Cents per kWh
10
5
0
1999 2003 2007 2011 2015 2019
Calendar year
Commercial Industrial Nominal Real
Costs faced by the residential sector did not change signifcantly over 2019. The nominal residential
cost in the December quarter of 2019 was 0.6 per cent higher compared to the 2018 December
quarter.
The Ministry also monitors changes in electricity prices using the Quarterly Survey of Domestic
Electricity Prices (QSDEP). The QSDEP is an indicator of publically available prices advertised in the
retail electricity market to new customers on a particular date. It shows how residential electricity
tarifs have changed over time, and how these may afect households. The average national QSDEP
indicator for 2019 increased by 1.9 per cent compared to 2018, or 0.3 per cent when adjusted for
infation. This increase was driven by increases in the ‘energy and other’ component of the retail
price, rather than the lines component.
11 Sales-based data is reported on a March year-end basis, so the majority of the 2019 calendar year is reported
under the year ending March 2020. The Ministry also estimates calendar year costs from the March-year end
data for the industrial and commercial sectors. These estimates have been used here, so as to avoid reporting on
changes that occurred in either the 2018 or 2020 calendar year.MINISTRY OF BUSINESS, INNOVATION AND EMPLOYMENT ENERGY IN NEW ZEALAND 2020
26 Decrease in overall allowable revenue for electricity distributors for 2020-2025 period
In November 2019, the Commerce Commission set the new default price path (DPP) for the 17
electricity distribution businesses (EDBs) subject to price-quality regulation.12 Known as DPP3 (as
it is the third DPP that the Commerce Commission has set), the new default price path determines
the maximum allowable revenue these EDBs can recover over the fve year period beginning 1st April
2020.
Electricity distribution businesses are subject to specifc regulation by the Commission as they are
natural monopolies. Of the 29 EDBs in New Zealand, 17 are subject to price-quality regulation. Every
fve years the Commerce Commission sets the maximum revenue that these EDBs are allowed to
earn from their customers, as well as minimum quality standards that they must meet in providing
their service. The other 12 EDBs are ‘consumer-owned’ and exempt from this regulation as they are
assumed to act in the best interest of their customers.
While diferent maximum allowable revenues are set for each regulated EDB, most saw a decrease in
maximum allowable revenue in DPP3. The overall allowed revenues for EDBs on the DPP3 in the year
starting 1st April 2020 decreased by 72 million dollars (6.7 per cent) compared to the previous year.13
This decrease was largely driven by the Commission reducing the cost of capital (WACC) used in their
calculations, to refect falling interest rates across the economy.
The allowable revenue impacts the distribution prices that EDBs set for consumers connected to
their networks over this period. MBIE’s QSDEP indicator showed a decrease of 5.7 percent in the
national average distribution component14 afer the new regulatory period came began on the 1st
April 2020.
Some EDBs have historically charged below the maximum they were allowed to under their previous
price paths. This means that while there are changes in the amount of revenue that these EDBs
can earn under DPP3, these changes may not necessarily be mirrored in the changes in both the
distribution charges and retail prices that customers face.
12 Two EDBs (Powerco and Wellington Electricity) are currently on a Customised price-quality path (CPP) and will
transition back to a Default price-quality path (DPP) when their CPPs expire.
13 Commerce Commission New Zealand (2019), 2020–2025 price-quality paths for EDBs and Transpower Final
decisions: Presentation to Stakeholders. https://comcom.govt.nz/__data/assets/pdf_fle/0028/191764/Analyst-
briefng-slides-EDB-DPP3-fnal-determination-27-November-2019.pdf
14 This is an estimation of the distribution part of the total lines charge, excluding transmission charges.You can also read