RENOVATING ROMANIA A STRATEGY FOR THE ENERGY RENOVATION OF ROMANIA'S BUILDING STOCK - BUILDINGS PERFORMANCE INSTITUTE EUROPE
←
→
Page content transcription
If your browser does not render page correctly, please read the page content below
Renovating Romania

A Strategy for the energy Renovation of Romania’s
Building Stock
Project coordinator:
Dan Staniaszek

Editing team:
Filippos Anagnostopoulos
Bogdan Atanasiu
Serban Danciu
Marine Faber
Cosmina Marian
Ingeborg Nolte
Oliver Rapf

Graphic Design
Cosmina Marian

BPIE would like to express its gratitude towards the stakeholders who contributed to improving this
study by activel participating in our consultation meeting in November 2013. We look forward to
further discussions wiah all stakeholders.

Cover photos © courtesy of Acoperis Magazin, Property Buyer, Primaria Bacau, Municipiul Moreni,
Ministry of Regional Development and Public Administration, Arena Constructiilor.

Published in April 2014 by the Buildings Performance Institute Europe (BPIE)

Copyright 2014, Buildings Performance Institute Europe (BPIE). Any reproduction in full or in part of
this publication must mention the full title and author and credit BPIE as the copyright owner. All rights
reserved.

The Buildings Performance Institute Europe (BPIE) is a European not-for-profit think-tank with a focus on
independent analysis and knowledge dissemination, supporting evidence-based policy making in the
field of energy performance in buildings. It delivers policy analysis, policy advice and implementation
support. The Brussels-based institute is partnering with the Global Buildings Performance Network
(GBPN).

PART II of the study dealing with the evaluation of policy options for building stock renovation in
Romania will be published in the summer of 2014
Renovating Romania | 3
Contents

PART I - A Strategy for the energy Renovation of
Romania’s Building Stock

I     INTRODUCTION                                                              7
II    AIM OF THIS STRATEGY	                                                     8
III   EUROPEAN POLICY CONTEXT                                                   9
          European Directives Affecting the Building Sector                    10
          Energy Performance of Buildings Directive (EPBD) - Main Provisions   11
          Energy Efficiency Directive (EED) - Main Provisions                  12

IV    BENEFITS                                                                 14

V     PHASE 1 - IDENTIFYING STAKEHOLDERS AND INFORMATION SOURCES               17

VI    PHASE 2 - APPRAISAL OF TECHNICAL AND ECONOMIC POTENTIAL                  19
         Overview of the Renovation Model                                      28
         Initial Data and Modelling Assumptions                                28
         Renovation Variables                                                  31
         Scenarios                                                             33

VII   RESULTS                                                                  35
          Model Results                                                        35
          Economic Comparison of Renovation Scenarios                          35
          Cost Effectiveness Calculation                                       36
          Cost Effectiveness Calculations by Building Type                     39

VIII FINANCING THE MEASURES                                                    41
         Investment Profile                                                    41

IX    PHASE 3 - POLICY APPRAISAL	                                              44
         Existing Policies                                                     44
         Financial Support Schemes                                             45
         Policy Options                                                        46
         Barriers                                                              47
         Developing Policy Solutions                                           47

X     CONCLUSION                                                               54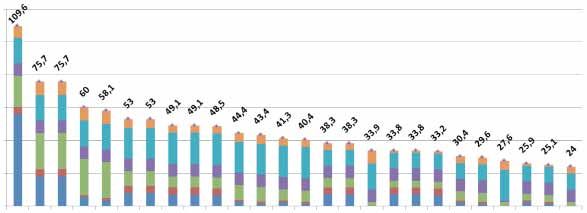
1. Setting the Stage
The building stock is responsible for a large share of greenhouse gas emissions (GHG)
in the European Union. Major emission reductions can be achieved through changes
in this sector and the building sector is crucial to achieving EU reduction targets. With
more than one quarter of the 2050s building stock still to be built, a large amount of
GHG emissions are not yet accounted for. To meet the EU’s ambitious reduction targets,
the energy consumption of these future buildings needs to be close to zero, which

         Part I
makes finding and agreeing on an EU-wide definition or guidelines for “nearly Zero-
Energy Buildings” (nZEB) essential in the effort to reduce domestic greenhouse gases to
80% of 1990 levels by 2050.

  A Strategy for the
The recast of the Energy Performance of Buildings Directive (EPBD) introduced, in Article 9, “nearly Zero-

 energy Renovation of
Energy Buildings” (nZEBs) as a future requirement to be implemented from 2019 onwards for public
buildings and from 2021 onwards for all new buildings. The EPBD defines a nearly Zero-Energy Building
as follows: [A nearly Zero-Energy Building is a] “building that has a very high energy performance… [ ].

Romania’s Building Stock
The nearly zero or very low amount of energy required should to a very significant extent be covered by
energy from renewable sources, including renewable energy produced on-site or nearby”.

Acknowledging the variety in building culture, climate and methodological approaches throughout the
EU, the EPBD does not prescribe a uniform approach for implementing nearly Zero-Energy Buildings
(nZEBs) and each EU Member State has to elaborate its own nZEB definition. The EPBD also requires EU
Member States to draw up specifically designed national plans for implementing nZEBs which reflect
national, regional or local conditions. The national plans will have to translate the concept of nearly Zero-
Energy Building into practical and applicable measures and definitions to steadily increase the number
of nearly Zero-Energy Buildings. EU Member States are required to present their nZEB definition and
roadmaps to the European Commission by 2013.

So far the nZEB criteria as defined in the EPBD are of a very qualitative nature with much room left
for interpretation and way of execution. Indeed, there is little guidance for Member States on how to
concretely implement the Directive and on how to define and realise nearly Zero-Energy Buildings.
Therefore a more concrete and clear definition of nZEB needs to be formulated which includes common
principles and methods that can be taken into account by EU Member States for elaborating effective,
practical and well thought-out nearly Zero-Energy Buildings.

The aim of this study is to actively support this elaboration process in Romania by providing a technical
and economic analysis for developing an ambitious yet affordable nZEB definition and implementation
plan. Starting from country data on current construction practices, economic situation conditions and
existing policies, different technological options are simulated for improving the energy performance
of offices and single- and multi-family buildings. We have evaluated the economic implications of the
various options and offer recommendations for an implementation plan.

6 | Renovating Romania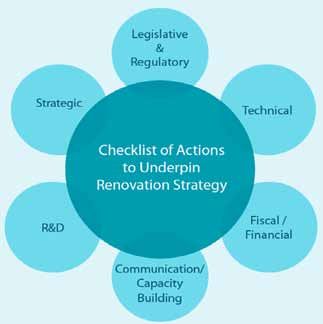
I	Introduction
Buildings account for the largest share of energy use in Romania, as illustrated in the figure below.
Together, the household sector and the tertiary sector (i.e. offices, retail premises and other non-
residential buildings) account for 46% of total national energy consumption.

Figure 1: Breakdown of Romanian energy consumption by end use (source - ODYSSEE1)
                                              Chart Title
                        Industry           Transport              Household              Tertiary

                                                                9%
                                    31%
                                                                                     23%

                                                        37%

At a time of growing importance of environmental, economic and societal concerns, ranging from the
impacts of climate change, energy security and resource depletion to issues of affordability for industry
and consumers alike, reducing energy use in the buildings sector has become an issue of strategic
importance, both nationally and internationally. Alongside efforts to construct new buildings with little
or no requirements for energy, addressing the high consumption levels in existing buildings is essential.

It is with the above strategic concerns in mind that EU policy addressing energy use in buildings has
been strengthened in the last few years, firstly with the recast of the Energy Performance of Buildings
Directive, EPBD, (DIRECTIVE 2010/31/EU2) in 2010, and more recently the new Energy Efficiency Directive,
EED, (DIRECTIVE 2012/27/EU3), which, in 2012, replaced the former Energy Services and Co-generation
Directives. Together, these and other requirements, such as the need to consider the scope for installation
of renewable technologies in new buildings and buildings subject to major renovation, contained in the
Renewable Energy Directive (DIRECTIVE 2009/28/EC4), provide a framework within which Member States
need to implement policy measures to cut energy use, notably in the buildings sector.

In accordance with the requirements set out in the Energy Efficiency Directive (Article 4), this study
outlines a proposed strategy for renovating Romania’s building stock. The strategy uses the methodology
developed in BPIE’s “A Guide to Developing Strategies for Building Energy Renovation5” published in
February 2013, in particular the 5-phase approach illustrated in Figure 1 below.

1
 http://www.odyssee-indicators.org/publications/PDF/romania_nr.pdf http://www.odyssee-indicators.org/publications/PDF/romania_nr.pdf
2
 http://europa.eu/legislation_summaries/energy/energy_efficiency/en0021_en.htm
3
 http://ec.europa.eu/energy/efficiency/eed/eed_en.htm
4
 http://eur-lex.europa.eu/LexUriServ/LexUriServ.do?uri=Oj:L:2009:140:0016:0062:en:PDF
 5
  http://bpie.eu/renovation_strategy.html

                                                                                                                 Renovating Romania | 7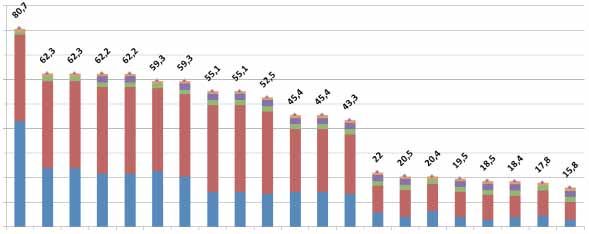
Figure 2: Five-Phase Stepwise Approach to Renovation Strategy Development (source: BPIE)

        PHASE 1          •   Identify key stakeholders
                         •   Identify information sources
        PHASE 2          •   Building stock characterisation
                         •   Economic appraisal of renovation potential
                         •   Quantification of investment requierments
        PHASE 3          •   Conmprehensive appraisal of barriers
                         •   Development of holistic policy package
        PHASE 4          •   Draft renovation strategy
                         •   Consultation on draft strategy
        PHASE 5          •   Publish final strategy
                         •   Commerce policy implementation process
                         •   Establish monitoring and evaluation process
                         •   Review and update strategy every three years

     II	AIM OF THIS STRATEGY
     RENOVATING ROMANIA has been developed in order to assist the Romanian Government in fufilling its
     commitment with regard to Article 4 of the EED, entitled “Building Renovation”. The Directive requires
     all Member States to report their national renovation strategies by 30th April 2014. At the same time, the
     strategy is designed to stimulate debate among stakeholders, with a view to securing a broad consensus
     around the future direction of policies and initiatives addressing building energy performance in Roma-
     nia. RENOVATING ROMANIA provides an opportunity to encourage the Government and other stakehold-
     ers to consider a level of ambition that would be appropriate with regard to improving the quality of the
     nation’s homes and workplaces, for the current and long term benefit of Romanian citizens and the good
     of the economy.

      To illustrate the scale of that ambition, this strategy proposes the renovation or rebuilding of all of Roma-
     nia’s homes, farmsteads, workplaces, hospitals, factories, retail premises and the myriad of other build-
     ings to high energy performance standards by 2050. We recognise this is a significant challenge and a
     significant commitment. Nevertheless, it is one we believe is in the best interest of the nation as it will:

8 | Renovating Romania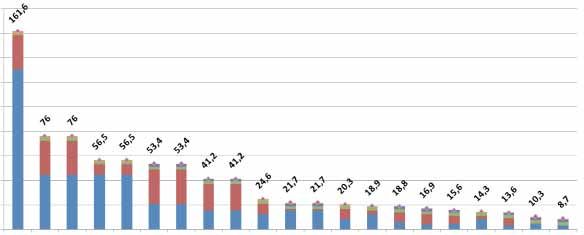
•   create much needed employment now and for decades to come,
•   improve living conditions in Romanian homes and workplaces,
•   reduce dependence on foreign energy suppliers,
•   make best use of Romania’s natural resources and human resourcefulness, and in the process,
•   provide Romania with a modern, efficient building stock fit for the 21st century and beyond.

As a benchmark illustrating the level of ambition, we believe a reduction in CO2 emissions from buildings
by as much as 80% by 2050 (compared to 2010) is both achievable and desirable. This can be secured
through a combination of energy efficiency measures and widespread deployment of renewable
resources in and on buildings.

80% CO2 reduction is an ambitious target, which cannot be achieved in one step. That is why the approach
adopted within RENOVATING ROMANIA is a step-wise one, with three key phases:
•  PHASE 1 - the priority is to establish the conditions whereby deep renovations, saving at least 60%,
   become the norm within 5 years.
•  PHASE 2 - Technological development will then provide the means of achieving 80-100% energy
   savings (i.e. down to net zero energy levels) in a highly cost effective manner as standard in
   renovations within around 10 years.
•  PHASE 3 - Thereafter, achieving positive energy building renovation will be realistic, practical and
   cost effective within 20 years.

Romania has a legacy of many buildings from the communist era that are no longer fit for purpose.
RENOVATING ROMANIA will address this historic legacy and provide Romania with a building stock in
which all citizens can share a common pride.

III	EUROPEAN POLICY CONTEXT
As a significant contributor to EU energy consumption, resource utilisation and carbon emissions, the
building sector is subject to numerous policies, strategies and long term goals which seek to reduce its
impact. The wider environmental goals have been formulated into the so-called “20-20-20” targets, which
is a set of three key objectives for 2020:
•     A 20% reduction in EU greenhouse gas emissions from 1990 levels;
•     Raising the share of EU energy consumption produced from renewable resources to 20%;
•     A 20% improvement in the EU’s energy efficiency.

Looking out across a more distant horizon, the EU has a set of longer term objectives, contained within
roadmaps to 2050. As far as the building sector is concerned, the three principal ones are:
•   EU Roadmap for moving to a competitive low carbon economy in 2050, which identifies the need of
    reducing carbon emissions in residential and services sectors (collectively, the building sector) by
    88%-91% by 2050 compared to 1990 levels.
•   Energy Roadmap 2050 states that ‘higher energy efficiency potential in new and existing buildings
    is key’ in reaching a sustainable energy future and contributing significantly to reduced energy
    demand, increased security of energy supply and increased competitiveness.
•   Roadmap for a Resource Efficient Europe identifies buildings as being among the top three sectors

                                                                                  Renovating Romania | 9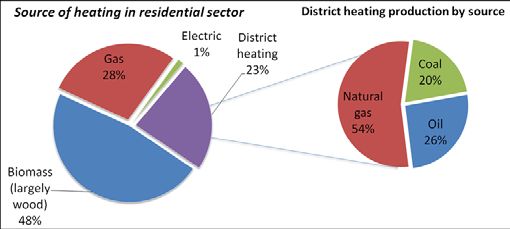
responsible for 70%-80% of all environmental impacts. Better construction and use of buildings in
the EU would influence more than 50% of all extracted materials and could save up to 30% of water
consumption.
These roadmaps set a long term aspiration which is not only socially and economically desirable, but
also environmentally essential if the triple challenges of climate change, energy security and resource
depletion are to be tackled.
European Directives Affecting the Building Sector
Of more immediate concern are the current European regulations and directives pertaining to the
energy performance of the building stock, summarised below.
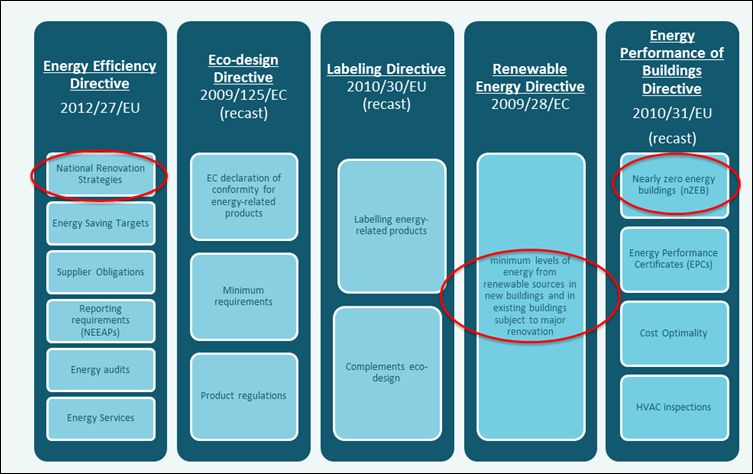
Figure 3 – Summary of main EU Directives and relevant articles affecting energy use in buildings
These provide a common framework within which Romania and other Member States are required to
set standards and performance levels regarding energy use in buildings. For the most part, these regu-
lations apply equally to commercial, public sector and residential buildings alike. The main Directives
are:
• The Energy Performance of Buildings Directive (EPBD), originally introduced in 2002, and recast in
2010 (2010/31/EU);
• The Energy Efficiency Directive (EED) 2012/27/EU, introduced in 2012;
• The Renewable Energy Directive (RED), 2009/28/EC, introduced in 2009.
10 | Renovating RomaniaThe main provisions in EPBD and EED, as they relate to sustainable retrofitting of buildings, are described
in more detail below. As regards the Renewable Energy Directive, the main point of relevance to the
building sector is the requirement to introduce minimum levels of energy from renewable sources in
new buildings and in existing buildings that are subject to major renovation.
Energy Performance of Buildings Directive (EPBD) -
Main Provisions
The first major attempt to set a European framework for the energy performance of buildings came in
2002 when the EPBD set out a number of requirements on Member States, ranging from the establish-
ment of certification schemes for buildings (so-called energy performance certificates, or EPCs), inspec-
tion regimes for major heating and air conditioning plant, and performance requirements on building
regulations. In many ways, EPBD simply raised the bar in terms of standards across all EU Member States
to the performance of some of the best. For example, Denmark and The Netherlands had already estab-
lished certification schemes for buildings, and EPBD required other Member States to introduce similar
mechanisms.
Whilst the original EPBD made good progress in a number of areas, implementation at Member State
level was slow and incomplete, while some of the provisions were not having the desired effect. With
that in mind, the European Commission commenced a review in 2009, resulting in the recast Directive
introduced in 2010. EPBD now contains the following main provisions:
• Methodology for calculating the energy performance of buildings and setting of minimum
energy performance requirements: Member States are required to apply a common methodol-
ogy for calculating the energy performance of buildings, and set minimum energy performance
requirements at cost-optimal levels, using a comparative methodology framework developed by
the Commission.
• Requirements for nearly Zero-Energy Buildings (nZEB): From the end of 2020, all newly con-
structed buildings will have to consume ‘nearly zero’ energy, with the low level of energy coming ‘to
a very large extent’ from renewable sources. For buildings occupied and owned by public authori-
ties, this requirement must be met two years earlier, from the end of 2018. Furthermore, Member
States are required to prepare national plans for increasing the number of nZEB, across new and ex-
isting building stocks. These plans may include targets differentiated according to building category.
• Requirement to improve the energy performance of existing buildings undergoing major ren-
ovation: The recast extended the scope of the initial EPBD to almost all existing and new buildings,
as well as removing the previous 1 000m2 threshold for major renovations in the 2002 EPBD. This
threshold had excluded 72% of the building stock. When existing buildings undergo ‘major renova-
tion’, their energy performance should be upgraded in order to meet minimum energy performance
requirements.
• Technical building systems: In order to optimise the energy use of technical building systems such
as heating, ventilation & air conditioning (HVAC) plant and lighting systems, Member States need to
set system requirements in respect of the overall energy performance, the proper installation, sizing,
adjustment and control of such systems which are installed in existing buildings. Member States
may also apply these system requirements to new buildings.
Renovating Romania | 11• Financial incentives and market barriers: Member States are required to review and publish
details of existing and proposed measures/instruments, including those of a financial nature, which
address market barriers and which seek to improve the energy performance of buildings and aid the
transition to nearly zero-energy buildings.
• Energy Performance Certificates (EPCs): EPCs must be issued for all buildings when sold, rented,
or newly constructed. For certain larger buildings visited frequently by the public, these certificates
must be displayed in a prominent place. Annual reports on the quality of EPCs need to be produced
by the relevant authorities with responsibility for implementing the control system.
• Inspection of heating and air-conditioning systems: Larger heating and air conditioning systems
need to be inspected on a regular basis. These inspections must be undertaken by suitably qualified
experts, and a report issued to the owner or tenant of the buildings after each inspection. This report
must include recommendations for the cost-effective improvement of the energy performance of
the inspected system.
Energy Efficiency Directive (EED) - Main Provisions
Whilst the EED takes a wider perspective across all end uses and not just the building sector, a number
of provisions are geared specifically towards encouraging the sustainable retrofit of buildings. These
include:
• Building Renovation (Article 4): All Member States are required to set out national strategies for the
renovation of building stocks, including commercial, public and residential buildings. RENOVATING
ROMANIA is primarily concerned with the delivery of the requirements in Article 4, as well as Article
5 below.
• Exemplary role of public bodies (Articles 5 and 6): National governments are required to show
leadership in improving the energy performance of their building stocks by renovating 3% by floor
area of buildings owned and occupied by central governments every year (Article 5). Furthermore,
central governments are required to only purchase buildings (as well as products & services) with
high energy efficiency performance (Article 6).
• Metering and billing (Articles 9-12): Measures to increase transparency and accuracy of energy
costs are intended to raise awareness amongst building owners and occupiers as to the opportunities
for saving money through improving the energy performance of buildings they own and/or occupy.
12 | Renovating RomaniaFigure 2: Distribution of residential floor area by building type and urbanisation
1%
Detached SFH-urban
IV benefits
17%
34% Detached SFH-rural
Semi-detached and terraced SFH-urban
Semi-detached and terraced SFH-rural
MFH-urban
43% MFH-rural
1%
4%
Figure 3: Distribution of non-residential floor area by building type
Office buildings - national authorities
2%
2% 3% Office buildings - local authorities
3% 5% 3%
Office buildings - commercial low standard*
Office buildings - commercial high standard*
28%
Schools/education
29% Health facilities
Hotels/restaurants
Retail in mixed used buildings
9%
16% Retail detached (e.g. supermarkets or malls)
Others (e.g. industry/logistics)
*) Low standard means low concern for internal comfort and simple HVAC systems (e.g. natural ventilation). High standard means high internal
comfort (no overheating), typically achieved by central HVAC-systems.
New construction rates are generally higher in the non-residential sector. Data about new construction
per building type category is hard to find. In the residential sector the average new construction rate is
about 0.64%6. It is not possible to give precise new construction rates per sub-types of buildings. Therefore
we can only indicate trends and refer to the average construction rate within the building sector (below
or above average). This indication might be misleading, since the rate depends on the denominator, e.g.
there might be many houses built in the rural area but the rate may appear below average because the
building stock of this type is huge. However, we consider this being the best approximation possible at
this stage and acceptable in the context of this study.
For the non-residential sector, the situation is worse; there is no reliable data for each building category.
The estimated construction rates for the non-residential sector were very high over the last decade and
for certain sub-types even well above 10%/year. This construction rate seems credible if we consider the
strong impetus in the service sector in Romania and the lack of existing office buildings. However this
high construction rate cannot last for too many years and will very likely not continue until 2019 when
the nZEB requirement should be in place. Market research indicates that floor space of commercial offices
6
Based on data from Romanian National Statistics Institute 2005-2011, www.insse.ro
Renovating Romania | 13Renovating the existing building stock to high energy performance standards represents one of the most
significant and strategic investments a nation can make. To quote the President of the European Council
Herman Van Rompuy6:
“Energy Efficiency is the highest impact measure governments can take to save energy”
“Buildings represent the greatest potential sector for energy savings in the EU”
“Energy efficiency in buildings is not a cost, but an investment with a great rate of return”
While the key driver in EED is the achievement of the EU’s 20% energy saving target by 2020 and the
longer term 2050 environmental goals in the Energy and Low Carbon Roadmaps, the benefits in doing
so reach into many corners of the economy and society . Broadly speaking, the impacts of undertaking
sustainable energy renovation of buildings can be summarised under the headings:
• Economic Benefits – The increased economic activity resulting from the jobs created and investment
stimulated has been estimated by the US Environmental Protection Agency to generate 1.5 times
the value of energy cost savings in additional output. Additional unquantified benefits arise through
increased property values.
• Societal Benefits – Improving the energy efficiency of homes has long been recognised in some
Member States (e.g. UK, Ireland) as vital to achieving affordable warmth for families on low incomes
and addressing the problem of fuel poverty, estimated to affect 10-25% of the total EU population.
There are also health benefits from warmer homes with fewer cold spots and draughts, less con-
densation/mould and improved indoor air quality. Copenhagen Economics estimate that the health
benefits from energy retrofits could be worth around the same value as the saving in energy costs. A
UNDP/GEF draft study7 notes that there is no official definition of fuel poverty in Romania. However,
it concludes that:
“A large proportion of Romania’s population is not able – in general and in normal conditions – to provide
itself with sufficient levels of thermal comfort in the home, because of the high cost of heating energy relative
to their income .”
• Environmental Benefits – Buildings are the biggest source of CO2 emissions, and hence the biggest
contribution to climate change. The value of the environmental benefit from renovation could be
worth of the order of 10% of energy cost savings .
• Energy System Benefits – In addition to the energy security benefits of being less dependent on en-
ergy imports, saving in peak loads through sustainable energy improvements in buildings, including
self-generation, are worth approximately the same as the energy cost savings, according to a study
by Ecofys8. These accrue to all users.
In summary, the following multipliers could be applied to the energy cost saving, in order to gain an indi-
cation of the overall societal benefit from building renovation:
TABLE 1 –Valuing the Multiple Benefits from Building Renovation
ITEM MULTIPLIER
Energy Cost Saving 1.0
Economic Stimulus 1.5
Societal (health) Benefits 1.0
Environmental Benefits 0.1
Energy System Benefits 1.0
TOTAL 4.6
6
Opening Address at Renovate Europe Day, Brussels, 9th October 2013
7
http://www.undp.ro/libraries/projects/EE/Assesment%20Report%20on%20Fuel%20Poverty%20-%20DRAFT(1).pdf
8
Saving energy: bringing down Europe’s energy prices for 2020 and beyond”, Ecofys, 2013
14 | Renovating RomaniaIt can be seen that the total societal benefit could be approaching five times the value of the energy
cost savings alone. For the most part, these benefits accrue to society at large, rather than the building
owner/investor. This “benefits gap” is a major factor behind the current underinvestment in building
renovation. Providing support measures (be they financial or otherwise) that encourage investment in
building renovation is one way in which this benefits gap can be addressed. Such measures are discussed
later in this report.
The remainder of this paper is devoted to elaborating a building renovation strategy for Romania,
following the BPIE guidelines.
Renovating Romania | 15almost doubled from 2005 to 2011; however the new high construction rate has been slowing down
since 2009 and reached 2.5% in 2011 (Table 4).
Table 4: Development of floor area of commercial office buildings since 20057
Year 2005 2006 2007 2008 2009 2010 2011
Useful area (mill. m²) 2.5 2.8 3.2 4.1 4.4 4.6 4.7
New built rate (%) - 12 14 28 7 5 2.5
V PHASE 1 - IDENTIFYING
Therefore we can assume that the construction rates are similar to those of other Central and Eastern
European countries (Poland and Hungary), i.e. a new construction rate between 1.5 – 2.5% for the overall
STAKEHOLDERS AND
non-residential sector and a rate of on average 5% from 2009 to 2011 for office buildings only. For the
other categories there is no data available and we indicate the new construction rate to be above or
INFORMATION SOURCES
below average as in the case of residential buildings (Table 5).
Table 5: Number of buildings in Romania
Building type Region Number of Floor area New
buildings (million construction
(1000) m²) rate (%)
Detached single-family Urban 1 189.2 97 Above average
houses Rural 3 660.9 237 Below average
Semi-detached and Urban 112.0 20 Above average
terraced single-family
Rural 54.9 6.3 Below average
houses
Residential buildings
Urban 80.9 191 Below average
Multi-family buildings
Rural 5.1 5.3 Below average
Other buildings that Urban 6.3 1.1 Below average
cannot be assigned to
Rural 8.6 0.5 Below average
above categories
Total 5 118 559 0.6
Commercial and public 19.1 7.8 Much above
office average
Retail 133.5 18.3 Above average
Non-residential
buildings Hotels & restaurants 5.0 5.2 Above average
Health facilities 51.3 9.3 Below average
Educational facilities 8.1 17.4 Below average
Total 217.1 59.4 1.5-2.5*
* Assumption based on the Romanian National Institute of Statistics and authors’ best estimation.
12
G is the global heat transfer coefficient (including transmission and ventilation and calculated under design conditions), by division of the total volume
of the building
16 | Renovating RomaniaKey Stakeholders
The following ministries have been identified as needing to play a key role in developing and delivering
the strategy:
• Ministry of Regional Development and Public Administration (MDRAP) – overall EPBD responsibility
and lead Ministry in the elaboration of the national strategy;
• Ministry of European Affairs – oversight of European funds;
• Ministry of Economy, Trade and Business Environment (MECMA) – application of renewable sources
of energy in and on buildings;
• Ministry of Public Finance (MFP) – co-financing budgetary sources;
• Ministry of the Environment and Forests (MMP) – Kyoto funding mechanisms;
• National Regulatory Authority for Energy (ANRE) – implications for energy utilities, including the
role of Energy Efficiency Obligations. ANRE now includes the former Romanian Agency for Energy
Conservation (ARCE);
• National Institute for Building Research (INCERC) – Management of the Energy Performance
Certificate (EPC) register (all EPCs are reported to this Institute).
In addition, the following organisations have been invited to the consultation process and have provided
valuable input into strategy development:
• Asociatia Producatorilor Materialelor de Constructii din Romania (APMCR) – Association of Romanian
Construction Materials Manufacturers;
• Asociatia Romana a Antreprenorilor din Constructii (ARACO) – Romanian Association of Construction
Entrepreneurs;
• Patronatul Societatilor din Constructii (PSC) – Construction Companies Employer’s Organization
• Camera de Comert si Industrie a Romaniei (CCIR);
• Romania Green Building Council (RoGBC);
• Asociatia Inginerilor de Instalatii din Romania (AIIR) – Association of Romanian Installation Engineers;
• Asociatia Auditorilor Energetici din Constructii (AAEC) – Association of Energy Auditors in
Constructions;
• Liga Asociatiilor de Proprietari Habitat – League of Habitat Owners Associations);
• Federatia Asociatiilor de Proprietari din Romania – Federation of Property Owners Associations in
Romania9;
• Asociatia Producatorilor de Surse Regenerabile (SUNE) – Association of Renewable Sources Producers;
• Asociatia Româna Pentru Promovarea Eficientei Energetice (Arpee) – Romanian Association For
Promoting Energy Efficiency;
• Asociatia Municipiilor din Romania – Association of Romanian Municipalities;
• Asociatia Oraselor din Romania – Association of Romanian towns;
• Confederatia Producatorilor Industriali din Romania (CONPIROM)- Confederation of Industrial
Producers from Romania;
• Societatea Romana Geoexchange - representing users of geothermal energy in buildings.
It is important that the engagement with these organisations continues on an ongoing basis during
strategy implementation and in revising and updating the strategy every three years.
The key information sources used for this strategy are:
• BPIE’s Data Hub (www.buildingsdata.eu), including data collected by BPIE during the 2011 survey;
• ENTRANZE, an Intelligent Energy Europe project (www.entranze.eu), in which BPIE is a project
partner. The objective of the ENTRANZE project is to actively support policy making to achieve a fast
and strong penetration of nZEB and renewable energy use within existing national building stocks.;
• Implementing nearly Zero-Energy Buildings (nZEB) in Romania – towards a definition and roadmap,
BPIE 2012 (http://bpie.eu/low_energy_buildings_east_eu.html);
• “Build Up Skills România - Analysis Of The National Status Quo”, National Institute for Research and
Development in Construction, Urban Planning and Sustainable Spatial Development (URBAN-
INCERC) (www.buildupskills.eu/national-project/romania, www.iee-robust.ro/);
• Romania’s 2nd National Action Plan for Energy Efficiency;
• Statistical Yearbook of Romania;
• Census data.
9
Owners living in multifamily buildings are organised in Owners Associations which are legally created according to Romanian Law no. 230/2007 regarding
the creation, the organisation and the operation of Residential Multifamily Buildings Owners Associations. The owners association will be represented
by a committee formed of several representatives. According to the Government Emergency Ordinance no. 69/June 2010 the decision for building
renovation can be taken based on agreement of two thirds of owners.
Renovating Romania | 17VI PHASE 2 - APPRAISAL
OF TECHNICAL AND
4.2.2. Renewable energy share in new buildings
The building code in Romania doesn’t specify any requirements for using renewable energy and DHW
in buildings.
ECONOMIC POTENTIAL
4.2.3. Actual practice in construction
4.2.3.1. Enforcement
Building requirements (including minimum thermal performance of building components and global
indicator G12) are controlled at the stage of construction authorisation (building permit). In principle, the
requirements are respected in the design documentation. Otherwise the construction project does not
pass the authorisation process. However, in practice, the execution of the work is not always undertaken
according to the design and can depend on the budget reduction by the investor. In addition the poor
execution of details/joints (thermal bridges) can lead to a reduction of the global thermal resistance of the
building envelope and usually result in values which do not respect the minimum thermal requirement.
4.2.3.2. Penalties for non-compliance
If a construction is built without a permit or infringes its permit, the control authorities may order the
demolition of those elements which are not compliant with the permit or were built without a permit. In
such cases, the construction works can be suspended. In this case, the administrative fine to be paid by
the investor is up to approximately €2 300 euro in addition to indemnities for the damage caused.
4.2.3.3. Body responsible for compliance in construction
The main responsible body for compliance control in construction is the State Inspectorate in
Constructions (SIC), a public institution with a legal personality, subordinated to the Ministry of Regional
Development and Tourism (MDRT). SIC has a control function over the execution of works. The actual
inspection for compliance, after issuing the building permit and authorisation of works, is done by either:
• construction inspectors employed by SIC;
• site inspectors/project supervisors (subject to authorisation by SIC) employed by the beneficiary/
building owner;
• technical inspectors (subject to authorisation by MDRT) employed by the contractor.
Compliance with the energy performance regulation is required during the authorisation phase of
construction works. During the final commissioning phase, the realisation of an Energy Performance
Certificate (EPC) is required. With the exception of apartments in a block of flats, the EPC also displays
the energy performance indicator for a reference (national) building (the same geometry as the actual
building, but with the minimum thermal requirements fulfilled). This would be equivalent to the energy
performance of the same building respecting the minimum energy performance requirements at
18 | Renovating RomaniaBuilding Stock Characterisation
There are 493,000,000 m² of building floor area in Romania, of which 86% are accounted for by residential
buildings. Of the 8.1 million dwellings, single family houses dominate, accounting for 61% of the total.
In the non-residential stock, the total floor area sums up to 67,200,000 m². The non-residential stock is
distributed across different building types as set out in table 1.
TABLE 2 –Breakdown of non-residential building stock by type (source: BPIE’s Data Hub)
Offices 16.3%
Educational buildings 16.9%
Hospitals 13.8%
Hotels & Restaurants 7.7%
Sport facilities 7.0%
Wholesale and retail trade 27.2%
Other non-residential buildings 11.1%
Figure 4 – Breakdown of building stock by building category ( m2) (source: BPIE’s Data Hub)
Breakdown of the building stock by building types
Sport
Wholesale and
Hospitals; 9 facilities;
retail trade; 18
250 000 4 700
300 000
000
Educational buildings; Hotels & Other non-residential
11 349 000 Restaurants; buildings; 7 456 000
5 170 000
Offices; 10 990 000
Other residential
buildings; 1 613 464
Single family
Multi family houses; 273 313
houses; 151 582
307 054
Renovating Romania | 19Some of the key statistics for the residential sector are:
• 88.5% of dwellings are permanently inhabited.
• Nearly half of all homes (47.5%) are located in rural areas, meaning that Romania’s rural population
is above the European average.
• In rural areas, 95% of dwellings are individual family houses.
• In urban areas, 72% of dwellings are found in large blocks of flats, averaging almost 40 apartments
per block.
• Over 60% of the blocks of flats are 4 storeys high, while 16% are 10 storeys high.
• Private ownership is the dominant form of tenure, accounting for 84% of the total stock.
• Romania is unusual within the EU in having only a tiny proportion, 1%, of buildings in public
ownership; the remaining 15% are in some form of mixed ownership.
• Multi-family dwellings have an average heated area of 48 m², which compares with 73 m² for single
family dwellings.
According to data from the 2011 Census, while Romania’s population decreased by more than 2 million
registered inhabitants since 2002 to 19 million, the residential floor area has been increasing, standing at
559 million m². This can be partially explained by the general trend towards larger dwellings – historically,
the average living floor area per inhabitant was around 55 m². There is increasing sprawl in Romanian
cities, due to construction of individual dwellings in suburban areas.
In terms of age profile, most residential buildings were constructed in the latter half of the 20th century,
with the period 1961-1980 standing out as the most significant construction time, as illustrated in
figure 5. The vast majority of Romanian dwellings were constructed at a time when no specific thermal
requirements were set, or when such requirements were not demanding. This can be seen in figure 6.
From an energy use point of view, therefore, there remains a very significant potential for the existing
stock to be brought up to higher energy performance standards, which underlines the importance of an
ambitious building renovation strategy for Romania.
More than 90% of the total residential floor area was built before 1989. Heating energy represents around
55% of the overall energy use in apartments and up to 80% in individual houses. Depending on the
climatic zone, a single family house consumes on average 24% more energy per m² than a multi-family
dwelling10.
Figure 5 – Age profile of residential building stock (source: BPIE’s Data Hub)
Breakdown of the building stock by age bands
180000000
160000000
140000000
Total floor area (m²)
120000000
100000000 Multi family houses
80000000
60000000 Single family houses - row houses
40000000
20000000 Single family houses - detached
0 houses
BPIE estimation based on survey carried out for BPIE report “European Buildings under the Microscope”, 2011.
10
20 | Renovating RomaniaFigure 6 – Thermal performance standards (U-value) for walls for different building types and age
bands (source: BPIE’s Data Hub)
U values of different components
1,8
Residential
1,6 Single family houses
Single family houses - detached houses
1,4 Single family houses - row houses
Multi family houses
1,2 Multi family houses - small
Multi family houses - large
Wall (W/(m² K))
1 Multi family houses - apartment towers
Other residential buildings
0,8 Offices
Educational buildings
Hospitals
0,6
Hotels & Restaurants
Sport facilities
0,4
Wholesale and retail trade
Other non-residential buildings
0,2
Other
Hotels
0
< 1920 1921 - 1940 1941 - 1960 1961 - 1980 1981 - 2000 2001 - 2010 > 2011
Energy Carriers
There are three main heat sources in Romanian housing: biomass, gas and district heating (fig 7). Three
out of every four single family houses have some form of biomass heating system, while over half of
multi-family buildings are connected to district heating networks. Virtually all (92%) of the energy
supplied by district heating is supplied by combined heat and power (CHP) systems11. Just over half of
the energy supplied to district heating systems is natural gas, with the remainder provided by oil (26%)
and coal (20%).
Figure 7 – Source of heating in residential sector (source: BPIE’s Data Hub)
Euroheat and Power Statistics http://www.euroheat.org
11
Renovating Romania | 21In the residential sector, thermal energy is used for heating, domestic hot water and cooking. Speaking
in general, the efficiency of this thermal energy use is only 43% (63% in Bucharest)12. In rural areas, room
heating is still largely used, mainly by wood burned in stoves. In urban areas, around 1.5 million dwellings
are connected to district heating systems, though over the last decade there has been a continuous trend
of disconnections from district heating (DH) and shifting to individual apartment heating systems on gas.
This could be the result of numerous problems with old DH systems: low efficiency (with 30% improvement
potential); high carbon intensity and rising prices (also due to an on-going process of reducing heating
subsidies)13. There is a general lack of metering systems in blocks of flats and at individual level. However,
there is an ongoing programme of improvements to the DH network and on heating metering and controls,
which has reduced the number of disconnections from the network (cf. Romania NAPEE ).
The table below, adapted from Euroheat & Power (www.euroheat.org/Romania-90.aspx), provides the
main statistics for use of district heating in Romania.
TABLE 3 – Key District Heating Indicators for Romania - 2011 unless otherwise indicated (source:
Euroheat & Power)
Energy supply composition for District Heat generated
Recycled heat incl. indirect use of Renewables 91%
Direct Renewables 0.31%
Others 8.3%
Total District Heat sales 49,095 TJ
(Total District Heat sales in 2007) 56,110 TJ
Annual District Heat sales turnover 713.84 M €
Share of citizens served by District Heating 19%
Trench length of District Heating pipeline system 6,055km
(Trench length of District Heating pipeline system in 2007) 7,611 km
Average District Heating price 14.54 €/GJ
Number of District Heating utilities 89
Total installed District Heating capacity 13,619 MWth
Total investment in District Heating 168 M€
Estimated employment figures in District Heating sector 19,360
District heated floor space 55,590,000 m2
New connections to District Heating 166,000
CO2 emissions per TJ of District Heat generated 81.7 Ton CO2/TJ
Total heat demand 243,367 TJ
Total share of CHP of national electricity production 10.9%
CHP heat autoproduction 89 TJ
Average energy use of buildings per m 2
0.883 GJ/m2
See TABULA project website: http://www.building-typology.eu/
12
11 PWC Romania: Provocari si Oportunitati pentru sistemul de furnizare centralizata a energiei termice din Romania, June 2011, available at: http://www.
13
pwc.com/ro/en/publications/assets/assets_2011/Provocari_Oportunitati_Energie_Termica.pdf
22 | Renovating RomaniaFigure 8 – District heating energy supply 2007-2011, by customer type
60000
50000
40000
Services
30000
TJ
Industry
Residential
20000
10000
0
2007 2009 2011
Diffusion of air conditioning has been steadily increasing in the residential sector: the share of dwellings
with air conditioning increased from 0.4% in 2000 to 5% in 2010. On the other hand, there has been
an increase in the installation of domestic renewables, which is mainly supported by the CASA VERDE
programme14. According to EurObserver renewable energy barometer15, the total installed solar-thermal
collectors area in 2010 in Romania was at around 144,000 m², a 38.4% growth from 2009. Most of this
solar-thermal capacity is installed in commercial buildings (including hotels) and to a lesser extent in
residential buildings. However, there is no public data available concerning the actual sales and installed
solar-thermal power in Romanian buildings.
There are significant problems in the condition of buildings due to neglect of repairs, in particular, in
urban high‐rise apartment buildings and in part of the rural single‐family homes16. Some 58% of the
existing blocks of flats (2.4 million apartments) built before 1985 are in need of rehabilitation and
thermal modernisation.
Non-residential
Non-residential buildings represent 18% of total floor area. This includes most of Romania’s public
buildings17, amounting to some 5% of the total building stock. Public administration, educational and
commercial buildings together represent approximately 75% of non-residential energy use (fig 9), each
representing 20-25% of the total.
14
http://www.casa-verde.ro/
15
12 EurObserv’ER (2011): The state of renewable energy in Europe. 11th EurObserv’ER Report, available at: http://www.energieREnouvelables.org/
observer/stat_baro/barobilan/barobilan11.pdf
16
UN ECE 2001; Trainrebuild 2012
17
Publicly owned housing is almost non-existent in Romania
Renovating Romania | 23Figure 9 – Distribution of final energy consumption by type of non-residential building (source:
INCD URBAN-INCERC)
Measured in thou toe
Education Health
Tourism Commerce
Postal services/telecomm. Public administration
24% 26%
14%
7% 21% 8%
In terms of energy performance, educational buildings (354 kWh/m2 per annum) stand out as the highest
consumers of energy, with other sectors in the range 200-250 kWh/m2 p.a. (fig 10). Table 4 provides the
thermal performance (U-value) ranges for different building types.
Note that these figures represent total energy use, inclusive of appliances and other plug loads. For
modelling purposes, described in section 6, only the so-called “regulated” energy loads are included in
the calculation of costs and benefits. Regulated loads are those covered by the Energy Performance of
Buildings Directive, and include heating, cooling, ventilation, hot water and fixed lighting. The energy use
of appliances and other plug loads is covered by other policy areas, notably eco-design and sustainable
procurement.
This value is to be understood as a maximum value.
30
31
These values are to be understood as maximum values. For the hourly demand individual schedules for every zone have been considered.
24 | Renovating RomaniaFigure 10 – Energy performance and CO2 emissions by building sector (source: INCD URBAN-
INCERC)
Average energy performance [kWh/m2 yr]
400
350
300
250
200
150
Heat Recovery
Opaque Shell
100
Collector for
Description
50
Variants
Window
U-Value
U-value
Solar
DHW
Brief
Rate
0
Dwellings Education Commercial Tourism Others
(+offices)
Average CO2 emission index [kgCO2/m2 yr]
90
80
70
60
50
40
30
20
10
0
Dwellings Education Commercial Tourism Others
(+offices)
32
Passive house standard: major shell improvements, no heat bridges, airtight construction, highly efficient mechanical ventilation (> 90%), useful heating
and cooling demand < 15 kWh/m²a
33
V1 and V2 will be considered to have a low temperature floor heating system to get a better system efficiency
Renovating Romania | 25TABLE 4 – Energy performance characteristics of non-residential buildings (source: INCD URBAN-
INCERC)
Building type Thermal performance Final energy use
U-valie [W/(m2K0} (kWh/m2yr)
Heat Recovery
Opaque Shell
Collector for
Description
Vertical Horizontal
Variants
Window
U-Value
U-value
Solar
DHW
Offices 0.70 - 1.50 0.35 - 1.30 120 - 250
Brief
Rate
Education, culture 0.70 -1.50 0.35 - 1.30 200 - 350
Health 0.70 - 1.50 0.35 - 1.30 200 - 400
Tourism 0.70 - 1.50 0.35 - 1.30 150 - 300
Wholesale and retail trade 0.70 - 1.50 0.35 - 1.30 150 - 300
services
Energy prices
Romania currently enjoys among the lowest price of energy across the EU, due to subsidies on both electricity
and gas. The comparison is illustrated in figures 11 and 12 below for electricity and gas respectively18.
Figure 11 – Electricity price comparison for households across the EU - 2011 (source: Eurostat)
0,30
0,25
0,20
0,15
0,10
0,05
0,00
Croatia
Italy
Cyprus
Ireland
Finland
Greece
Norway
Portugal
Malta
Denmark
Latvia
Euro area (2)
Austria
France
Poland
Estonia
Slovakia
Netherlands
Romania
Germany
Turkey
Sweden
Slovenia
Montenegro
Spain
Luxembourg
Lithuania
Bulgaria
Hungary
Czech Republic
EU-27 (2)
Belgium
United Kingdom
VAT
Taxes and levies other than VAT
Basic price (without taxes and levies)
http://epp.eurostat.ec.europa.eu/statistics_explained/index.php/Energy_price_statistics
18
26 | Renovating RomaniaFigure 12 – Gas price comparison for households across the EU - 2011 (source: Eurostat)
Solar Collector
Heat Recovery
0,12 Opaque Shell
Light system
Description
0,10
for DHW
External
Variants
Window
Window
shading
U-Value
U-value
0,08
Share
Brief
Rate
0,06
0,04
0,02
0,00
Latvia
Austria
France
Estonia
Slovakia
Romania
Sweden
Slovenia
Luxembourg
Spain
Lithuania
Croatia
Italy
Bulgaria
Hungary
EU-27
Ireland
Turkey (2)
Belgium
Portugal
Denmark
Euro area
Poland
Netherlands
Germany
United Kingdom
Czech Republic
Basic price (without taxes and levies)
Taxes and levies other than VAT
VAT
Electricity price regulation continues to exist for both household and industrial customers. A roadmap
was adopted by the Romanian government in March 2012 to phase out regulated electricity prices for
non-household customers by the end of 2013 and for household customers by the end of 2017. However,
regulated prices remain below market prices, reducing the incentive to adopt energy saving measures.
Almost all of the approximately three million gas consumers in Romania fall under the regulated
segment, where prices are set by the regulator rather than being determined by market forces. A
roadmap was adopted by the Romanian government in June 2012 to phase out regulated gas prices for
non-household customers a year later than for electricity, namely by the end of 2014 and for household
customers by the end of 2018.
The share of network costs in Romanian household prices was the highest in the EU-27 in 2010 (60.2%),
while energy and supply costs accounted for only 39.8%.
It is to be expected that energy prices will rise in Romania over the coming years such that in due course,
it is likely that prices will approximate to the European average, though it may be many years before this
position arises. As discussed in the next section, for modelling purposes, we have assumed price parity
between the EU average and Romania is achieved by 2050.
ANRE19 will develop a price comparison tool and set up a protection scheme for vulnerable customers.
The Energy Act defines the concept of vulnerable consumers, which includes residential consumers who,
for reasons such as illness or age and by decision of the government, benefit from subsidies and are
ensured connection to the electricity supply service. In 2010, 1.2 million consumers out of a total of 8.3
million benefited from a social tariff.
http://www.anre.ro/
19
Renovating Romania | 27In order to gain an overview of the technical and economic potential for renovating Romania’s building
stock, BPIE utilised its model that was developed to underpin the analysis of the EU renovation potential, as
published in “Europe’s Buildings under the Microscope”20. The model is described below.
Overview of the Renovation Model
A renovation model has been developed which allows scenarios to be examined that illustrate the im-
pact on energy use and CO2 emissions of different rates (i.e. percentage of buildings renovated each
year) and depths of renovation (i.e. level of energy achieved) in the residential and non-residential build-
ing sectors up to 2050. The model allows a number of scenarios to be tested to illustrate the financial,
economic, environmental, employment and energy use impacts of different rates of uptake and depth
of building renovation. In particular, the scenarios assess the following outcomes, both annually and in
total:
• Energy saved;
• CO2 emission reductions;
• Total investment required to install renovation measures;
• Energy cost savings;
• Employment impact – the number of full time equivalent jobs created over the period to 2050;
• Cost-effectiveness indicators:
◊ Internal rate of return (IRR) - based on the net saving each year (i.e. cost saving less investment
required in a given year);
◊ Net saving to consumers - the difference between lifetime energy cost savings and lifetime
investment. Both figures are discounted to give net present values;
◊ Net saving to society, including the value of externalities - the sum of the lifetime energy cost
savings and value of externalities, less the lifetime investment. Both figures are discounted by the societal
discount rate;
◊ Carbon abatement cost – net lifetime societal savings divided by the lifetime carbon savings. A
negative figure indicates a net benefit per ton of CO2 saved.
Initial Data and Modelling Assumptions
The model allows different input data for four building types:
• Single-family houses (SFH)
• Multi-family houses (MFH),
• Public buildings, (Government buildings make up 6% of all non-residential buildings21.)
• Commercial and industrial buildings.
There are around 1 million abandoned houses in Romania22, consequence of strong migration and
emigration trends in the recent years. It is considered that the abandoned housing stock does not consume
energy and is thus excluded from the model. Our assumption is that, going forward, an additional 0.1% of
the existing stock will be abandoned each year, as people continue moving from rural areas or deprived
cities in search of employment and higher income in the major cities or abroad. Many dwellings being
abandoned are located in rural areas, where there is a high proportion of renewable energy use (mostly
firewood) and new build is happening in urban areas, which mostly depend on district heating or the gas
network. There is thus reason to believe this will influence the evolution of the energy mix, causing a slower
decarbonisation than in the rest of the EU.
20
http://bpie.eu/eu_buildings_under_microscope.html
21
Romania cost optimality study
22
2nd NAPEE - Energy Efficiency Action Plan Romania EN – annex 2.4 p. 122
28 | Renovating RomaniaYou can also read