Budget Warrnambool City Council
←
→
Page content transcription
If your browser does not render page correctly, please read the page content below

Warrnambool City Council
Budget
2020-2021
Contents

Mayor and CEO introduction                    3

Link to the Council Plan                      7

Services and service performance indicators   10

Financial statements                          24

Notes to the financial statements             30

Financial Performance Indicators              50

Schedule of fees and charges                  52
Introduction

Warrnambool City Council, along with the rest of the world, is preparing for a future of unprecedented
uncertainty, this is reflected in the preparation of our 2020-2021 Budget.

The Local Government Act requires that Council prepare a Budget for each financial year and to undertake
a formal process of preparing, advertising and calling for submissions before a finalised Budget is formally
adopted by Council by June 30 each year. In acknowledgement of the extraordinary circumstances
Councils have been allowed to extend this adoption to August 31, 2020.

Whilst understanding the fiscal damage this pandemic has wreaked on our local economy we must prepare
and act for a Covid-19-free future. We must create a budget that allows for the downturn in service but that
seeks to both stimulate and support our municipality into the future.

The draft Budget remains aligned to the vision in the Council Plan 2017-2021 and to the objectives in the
long-term community plan, Warrnambool 2040. This Budget acknowledges the impact of the pandemic on
our provision of services to the community and seeks to balance the reality of our current circumstances
with a need to still maintain services and infrastructure as well as deliver projects and services that are
needed and valued by our community.

We recommend that the Budget is read in conjunction with the Council Plan and we encourage you to
provide feedback to Council on the draft Budget.

The vision for the four-year life of the Council Plan is for Warrnambool to be a Cosmopolitan City by the
Sea. To support the vision Council developed the following five key objectives:

   1. Sustain, enhance and protect the natural environment

   2. Foster a healthy, welcoming city that is socially and culturally rich

   3. Maintain and improve the physical places and visual appeal of the city

   4. Develop a smarter economy with diverse and sustainable employment

   5. Practice good governance through openness and accountability while balancing aspirations with
      sound financial management

These objectives align with the four key long-term visions contained within the community plan,
Warrnambool 2040.

The four visions are:

   1. People: in 2040 Warrnambool will be a city where all people thrive.

   2. Environment: in 2040 Warrnambool will be most sustainable regional city in Australia.

   3. Place: in 2040 Warrnambool will be Australia’s most liveable regional city.

   4. Economy: in 2040 Warrnambool will be Australia’s most resilient and thriving regional economy.

The draft budget details the resources required over the next financial year to fund the services that remain
operating that we provide to our community of 35,000 residents.
These services range from those which are about directly caring for people through facilities and programs
including kindergartens, childcare centres, and home support services, to services which maintain or
enhance our environment and surroundings including waste collection and our roads and footpath
management maintenance.
The budget also includes details of a balanced program of capital expenditure including allocations to
improve and renew our City’s physical infrastructure, buildings and operational assets. We will use these
capital projects to stimulate local employment and purchasing and leverage opportunities of funding from all
levels of government to deliver for the future needs of our community.
Council’s budget reflects a significant cut in services directly affected by the Pandemic and sadly
encompasses stand downs to many valuable staff until we are able to reopen these services. These staff
continue to be an important part of our future for Warrnambool’s community.
Over 2020-2021, the Council will develop and utilise its existing resources and a community and business
stimulus\recovery fund to develop and deliver initiatives to see our community regrow at the other side of
this pandemic.
The allocation in 2020-2021 for community and business support in the wake of the coronavirus pandemic
is $1.951 million.
This figure is inclusive of an unallocated $450,000 of community and business support funds and the
focussing of existing resources to community and business stimulus and recovery efforts.
The community and business support component of the budget for 2020/21 includes the provision of the
following resources of Council to be focused on our recovery and stimulus efforts for the community:
• Community and Business Support and Stimulus Fund - $450,000
• Small Infrastructure Fund 2020/21 - $891,000
• Economic development unit - $545,000
• Community development grants - $65,000
Council will review these efforts during the year and set a revised budget if required to best meet the needs
of our local community and business. Council will roll out its recovery efforts in stages to determine where
the areas of greatest need exist, filling gaps and leveraging on the efforts of all levels of government to
maximise our recovery efforts for the community.
The budget includes a rate increase of 2.0 per cent, reduced from the 4.5% allowed for by the Essential
Services Commission for this year. It also includes a reduction in the waste management charge meaning
on the average property values rates and charges next year’s forecast increase will be 1.2%.
Council will continue to advocate for support from other levels of government to improve the economic
outlook for the municipality particularly in looking to attract stimulus funding at the end of this crisis and to
ensure the impact on the region is recognised and information on support services to businesses and
individuals is disseminated.
Council has proposed a substantial capital works program with an emphasis on asset renewal. We have
allocated funding of $18.5 million for asset renewals, upgrades and expansions.
Capital works highlights:
Road renewals - $3.8 million Completion of the Lake Pertobe Master Plan implementation (Stage I) - $2.9 million
Completion of the Reid Oval - $11 million
Library and Learning Centre - $1.3m
Energy saving initiatives - $1 million
Community Support Fund - $810,000
Beach access renewal - $180,000
As part of Warrnambool's response to the global recycling issues, Council has implemented FOGO, a trial
of kerbside glass collection and glass collection points. This is reducing Council's risk exposure to the
recycling market. These measures are also helping Council to drive down the cost of the waste
management fee. It is proposed to by 2.79% or $11 per property to $379.09.
This budget sees the average residential rate bill increase to $2,053 from $2,029 in 2019-20.
2019-2020 Increase/(decrease) 2020-2021 % increase/decrease
Average residential rates $1,367 $29 $1,397 2.0%
Municipal charge $272 $6 $277 2.0%
Waste management fee $390 ($11) $379 (2.8%)
Average residential rates and
$2,029 $23 $2,053 1.2%
charges
This Budget projects an underlying deficit of $1.5 million for 2020/21 after adjusting for capital grants and
contributions.
The main contribution to this underlying deficit is a reduction in the operating income form impacted
services.
The underlying deficit is projected to be offset by the deferral of non-essential or non-strategic elements of
our capital program.
Key figures
Total revenue: $76.6 million (2019-20 forecast = $86.6 million)
Total expenditure: $73.4 million (2019-20 forecast = $78.4 million)
Accounting surplus/(deficit): $3.2 million (2019-20 forecast = $8.2 million)
Underlying operating result: deficit of $1.9 million (2019-20 forecast = Deficit of $1.4 million)
(Refer Income Statement in Section 3.1)
(Note: Underlying operating result is an important measure of financial sustainability as it excludes income
which is to be used for capital, from being allocated to cover operating expenses)
This is the net funding result after considering the funding requirements to meet loan principal repayments
and the reserve transfers.
Total Capital Works Program of $18.5 million (2019-20 forecast = $25.4 million)
$10.4 million from Council operations and reserves
$4.7 million from borrowings
$3.3 million from grants
$0.04 million from contributions
(Refer Statement of Statement of Capital Works in Section 3.5)Budget influences The preparation of this year’s budget is primarily a response influenced by the advent of the Corona Virus Covid-19 Pandemic and the associated impacts to services and the community. Council continues to balance the needs of the community and financial sustainability. Pressure to maintain infrastructure and maintain service levels constantly challenges the organisation to find more efficient and innovative methods to deliver services. Councils across Australia raise approximately 3.5% of the total taxation collected by all levels of Government in Australia. In addition Councils are entrusted with the maintenance of more than 30% of the all Australian public assets including roads, bridges, parks, footpaths and public buildings. This means that a large proportion of Council’s income must be allocated to the maintenance and replacement of these valuable public assets in order to ensure the quality of public infrastructure is maintained at satisfactory levels. Cr Tony Herbert Mayor Peter Schneider Chief Executive Officer
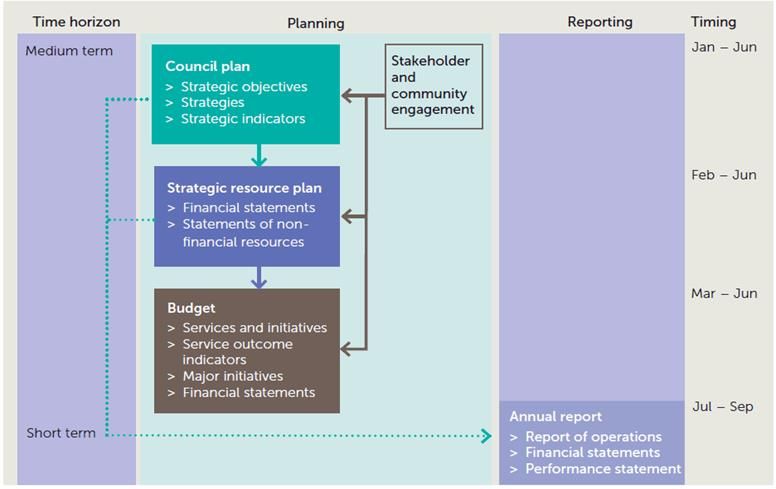
Link to the Council Plan

This section describes how the Annual Budget links to the achievement of the Council Plan within an
overall planning and reporting framework. This framework guides the Council in identifying community
needs and aspirations over the long term, medium term (Council Plan) and short term (Annual Budget) and
then holding itself accountable (Annual Report).

Legislative Planning and accountability framework

The Strategic Resource Plan, part of and prepared in conjunction with the Council Plan, is a rolling four-
year plan that outlines the financial and non-financial resources that Council requires to achieve the
strategic objectives described in the Council Plan. The Annual Budget is framed within the Strategic
Resource Plan, considering the services and initiatives which contribute to achieving the strategic
objectives specified in the Council Plan. The diagram below depicts the planning and accountability
framework that applies to local government in Victoria.

Source: Department of Environment, Land, Water and Planning

Feeding in to the above, Council has a long term plan which articulates a community vision, mission and
values. The Council Plan is prepared with reference to Council's long term Community Plan.

The timing of each component of the planning framework is critical to the successful achievement of the
planned outcomes.
Key planning considerations

Service level planning

Although councils have a legal obligation to provide some services— such as animal management, local
roads, food safety and statutory planning—most council services are not legally mandated, including some
services closely associated with councils, such as libraries, building permits and sporting facilities.
Further, over time, the needs and expectations of communities can change. Therefore councils need to
have robust processes for service planning and review to ensure all services continue to provide value for
money and are in line with community expectations. In doing so, councils should engage with communities
to determine how to prioritise resources and balance service provision against other responsibilities such
as asset maintenance and capital works.

Our purpose

Our Vision is for Warrnambool to be a Cosmopolitan City by the Sea.

A city that is open, welcoming, inclusive and diverse.

Organisational values

Accountability
We will be responsible and take ownership for our actions and decisions by being ethical, honest and
transparent.

Collaboration
We will foster effective relationships through engagement, communication and cooperation; support in
decisions and outcomes for the benefit of all.

Respectfulness
We will treat everyone with dignity, fairness and empathy; providing them with the opportunity to share
views and to be heard.

Progressiveness
We will evolve and grow by encouraging development, change and continuous improvement in everything
that we do.

Wellbeing
We will commit to providing a safe and healthy workplace that promotes staff engagement, performance
and achievement allowing all employees to flourish for the benefit of themselves and the organisation.
Strategic objectives

Council has established five strategic objectives to deliver the vision of the Council Plan.

They are:

1 Sustain, enhance and protect the natural environment
Council will work to protect our coast and waterways, preparing for climate change, minimising waste and
encouraging environmentally sustainable business

2 Foster a healthy, welcoming city that is socially and culturally rich
Council will encourage people to be healthy and well, to engage in learning, to be involved in cultural
activities, to be connected and participating in the community, to be resilient in emergencies and
maintaining a city that is a healthy and safe place to live and study.

3 Maintain and improve the physical places and visual appeal of the city
Council will create more physical connections throughout the city, building more fit-for-purpose
infrastructure, creating greater amenity and ease of movement and being proud of what we have within our
municipality.

4 Develop a smarter economy with diverse and sustainable employment
Council will foster population growth, a sustainable local economy, a more beneficial visitor economy and
more modern infrastructure.

5 Practice good governance through openness and accountability while balancing aspirations with
sound financial management
Council will advocate for the community and region; it will practice transparent decision-making while
delivering services efficiently and effectively.
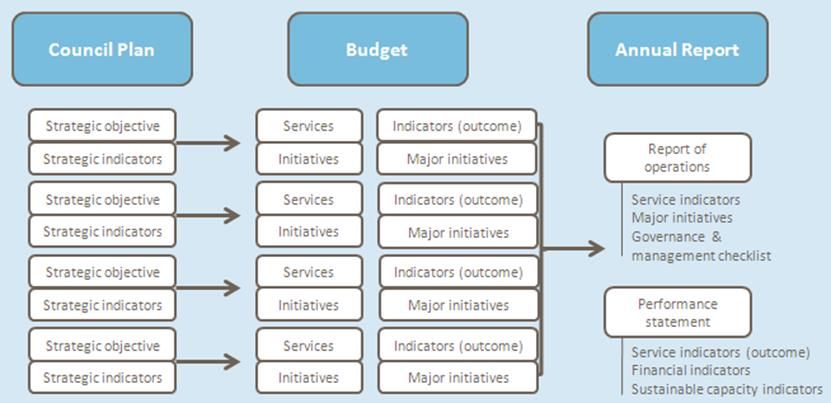
2. Services and service performance indicators

This section provides a description of the services and initiatives to be funded in the Budget for the 2020/21
year and how these will contribute to achieving the strategic objectives outlined in the Council Plan. It also
describes several initiatives and service performance outcome indicators for key areas of Council’s
operations. Council is required by legislation to identify major initiatives, initiatives and service performance
outcome indicators in the Budget and report against them in their Annual Report to support transparency
and accountability.
The relationship between these accountability requirements in the Council Plan, the Budget and the Annual
Report is shown below.

Source: Department of Environment, Land, Water and Planning
Strategic Objective 1: Sustain, enhance and protect the natural environment

Warrnambool occupies a unique position as Victoria’s largest coastal city outside Port Phillip Bay.
Geographically the city is perched on gentle hills and flats by the stunning Lady Bay and between two
important South West rivers, the Hopkins and the Merri.

Dunes along Lady Bay have been revegetated over the years by willing volunteers while similar efforts
have been made to revegetate the banks of the Merri River to restore health to this waterway which is
home to a growing number of platypus.

Each year thousands of people walk along a sealed promenade that meanders through the dunes the
length of Lady Bay.

Warrnambool is renowned for using maremma dogs to protect a colony of Little Penguins which were
nearly wiped out through predation by foxes. From a population of fewer than 10 penguins the number has
recovered to more than 150.

Beyond Lady Bay and its famous Breakwater lies the Southern Ocean. A large section of water off the
Breakwater lies within a marine park, which protects the marine flora and fauna.

Strategies to achieve Strategic Objective 1 are:
1.1 Protect and enhance our waterways, coast and land
1.2 Commit to being a carbon neutral organisation by 2040
1.3 Assess our climate change preparedness
1.4 Review options for managing waste
1.5 Educate and partner with the community on Council’s sustainability initiatives

The service categories to deliver these key strategic objectives are described below.

Services

                                                                              2018/19    2019/20   2020/21
                                                                               Actual   Forecast   Budget
 Service area        Description of services provided
                                                                                $'000      $'000     $'000

 Environmental       This service develops environmental policy,        Exp      504        598         580
 Management          coordinates and implements environmental
                                                                        Rev       11          5          6
                     projects and works with other services to
                     improve Council’s environmental                    NET      493        593         574
                     performance.
 Waste Management    This service provides kerbside collections         Exp     4,013      4,391     4,386
 & Street Cleaning   and processing of garbage, recycling and
                     Food Organics Green Organics (FOGO)                Rev       39         57          1
                     from all households and some commercial            NET     3,974      4,334     4,385
                     properties in Council. It also provides street
                     cleaning, leaf collection and street litter bins
                     throughout Council.

 Parks and Gardens   This service covers a range of areas such          Exp     4,293      4,378     4,419
                     as tree pruning, planting, removal, planning
                     and street tree strategies, management of          Rev      344        373         376
                     conservation and parkland areas, creeks            NET     3,949      4,005     4,043
                     and other areas of environmental
                     significance. Parks Management provides
                     management and implementation of open
                     space strategies and maintenance
                     programs.
Major initiatives
1) Continued replacement of current street lights with more energy-efficient LED lights.
2) Develop short and long-term options for recycling processing.
Other initiatives
3) Investigate options for waste to energy to reduce reliance on landfill.
4) Complete a Domestic Wastewater Management Plan.
Service Performance Outcome Indicators*
2019 2020 2021
Service Indicator Forecast
Forecast (similar
Actual (similar councils
councils ave.)
ave.)
Appearance of public areas Performance 79 74 74
Environmental sustainability Performance 61 63 63
Waste collection Satisfaction 162.81 132.01 132.01
Waste collection Service standard 4.49 4.6 4.6
Waste collection Service cost $111.26 $98.56 $98.56
Waste collection Service cost $59.15 $53.99 $53.99
Waste collection Waste diversion 47.78% 49.46% 49.46%
* refer to table at end of section 2.5 for information on the calculation of Service Performance Outcome
Indicators2.2 Strategic objective 2: Foster a healthy, welcoming city that is socially and culturally rich
A stroll through Warrnambool’s streets reveals some excellent street art, much of which has been added in
the past decade. The street art reflects a growing arts and culture scene in Warrnambool. Along with well-
established institutions such as the Council-owned Warrnambool Art Gallery and Lighthouse Theatre there
are private art galleries and an influential artists’ co-operative, the F Project.
Moyjil-Point Ritchie, at the mouth of the Hopkins River, contains evidence of human activity dating from at
least 40,000 years ago and possibly much earlier. Acknowledgement of the area’s rich indigenous history
and increasing the opportunities to recognise Warrnambool’s first people are important for Council.
Warrnambool is a university city, providing opportunities for students to come to the city from outside the
region to study – and for the region’s young people to obtain a qualification closer to home.
While the health and wellbeing of Warrnambool’s residents fares well on some measures (e.g. rates of
physical activity, volunteering and access to open space), like every community, there are issues which
require continued effort (e.g. educational attainment, family violence). Council’s health and wellbeing plan
details the priorities for action and sets the following objectives:
• Promote healthy lifestyles
• Seek equity, access, safety and inclusion for all
• Improve access to economic resources
Recreation is a significant part of the Warrnambool lifestyle and the city’s residents embrace many sporting
pursuits. A range of sports can be played competitively in the city and there are also opportunities for
people to be physically active in a non-competitive environment.
Strategies to achieve Objective 2 are:
2.1 Promote healthy lifestyles.
2.2 Increase participation, connection, equity, access and inclusion.
2.3 Increase community health and social connection.
2.4 Encourage and support participation in sport, recreation and physical activity.
2.5 Encourage and support more lifelong learning.
2.6 Engage a broader range of people in cultural activities.
2.7 Actively acknowledge of local Aboriginal culture.
2.8 Increase participation opportunities for disadvantaged members of the community.
The service categories to deliver these key strategic objectives are described below.
2018/19 2019/20 2020/21
Service area Description of services provided Actual Forecast Budget
$'000 $'000 $'000
Government funded programs aimed at Exp 444 280 125
Community
improving community participation,
Support Services
rural access programs and facilitation Rev 387 237 85
of migration to the South West and
volunteer programs. NET 57 43 40
This area provides a range of services Exp 3,685 3,869 3,725
Aged Services including meals on wheels, personal
care, respite, home maintenance, Rev 3,289 3,418 3,355
home care, adult day care and senior
citizens programs. NET 396 451 370This service provides family orientated Exp 8,274 8,525 8,387
Family Services support services including pre-schools,
maternal & child health, child care, Rev 7,412 6,924 6,638
counselling & support, youth services,
immunisation, family day care. NET 862 1,602 1,749
Provision of high-quality venues where Exp 2,774 2,451 1,760
Art and Culture people can see, present and explore
the arts, ideas and events provided at Rev 1,889 1,450 898
the Warrnambool Art Gallery and Light
House Theatre. NET 885 1,001 862
Exp 961 968 987
Library Services
Provision of quality library and
Rev - - -
information services to the community.
NET 961 969 987
Provision of sport, recreation and
Exp 494 556 510
cultural facilities, service and programs
Recreation
in response to identified community
Rev 113 9 -
need and to provide information and
advice to clubs and organisations
NET 381 547 510
involved in these areas.
The Arc and Aquazone provide premier
Exp 3,854 3,327 2,754
indoor community leisure facilities in
Leisure Centres
South West Victoria, providing
Rev 3,287 2,477 1,486
equitable and affordable access to a
wide range of aquatic and fitness
NET 567 850 1,268
activities.
Exp 274 284 296
Administrations of legislative
Health Services
requirements pertaining to public
Rev 175 184 178
health, immunisation and food
premises.
NET 99 100 118
Exp 1,238 1,173 1,019
Festivals and Delivers a range of promotions,
Events Group festivals and events along with
Rev 40 3 12
attracting events to the city to deliver
economic benefits.
NET 1,198 1,170 1,032
Major initiatives
1) Continue implementation of the Reid Oval Redevelopment Project.
2) Continue implementation of the Library and Learning Centre project in conjunction with South West
TAFE.
Other initiatives
3) Develop a proposal to develop a fit-for-purpose immunisation facility.
4) Implement the Merrivale Recreation Reserve irrigation, electrical upgrade and lighting improvement
project.Service Performance Outcome Indicators*
2019 2020 2020/21
Service Indicator Forecast
Forecast (similar
Actual (similar councils
councils ave.)
ave.)
Aquatic facilities
Service standard 2 2.13 2.13
(health inspections)
Aquatic facilities
Service standard 0 2.10 2.10
(reportable safety incidents)
Service cost (indoor
Aquatic facilities $2.07 $3.50 $3.50
facilities per visit)
Service cost (outdoor
Aquatic facilities $4.36 $9.82 $9.82
facilities per visit)
Aquatic facilities Utilisation 6.85 6.58 6.58
Food safety Timeliness 1 2.7 2.7
Food safety Service standard 99.64% 92.1% 92.1%
Food safety Service cost $323.35 $436.63 $436.63
Food safety Health and safety 84.21% 80.31% 80.31%
Library Utilisation 4.49 3.98 3.98
Library Resource standard 69.03% 61.36% 61.36%
Library Service cost $8.13 $7.72 $7.72
Library Participation 13.77% 12.47% 12.47%
Maternal and child health Satisfaction 96.07% 99.61% 99.61%
Maternal and child health Service standard 99.74% 100.77% 100.77%
Maternal and child health Service cost $75.13 $74.42 $74.42
Maternal and child health Participation 76.99% 76.6% 76.6%
Participation
Maternal and child health 73.24% 73.63% 73.63%
(Aboriginal children)
Recreational facilities Satisfaction 73 72 72
* refer to table at end of section 2.5 for information on the calculation of Service Performance Outcome
Indicators2.3 Strategic objective 3: Maintain and improve the physical spaces and visual appeal of the city
Warrnambool residents take great pride in the appearance of their city, both the built environment and the
open spaces. As key infrastructure is renewed or replaced and as new residential areas become available
Council considers the connectedness to facilities such as shops, parks and public transport services.
In recent years Council has worked on ensuring better connections for pedestrians and cyclists.
Shared pathways have been constructed along Moore and Koroit streets, pedestrian bridges have been
built over Russells Creek along Daltons Road over the Merri River at Wellington Street. Pedestrian bridges
at Lake Pertobe have also been progressively replaced and a number of bicycle lanes have been added to
streets in the city centre.
Population forecasts and improved geographic and social mapping allow us to plan more effectively for the
future. Council is committed to maintaining its road network and to obtain the best possible value through
shared contracts and new maintenance techniques. Considerable effort is now focused on the lifetime cost
of maintaining an asset through its serviceable life.
Strategies to achieve Objective 3 are:
1, Enhance movement in and around the city including better connections for cyclists and pedestrians.
2. Create a more vibrant city through activating high quality public places.
3. Build infrastructure that best meets current and future community needs.
4. Maintain and enhance existing Council infrastructure.
5. Advocate for better regional connections.
The service categories to deliver these key strategic objectives are described below."
2018/19 2019/20 2020/21
Service area Description of services provided Actual Forecast Budget
$'000 $'000 $'000
Asset This service prepares long term Exp 2,135 2,639 2,529
Maintenance maintenance management programs Rev 606 586 610
for Council’s property assets in an
integrated and prioritised manner in NET 1,529 2,053 1,919
order to optimise their strategic value
and service potential. These include
buildings, pavilions, roads, footpaths
and tracks and drainage.
Infrastructure This service prepares and conducts Exp 6,527 6,785 6,932
Services capital works and maintenance Rev 3,482 3,136 3,469
planning for Council’s main civil
infrastructure assets in an integrated NET 3,045 3,649 3,463
and prioritised manner in order to
optimise their strategic value and
service potential. These include roads,
laneways, car parks, foot/bike paths,
drains and bridges.
Regulatory Local laws enforcement including Exp 2,355 2,327 2,359
Services parking fees and fines, public safety, Rev 3,208 2,699 2,371
animal management and traffic control. NET (853) (372) (12)
Major initiatives
1) Investigate funding opportunities to renew heritage assets such as Cannon Hill armaments, the
Portuguese monument and Wollaston Bridge.
2) Develop “significant & heritage” tree renewal program.
Other Initiatives
3) Identify and regularly monitor condition of asset classes.
4) Complete a review of the City Centre Car Parking Strategy.Service Performance Outcome Indicators*
2019 2020 2020/21
Service Indicator Forecast
Forecast (similar
Actual (similar councils
councils ave.)
ave.)
Roads Satisfaction 67.89 33.9 33.9
Roads Condition 96.48% 97.4% 97.4%
Service cost
Roads $91.05 $89.59 $89.59
(reconstruction)
Service cost
Roads $8.18 $7.60 $7.60
(resealing)
Roads Satisfaction 58 57 57
Appearance of public areas Performance 79 74 74
Animal management Timeliness 1 2.87 2.87
Animal management Service standard 84.24% 48.54% 48.54%
Animal management Service cost $90.05 $70.28 $70.28
* refer to table at end of section 2.5 for information on the calculation of Service Performance Outcome
Indicators2.4 Strategic Objective 4: Develop a smarter economy with diverse and sustainable employment
Warrnambool functions as the commercial, health care and educational centre of the South West.
The city, which regularly records low unemployment levels, is a key service centre for a prosperous
agricultural region that produces a third of the Victoria’s dairy product, a third of its beef, a third of its lamb
and a quarter of its wool. The city has a population of 34,713 and this figure is forecast to approach 46,762
by 2036.
Warrnambool is a highly liveable coastal regional city with a strong track record of steady and sustained
population and economic growth. Warrnambool’s ongoing economic challenge is to create employment
opportunities in the City to keep pace with population growth. Based on population growth forecasts there
will be a need for our city to create more than 4,000 new jobs over the next 20 years.
Challenges remain around the frequency, speed and reliability of rail services between Warrnambool and
Melbourne however recent commitments from the Victorian Government have seen the addition of a fifth
daily return service.
The Princes Highway West presents similar challenges. The single lane highway requires an upgrade to
improve the quality of the road, safety and the speed at which traffic, including freight, can move.
Over the past five years considerable effort has gone in to planning for this increase with large tracts of
land rezoned to provide the city with a residential land supply of more than 25 years. Land near the eastern
entrance to the city was also rezoned to create a supply of industrial land.
The city offers excellent vocational and tertiary education options. It is home to the main campus of the
South West Institute of TAFE and Deakin University’s Warrnambool campus, provides opportunities for a
unique education experience with a university ranked in the top two per cent of the world’s universities.
The educational and employment opportunities within Warrnambool present opportunities to retain and
attract a diverse mix of people to the city to ensure it remains vibrant and cosmopolitan.
Strategies to achieve Objective 4 are:
1. Grow the city’s population through local economic growth.
2. Encourage more sustainable local business.
3. Enhance the visitor experience.
4. Advocate for an improve infrastructure including transport, services and digital infrastructure.
5. Create stronger links between education providers, business and industry.
The service categories to deliver these key strategic objectives are described below."
2018/19 2019/20 2020/21
Service area Description of services provided Actual Forecast Budget
$'000 $'000 $'000
Statutory Building This service provides statutory building Exp 235 312 275
Services services to the Council community Rev 164 133 75
including processing of building
permits. NET 71 179 200
City Strategy & This service prepares and processes Exp 1,309 1,437 1,440
Development amendments to the Council Planning Rev 302 269 265
Scheme. This service processes
NET 1,007 1,168 1,175
statutory planning applications,
provides advice and makes decisions
about development proposals which
require a planning permit, as well as
representing Council at the Victorian
Civil and Administrative Tribunal where
necessary. It monitors the Council’s
Planning Scheme, prepares major
policy documents and processes
amendments to the Council Planning
Scheme.
Warrnambool Provides a regional livestock marketing Exp 925 951 1,002
Livestock centre that meets the needs of the Rev 1,178 1,195 1,290
Exchange stock agents, buyers and producers. NET (253) (244) (288)Provides affordable holiday Exp 2,077 1,922 1,683
Holiday Parks accommodation that is modern, clean Rev 3,088 2,596 1,325
and well maintained in a family NET (1,011) (674) 358
orientation atmosphere.
A City and Regional tourism hub open Exp 1,957 1,817 1,396
Flagstaff Hill 364 days of the year that includes a Rev 1,212 1,000 560
Maritime Village Visitor Information Centre and Flagstaff
Hill Maritime Village Village which tells NET 745 817 836
the maritime history of the region during
the day and a ‘Shipwrecked’ Sound and
Light Laser show in the evening.
Exp 979 917 810
Economic Includes the industry and business
Rev 42 33 26
Development support, research and statistical
analysis and project development which NET 937 884 784
underpin economic development.
Exp 316 325 338
Warrnambool This service provides a regional Airport
that meets the needs of users and Rev 139 135 131
Airport
operates as a viable commercial NET 177 190 207
enterprise to the benefit of the region.
Exp 101 106 105
Port of
Council manages the Cities port facility Rev 101 100 102
Warrnambool
on behalf of the State Government. NET - 6 3
Major initiatives
1) Deliver the Designated Area Migration Agreement (DAMA) representative role for the Great South Coast
region and the Regional Certifying Body function on behalf of the Great South Coast.
2) Produce and implement a Strategic Plan for the Holiday Parks (Surfside & Shipwreck Bay).
Other initiatives
3) Deliver Social Housing Planning Project.
4) Deliver education and advisory services to business and industry to raise awareness of building
regulation requirements.
Service Performance Outcome Indicators*
2019 2020 2020/21
Service Indicator Forecast
Forecast (similar
Actual (similar councils
councils ave.)
ave.)
Tourism development Satisfaction 69 69 69
Population growth Satisfaction 64 62 62
Statutory planning Timeliness 37 56.26 56.26
Statutory planning Service standard 93.20% 77.75% 77.75%
Statutory planning Service cost $1,928.14 $2,717.54 $2,717.54
Statutory planning Decision-making 50% 63.38% 63.38%
* refer to table at end of section 2.5 for information on the calculation of Service Performance Outcome
Indicators2.5 Strategic objective 5: Practice good governance through openness and accountability while
balancing aspirations with sound financial management
Council will provide strong advocacy for the community and region. It will practice transparent decision-
making while delivering services efficiently and effectively. In delivering good governance Council has an
opportunity to share with the community the challenges for future service planning and provision though
increased engagement with the broader community.
Greater communication with the community also helps build community understanding of Council’s role and
provides insights into how engagement has helped inform decision-making.
Strategies to achieve Objective 5 are:
1. Provision of opportunities for the community to actively participate in Council’s decision-making through
effective promotion, communication and engagement.
2. Develop policies, strategic plans and processes to address local and regional issues, guide service
provision and ensure operational effectiveness.
3. Ensure financial sustainability through effective use of Council’s resources and assets and prudent
management of risk.
4. Deliver customer-focused, responsive services.
5. Foster an encouraging and positive staff culture.
The service categories to deliver these key strategic objectives are described below.
2018/19 2019/20 2020/21
Service area Description of services provided Actual Forecast Budget
$'000 $'000 $'000
Elected Council governs our City in Exp 597 597 547
Elected Council
partnership with and on behalf of our Rev 3 - 35
community, and encourages and NET 594 597 512
facilitates participation of all people in
civic life. Also includes contributions
made to community groups and
organisations.
Governance & Responsible for supporting good Exp 790 1,056 695
Risk governance within Council and Rev 56 309 2
implementing the Corporate Risk
NET 734 747 693
Management Framework, managing
Council’s insurance portfolio and
providing internal support on insurance
maters to council officers.
Manages and facilitates the Council Exp 998 996 1,081
Executive Services governance service, implementation of Rev 2 - -
Council decisions and policies and
NET 996 996 1,081
compliance with the legislative
requirements. Also includes media &
marketing.
Exp 1,752 1,725 1,733
Revenue & Provides a complete service in revenue Rev 941 881 837
Customer Service collection, property management and a
customer interface for various service NET 811 844 896
units and a wide range of transactions.
Includes contract valuation service.
Enables Council staff to have access to Exp 2,102 2,246 2,422
Information the information they require to efficiently Rev 44 6 -
Services perform their functions. Includes NET 2,058 2,240 2,422
software support, licensing and lease
commitments.
This service promotes and implements Exp 835 860 968
Organisation positive HR strategies to assist staff Rev - - -
Development reach their full potential and, at the
NET 835 860 968
same time are highly productive in
delivering Council’s services to the
community. Includes recruitment, staff
inductions and training.Provides corporate support to Council Exp 1,885 2,389 2,908
Corporate & and all divisions/branches in meeting Rev 3,972 2,172 3,822
Financial Services organisational goals and objectives and
NET (2,087) 217 (914)
includes banking and treasury
functions, loan interest, audit, grants
commission, insurances, overhead
costs including utilities and unallocated
grants commission funding.
Exp 10,936 11,500 12,650
Depreciation Depreciation is the allocation of Rev - - -
expenditure write down on all of
Council’s assets over there useful lives. NET 10,936 11,500 12,650
Major initiatives
1) Prepare for the 2020 Council elections.
2) Lead the delivery of an organisational structure review in order to remain a contemporary employer and
provide the community best value service delivery.
Other initiatives
3) Review the approach to Council meeting procedures to improve the accessibility and transparency of
meetings.
4) Review and update the Long-Term Financial Plan to ensure Council remains financially sustainable.
Service Performance Outcome Indicators*
2019 2020 2020/21
Service Indicator Forecast
Forecast (similar
Actual (similar councils
councils ave.)
ave.)
Governance Transparency 5.19% 10.97% 10.97%
Consultation and
Governance 47 54.5 54.5
engagement
Governance Attendance 90.68% 92.22% 92.22%
Governance Service cost $56,027.94 $46,847.05 $46,847.05
Governance Satisfaction 48 53 53
Financial performance Revenue level $1,920.58 $1,807.13 $1,807.13
Financial performance Expenditure level $4,319.97 $3,644.55 $3,644.55
Financial performance Workforce turnover 10.02% 12.76% 12.76%
Financial performance Working capital 171.63% 292.26% 292.26%
Financial performance Unrestricted cash 66.21% 72.41% 72.41%
Financial performance Asset renewal 110.26% 72.67% 72.67%
Financial performance Loans and borrowings 26.23% 28.77% 28.77%
Loans and borrowings
Financial performance 4.84% 4.10% 4.10%
(repayments)
Financial performance Indebtedness 16.79% 32.64% 32.64%
Adjusted underlying
Financial performance -1.03% 2.49% 2.49%
result
Financial performance Rates concentration 51.47% 58.77% 58.77%
Financial performance Rates effort 0.57% 0.61% 0.61%* refer to table below for information on the calculation of Service Performance Outcome Indicators
Calculation of Service Performance Outcome Indicators
Service Indicator Performance Measure Computation
Governance Satisfaction Satisfaction with Council Community satisfaction rating out of
decisions. (Community 100 with how Council has performed
satisfaction rating out of 100 in making decisions in the interests
with how Council has of the community
performed in making decisions
in the interests of the
community)
Statutory planning Decision making Council planning decisions [Number of VCAT decisions that did
upheld at VCAT. (Percentage not set aside Council’s decision in
of planning application relation to a planning application /
decisions subject to review by Number of VCAT decisions in
VCAT and that were not set relation to planning applications]
aside) x100
Roads Satisfaction Satisfaction with sealed local Community satisfaction rating out of
roads. (Community satisfaction 100 with how Council has performed
rating out of 100 with how on the condition of sealed local
Council has performed on the roads.
condition of sealed local roads)
Libraries Participation Active library members. [Number of active library members /
(Percentage of the municipal municipal population] x100
population that are active
library members)
Waste collection Waste diversion Kerbside collection waste [Weight of recyclables and green
diverted from landfill. organics collected from kerbside bins
(Percentage of garbage, / Weight of garbage, recyclables and
recyclables and green organics green organics collected from
collected from kerbside bins kerbside bins] x100
that is diverted from landfill)
Aquatic Facilities Utilisation Utilisation of aquatic facilities. Number of visits to aquatic facilities /
(Number of visits to aquatic Municipal population
facilities per head of municipal
population)
Animal Management Health and safety Animal management Number of successful animal
prosecutions. (Number of management prosecutions
successful animal management
prosecutions)
Food safety Health and safety Critical and major non- [Number of critical non-compliance
compliance notifications. notifications and major non-
(Percentage of critical and compliance notifications about a food
major non-compliance premises followed up / Number of
notifications that are followed critical non-compliance notifications
up by Council) and major non-compliance
notifications about food premises]
x100
Participation in MCH service by [Number of Aboriginal children who
Aboriginal children. attend the MCH service at least once
(Percentage of Aboriginal (in the year) / Number of Aboriginal
children enrolled who children enrolled in the MCH service]
participate in the MCH service) x1002.3 Reconciliation with budgeted operating result
Net Cost
Expenditure Revenue
(Revenue)
$’000 $’000 $’000
Sustain and enhance the natural environment 9,002 9,385 383
Foster a city that is socially and culturally rich 6,911 19,563 12,652
Maintain and improve the physical fabric of the city 5,370 11,820 6,450
Develop a modern economy with diverse and sustainable employment 3,275 7,049 3,774
Practice good governance through openness and accountability 5,658 10,354 4,696
Total 30,216 58,171 27,955
Expenses added in:
Depreciation 12,650
Amortisation - Right of use assets 200
Capitalised expenditure 2,830
Operational projects 45
Net loss on disposal of property, plant and equipment 901
Deficit before funding sources 46,842
Funding sources added in:
Rates and charges revenue 41,436
Grants - capital 4,559
Contributions - non monetary assets 4,000
Total funding sources 49,995
Operating (surplus)/deficit for the year (3,153)3. Financial Statements This section presents information in regard to the Financial Statements and Statement of Human Resources. The budget information for the year 2020/21 has been supplemented with projections to 2023/24 extracted from the Strategic Resource Plan. This section includes the following financial statements prepared in accordance with the Local Government Act 1989 and the Local Government (Planning and Reporting) regulations 2014. Comprehensive Income Statement Balance Sheet Statement of Changes in Equity Statement of Cash Flows Statement of Capital Works Statement of Human Resources Pending Accounting Standards The 2020-21 budget has been prepared based on the accounting standards applicable at the date of preparation. It has been updated to include the impact of AASB 16 Leases, AASB 15 Revenue from Contracts with Customers and AASB 1058 Income of Not-for-Profit Entities, but pending accounting standards that will be in effect from the 2020-21 financial year have not been considered in the development of the budget. Standards that are likely to impact on the 2020-21 financial statements, not considered in the preparation of the budget include: AASB 1059 Service Concession Arrangements: Grantors
Comprehensive Income Statement
For the four years ending 30 June 2024

                                                 Forecast                        Strategic Resource Plan
                                                            Budget
                                                   Actual                                    Projections
                                                  2019/20   2020/21   2021/22   2022/23         2023/24

                                         NOTES      $’000     $’000     $’000     $’000           $’000
Income
Rates and charges                     4.1.1        40,698    41,436    42,766    44,763          46,106
Statutory fees and fines              4.1.2         1,713     1,580     1,881     1,919           1,957
User fees                             4.1.3        14,747    11,332    18,614    18,966          19,345
Grants - Operating                    4.1.4        11,800    12,235    12,182    12,427          12,676
Grants - Capital                      4.1.4         8,211     4,559     2,914     1,992           1,701
Contributions - monetary              4.1.5         4,154      801       816       831              847
Contributions - non-monetary          4.1.5         4,000     4,000     4,500     4,500           5,000
Other income                          4.1.6         1,284      619       631       644              657
Total income                                       86,607    76,562    84,304    86,042          88,289

Expenses
Employee costs                        4.1.7        32,940    31,739    35,864    36,887          37,948
Materials and services                4.1.8        31,172    26,604    28,960    26,437          26,756
Depreciation                          4.1.9        12,250    12,650    13,050    13,450          13,850
Amortisation - Right of use assets    4.1.10
                                                     200       200       200       200              200
Bad and doubtful debts                               146       101       135       137              140
Borrowing costs                                      350       328       331       275              226
Other expenses                        4.1.11         838       886       904       922              940
Net gain/(loss) on disposal of
property, infrastructure, plant and                  552       901       991       682              772
equipment
Total expenses                                     78,448    73,409    80,435    78,990          80,832

Surplus/(deficit) for the year
                                                    8,159     3,153     3,869     7,052           7,457

Other comprehensive income
Net asset revaluation increment /(decrement)
                                                   10,000    10,000    10,000    10,000          10,000
Total comprehensive result
                                                   18,159    13,153    13,869    17,052          17,457
Balance Sheet
For the four years ending 30 June 2024
Forecast Strategic Resource Plan
Budget
Actual Projections
2019/20 2020/21 2021/22 2022/23 2023/24
NOTES $’000 $’000 $’000 $’000 $’000
Assets
Current assets
Cash and cash equivalents 3,604 1,677 2,157 2,312 1,593
Trade and other receivables 4,000 3,507 3,521 3,541 3,554
Other financial assets 8,000 9,000 10,000 11,000 13,000
Inventories 185 185 185 185 185
Other assets 1,300 1,310 1,320 1,330 1,340
Total current assets 4.2.1 17,089 15,679 17,183 18,368 19,672
Non-current assets
Trade and other receivables 10 8 6 4 2
Investments in associates, joint
arrangement and subsidiaries 650 665 680 695 710
Property, infrastructure, plant &
equipment 655,178 674,307 686,194 700,594 718,174
Right-of-use assets 4.2.4 1,400 1,200 1,000 800 600
Total non-current assets 4.2.1 657,238 676,180 687,880 702,093 719,486
Total assets 674,327 691,859 705,063 720,461 739,158
Liabilities
Current liabilities
Trade and other payables 4,300 4,400 4,500 4,600 4,700
Trust funds and deposits 1,150 1,130 1,150 1,170 1,130
Provisions 6,800 7,004 7,214 7,431 7,653
Interest-bearing liabilities 4.2.3 1,694 2,085 1,834 1,883 1,934
Lease liabilities 4.2.4 200 200 200 200 200
Total current liabilities 4.2.2 14,144 14,819 14,898 15,284 15,617
Non-current liabilities
Provisions 1,300 1,339 1,379 1,421 1,463
Interest-bearing liabilities 4.2.3 8,020 11,885 11,301 9,419 10,484
Lease liabilities 4.2.4 1,200 1,000 800 600 400
Total non-current liabilities 4.2.2
10,520 14,224 13,480 11,440 12,347
Total liabilities 24,664 29,043 28,378 26,724 27,964
Net assets 649,663 662,816 676,685 693,737 711,194
Equity
Accumulated surplus 239,882 244,054 247,761 254,974 262,149
Reserves 409,781 418,762 428,924 438,763 449,045
Total equity 649,663 662,816 676,685 693,737 711,194Statement of Changes in Equity
For the four years ending 30 June 2024
Accumulated Revaluation Other
Total
Surplus Reserve Reserves
NOTES $’000 $’000 $’000 $’000
2019/20 Forecast Actual
Balance at beginning of the financial year 631,504 232,679 392,485 6,340
Impact of adoption of new accounting standards
Adjusted opening balance 631,504 232,679 392,485 6,340
Surplus/(deficit) for the year 8,159 8,159 - -
Net asset revaluation increment/(decrement) 10,000 - 10,000 -
Transfers to other reserves - (1,235) - 1,235
Transfers from other reserves - 1,329 - (1,329)
Balance at end of the financial year 649,663 240,932 402,485 6,246
2020/21 Budget
Balance at beginning of the financial year 649,663 240,932 402,485 6,246
Surplus/(deficit) for the year 3,153 3,153 - -
Net asset revaluation increment/(decrement) 10,000 - 10,000 -
Transfers to other reserves 4.3.1 - (181) - 181
Transfers from other reserves 4.3.1
- - - -
Balance at end of the financial year 4.3.2
662,816 243,904 412,485 6,427
2021/22
Balance at beginning of the financial year 662,816 243,904 412,485 6,427
Surplus/(deficit) for the year 3,869 3,869 - -
Net asset revaluation
increment/(decrement) 10,000 - 10,000 -
Transfers to other reserves - (162) - 162
Transfers from other reserves - - - -
Balance at end of the financial year
676,685 247,611 422,485 6,589
2022/23
Balance at beginning of the financial year 676,685 247,611 422,485 6,589
Surplus/(deficit) for the year 7,052 7,052 - -
Net asset revaluation
increment/(decrement) 10,000 - 10,000 -
Transfers to other reserves - - - -
Transfers from other reserves - 161 - (161)
Balance at end of the financial year
693,737 254,824 432,485 6,428
2023/24
Balance at beginning of the financial year 693,737 254,824 432,485 6,428
Surplus/(deficit) for the year 7,457 7,457 - -
Net asset revaluation
increment/(decrement) 10,000 - 10,000 -
Transfers to other reserves - (282) - 282
Transfers from other reserves - - - -
Balance at end of the financial year
711,194 261,999 442,485 6,710Statement of Cash Flows
For the four years ending 30 June 2024
Forecast
Budget Strategic Resource Plan Projections
Actual
2019/20 2020/21 2021/22 2022/23 2023/24
Notes $’000 $’000 $’000 $’000 $’000
Inflows Inflows Inflows Inflows Inflows
(Outflows) (Outflows) (Outflows) (Outflows) (Outflows)
Cash flows from operating activities
Rates and charges 39,791 41,504 42,322 44,300 45,626
Statutory fees and fines 1,713 1,580 1,881 1,919 1,957
User fees 16,222 12,465 20,475 20,862 21,280
Grants - operating 20,010 16,794 15,096 14,419 14,378
Grants - capital
Contributions - monetary 4,570 881 898 915 932
Interest received 284 284 289 295 301
Trust funds and deposits taken
- - 20 20 -
Other receipts 1,100 354 376 384 392
Net GST refund / payment (1,616) (1,734) (835) (867) (1,154)
Employee costs (31,858) (31,496) (35,613) (36,629) (37,682)
Materials and services (33,309) (26,504) (28,860) (26,337) (26,656)
Short-term, low value and variable lease
payments
Trust funds and deposits repaid (49) (20) - - (40)
Other payments (922) (975) (994) (1,014) (1,035)
Net cash provided by/(used in) 4.4.1
operating activities 15,936 13,133 15,055 18,267 18,299
Cash flows from investing activities
Payments for property, infrastructure, plant and
equipment (23,076) (18,457) (12,890) (15,492) (18,408)
Proceeds from sale of property, infrastructure,
plant and equipment 720 471 481 490 500
Payments for investments (9,000) (14,000) (14,000) (14,000) (14,000)
Proceeds from sale of investments 13,000 13,000 13,000 13,000 12,000
Net cash provided by/ (used in) 4.4.2
investing activities (18,356) (18,986) (13,409) (16,002) (19,908)
Cash flows from financing activities
Finance costs (350) (328) (331) (275) (226)
Proceeds from borrowings 1,400 5,950 1,250 - 3,000
Repayment of borrowings (1,723) (1,694) (2,085) (1,834) (1,883)
Interest paid - lease liability
Repayment of lease liabilities
Net cash provided by/(used in) 4.4.3
financing activities (673) 3,928 (1,166) (2,109) 891
Net increase/(decrease) in cash &
cash equivalents (3,093) (1,925) 480 156 (718)
Cash and cash equivalents at the beginning of
the financial year 6,696 3,603 1,678 2,158 2,314
Cash and cash equivalents at the end of
the financial year 3,603 1,678 2,158 2,314 1,596Statement of Capital Works
For the four years ending 30 June 2024
Forecast
Budget Strategic Resource Plan Projections
Actual
2019/20 2020/21 2021/22 2022/23 2023/24
NOTES $’000 $’000 $’000 $’000 $’000
Property
Land - 480 - - -
Total land - 480 - - -
Buildings - - - - -
Building improvements 4,325 3,094 2,062 2,035 4,686
Total buildings 4,325 3,094 2,062 2,035 4,686
Total property 4,325 3,574 2,062 2,035 4,686
Plant and equipment
Plant, machinery and equipment 828 1,129 1,151 1,174 1,198
Computers and telecommunications 373 135 317 322 328
Paintings and exhibits 88 75 75 75 75
Total plant and equipment 1,289 1,339 1,543 1,571 1,601
Infrastructure
Roads 5,832 3,833 3,940 4,021 4,103
Bridges 698 260 265 986 1,006
Footpaths and cycleways 2,644 1,655 2,002 2,307 2,333
Drainage 987 90 140 425 25
Recreational, leisure and community
6,330 6,235 2,000 3,400 3,900
facilities
Parks, open space and streetscapes 2,654 572 540 547 554
Aerodromes 33 - 30 30 30
Off street car parks 56 59 260 61 62
Other infrastructure 534 840 108 108 108
Total infrastructure 19,768 13,544 9,285 11,885 12,121
Total capital works expenditure 4.5.1 25,382 18,457 12,890 15,491 18,408
Represented by:
New asset expenditure 3,730 3,645 1,348 2,055 1,462
Asset renewal expenditure 16,582 10,523 9,450 11,261 12,546
Asset expansion expenditure - - - - -
Asset upgrade expenditure 5,070 4,289 2,092 2,175 4,400
Total capital works expenditure 4.5.1 25,382 18,457 12,890 15,491 18,408
Funding sources represented by:
Grants 5,441 3,279 1,634 1,992 1,701
Contributions 337 40 40 40 40
Council cash 17,864 10,438 11,216 13,459 13,667
Borrowings 1,740 4,700 - - 3,000
Total capital works expenditure 4.5.1 25,382 18,457 12,890 15,491 18,408Statement of Human Resources
For the four years ending 30 June 2024
Strategic Resource Plan Projections
Forecast
Budget
Actual
2019/20 2020/21 2021/22 2022/23 2023/24
$’000 $’000 $’000 $’000 $’000
Staff expenditure
Employee costs 32,940 31,739 35,864 36,887 37,948
Total staff expenditure 32,940 31,739 35,864 36,887 37,948
FTE FTE FTE FTE FTE
Staff numbers
Employees 395.0 361.0 395.0 395.0 395.0
Total staff numbers 395.0 361.0 395.0 395.0 395.0
A summary of human resources expenditure categorised according to the organisational structure of Council is included below:
Comprises
Budget Permanent
Department Casual Temporary
2020/21 Full Time Part time
$'000 $'000 $'000 $'000 $'000
Corporate Strategies 6,482 4,894 1,588 55 -
City Infrastructure 8,675 7,792 883 80 -
Community Development 11,448 4,968 6,480 864 -
City Growth 3,841 3,233 608 294 -
Total permanent staff expenditure 30,446 20,887 9,559 1,293 -
Casuals, temporary and other
1,293
expenditure
Total expenditure 31,739
A summary of the number of full time equivalent (FTE) Council staff in relation to the above expenditure is included below:
Comprises
Budget Permanent
Department
Casual Temporary
2020/21 Full Time Part time
Corporate Strategies 67 48 19 1 -
City Infrastructure 98 86 12 1 -
Community Development 140 58 82 10 -
City Growth 41 33 8 3 -
Total permanent staff expenditure 346 225 121 15 -
Casuals, temporary and other
15
expenditure
Total staff 3614. Notes to the financial statements
This section presents detailed information on material components of the financial statements. Council
needs to assess which components are material, considering the dollar amounts and nature of these
components.
4.1 Comprehensive Income Statement
4.1.1 Rates and charges
"Rates and charges are required by the Act and the Regulations to be disclosed in Council’s annual budget.
In developing the Strategic Resource Plan, rates and charges were identified as an important source of
revenue. Planning for future rate increases has therefore been an important component of the Strategic
Resource Planning process. The Fair Go Rates System (FGRS) sets out the maximum amount councils
may increase rates in a year. For 2020/21 the FGRS cap has been set at 2.0%. The cap applies to both
general rates and municipal charges and is calculated on the basis of council’s average rates and charges.
The level of required rates and charges has been considered in this context, with reference to Council's
other sources of income and the planned expenditure on services and works to be undertaken for the
community.
To achieve these objectives while maintaining service levels and a strong capital expenditure program, the
average general rate and the municipal charge will increase by 2.0% in line with the rate cap.
.
"
This will raise total rates and charges for 2020/21 of $41.52 million.
4.1.1(a) The reconciliation of the total rates and charges to the Comprehensive Income Statement is as
follows:
2019/20
2020/21
Forecast Change
Budget %
Actual
$’000 $’000 $’000
General rates* 29,235 29,932 697 2.38%
Municipal charge* 4,743 4,875 132 2.78%
Waste management charge 6,590 6,421 (169) (2.56%)
Supplementary rates and rate adjustments - 133 133 N/A
Recreational land 74 75 1 1.35%
Interest on rates and charges 75 85 10 13.33%
Total rates and charges 40,717 41,521 804 1.97%
*These items are subject to the rate cap established under the FGRSYou can also read