Preparing for Brexit - London Gov
←
→
Page content transcription
If your browser does not render page correctly, please read the page content below
Greater London Authority

Preparing for Brexit

 Final Report January 2018 Cambridge Econometrics bg@camecon.com
 Cambridge, UK www.camecon.com
Preparing for Brexit

 Cambridge Econometrics’ mission is to provide clear insights, based on rigorous and independent
 economic analysis, to support policy-makers and strategic planners in government, civil society and
 business in addressing the complex challenges facing society.

 Cambridge Econometrics Limited is owned by a charitable body,
 the Cambridge Trust for New Thinking in Economics.
 www.neweconomicthinking.org

Cambridge Econometrics 2
Contents

 Page

1 Introduction 9
 1.1 Background 9
 1.2 Scope of the study 9
 1.3 Modelling stages 10
 1.4 Report structure 11

2 Findings from the Literature 12
 2.1 Introduction 12
 2.2 Trade 12
 2.3 Investment 14
 2.4 Demographics and labour market 15
 2.5 Summary 16

3 The Scenarios 17
 3.1 Introduction 17
 3.2 Scenario descriptions 17
 3.3 Scenario assumptions 19
 3.4 Other assumptions 26
 3.5 Key sectors 26
 3.6 Summary 30

4 Modelling Methodology 32
 4.1 Introduction 32
 4.2 Macro-sectoral method (the E3ME model) 32
 4.3 Localisation of effects and key sectors 37

5 Scenario Results 40
 5.1 Introduction 40
 5.2 UK 40
 5.3 London 46
 5.4 Rest of the UK 50
 5.5 Inner and Outer London 51
 5.6 Sector results 52

6 Business start-ups and scale-ups 55
Preparing for Brexit

 6.1 Introduction 55
 6.2 Data availability 55
 6.3 Start-ups 56
 6.4 Scale-ups 58

7 References 60

Appendices 64

Appendix A Assumptions in the literature 65

Appendix B Key sector definitions 71

Appendix C Detailed results 72

Cambridge Econometrics 4
Preparing for Brexit

 Executive Summary

 • Following the EU referendum on 23 June 2016, the UK voted to leave the
 EU (with 52% voting in favour of leaving). The official withdrawal process
 began when Article 50 was triggered on 29 March 2017, giving the UK until
 29 March 2019 to negotiate an exit deal. The impact of the vote to leave the
 EU is likely to be one of the largest potential economic impacts on both the
 London and the UK economies, in both the short and long-run. However,
 the magnitude of these effects remains unknown as they depend on the
 eventual form of Brexit, and knowledge of the post-Brexit UK economic
 environment across a range of dimensions such as trade, migration, and
 regulation. For London in particular, which has greatly benefited from the
 prevailing economic environment and a large international labour force, the
 consequences could be especially challenging.
 • As part of this study, five scenarios were developed to model five possible
 outcomes for the UK and London of the UK leaving the European Union
 Customs Union and Single Market (see table below). Scenario 1 reflects a
 status quo situation where the UK remain in the Single Market and Customs
 Union (the baseline), and then Scenarios 2 and 3 move from a softer version
 of Brexit (the UK is part of the EEA, but not the Customs Union in Scenario
 2; and is part of the Customs Unions, but not the EEA in Scenario 3), to a
 harder Brexit in Scenarios 4 and 5 (UK is no longer part of the EEA or the
 Customs Union). Scenario 4 is the closest scenario to the government’s
 current position, while Scenario 5 is a more extreme outcome of Scenario
 4, which is still plausible within the government’s approach.
 Scenario Two-year ‘status quo’ Single Market Customs union EU/UK
 transition period from membership membership trade deal
 March 2019
1 – Continued SM and CU membership N/A Y Y N/A
from March 2019
2 – Two-year transition followed by SM Y Y N N/A
membership without CU
3 – Two-year transition followed by CU Y N Y N/A
membership without SM
4 – Two-year transition followed by no Y N N WTO
membership of the SM or CU and falling rules
back to WTO rules
5 – No transition, no membership of the N N N WTO
SM or CU, and no preferential EU/UK rules
trade agreement

 • Assumptions were made for each scenario, focusing on the effects Brexit
 could have on trade, investment and migration/the labour market. The
 assumptions are based on a mix of: directly borrowing inputs from existing
 studies; making adjustments made on short-term evidence from the data;
 using existing information on government targets and guidelines; and
 making more judgemental assessments using additional literature.

 Cambridge Econometrics 5
Preparing for Brexit

• The trade assumptions for each scenario, disaggregated by the type of trade
 costs (tariffs and non-tariff barriers), the flow of trade (imports and exports),
 the group of trading partners (EU and non-EU), and by sector were based
 on the assumptions used in the Dhingra et al (2016a) study.
• Recent changes in investment (a 1.5% fall in the average year-on-year
 growth in total business investment over the last five quarters) from the ONS
 Business investment in the UK dataset were used in order to quantify the
 potential short-term change in investment due to uncertainty. The longer-
 term investment assumptions were made relative to the baseline trajectory
 in the form of a slowdown in investment growth. Taking into consideration
 that growth in total investment in the baseline (Scenario 1) is 1.9% pa over
 2021-30, it was assumed that growth in total investment would fall to 1% pa
 over 2021-2030 in Scenarios 4 and 5, and assumed that the slowdown
 would be smaller in Scenarios 2 (1.5% pa) and 3 (1.3% pa).
• The harder Brexit scenarios assumed that the government’s tens of
 thousands migration target would be achieved, and the softer Brexit
 scenarios built up to this from Scenario 1, in which migration is based on the
 GLA 2016-based projections. Lastly, the assumptions for the impact on
 skills level and so productivity of the UK labour force from a change in
 migration patterns were based on the CEP study by Dearden, Reed and
 Van Reenen (2005), which estimated that the elasticity of productivity with
 respect to the proportion of trained (skilled) workers is 0.6.
• The scenario results were driven by CE’s macro-sectoral model, E3ME.
 E3ME is a global model that includes coverage of all of Europe’s Member
 States and candidate countries, the world’s largest economies and all other
 economies in groups. It has a detailed sectoral disaggregation, and the
 model has been used to develop many scenarios in order to model trade
 and other policy effects across the European Union and globally.
• As expected, the more severe the type of Brexit (going from Scenario
 2 to Scenario 5), the greater the negative impact will be on London and
 the UK (see graphs below). The results show that Brexit will not only
 reduce the size of the UK economy (compared to what may have
 happened if the UK remained in the Single Market and Customs Union),
 but also put it on a slower long-term growth trajectory (i.e. the
 GVA growth in the UK and London

Cambridge Econometrics 6
Preparing for Brexit

 economy is still growing, but at a slower rate than if the UK remained
 in the Single Market and Customs Union). So the cumulative change in
 GVA over time will keep increasing in the long-term.

 Employment growth in the UK and London

 Population growth in the UK and London

• The modelling results show that Brexit will have a negative impact on
 the UK economy across all key indicators, in particular, investment
 (see table below). The UK is expected to experience a loss of 1.0%
 (£18.6bn) in GVA by 2030, 6.7% (20.2bn) in investment and 0.5%
 (176,000 people) in employment under Scenario 2 (compared to what
 may have happened if the UK remained in the Single Market and
 Customs Union). This loss would be 2.7% (£49.1bn) in GVA, 13.8%
 (£41.6bn) in investment and 1.4% (468,000 people) under Scenario 4
 and 3.0% (£54.5bn) in GVA, 15.4% (£46.7bn) in investment and 1.5%
 (482,000 people) in employment under Scenario 5. The fall in the value
 of investment is greater than that of overall GVA, as the expected fall in

Cambridge Econometrics 7
Preparing for Brexit

 imports is greater than the fall in exports, so the improvement in the trade
 balance helps recover some of the loss in investment.
Differences from Scenario 1 (baseline) for the UK by 2030

 Scenario 2 Scenario 3 Scenario 4 Scenario 5
 (%)
 Export to rest of the world -0.4 -0.6 -2.3 -2.3
 Import from rest of the world -1.5 -2.3 -4.4 -4.6
 Population -0.7 -1.4 -2.2 -2.2
 GVA -1.0 -1.6 -2.7 -3.0
 Investment -6.7 -9.9 -13.8 -15.4
 Employment -0.5 -0.9 -1.4 -1.5
 Productivity -0.5 -0.7 -1.3 -1.5

• London is expected to experience a loss of 0.8% (£4.1bn) in GVA by
 2030 and 0.6% (30,500 people) in employment under Scenario 2
 (compared to what may have happened if the UK remained in the
 Single Market and Customs Union), a loss of 1.9% (£9.6bn) in GVA and
 1.6% (83,800 people) in employment under Scenario 4 and a loss of
 2.1% (£10.8bn) in GVA and 1.6% (87,000 people) in employment under
 Scenario 5 (see table below). It is not expected to be affected as much
 as the UK, in terms of GVA and productivity. This reflects that London
 has a higher concentration of higher-value sectors, which are more
 resilient, and are able to recover from economic shocks more quickly.
 Population (and so employment) impacts in London are noticeably
 stronger than in the UK. London has a larger proportion of non-UK
 workers, so border restrictions and a reduction in EU migration are
 expected to impact London the most.
Differences from Scenario 1 (baseline) for London by 2030

 Scenario 2 Scenario 3 Scenario 4 Scenario 5
 (%)
 GVA -0.8 -1.2 -1.9 -2.1
 Employment -0.6 -1.0 -1.6 -1.6
 Productivity -0.2 -0.2 -0.3 -0.5
 Population1 -1.3 -2.7 -4.2 -4.2

• Financial & professional services, Science and Technology, Creative
 and Construction, which make up a high proportion of economic
 activity in the UK, particularly in London, are among the sectors hit the
 hardest by Brexit. Construction and Hospitality, which tend to require
 less skilled labour and employ a larger proportion of EU migrants than
 other key sectors, are expected to see larger impacts on employment
 in London than in the UK.

1
 The population estimates show the potential impact of Brexit based on several simplifying assumptions.
They are also static in the sense that they do not consider any wider dynamic effects on future migration
trends. Consequently, they are not suitable for long-term planning purposes.
Cambridge Econometrics 8
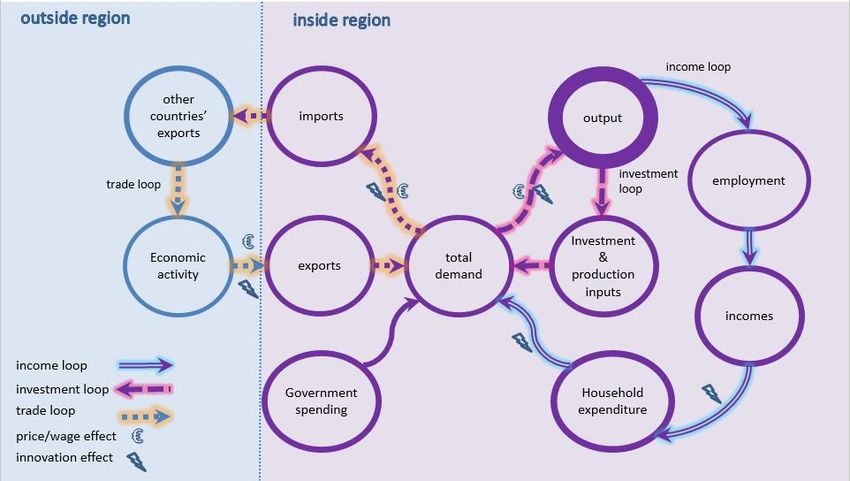
Preparing for Brexit

1 Introduction

1.1 Background
Following the EU referendum on 23 June 2016, the UK voted to leave the EU
(with 52% voting in favour of leaving). The official withdrawal process began
when Article 50 was triggered on 29 March 2017, giving the UK until 29 March
2019 to negotiate an exit deal.
The impact of the vote to leave the EU is likely to be one of the largest potential
economic impacts on both the London and the UK economies, in both the short
and long run as has been highlighted by research published by a number of
organisations prior to the June 2016 referendum2. However, the magnitude of
these effects remains uncertain as they depend on the eventual form of Brexit,
and knowledge of the post-Brexit UK economic environment across a range of
dimensions such as trade, migration, and regulation.

1.2 Scope of the study
The aim of the study was to develop scenarios to model five possible outcomes
for the UK and London of the UK leaving the European Union Customs Union
and Single Market.
This is a particularly complex study, as the long-term consequences of the UK
leaving the EU remain unclear given the continuing uncertainties surrounding
what an eventual Brexit deal will look like. This is why scenario analysis is such
a useful tool, because, given an appropriate structure being set in place for
undertaking the modelling, it allows for a range of different assumptions to be
tested for their impact.
For London in particular, which has greatly benefited from the prevailing
economic environment and a large international labour force, the consequences
could be especially challenging. London has grown substantially over the past
decades to account for an increasing share of UK population, output, and
employment (see Figure 1.1), with its population and skills growth supported by
international, in particular, EU migration.
The principle challenge for the study is how to incorporate the nuances and
effects of a Brexit scenario within a modelling framework so that a set of
consistent and coherent results can be obtained. The truth is that a model which
moves from the global level (i.e. capable of capturing international trade impacts
from changing tariff effects, and also incorporating investment and international
migration effects) to the local area / city level within a single framework does not
exist. Instead, a hybrid framework has been established, which firstly calculates
the macro-sector effects for the UK, and then spreads them out at the local level,
in particular taking account of London’s dominant position within the national
economy.

2
 See for example: Mayor of London, August 2014, ‘The Europe report: a win-win situation: Appendix A’. HM
Treasury, 18 April 2016, ‘HM Treasury analysis: the long-term economic impact of EU membership and the
alternatives’. IMF, June 2016, ‘United Kingdom: Selected Issues’. IMF Country Report No. 16/169. OECD,
April 2016, ‘The Economic Consequences of Brexit: A Taxing Decision’.
Cambridge Econometrics 9
Preparing for Brexit

 Figure 1.1 Total employment, GVA and population in London

 Source: Cambridge Econometrics, August 2017.
A secondary challenge is, even with an agreed approach to the modelling
structure, how to obtain the necessary assumptions. This is a somewhat easier
challenge to overcome, as there are already examples of studies having
attempted (some of) these effects through modelling frameworks which
incorporate global trade networks and substitution effects. Assumptions were
made for each scenario, focusing on the effects Brexit could have on trade,
investment and migration/the labour market. The assumptions are based on a
mix of: directly borrowing inputs from existing studies; making adjustments
based on short-term evidence from the data; using existing information on
government targets and guidelines; and making more judgemental
assessments using additional literature.

1.3 Modelling stages
An overview of the modelling stages is provided in Figure 1.2. The study begins
with a review of the existing literature focusing on the potential impacts of the
UK leaving the European Union. The focus of the review was not to undertake
a wide-ranging review of Brexit, but rather to locate research that looks at
Figure 1.2: Modelling stages

Cambridge Econometrics 10
Preparing for Brexit

impacts on the UK and London economy, and how these impacts have been
modelled, especially the assumptions that have been made in terms of driving
factors from trade, investment and migration/labour market effects.
Following the literature review, the scenario assumptions were developed and
modelled. The scenario results were driven by CE’s macro-sectoral model,
E3ME, a global model that includes coverage of all of Europe’s Member States
and candidate countries, the world’s largest economies and all other economies
in groups. E3ME has a detailed sectoral disaggregation, and has been used to
develop many scenarios in order to model trade and other policy effects across
the European Union and globally. Chapter 4 provides a more detailed
description of E3ME and the economic relationships within the model.
Alongside the modelling process, and in consultation with the GLA, a number
of sectors were identified to focus more detailed attention on as part of the
analysis. More information on the key sectors is given in Section 4.3.
The UK results for each scenario from E3ME were disaggregated to London
and sub-London geographies, based on historical growth in the local area
relative to the UK (or London), on an industry-by-industry basis. See Chapter
4.3 for more information.

1.4 Report structure
This report describes the methodology and findings of this project. Chapter 2
gives an overview of the literature review. A description of each of the scenarios
developed as part of this study and a summary of the key assumptions made
for each scenario is given in Chapter 3. A description of the macro-sectoral
model used to model the scenarios at the UK-level, and the methodology used
to localise the effects to the London and sub-regional level and disaggregate
the results by key sectors is described in Chapter 4. The key scenario results
by geography and key sectors are provided in Chapter 5. The last step of the
study was to provide a qualitative analysis of business start-ups and scale-ups,
based on historical data and the E3ME modelling results. This is presented in
Chapter 6.

Cambridge Econometrics 11
Preparing for Brexit

2 Findings from the Literature

2.1 Introduction
The literature on Brexit often tends to focus on headline outcomes, e.g. an X%
fall in GDP by 2030. While this is of interest, it is not the primary focus of this
study’s literature review, which is to inform on setting the range of assumptions
underpinning the analysis.
It is thus a different and somewhat more difficult task, when reviewing the
literature on Brexit, to understand what assumptions have been made by the
various authors being reviewed. The three main questions to ask are:
 1. What form of Brexit was being analysed?
 2. Were specific or multiple elements of Brexit being assessed?
 3. What values were assumed for key drivers such as tariffs and non-tariff
 barriers, migration, skills, and inward investment?
This chapter seeks to tease out the answers to these questions in a bid to get a
range of values within which it would seem sensible to frame the project’s own
assumptions.

2.2 Trade
The impact of Brexit on trade is the most direct effect to capture in any model.
Indeed, the effects of Brexit have already started to affect the UK economy,
most noticeably through the depreciation of sterling immediately after the
referendum and the impacts it has on the values of imports and exports between
the UK and the EU, and knock-on effects to inflation. Therefore, this has been
the focus of much of the existing literature and so is where the most
assumptions have been explored.
The literature covers a range of scenarios regarding the trading relationship
between the UK and the EU, but most often the following three3, ordered from
the most to the least optimistic regarding UK-EU trade relations:
• A soft Brexit in which the UK joins the European Economic Area (EEA)
• A semi-hard Brexit in which the UK enters a free trade agreement (FTA) or
 negotiates a bilateral trade agreement with the EU
• A hard Brexit in which the UK trades with the EU under the terms of the
 World Trade Organisation (WTO)
Figure 2.1 illustrates the different trading relationships countries have with the
EU. See the box beneath for a description of what being in the Single Market
and Customs Union entail.

3
 Clarke, Serwicka and Winters (2017) also explore a scenario in which the UK does not obtain EEA
membership or enter a trade agreement, but instead chooses to unilaterally bring tariffs for all countries
down to the level currently applicable to the EU, effectively eliminating all tariffs. However, this is most
unlikely to take place.
Cambridge Econometrics 12
Preparing for Brexit

 Figure 2.1: Overview of trading relationships with the EU

Single Market
Single Market membership is effectively ‘EEA membership’, which includes the current EU28
countries and Iceland, Liechtenstein and Norway (but not Switzerland, which is part of the
European Free Trade Association (EFTA), but not the EEA). It refers to the countries as one
territory without any internal borders or other regulatory obstacles to the free movement of
goods and services (i.e. it eliminates tariffs, quotas or taxes on trade and attempts to remove
non-tariff barriers such as rules on packaging, safety and standards). The EEA includes the
four freedoms (free movement of goods, capital, services and labour) plus all the legislation
supporting them, competition/state aid rules and all the accompanying measures (rules on
social policy, consumer protection and environment). It also provides for participation in funding
programmes, in particular the main “Framework” programmes on research and innovation.
EEA does not cover the common agriculture or fisheries policies nor Justice & Home Affairs,
nor foreign and security policy.
Customs Union
In the EU Customs Union all the Member States follow a set of common rules in exercising
customs controls over goods entering the EU from outside the EU. This means that goods
which come into the EU from outside are subject to a common external tariff, but once they
have entered through an external port and paid any duty which is due on them, they can then
circulate freely inside the customs union. Goods which are made inside the customs union can
likewise circulate freely without being subject to tariffs at the internal borders within the customs
union.
Individual members cannot negotiate trade deals with non-member countries and are not able
to set its own tariffs. It is possible for a country to be part of a customs union with the EU but
not in the single market (e.g. Turkey).

 Cambridge Econometrics 13
Preparing for Brexit

Under the soft Brexit scenario, it is assumed that the UK would obtain EEA
membership to give it access to the Single Market, or at least it negotiates a
trade agreement that is as favourable as EEA membership4. This means that
UK-EU trade is not subject to tariffs. Non-tariff barriers, such as customs checks,
border controls, differences in product market regulations, legal barriers and
other transactions costs, may be introduced and will depend on the deal the UK
negotiates with the EU. In addition, the UK would be required to comply with EU
regulations without the power to influence them, although it could implement
policies to ensure equivalence and reduce non-tariff barriers. This is often
referred to as a Norway-type scenario (see Figure 2.1).
At the other end of the spectrum, under a hard Brexit, it is assumed that the UK
would trade with the EU under WTO rules5. This would introduce tariffs at the
Most Favoured Nation (MFN) rates, as well as raising non-tariff barriers at a
level higher than those assumed in the soft Brexit scenario. The UK would have
no passporting rights and restricted access to the EU market in the absence of
a Preferential Trade Agreement (PTA). In other words, it would be treated as a
third country (e.g. India).
In contrast with the above two scenarios, there is neither a consensus nor a
clear picture in the literature about what the medium scenario, a so-called semi-
hard Brexit, would entail exactly. All studies assume that the UK would enter a
trade agreement that allows it to access the Single Market6, some under more
restrictive provisions than others, at a relatively low cost (with respect to tariffs).
In terms of sectoral variations, it is generally the case that production or export-
intensive sectors (including food & drinks7, motor vehicles and electronics8)
would be most affected by an increase in trade costs (tariffs or non-tariff
barriers) as a result of Brexit, which generates knock-on impacts further down
the supply chain in transport and distribution. In services, finance & insurance
is expected to see the largest impact from changes in non-tariff barriers such as
passporting rights and regulations, but the distribution is unlikely to be even
across different sub-sectors. For example, banking is likely to be more affected
than insurance, private equity and hedge funds, as it is more closely connected
to the EU (KPMG, 2017a).
A detailed summary of all assumptions found in the literature is provided in
Appendix A.

2.3 Investment
There have been limited assumptions directly related to the investment impact
in the literature, as it is inherently difficult to model and is related to corporate
strategy, which is something that larger-scale macro models don’t deal with very
well. Most of the discussion has centred on inward foreign direct investment

4
 Such as in Dhingra et al (2016a) and Mulabdic, Osnago and Ruta (2017)
5
 Such as in Dhingra et al (2016a) and Mulabdic, Osnago and Ruta (2017), Lawless and Morgenroth (2016)
and Pelkmans (2017)
6
 Such as in Mulabdic, Osnago and Ruta (2017) and Pelkmans (2017)
7
 According to Lawless and Morgenroth (2016) and KPMG (2017a)
8
 According to PwC (2016a) and Pelkmans (2017)

Cambridge Econometrics 14
Preparing for Brexit

(FDI) and agrees that it would be lower in any scenario compared to the baseline
of the UK remaining in the EU9.
Ebell and Warren (2016) is the only study that explored quantitatively different
scenarios (similar to those discussed in Section 2.2) with respect to business
investment, although the result is derived from the FDI impact and is only
produced at the aggregate level. Nevertheless, there is an underlying
agreement that the impacts would be negative and not uniform across sectors.
Those most mentioned in the literature to be affected by Brexit are financial &
insurance, manufacturing, construction and research & development10. Detailed
assumptions are provided in Appendix A.
In addition to long-term effects on investment, in July 2017 the CBI reported11
on a survey it had conducted which revealed that 40% of firms had already had
investment decisions affected by the uncertainty created by the Brexit process,
with the vast majority indicating a negative effect. This pre-Brexit adverse effect
on investment is also something that should be taken account of while the
precise details of the UK’s future relationship with the EU remain unknown.

2.4 Demographics and labour market
Out of the studies that were covered by the literature review, only two12 consider
assumptions directly related to population, migration and the labour market. In
addition, they only offer a qualitative discussion, but both envision a Brexit in
which the UK would not continue to have free movement of labour and would
implement control of EU migration, particularly for work purposes (see box
below for details on the government’s migration targets). On one end of the
spectrum, the current visa system could be maintained with a relaxed approach
to EU migration, not too dissimilar to the current freedom of movement of
people. On the other end of the spectrum, a points-based approach could be
taken to EU migration, regulating it in the same way as for migrants from outside
the EEA, The reality of restricting EU migration is questionable in some
scenarios, for example, any formal restriction on migration would violate one of
the four freedoms encompassed by Single Market membership. However, an
equivalent might still be achieved if the migration reduction is induced by
people’s preferences rather than by direct control (i.e. the UK becomes a less
attractive place to live), as has been the case since the referendum.
The impact of Brexit on migration is more often presented as results of an
estimation or a modelling exercise, rather than assumptions feeding into the
analysis. A number of studies13 estimate that in the absence of free movement
of labour, the level of net EU migration will be between 62,000 and 100,000
people lower each year than the current figure.

9
 Such as in Baldwin (2016), Ebell and Warren (2016) and Pelkmans (2017)
10
 According to Baldwin (2016), Borchert (2016), Oliver Wyman (2016) and Lavery, Quaglia and
Dannreuther (2017)
11
 See http://www.cbi.org.uk/news/brexit-is-affecting-investment-decisions/.
12
 Baldwin (2016) and GLA (2016a)
13
 Portesy and Fortez (2016); Migration Watch (2016) and Global Futures (2017)
Cambridge Econometrics 15
Preparing for Brexit

 The government’s migration targets
 The UK government has pledged to lower net migration to what are called
 sustainable levels, aiming to reduce net migration to below 100,000 a year.
 This is likely to be an ambitious target, considering that net migration to the
 UK has not been below 100,000 since 1997. While migration from the rest of
 the EU may decrease following Brexit if the UK no longer adheres to the free
 movement of people, the majority of migrants to the UK come from outside
 of the EU, which is likely to be affected to a lesser extent. Additionally, the
 majority of migrants from outside the EU are international students living
 temporarily in the UK, which is not regulated. There is also the question
 whether the UK will restrict migration and face the risk of losing out on a
 skilled and experienced labour force that the UK economy may need. Lastly,
 the government doesn’t have control over the number of people leaving the
 UK (e.g. British pensioners retiring abroad), making it quite difficult for the
 government to have control over achieving an ambitious net migration target.

A change in migration is likely to have an impact on the labour supply for
different skill levels, which consequently impacts the overall level of productivity.
This has been incorporated into the model results using an elasticity linking
productivity to human capital, which has been found to be about 0.6 by Dearden,
Reed and Van Reenen (2005).
A list of assumptions and results related to migration are provided in Appendix
A.

2.5 Summary
This study will include a variation of the three main Brexit scenarios (soft Brexit,
semi-hard Brexit and hard Brexit) as discussed in Section 2.2, each with a set
of assumptions for trade, investment and migration.
The trade assumptions will be developed for tariffs and non-tariff barriers and
will be based directly on Dhingra et al (2016a) as they are widely referenced
and highly detailed. This will also capture the impacts on business investment
through higher production costs and delayed capital spending. Additional
assumptions will be made for the short-term impact of uncertainty during the
negotiation phase and the impact of a reduction in FDI following Brexit, based
on recent (post-referendum) official data.
Given the lack of studies on the migration impacts, other sources such as
government announcements and targets, are used to inform the assumptions.
The impacts on migration will then be carried through to population and
productivity, based on the relationship it has with each variable as found in the
data and the literature.

Cambridge Econometrics 16
Preparing for Brexit

 3 The Scenarios

 3.1 Introduction
 Having reviewed briefly the various Brexit options that have been covered in the
 literature, this chapter looks in more detail at the different versions and model
 scenarios that have been selected for this study. Section 3.2 presents and
 describes the various scenarios that were agreed to be modelled. Table 3.1
 provides an overview of the scenarios while Figure 3.1 revisits the earlier
 illustration of the different trading relationships countries have with the EU, and
 identifies where each scenario is characterised best. Section 3.2 describes each
 scenario in more detail, while sections 3.3 and 3.4 outline the assumptions
 being made that enter into the macro-modelling framework. Finally, section 0
 highlights the issues each key sector faces and how it affects the trade,
 investment and productivity assumptions made.
 Table 3.1: Scenario overview

 Scenario Two-year ‘status quo’ Single Market Customs union EU/UK
 transition period from membership membership trade deal
 March 2019
 1 – Continued SM and CU membership N/A Y Y N/A
 from March 2019
 2 – Two-year transition followed by SM Y Y N N/A
 membership without CU
 3 – Two-year transition followed by CU Y N Y N/A
 membership without SM
 4 – Two-year transition followed by no Y N N WTO
 membership of the SM or CU and falling rules
 back to WTO rules
 5 – No transition, no membership of the N N N WTO
 SM or CU, and no preferential EU/UK rules
 trade agreement

 3.2 Scenario descriptions
 Scenario 1 Scenario 1 is effectively the baseline assumption against which all other variants
 (Single Market will be assessed, and largely represents business as usual as if the UK remains
 and Customs within the Single Market and Customs Union. As agreed with the GLA, the
Union status quo particular view or forecast to be used as the base case will be one produced by
 baseline) DG EcFin (2015). This study was published before the Brexit referendum, and
 gives a long-term perspective on government revenues and liabilities pre-Brexit,
 given demographic trends. It is commonly referred to as the ‘ageing report14 -
 GDP projections are formed by attaching an estimate of productivity growth to
 expected changes to the size of the labour force. Population is consistent with
 the latest GLA projections.

 14
 See http://ec.europa.eu/economy_finance/publications/european_economy/ageing_report/index_en.htm.
 Cambridge Econometrics 17
Preparing for Brexit

 Figure 3.1: Scenario overview in relation to a selection of other countries

Scenario 2: Two- In this scenario, there would be a two-year transition period and from 2021 there
 year transition would continue to be free movement of goods, services, people and capital
 followed by SM within the EEA (Single Market). The UK would abide by the EU's economic
 membership rules, including legislation regarding employment, consumer protection, product
 without CU standards, environmental and competition policy, but the UK would not have
 any power to decide any legislation.
 There would be no tariffs on goods traded between the UK and the EU
 countries, and the financial sector would retain passporting rights that allow
 services to be provided in the other countries in the EEA. Non-tariff barriers
 between the UK and the EU would remain low and there would be no new
 barriers to trade in services with the EU.
 As the UK is no longer part of the Customs Union, it will be able to set its own
 external tariff and negotiate its own trade deals with non-EU countries.
 However, there would be some new non-tariff barriers on trade between the UK
 and EU, as UK exporters would have to satisfy 'rules of origin' requirements
 when trading with the EU, increasing trading costs, particularly in industries that
 have large global supply chains, such as the textiles and automotive industries.
 The UK will not be able to restrict migration between the UK and the EU, but
 migration will be lower than in Scenario 1 as the UK becomes a less attractive
 place for migrants to settle, and the government tries to achieve its tens of
 thousands migration target.
 This scenario is similar to the conditions currently faced by Norway.

 Cambridge Econometrics 18
Preparing for Brexit

Scenario 3: Two- In this scenario, there would be a two-year transition period and from 2021 the
 year transition UK would be part of the Customs Union, but not the EEA. As a result, there
 followed by CU would be no tariffs on goods traded between the UK and EU, and the UK would
 membership not be able to set its own tariffs or negotiate its own free trade agreements
 without SM (FTAs) with non-EU countries. The UK could face barriers to trade in services
 with the EU, and as a result, non-tariff barriers are likely to increase.
 As the UK is no longer part of the EEA, it will be able to have control over
 migration between the UK and the EU, and get closer to achieving the
 government’s tens of thousands migration target. At the same time, countries
 that are part of the EEA will be able to restrict migration from the UK.
 This scenario is similar to the conditions currently faced by Turkey.
Scenario 4: Two- In this scenario, there would be a two-year transition period and from 2021 the
 year transition UK will no longer be part of the EEA and Customs Union. The UK will have
 followed by no greater political power and will be able to set economic policy and regulatory
 membership of standards without taking account of the preferences of other EU members.
 the SM or CU The UK’s trade with most of the rest of the world would be under the WTO rules,
 and falling back resulting in the largest increase in trade costs between the UK and EU across
 to WTO rules all scenarios. The UK would face the Most Favoured Nation treatment from all
 WTO members, and would charge the same tariffs to all other WTO members,
 raising the cost of trade between the UK and the EU. Non-tariff barriers between
 the UK and EU would also increase, due to divergence in regulation between
 the UK and the EU. Trade in UK services will also be governed by WTO and so
 UK service producers would face reduced access to the EEA.
 There would be no free movement of people under the WTO rules, enabling the
 government to meet its tens of thousands migration target, as there would no
 longer be free labour mobility between the UK and the EU. This would most
 likely result in a sharp decline in migration.
 Scenario 5: No This scenario is similar to Scenario 4, except that it is assumed there will be no
transition and no two-year transition period. The UK will start to experience the trade, investment
 membership of and migration impacts linked with it no longer being part of the EEA and
 the SM or CU Customs Union from 2019.

 3.3 Scenario assumptions
 Moving on from the general descriptions, this section summarises the UK trade,
 investment and demographic assumptions made in the macro-sectoral
 modelling for each of the scenarios outlined above.
 Trade The impacts of Brexit on trade mainly result from an increase in trade costs
 (tariff and non-tariffs) between the UK and the EU, and ultimately between the
 UK and the rest of the world, as the former no longer benefits from trade
 agreements negotiated by the EU on behalf of its Member States15. A set of
 assumptions are developed for each scenario, disaggregated by the type of
 trade costs (tariffs and non-tariff barriers), the flow of trade (import to and export
 from the UK), and the group of trading partners (EU and non-EU).
 As long as the UK remains in either the Single Market or the Customs Union,
 there is likely to be little change in tariffs, as there are few countries that belong

 15
 This study does not consider that following Brexit, the UK might negotiate more preferential trade
 agreements with non-EU countries than the existing deals between the EU and such countries.
 Cambridge Econometrics 19
Preparing for Brexit

 to one but not the other (as shown in Figure 3.1). In addition, these countries
 are likely to account for a small proportion of UK trade. Therefore, it is
 reasonable to assume no change in tariffs in Scenario 2 and Scenario 3.
 For Scenario 4 and Scenario 5, it is assumed that the WTO’s Most Favoured
 Nation (MFN) tariffs would apply with all trading partners of the UK. To be
 consistent with the literature, MFN tariff rates calculated by Dhingra et al
 (2016a) for different types of goods are used for relevant sectors in the E3ME
 model.
 While tariffs are assumed to change only in the hard Brexit scenarios (Scenarios
 4 and 5), non-tariff barriers between the UK and the EU are expected to increase
 in all scenarios. No change is assumed for UK-non-EU trade because of the
 complexity of modelling non-tariff barriers for each trading partners, and
 because the most major change in non-tariff barriers is expected to be between
 the UK and other EU Member States. Non-tariff barrier assumptions for UK-EU
 trade are based on the results of Berden et al (2009) on tariff equivalents of non-
 tariff barriers between the USA and the EU, which have been used in the work
 of Dhingra et al (2016a) and Clayton and Overman (2017), and are as follows:
 • Scenario 2: an increase of ¼ of the US-EU reducible non-tariff barriers16
 • Scenario 3: an increase of ½ of the US-EU reducible non-tariff barriers
 • Scenario 4 and Scenario 5: an increase of ¾ of the US-EU reducible non-
 tariff barriers
 The trade-related assumptions for Scenario 2 and Scenarios 4-5 were the same
 as those used by Dhingra et al (2016a) in the optimistic and pessimistic
 scenarios, respectively. The increase in Scenario 3 was then assumed to be the
 mid-point between these two.
 Table 3.2 and Table 3.3 show a summary of the assumptions for changes in
 tariffs and non-tariff barriers (in tariff equivalents) in each scenario compared to
 Scenario 1 (in which the UK maintains its Single Market and Customs Union
 memberships). These changes are assumed to have a permanent impact
 immediately after Brexit (in 2021 for Scenarios 2, 3 and 4, and in 2019 for
 Scenario 5).
Table 3.2 Tariff assumptions by broad sectors for Scenario 4 and Scenario 5

 UK-EU UK-non-EU
 Import Export Import Export
 (%)
 Agriculture, Hunting, Forestry and Fishing 5.90 5.63 1.07 4.02
 Mining and Quarrying 0.00 0.00 0.00 0.00
 Food, Beverages and Tobacco 7.26 4.96 6.19 2.08
 Textiles and Textile Products; Leather, Leather 9.49 9.61 10.70 8.73
 Products and Footwear
 Wood and Products of Wood and Cork 2.35 3.62 2.74 3.16
 Pulp, Paper, Paper Products, Printing and Publishing 0.04 0.10 0.07 0.06
 Coke, Refined Petroleum and Nuclear Fuel 2.69 2.81 2.51 3.36
 Chemicals and Chemical Products 2.71 2.16 2.47 1.89

 16
 Reducible non-tariff barriers are defined as the fraction of the non-tariff barriers which can in principle be
 eliminated by policy action.
 Cambridge Econometrics 20
Preparing for Brexit

 Rubber and Plastics 5.35 5.05 5.25 5.28
 Other Non-Metallic Mineral 3.78 3.32 4.80 3.49
 Basic Metals and Fabricated Metal 2.05 1.89 1.47 1.00
 Machinery, Nec 2.05 2.13 2.34 2.00
 Electrical and Optical Equipment 1.97 1.55 1.83 1.70
 Transport Equipment 8.09 7.22 5.56 6.26
 Manufacturing, Nec; Recycling 1.71 1.69 1.44 1.76
 Source: Dhingra et al (2016a).

 Table 3.3 Non-tariff barrier assumptions by broad sector

 Scenario 2 Scenario 3 Scenarios 4-5
 Import Export Import Export Import Export
 (%)
 Food & beverages 18.3 14.2 36.7 28.4 55.0 42.6
 Textiles & clothing 4.2 4.8 8.4 9.6 12.5 14.4
 Wood & paper products 1.9 2.8 3.9 5.7 5.8 8.5
 Chemicals 5.3 6.0 10.5 12.0 15.8 17.9
 Pharmaceuticals 2.4 3.8 4.8 7.7 7.1 11.5
 Cosmetics 8.1 8.7 16.2 17.3 24.3 26.0
 Metals 4.3 3.0 8.5 6.0 12.8 8.9
 Electronics 1.6 1.6 3.3 3.3 4.9 4.9
 Office & communications equipment 5.7 4.8 11.5 9.6 17.2 14.3
 Automotive 6.7 6.4 13.4 12.8 20.1 19.1
 Aerospace 4.8 4.7 9.6 9.4 14.3 14.1
 Construction 0.6 1.2 1.3 2.3 1.9 3.5
 ICT services 1.0 3.7 2.0 7.5 2.9 11.2
 Communications 0.4 2.9 0.9 5.9 1.3 8.8
 Financial services 7.9 2.8 15.9 5.7 23.8 8.5
 Insurance 4.8 2.7 9.6 5.4 14.3 8.1
 Other business services 1.0 3.7 2.0 7.5 2.9 11.2
 Personal, cultural & recreational 0.6 1.1 1.3 2.2 1.9 3.3
 services
 Source: Cambridge Econometrics’ calculations based on Berden et al (2009).

Investment Investment can be thought of as being affected by Brexit in three ways:
 • driven by trade-related output effects
 • short-term uncertainty over eventual outcome
 • risk to FDI into the UK
 Trade-related output effects have already been taken care of through the trade
 assumptions and the resulting model inter-connections. While the value of
 sterling may have some impact on FDI, investment decisions are more likely to
 be driven by the strategic importance and attractiveness of the location of where
 the investment is being made. Therefore, no particular assumption has been
 made for this, and the euro exchange rate has been fixed as explained in section
 3.4.
 Short-term Uncertainty over the outcomes of the Brexit negotiations and, in particular, over
 uncertainty the future trade agreements negotiated between the UK and the rest of the
 Cambridge Econometrics 21
Preparing for Brexit

 world, is likely to dampen investment in the short-term, and have already been
 reported in a CBI survey mentioned in Chapter 2.
 Recent changes in investment from the ONS Business investment in the UK
 dataset were used in order to quantify the potential short-term change in
 investment due to uncertainty. This showed that the average year-on-year
 growth in total business investment over the last five quarters since the results
 of the referendum (2016Q2 to 2017Q2) has fallen to about 1.5% (compared to
 about 2.5% for the previous five quarters from 2015Q1 to 2016Q1).
 This 1.5% growth rate was used in the following way to develop the investment
 assumptions over 2017-2020:
 • The 1.5% growth rate has been used to calculate total investment in 2017.
 • Total investment growth between 2018-2020 is then interpolated in order to
 get back to the 2021 growth in investment in the baseline (Scenario 1),
 under the assumptions that uncertainty will decrease over time as the
 outcomes of the negotiations become clearer.
 • The total change in investment has been split by sector, based on the
 sector’s share of total investment in the baseline.
 • It has been assumed that there is no impact on investment in Government
 services.
 The same assumptions are used across all scenarios, under the assumption
 that the same degree of short-term uncertainty exists in all scenarios. Table 3.4
 shows a summary of the assumptions for the per annum growth in investment
 by broad sector over 2016-19.
 Table 3.4: Investment assumptions by broad sector, 2016-19

 Scenario 1 Scenarios 2-5
 (% pa)
 Agriculture etc 0.0 -0.3
 Mining & quarrying -3.0 -3.4
 Manufacturing 0.9 0.5
 Electricity, gas & water 0.8 0.4
 Construction 1.7 1.3
 Distribution 1.7 1.3
 Transport & storage 1.9 1.6
 Accommodation & food 1.9 1.6
 services
 Information & 1.9 1.6
 communications
 Financial & business 1.9 1.6
 services
 Government services 0.4 0.4
 Other services 0.4 0.1
 Total 1.8 1.5

Longer-term FDI When the UK leaves the Single Market, UK-based firms could face an increase
 impacts in costs from an increase in tariffs and non-tariff barriers. This makes it a less
 attractive place for multinationals to export its goods to the rest of the EU.

 Cambridge Econometrics 22
Preparing for Brexit

Similarly, the movement of component goods needed in the production process
and staff between other branches in the rest of the EU may also become more
costly and difficult, which may further dampen FDI coming into the UK.
According to Dhingra et al (2017), Brexit is likely to reduce future FDI inflows to
the UK by about 22% (2.4% pa). This is in line with other studies that find that
UK FDI will be a quarter lower in 2020 because of Brexit (PwC, 2016b), or that
there is a positive impact of 25-30% on FDI flows from EU membership
(Campos and Coricelli, 2015).
FDI is a measured as a financial flow, but it does also represent a contribution
to total investment as the foreign firms owning capital in the UK will invest in
assets. However, the link between the FDI figures and investment is far from
direct and as a result, it is difficult to translate the FDI impacts found in the
studies mentioned above into impacts on total investment17. The scenario
assumptions for investment are made relative to the baseline trajectory in the
form of a slowdown in investment growth. Taking into consideration that growth
in total investment in the baseline (Scenario 1) is 1.9% pa over 2021-30, it has
been assumed that growth in total investment would fall to 1% pa over 2021-
2030 in Scenarios 4 and 5, and assumed that the slowdown would be smaller
in Scenarios 2 (1.5% pa) and 3 (1.3% pa). There isn’t much literature to base
these assumed reductions on, but the variation in the assumptions between the
scenarios provide a form of sensitivity testing.
The change in import price in a sector in each scenario has been used as a
guideline to split the total change in investment by sector, under the assumption
that sectors that are affected by larger changes in tariffs are more likely to be
impacted by changes in FDI. As above, it has been assumed that there is no
impact on investment in Government services.Table 3.5 shows a summary of
the per annum growth in investment assumptions by broad sector over 2021-
30. In general, all sectors are assumed to grow progressively more slowly, going
from the most optimistic scenario (Scenario 1) to the most pessimistic scenario
(Scenario 5). The only exception is Financial & business services which is
expected to grow marginally faster in Scenario 5 than in Scenario 4, because
the short-run uncertainty effect that delays investment decisions is present for
a shorter period of time without the two-year transition.
Table 3.5: Investment assumptions by broad sector, 2021-30

 Scenario 1 Scenario 2 Scenario 3 Scenario 4 Scenario 5
 (% pa)
 Agriculture etc 0.0 -0.2 -0.2 -3.9 -3.9
 Mining & quarrying -3.3 -3.5 -3.5 -3.6 -3.6
 Manufacturing 0.8 -0.8 -2.2 -3.7 -3.7
 Electricity, gas & 0.6 0.4 0.4 0.4 0.4
 water
 Construction 1.6 1.2 0.9 0.6 0.6
 Distribution 1.6 1.4 1.4 1.4 1.4
 Transport & storage 1.8 1.6 1.5 1.5 1.5

17
 Ebell and Warren (2016) established this link as part of their work, but it would be inappropriate to apply
their findings directly without a detailed understanding of how they were derived and should be interpreted.
Cambridge Econometrics 23
Preparing for Brexit

 Accommodation & 1.8 1.6 1.6 1.6 1.5
 food services
 Information & 1.8 1.2 0.9 0.5 0.5
 communications
 Financial & business 1.8 1.2 0.9 0.5 0.6
 services
 Government services 0.4 0.4 0.4 0.4 0.4
 Other services 0.4 0.1 0.0 -0.2 -0.2
 Total 1.9 1.5 1.3 1.0 1.0

Demographics
and the labour
 market
 Migration and As mentioned in Chapter 2, there isn’t much existing literature that considers
 population assumptions directly related to population, migration and the labour market.
 Following discussions with the GLA, it was decided that Scenarios 4 and 5
 would assume that the government’s tens of thousands migration target would
 be achieved. Scenarios 2 and 3 would build up to this from Scenario 1, in which
 migration is based on the GLA 2016-based projections. These are
 straightforward assumptions that do not account for the various types of visa
 systems the UK could adopt after Brexit, as this is politically uncertain and
 consequently difficult to model. The migration assumptions are then used to
 develop population assumptions, taking into consideration natural change. The
 difference in net migration across scenarios is assumed to be driven by changes
 in both EU and non-EU migration, as it is likely that Brexit will affect both flows.
 The assumptions do not specifically look at changes in the origins of
 international migrants, or the impact a change in international migration may
 have on internal migration (people migrating from one area of the UK to
 another).
 Table 3.6 provides a summary of the migration and population assumptions
 used in each scenario.
 Table 3.6: Summary of migration and population assumptions (2019/21-2030)

 Scenario 1 Scenario 2 Scenario 3 Scenario 4 Scenario 5
 Migration Net migration Net migration Net migration Net migration Net migration
 of 232,000 in of 188,000 of 144,000 of 99,999 of 99,999
 2020, falling from 2020 from 2020 from 2020 from 2020
 to 220,000 in onwards onwards onwards onwards
 2030
 Population 0.6% pa 0.5% pa 0.45% pa 0.4% pa 0.4% pa
 (over
 2019/21-30)

 Skilled labour The skills level of the UK labour force is likely to be affected by a change in
 migration patterns, and in turn is likely to impact the country’s productivity. This
 impact, as opposed to the trade-related impact, is not modelled directly so has
 been captured through off-model adjustments to productivity. As mentioned in
 Chapter 2, there isn’t much existing literature to use to inform assumptions on
 how migration might affect productivity levels. The CEP study by Dearden, Reed
 and Van Reenen (2005), using British firm-level data, estimated that the
 Cambridge Econometrics 24
Preparing for Brexit

elasticity of productivity with respect to the proportion of trained (skilled) workers
is 0.6. This elasticity was used in the following way to develop the productivity
assumptions:
• While not all working-age migrants are in work, a high proportion are (higher
 than UK-born people), and so it has been assumed that the reductions in
 working-age migration in the scenarios are all people who would otherwise
 come and work in the UK, in order to keep the modelling assumptions
 straightforward.
• For each scenario, the difference in working-age migration from the baseline
 is distributed to broad sectors using each sector’s share of total (non-UK)
 workers18 from the ONS International immigration and the labour market,
 UK (2016) dataset.
• A percentage difference by broad sector is calculated as the absolute
 difference divided by employment in the baseline.
• The percentage difference calculated in the previous step is then translated
 into productivity differences by E3ME sectors using the elasticity of 0.6 from
 the CEP study mentioned above.
• Productivity differences have been held constant from 2020 onwards (in
 line with the migration assumptions). This would imply that productivity
 growth from 2020 onwards is the same in all scenarios and the baseline
 (but the level will be lower in all scenarios compared to the baseline). This
 is because the loss in productivity is due to a sudden loss of trained/skilled
 workers, and this shortage can be addressed in the longer-term by training
 new, domestic entrants to the labour force. Additionally, long-term
 productivity growth depends more on other factors, such as technology,
 and relatively small changes in the workforce (migrants) are not large
 enough to affect the overall trend.
Table 3.7 shows a summary of the productivity assumptions developed by
broad sector. It shows that it is assumed that productivity will be between 0.14-
0.31% lower in 2020 in Scenarios 4 and 5 than in the baseline19.
Table 3.7: Summary of productivity assumptions by broad sector, 2020

 Difference from Scenario 1 in 2020 (%)
 Scenario 2 Scenario 3 Scenario 4 Scenario 5
 Agriculture etc -0.05% -0.09% -0.14% -0.14%
 Energy and water -0.07% -0.13% -0.20% -0.20%
 Manufacturing -0.10% -0.21% -0.31% -0.31%
 Construction -0.07% -0.14% -0.21% -0.21%
 Wholesale and retail trade -0.07% -0.14% -0.21% -0.21%
 Transport and communication -0.09% -0.19% -0.28% -0.28%
 Financial and business services -0.06% -0.11% -0.17% -0.17%
 Public admin, education and health -0.06% -0.11% -0.17% -0.17%
 Other services -0.06% -0.12% -0.17% -0.17%

18
 As changes in EU and non-EU migration are both expected to contribute to the total reduction in
migration.
19
 Boubtane et al (2015) finds that halving the net immigration rate would reduce UK productivity slightly
more (-0.32% pa).
Cambridge Econometrics 25
Preparing for Brexit

 3.4 Other assumptions
 Other model inputs are held constant between scenarios and therefore do not
 have a noticeable impact on the model results. Interest rates have been held
 constant at current rates (i.e. 0.5% base rate) and the euro exchange rate has
 been fixed at 0.85 euros = 1 pound. No further quantitative easing is added to
 the model.
 It is important to note that government tax rates and expenditure are also fixed.
 This implies that the fiscal deficit may change in the scenarios. Initially,
 government balances may improve in the scenarios due to the additional
 revenues from trade tariffs, but this gain quickly becomes a loss due to lower
 VAT and income tax receipts that result from weaker economic growth.
 E3ME is a global model, and so provides results for other countries as well as
 the UK. Clearly there are direct and indirect effects from Brexit on other
 countries, but we have otherwise assumed that policies in other countries
 remain unchanged (including EU countries).
 Other more general assumptions relate to the modelling framework offered by
 E3ME and its econometric equations. These are discussed further in Section
 4.2.

 3.5 Key sectors
 As part of the analysis, a number of key sectors were identified for more detailed
 attention. Identifying the impacts of Brexit on these sectors in particular is
 important in generating an understanding of the overall impact on the London
 economy. As agreed with the GLA, the sectors that have been chosen are either
 thought to have a strong influence on the London economy, or likely to be
 particularly strongly affected by Brexit. This section explores the issues that
 each key sector faces and how it affects the trade, investment and productivity
 assumptions made for the macro-sectoral modelling.
 Financial & Countries in the rest of the EU are large consumers of UK financial services.
professional The sector is a major provider of high value and high productivity jobs across
 services the country, and London, in particular, is considered one of the most important
 financial regions in the world and the financial centre of Europe, accounting for
 more than 50% of all GVA in the finance and insurance sector in the UK20.
 One of the largest threats to the sector is the potential loss of passporting rights
 for firms based in the UK that provide financial services to the EU. In 2015, the
 UK exported £26.1 billion of financial, insurance and pension services to the
 EU21. If the UK fails to negotiate full access to the EU market following Brexit,
 trade costs could rise and the UK could suffer from a fall in trade in this sector.
 This is reflected by an increase in import and export prices in the macro
 modelling assumptions, as the UK is likely to need to continue to comply with
 EU regulation in order to continue transactions with the EU.
 The sector could also suffer from the introduction of the need for EU workers to
 obtain visas and work permits if the UK tightens its migration policy, reducing
 the UK’s access to high-skilled labour from the EU. This would particularly be

 20
 London and Europe: Facts and Figures, GLA (2017).
 21
 London and Europe: Facts and Figures, GLA (2017).

 Cambridge Econometrics 26
You can also read