THE VALUE OF CROSS-BORDER DATA FLOWS TO EUROPE: RISKS AND OPPORTUNITIES - Report prepared for DIGITALEUROPE
←
→
Page content transcription
If your browser does not render page correctly, please read the page content below
THE VALUE OF CROSS-BORDER
DATA FLOWS TO EUROPE:
RISKS AND OPPORTUNITIES
Report prepared for DIGITALEUROPE
June 2021
Frontier Economics Ltd is a member of the Frontier Economics network, which consists of two separate companies based in Europe (Frontier
Economics Ltd) and Australia (Frontier Economics Pty Ltd). Both companies are independently owned, and legal commitments entered into by
one company do not impose any obligations on the other company in the network. All views expressed in this document are the views of Frontier
Economics Ltd.

THE VALUE OF CROSS-BORDER DATA FLOWS TO EUROPE: RISKS AND
                                                                       OPPORTUNITIES

            CONTENTS
            1    Introduction                                                                    8
                 1.1   Background                                                                 8
                 1.2   Terms of reference                                                         9

            2    The role of cross-border data flows in the EU economy                           10
                 2.1   Uses of data in the modern economy                                        10
                 2.2   Case studies of how different sectors rely on cross-border data flows     13

            3    Approach to modelling the impact of data localisation                           19
                 3.1   Overview of approach                                                      19
                 3.2   We identify sectors that are particularly data reliant                    20
                 3.3   We measure restrictions on cross-border data flows affecting these
                       sectors                                                                   21
                 3.4   We model two scenarios with different restrictions on cross-border data
                       flows                                                                     22
                 3.5   Limitations                                                               24

            4    The impact of data localisation on trade and economic growth                    26
                 4.1   Trade impacts of policy scenarios                                         26
                 4.2   Impact on GDP and employment                                              31
                 4.3   Further detail on modelling results                                       33
                 4.4   Assessing the overall role of data flows in facilitating trade            35
                 4.5   Conclusions                                                               38

            Annex A       Data-reliant sector definitions                                        39

            Annex B       Trade modelling methodology                                            41
                 Services trade restrictiveness index                                            41
                 Services trade gravity modelling                                                43
                 Goods trade gravity modelling                                                   47

frontier economics
THE VALUE OF CROSS-BORDER DATA FLOWS TO EUROPE: RISKS AND
OPPORTUNITIES
FOREWORD
International data flows are vital to Europe’s economic success. Setting the
right framework for data flows now can have a huge positive impact on our
economy by 2030.
The European Commission recently launched its targets for the Digital Decade.
Among them were that by 2030:
75 per cent of European enterprises should have taken up cloud computing
services, big data and artificial intelligence.
Europe should double its number of unicorns.
More than 90 per cent of European SMEs should reach at least a basic level of
digital intensity.
Underpinning each of these goals is the need to be able to transfer data smoothly
and securely across borders. This study demonstrates that even in a limited
assessment – by looking only at international trade – cross-border data transfers
can have a huge positive impact on the economy by 2030 if we make the right
decisions now.
The growth of the digital economy and the success of European companies is
dependent on the ability to transfer data. This is especially so when we note that
already in 2024, 85 per cent of the world’s GDP growth is expected to come from
outside the EU.1 Our study shows that we could be missing out on around €2 trillion
worth of growth by the end of the Digital Decade. This is roughly the same size as
the Italian economy any given year.
Restrictions on cross-border data flows affect companies of all sizes and sectors.
The EU manufacturing sector stands to lose the most in absolute value – indeed,
more than half of our total losses from data restrictions. As SMEs account for
almost a quarter of all goods exported from the EU, they will be heavily impacted.
Sectors such as media and culture are some of the most impacted in relative terms,
losing about 10 per cent of their exports. These are some of the industries that
have made Europe what it is today.
A great example is that of our member Airbus. The latest A350 has 50,000 sensors
on board collecting 2.5 terabytes of data every day. It shows just how much data
has penetrated into traditional industries.
Data transfers are not only a key aspect of international trade, the value of which
we have attempted to capture in this research, but are crucial for economic activity
more at large. For example, moving HR information from a subsidiary to a parent
company, transferring health data for ground-breaking research, or simply being
able to use the perfect application for the tasks you need to do. Hampering the
data flows behind these business decisions has a negative impact on all
companies’ economic prospects.
Europe stands at a crossroads. It can either set the right framework for data
transfers, and win the Digital Decade, or it can follow its current trend and move
1
https://data.consilium.europa.eu/doc/document/ST-6308-2021-INIT/en/pdf
frontier economics 4THE VALUE OF CROSS-BORDER DATA FLOWS TO EUROPE: RISKS AND
OPPORTUNITIES
towards data protectionism, and lose. Our analysis shows that the consequences
of these decisions will have a huge impact on exports, jobs and growth, and will
ultimately define whether Europe can reach its ambitious industrial and digital
goals.
frontier economics 5THE VALUE OF CROSS-BORDER DATA FLOWS TO EUROPE: RISKS AND
OPPORTUNITIES
EXECUTIVE SUMMARY
Frontier Economics was commissioned by DIGITALEUROPE to estimate the
economic impact of cross-border data flows on the economy of the European
Union (EU), and the potential impact of changes to existing restrictions on these
flows. This report provides new, robust estimates of the economic cost to the EU
of additional restrictions, and the potential economic gain that could result from
liberalisation. Our estimates are relatively conservative. We focus on modelling the
role of cross-border data flows in facilitating international trade (imports and
exports), as this allows us to use an established robust methodology to quantify
the economic impact of these flows. However, we do not quantify other benefits of
cross-border data flows. In particular, our results do not take into account the role
of cross-border data flows in supporting the delivery of public services, and they
largely exclude the economic impact of cross-border activities within companies,
which typically are not recorded in international trade data. The key messages from
our analysis are summarised below.
KEY FINDINGS
Cross-border data flows are central to the EU economy, and especially its
trade and investment. Many sectors, including high-value manufacturing,
IT and information services, media, and cultural sectors, are highly
reliant on data. This suggests that data localisation internationally and in
the EU carries serious risks for sectors that are part of both the EU’s
industrial strategy and its wider social and economic agenda.
The future direction of global policy on data flows therefore matters. The
difference between a path that is moderately liberalising and one that
is moderately restrictive is economically significant: worth a little
over 1.5% in EU GDP per year. This is equivalent to approximately one
year of GDP growth for the EU according to the IMF’s long-run forecasts.
Over a ten-year period to 2030, the difference between a moderately
liberalising path and a moderately restrictive path would amount to €2
trillion, in today’s money.
A moderately restrictive scenario is one in which the EU is unable to
rely on GDPR transfer mechanisms, and in which trade partners increase
their overall levels of restrictions on cross-border data flows. Our modelling
suggests that such a scenario leads to a reduction in EU exports of
around 4%, and in 1% of GDP per year. Cumulatively to 2030, losses
amount to €1.3 trillion. The loss in output corresponds to around 1.3 million
jobs in the impacted sectors.
The majority of the pain is self-inflicted: a majority of the EU’s export
losses in restrictive scenarios (around 58%) come from an increase
in its own restrictions than from partner actions. Domestic measures
that increase data localisation act as a tax on a country’s exports.
By contrast, if the EU and major trade partners adopted measures to
facilitate cross-border data transfers, EU exports as a whole would
frontier economics 6THE VALUE OF CROSS-BORDER DATA FLOWS TO EUROPE: RISKS AND
OPPORTUNITIES
grow by a little over 2% per year, adding 0.6% to GDP per year, which
is around 0.7 million jobs in the impacted sectors. Cumulative effects to
2030 are worth around €720 billion.
The downside risks from the moderate restrictiveness scenario outweigh
the upside risks from the more liberalising scenario. The priority for the EU
and its partners should in the first instance be to avoid increased
restrictiveness by locking in existing levels of liberalisation.
The estimated GDP effects are conservative. This is because the
primary channel of impact that is modelled is via effects on international
trade. Other channels of impact, such as costs to innovation are also
important. The analysis is also based on trade and national account data
that records transactions between firms, rather than internal flows of goods
and services. The significant impacts of data restrictions on internal flows
are therefore not captured. Finally, we do not model other policy measures
(such as the restrictions on operations of non-national businesses) that
might accompany data localisation.
Data localisation requirements could also hurt sectors that do not
participate heavily in international trade, such as healthcare. Indeed,
research activities increasingly feature collaboration across borders: for
example, it is estimated that in 2019 more than 5,000 collaborative
projects between EEA countries and the US National Institutes of Health
alone (NIH, 2019). Moreover, up to one-fourth of inputs into the provision
of healthcare consists of data-intensive products and services.
The impacts are likely to affect both large and small businesses. In EU
manufacturing, small and medium enterprises account for 23% of
exports. Therefore, a relatively crude apportioning of the results shown in
section 4.3 suggests that exports by data-reliant manufacturing SMEs in
the EU are worth around €280bn. In the challenge scenario, exports from
EU SMEs would fall by €14bn, and in the growth scenario they would
increase by €8bn.
Assessing the impact of data flows on SMEs in service sectors is
challenging due to data limitations. However, we know that SMEs
account for 61% of the turnover of EU data-reliant services sectors.
Therefore, it is likely that exports of data-reliant services from EU SMEs
account for a significant proportion of the value of cross-border data flows
to the EU economy.
Our modelling also provides conservative estimates of the economic
contribution of cross-border data flows to the EU. A loss of cross-border
data flows on exports from data-reliant sectors would lead to an
annual reduction in EU GDP worth at least €330bn, or around 2.5% of
total EU GDP.
frontier economics 7THE VALUE OF CROSS-BORDER DATA FLOWS TO EUROPE: RISKS AND
OPPORTUNITIES
1 INTRODUCTION
1.1 Background
The cross-border flow of data plays a central role in an increasingly digitised
economy. Cross-border data flows underpin modern international trade and
investment, reflecting the wider role data plays in enhancing the operations of
firms, and indeed in creating new business models based on the use, processing
and storage of data. Cross-border transfers of data have facilitated the rise of
global value chains, which according to the OECD account for close to three-
quarters of the value of international trade.2 These transfers have also facilitated
the integration of services and manufacturing. In OECD countries, including the
EU, between 25 and 40% of the value of manufacturing exports is accounted for
by services inputs.3 During the COVID-19 pandemic, cross border flows of data
have helped to coordinate economic activity internationally, mitigate the adverse
effects on trade, and support critical value chains such as medicines.4
The centrality of data to modern societies has also given rise to a number of public
policy objectives. These include the protection of personal data, national security,
the market power of digital networks, sectoral regulation matters, and industrial
policy objectives. Some of these have led countries to develop policy frameworks
that either restrict cross-border data flows, or have the potential to restrict by
making these flows conditional on demonstrating compliance with policy
objectives.
“Data localisation” refers to a range of policy interventions that restrict the extent
to which data that is generated in a jurisdiction (e.g. by businesses, organisations
or individuals) may be accessed, used or stored outside that jurisdiction. Data
localisation involves to some degree restrictions on cross-border trade.
In view of the array of data policy issues discussed above, countries have also
sought ways to maintain sufficient policy flexibility to regulate cross-border data
flows, including via localisation requirements, while at the same time also seeking
to secure the benefits of cross-border data flows. This gives rise to trade-offs, and
data governance frameworks often reflect ways of trying to manage these trade-
offs. The General Data Protection Regulation (GDPR) adopted by the EU reflects
one particular type of approach: it makes liberalisation of cross-border data flows
conditional on the trade partner demonstrating that its data governance framework
provides equivalent levels of data protection to that accorded within the EU
(”adequacy”), or on the existence of equivalent safeguards under other transfer
mechanisms (e.g. standard contractual clauses and binding corporate rules). More
generally many countries have sought to agree international rules, particularly
through Free Trade Agreements, that eliminate restrictions on cross-border trade,
and that attempt to limit the effects of measures, taken for other policy purposes,
on cross-border data flows.
2
https://www.oecd.org/trade/topics/global-value-chains-and-trade/
3
https://www.oecd.org/industry/ind/tiva-2018-flyer.pdf
4
The terms ‘cross-border data flows’ and ‘cross-border data transfers’ are used interchangeably in this
report.
frontier economics 8THE VALUE OF CROSS-BORDER DATA FLOWS TO EUROPE: RISKS AND
OPPORTUNITIES
The OECD has documented that the international context for cross-border data
flows has become more restrictive over the last decade. Given the importance of
data flows to trade, this raises the question of what costs such developments might
impose on the EU should they persist, and, conversely, the benefits of securing
more liberal arrangements.
1.2 Terms of reference
DIGITALEUROPE asked Frontier Economics (Frontier) to assess the extent to
which the EU economy and the economies of EU Member States are reliant on
cross-border data flows. The assessment is required to estimate how changes in
policy restrictions on cross-border data flows (i.e. data localisation) would impact
key economic indicators including GDP, employment and trade.
This report sets out our findings and the underpinning evidence. Chapter 2 outlines
the role of cross-border data flows in key sectors in the EU economy. Chapter 3
sets out our modelling approach to estimate the impact of changes in policy
restrictions on cross-border data flows on key economic indicators. Chapter 4
reports the modelling results.
frontier economics 9THE VALUE OF CROSS-BORDER DATA FLOWS TO EUROPE: RISKS AND
OPPORTUNITIES
2 THE ROLE OF CROSS-BORDER DATA
FLOWS IN THE EU ECONOMY
2.1 Uses of data in the modern economy
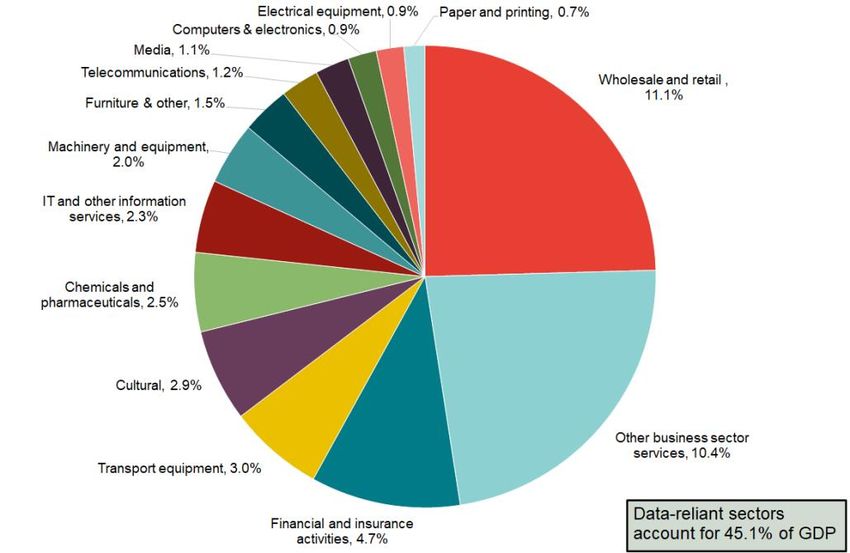
The use of data is an increasingly important component of all advanced
economies. Businesses can generate value from data in several ways,
summarised into four main economic purposes in recent work by the OECD, and
described in the figure below.5
Figure 1 Ways in which businesses rely on data
Source: Adapted from Nguyen and Paczos (2020)
Cross-border data flows can occur as part of all four ways of using data:
First, using data requires preliminary steps (a “data value chain”), and data may
flow between different geographies between each step in the data value chain;
Second, once the final step in that value chain is reached, using and monetising
data may involve a cross-border exchange.
This applies to all forms of data, including personal data. In both cases, data flows
may underpin monetary transactions between different organisations, or they may
underpin operations that take place within the same company. This distinction
matters for the measurement of the impact of data flows: in the former case, the
exchange is recorded by official statistics on international trade as an
import/export; in the latter, the exchange is often not recorded and measured
outside of the organisation using the data. Therefore, as discussed in Section 3,
we model the impact of data flows on international trade. This means that our
estimates are conservative as they do not include the economic value of intra-
company cross-border data flows.
Cross-border flows within the data value chain
Individual data points do not automatically generate value for firms, governments
and consumers. Instead, the value of data is highly context specific. For example,
the data of an individual person may be valuable to that person, but only hold
broader value when aggregated with data from many other individuals and other
sources of data.
Value is extracted from data through a “data value chain”: firms need to collect raw
data (stage 1), aggregate the data (stage 2), and analyse the data (stage 3) before
the data is finally used and monetised (stage 4). The use and monetisation stage
may itself generate additional data, which is in turn aggregated, analysed, and
5
https://www.oecd-ilibrary.org/docserver/6345995e-
en.pdf?expires=1623000458&id=id&accname=guest&checksum=8319D67CA66D0C1DEBA1FFB53621747
E
frontier economics 10THE VALUE OF CROSS-BORDER DATA FLOWS TO EUROPE: RISKS AND
OPPORTUNITIES
used. This feedback loop has been described as a “data value cycle” (see Figure
2).6 Throughout this value chain, data may be stored in a different location
compared to where the data is collected, aggregated, analysed and used.
Each step in the data value chain may take place in different geographies.
Consider for example a hypothetical retailer headquartered in Germany. This
retailer may commission a specialist market research company to collect data on
its customers in Germany, France, and the UK (step 1); the data may then be
aggregated and analysed by a data analytics provider based in Ireland (steps 2
and 3), and results from the analysis may inform strategic business decisions that
are taken at the retailer’s headquarters in Germany (step 4). In this example, each
step in the data value chain involves international trade in services (imports/exports
of services) and an associated flow of personal data between different companies.
Even if the collection, aggregation and analysis, and use of data all took place
within the same company (the hypothetical retailer), this data value chain may
involve the same cross-border data flows. At the very least, data from customers
in Germany, France and UK would be aggregated in one location, e.g. where the
company’s main analytics and insight function is based. Aggregation allows
drawing insight from larger datasets and potentially learning from cross-country
differences. The analytics and insight function may not be based in Germany,
France or the UK: for example, this company may have decided that Dublin is the
best and most cost-effective location to attract data analytics talent to the company.
Figure 2 The global data value cycle
Data use and monetisation involving cross-border data flows
Even when the collection, aggregation, analysis and storage of data all take place
within one geography, using the data may involve cross-border data flows. A
simple example is where the data is itself the product being sold. For example,
consider a market research company based in the EU. This company may sell data
6
https://www.oecd-ilibrary.org/docserver/6345995e-
en.pdf?expires=1623000458&id=id&accname=guest&checksum=8319D67CA66D0C1DEBA1FFB53621747
E
frontier economics 11THE VALUE OF CROSS-BORDER DATA FLOWS TO EUROPE: RISKS AND
OPPORTUNITIES
on the habits of EU customers to retailers based elsewhere, for example a
Japanese car manufacturer interested in designing new electric vehicles tailored
to the EU market. Similarly, exporting and importing data-enabled products and
services will typically involve cross-border data flows. For example, if a German
manufacturer sells a “connected car” to a Spanish customer, this may involve data
on the customer’s driving in Spain being transferred to Germany. Indeed, section
2.2.2 below provides examples of how digitalisation allows manufacturers to
provide their goods to customers “as a service”: this involves an ongoing
relationship with the customer with associated data flows.
On the opposite end of the spectrum described in Figure 1, cross-border data flows
may also occur when data is used to improve an existing product or process. For
example, an automobile parts manufacturer and an automobile manufacturer may
exchange data across borders to ensure that levels of demand and supply are
aligned, or in the research & development process, to ensure that the
specifications of a new car part match the requirements of a new vehicle. This
example is a very simple case of a global value chain. As already observed in the
introduction, the growth of global value chains is a very important development in
the evolution of the world economy. Developments in information technology have
reduced costs of storing and transmitting data. Associated with falling transport
costs and a lowering of trade barriers, these developments have stimulated a
geographic unbundling of production. In other words, value chains are increasingly
broken down into a large number of steps and components (“tasks”), and countries
or regions increasingly specialise in such tasks.7 In such circumstances, the cross-
border flow of data is not only intrinsically tied to international trade, it is also a
driving force behind the ways in which it develops.
Cross-border flows as a driver of international trade
Providing a comprehensive taxonomy of all the ways in which data flows across
borders is beyond the scope of this report. However, the discussion presented so
far shows how the popular perception that data flows only benefit search engines
and social networks is misconceived. In fact, a range of sectors rely on cross-
border data flows. And it is not just activities by firms that rely on cross-border data
flows. Government agencies also need firms to be able to transfer data across
borders as part of financial oversight, drug approval, law enforcement,
counterterrorism, and other responsibilities.
In summary, cross-border data flows facilitate international trade in the following
ways:
Across all ways in which data is used, cross-border data flows allow trade in
the data value chain: data collection, aggregation, analysis, and use can be
imported or exported;
Data can be exported: sold or licensed to customers abroad;
Exports and imports of data-enabled products and services (e.g. connected
cars, online platforms…) typically require cross-border data flows;
7
See notably D.K Elms and P. Low (eds) 2013, Global Value Chains in a Changing World,
frontier economics 12THE VALUE OF CROSS-BORDER DATA FLOWS TO EUROPE: RISKS AND
OPPORTUNITIES
When data is used to improve existing products or processes, cross-border
data flows allow:
□ Coordinating operations across global value chains: many sectors
feature operations that span international geographies, and a significant
part of their trade is internal to these value chains;
□ Facilitating the flow of inputs of goods and services from different
parties in different locations across the value chain, and notably facilitating
the integration of services and goods (servicification), whether this takes the
form of services inputs (e.g. software services in vehicles) or the bundling
of services and goods (GPS data services and insurance services bundled
into the sale of a vehicle). See also the discussion in section 2.2.2 below.
□ Reducing transaction costs with end-users and customers in export
markets since the initiation and completion of cross-border transactions
between buyers and sellers typically involves transferring some data, e.g.
regarding contracts or specifications of orders, packaging and delivery. For
services sectors in particular, cross-border data flows can increase the
scope for supplying services remotely, limiting the need to avoid the fixed
costs associated with establishing a physical presence.
2.2 Case studies of how different sectors rely on
cross-border data flows
To illustrate the importance of cross-border data flows to the EU economy,
consider the role these data flows play in two sectors: Pharmaceuticals and
Healthcare, and Manufacturing.
2.2.1 Pharmaceuticals and Healthcare
Cross-border data sharing plays an important role across many activities within the
Pharmaceuticals and Healthcare sectors. This includes the screening of chemical
compounds, the optimisation of clinical trials, and in the post-market surveillance
of drugs, leading to new treatments, improved patient outcomes, and lower costs.8
While health information is a particularly sensitive category of data, its potential to
improve and save lives also makes it highly valuable.
In the case of medical research the cross-border sharing and aggregation of data,
including genetic and other health-related data, is an essential part of improving
healthcare and disease prevention, in terms of ensuring sufficiently large sample
sizes, identifying complex pathways, and comparing the determinants and
outcomes of disease in different settings (ALLEA, EASAC and FEAM, 2021).
This is particularly the case for rare diseases. Without data flows and data
aggregation it becomes significantly harder to identify and collect enough data in
each and every country, given many countries only have small patient populations.
International co-operation in life sciences is widespread. It is estimated that in 2019
there were more than 5,000 collaborative projects between EEA countries and the
US National Institutes of Health alone (NIH, 2019). In addition, the U.S. Food and
8
https://itif.org/publications/2021/03/25/how-build-back-better-transatlantic-data-relationship
frontier economics 13THE VALUE OF CROSS-BORDER DATA FLOWS TO EUROPE: RISKS AND
OPPORTUNITIES
Drug Administration’s (FDA) clinical trials database shows that more than a fifth of
industry funded clinical trials were engaging patients on both sides of the Atlantic
(including 6 COVID-related clinical trials).
As explained in Kepes et al. (2021), there are pharmaceutical companies which
carry out their clinical trials in the EU and rely on cross-border data transfers of get
authorisation for new treatments from regulatory authorities outside the EU. If this
is not possible, these pharmaceutical companies may need to duplicate their
research investment, carrying out clinical trials both within and outside the EU.
In addition, cross-border data transfers have been critical during the global
coronavirus pandemic. Without such data transfers, the development of COVID-
19 vaccines likely would have been delayed, with significant economic and health
impacts (Kepes et al., 2021).
2.2.2 Manufacturing
The global nature of all facets of manufacturing – including research and
development, supply chain management, design, production, sales, and customer
and after-sales support – and the advent of smart manufacturing mean that modern
manufacturing firms rely heavily on cross-border data flows.
Smart manufacturing is the application of information and communication
technologies to manufacturing processes.9 Through the aggregation and
processing of data, smart manufacturing provides manufacturers with a
comprehensive view of what is happening across the production system, along
with the insights to make real-time adjustments in order to optimise production.
This enables firms to effectively coordinate their research and development, supply
chains, production, sales, and post-sales processes. A “plugged in” manufacturer
can receive real-time information from suppliers to adapt to supply chain
disruptions or use data analytics from across the supply chain to adjust to meet
shifting demand.
The role of data flows within smart manufacturing is illustrated by the way
manufacturers use key enabling technologies such as cloud computing and sensor
technologies.
Cloud computing and sensor technologies
Cloud computing is the delivery of on-demand computing services such as
applications, storage and processing power typically over the internet, and it allows
firms to store and process the data necessary to manage their manufacturing
operations, and use new production systems, from 3D printing to the Internet of
Things (IoT) and industrial robots.
Sensors embedded within devices, machines, and products themselves measure
everything from output, consumption, wear, and capacity to salient operating
conditions such as temperature, humidity, and electrical flow, and play a key role
in creating the information streams upon which smart manufacturing techniques
rely. Over the past 15 years, the cost of sensor technologies has declined more
9
Smart manufacturing is also known as “Industry 4.0”. The term originated in 2011 from a project in the high-
tech strategy of the German government, which promoted the digitalisation of manufacturing.
frontier economics 14THE VALUE OF CROSS-BORDER DATA FLOWS TO EUROPE: RISKS AND
OPPORTUNITIES
than a hundredfold.10 This highlights that cross-border data flows are not just
consumer-to-consumer or business-to-consumer. Cisco estimated that out of the
approximately 18.4 billion networked devices in use in 2018, 24 per cent served
business customers, and a growing number of business-to-business (or machine
to machine) applications, such as smart meters, transportation, and package and
asset tracking are now major drivers in the growth of Internet-connected devices.11
Cross-border machine-to-machine data flows allow manufacturers to move
towards a predictive and preventative maintenance and repair model, rather than
a “repair and replace” model, both on the factory floor and for products deployed
in the field. The McKinsey Global Institute has estimated that the use of predictive
maintenance techniques reduces factory equipment maintenance costs by up to
40 percent, while reducing equipment downtime by up to 50 percent, and capital-
equipment investment costs (to replace defective equipment) by 5 percent.12
Sensor data can also have personal components. For workers this can include
sensors that track their movements on the factory floor. For example, sensors in
wristbands can be used to track where warehouse employees are placing their
hands. This can feed into performance assessment, help manufacturers to
optimally design the layout of factories, and even (via vibrations) nudge workers to
take certain actions in real time. For example, wearable sensors can leverage
personal data to predict and prevent injuries in the industrial workplace be notifying
workers when they make dangerous movements.13
Sensors can also be used to transfer personal data from final customers. For
example, automotive manufacturers rely on transfers of personal data on driving
behaviour and geolocation. Several manufacturers, including Audi, Mercedes and
Volvo, even offer drowsiness detection systems that monitor a vehicle's
movements, such as steering wheel angle, lane deviation, time driven and road
conditions.14
Data-reliant products and the servicification of manufacturing
One of the consequences of the trends described above is that services have
become closely integrated into manufacturing, a phenomenon that goes by the
(rather unwieldy) title of “servicification”. The phenomenon can be broken down
into various aspects:
10
http://www2.itif.org/2016-policymakers-guide-smart-
manufacturing.pdf?_ga=2.229420636.1748280977.1622887938-1338740611.1622720210
11
https://www.cisco.com/c/en/us/solutions/collateral/executive-perspectives/annual-internet-report/white-
paper-c11-741490.html
12
https://www.mckinsey.com/~/media/McKinsey/Industries/Technology%20Media%20and%20Telecommunica
tions/High%20Tech/Our%20Insights/The%20Internet%20of%20Things%20The%20value%20of%20digitizin
g%20the%20physical%20world/Unlocking_the_potential_of_the_Internet_of_Things_Executive_summary.p
df
13
https://unreasonablegroup.com/companies/strongarm-tech
14
https://www.nytimes.com/2017/03/16/automobiles/wheels/drowsy-driving-
technology.html#:~:text=Several%20manufacturers%2C%20including%20Audi%2C%20Mercedes,time%20
driven%20and%20road%20conditions.
frontier economics 15THE VALUE OF CROSS-BORDER DATA FLOWS TO EUROPE: RISKS AND
OPPORTUNITIES
The role of services inputs into the value added of the final manufactured
products. These inputs can include R&D, IT and software, engineering services
and so forth.
The bundling of services and goods. Examples include after sales services
plans and financing plans. Data services can also be embedded into goods.
For example, a car may contain GPS systems and software, and this in turn
enables the purchaser to conclude data tracking services with a third-party
provider.
One specific example of how servicification can change business models can be
found in Kaeser Kompressoren, a German-based manufacturer of compressed air
systems and services. This business launched an “air-as-a-service” business
model in which customers no longer purchase Kaeser compressors but rather
lease the compressors and pay only for the compressed air itself. It means
customers can scale consumption up or down as the needs of their manufacturing
operations change, without needing to purchase new equipment.
The aviation and automotive sectors are often presented as paradigmatic
examples of servicification via data, and we consider the cases of Scania and
Airbus in the boxes below.
frontier economics 16THE VALUE OF CROSS-BORDER DATA FLOWS TO EUROPE: RISKS AND
OPPORTUNITIES
SCANIA
Scania is a global company offering sustainable transport solutions with a focus
on trucks, buses, and engines. Its headquarters are in Södertälje (Sweden), as
are its R&D, production, purchasing, sales, and IT systems. Scania also has
production sites in Brazil, Netherlands, Argentina, France, and Poland as well as
regional production centres in six other countries (all outside the EU).
When a Scania vehicle is driven a small box sends diagnostic data – speed, fuel
use, engine performance, even driving technique – to the company’s
headquarters in Sweden.
The vehicles would not function effectively without transferring data, and neither
would the repair of these vehicles. If a vehicle breaks down, data can be
transferred to a regional or global help desk for help in tracking and solving the
problem. The ‘old repair manual is replaced by a global data base’ and hence
effective repairs hinge on data transfers.
Indicative of the growing role of software and data, Scania is developing an open,
brand-neutral platform (the RIO platform) and operating system for software that
will host its telematics services as well as software from third parties, thus making
it easier for its partners and other transport manufacturers to adopt and use.
Scania has likewise increasingly transitioned to a services-based business model
focused on fleet management services including logistics, repair, and others. For
example, facilitated by the collection and sharing personal and nonpersonal data,
Scania offers an educational service that coaches drivers to help them improve,
such as with braking points and coasting. The purpose is to continuously coach
the driver on how to operate the vehicle in a more efficient and environmentally
friendly way. Overall Scania now generates one-sixth of its revenues through
new services enabled by the data-connected devices built into its vehicles.
frontier economics 17THE VALUE OF CROSS-BORDER DATA FLOWS TO EUROPE: RISKS AND
OPPORTUNITIES
AIRBUS
Airbus is the world's largest airliner manufacturer. Headquartered in the
Netherlands it has around 180 locations globally and 12,000 suppliers.15 Each
year Airbus’ aircraft enable millions of passengers to travel across cities,
countries, and continents.
The collection, aggregation, analysis and use of data has become fundamental
to the airline industry – the latest Airbus A350 has 50,000 sensors on board
collecting 2.5 terabytes of data every day.16
Airbus now believes that the “aviation industry is now entering into its next
revolution: connected, fully-digital aviation.”17 For example, in June 2017,
Airbus launched Skywise, an open data platform that aggregates and
processes large volumes of data from aircraft sensors, as well as data
operational and maintenance data recorded by pilots, flight attendants,
engineers, maintenance technicians and airport representatives. Today,
Skywise hosts data from Airbus, suppliers and more than 100 airlines including
EasyJet, Emirates and AirAsia.
The data – and the cross-border data flows that unpin the collection,
aggregation and processing of the data – enable services that provide real-time
and longer-term benefits for Airbus, airlines, suppliers and consumers. Real-
time remote access to in-flight data helps in identifying problems early on and
enable maintenance crews on the ground to be prepared for when the plane
arrives, reducing turn-around times, delays and cancellations.18 Longer-term,
Skywise data helps Airbus understand how their aircrafts behave in reality
(across different geographies and business models) and to improve the design
of new aircrafts models.19 Better aircraft will decrease operational cost, and
increase reliability, fuel efficiency and safety.
15
https://www.airbus.com/company/we-are-airbus.html
16
https://www.airbus.com/public-affairs/brussels/our-topics/innovation/data-revolution-in-aviation.html
17
https://www.airbus.com/public-affairs/brussels/our-topics/innovation/data-revolution-in-aviation.html
18
https://www.airbus.com/newsroom/press-releases/en/2019/04/airbus-launches-skywise-health-monitoring-
with-us-airline-allegiant-air-as-early-adopter.html
19
https://digital.hbs.edu/platform-digit/submission/skywise-airbus-bet-on-big-data/
frontier economics 18THE VALUE OF CROSS-BORDER DATA FLOWS TO EUROPE: RISKS AND
OPPORTUNITIES
3 APPROACH TO MODELLING THE IMPACT
OF DATA LOCALISATION
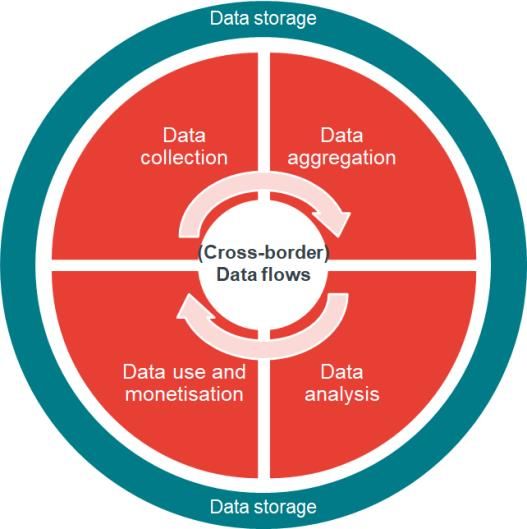
3.1 Overview of approach
Our approach includes the four steps set out in Figure 3 below.
Figure 3 Overview of approach
1 2 3 4
Focus on data-reliant Use OECD Counterfactual Calculate trade
industries STRI to analysis effects and
represent growth effects
restrictiveness
of policies
Draw on OECD work on ▪ A numerical measure ▪ Specify a baseline ▪ Use gravity model of
digital intensiveness [0 to 1] capturing a scenario that reflects trade to estimate
▪ Data either the core range of policy existing levels of effects of STRIs
element of the interventions and liberalisation/ changes on trade
business model regulations restrictiveness in EU between EU and
▪ Or key enabler in ▪ Policies affecting data and partners partners
operations and value are one subset. ▪ Liberalising scenario ▪ Growth effects
chains ▪ Measure effects of reflects decrease in calculated based on
restrictions on data STRI values relative to relationship between
flows, once other baseline trade and GDP
factors are controlled ▪ Restrictive scenario
for reflects increase in
▪ Changes in policy lead STRI values relative to
to a change in STRI baseline
value by sector by ▪ Changes apply to both
country EU and partners
Increase= more
restrictive
Source: Frontier Economics
The first step involves identifying sectors that are particularly data reliant, and
specifically reliant on cross-border flows of data, by virtue of their participation in
international trade and value chains (see also the analysis in section 2). This is
consistent with our observations in section 2. This approach recognises that while
data use is pervasive across all sectors, sectors vary in their degree of reliance on
data and cross-border data flows specifically. Data localisation implicitly acts as a
tax on cross-border data flows (see also the discussion in sections 3.3 and 3.4),
and this tax will be disproportionately borne by some sectors: those that are more
heavily reliant on cross-border data flows, with flow through consequences for the
economy as a whole.
The next step consists of identifying the extent of restrictiveness of data policies.
There are various ways of doing this. One is to collect data on actual costs faced
by businesses as a result of complying with data localisation requirements.
Another, which we adopt here in view of time constraints and tested robustness, is
the OECD’s services trade restrictiveness index. This allows us to develop a
numerical representation of a qualitative question – the degree of policy
restrictiveness.
frontier economics 19THE VALUE OF CROSS-BORDER DATA FLOWS TO EUROPE: RISKS AND
OPPORTUNITIES
The third step is to specify the scenarios for analysis. Quantitative analysis of policy
changes are counterfactual exercises: in this case we wish to compare outcomes
between projected future scenarios relative to a status quo baseline.
The last step is to model the outcome of these future scenarios using a gravity
model of trade. This allows us to capture the effects of changes to bilateral trade
between the EU and each of its main partners in the sectors of interest, as a result
of changes to restrictions in cross-border data flows, once other factors are
controlled for. These other factors include country fixed effects (e.g. size) and
policy variables. The modelling of trade effects provides a channel through which
to estimate growth effects, given the dependency of growth on trade.
We explain each of these steps in more detail, and the insights they yield, in the
sections below.
3.2 We identify sectors that are particularly data
reliant
We focus specifically on sectors that are data reliant. To identify these sectors we
draw on the OECD’s grading of sectors based on digital intensity, which itself is
based on seven criteria: ICT investment, software investment, ICT intermediate
goods, ICT intermediate services, robot use, online sales and ICT specialists)20
and apply a filter to remove sectors that are rarely traded internationally.21 Ideally,
this assessment would rely on information on the amount and characteristics of
data use in each sector. However, as mentioned earlier in this report, there is
limited available information on this. Therefore, the measures above are the best
available proxies on which sectors can be systematically compared across sectors.
The sectors selected through this process are involved in international trade (to
varying degrees), the only exception being public administration, which is thus
excluded from the analysis.
Based on this approach, the list of data-reliant sectors is set out in Figure 4, along
with their shares of EU GDP and employment. The sectors as a whole account for
45% of EU GDP. Of this, 11.4% is attributable to data-reliant manufacturing sectors
(in particular, the manufacturing of transport equipment, chemicals and
pharmaceuticals, machinery and equipment, furniture, computers and electronics,
electrical equipment, and paper and printing).22
20
Calvino, F., et al. (2018), "A taxonomy of digital intensive sectors", OECD Science, Technology and Industry
Working Papers, No. 2018/14, OECD Publishing, Paris, https://doi.org/10.1787/f404736a-en.
21
Sectors are considered data-reliant if they are in the top quartile for at least two of the seven criteria or in
the top two quartiles for at least four criteria.
22
Note that the trade modelling includes impacts across all services sectors, including transport and
construction. Although they fall outside the data-reliant category, they still exhibit some sensitivity to
services trade restrictions (albeit less than other services sectors), so are included in the trade modelling.
frontier economics 20THE VALUE OF CROSS-BORDER DATA FLOWS TO EUROPE: RISKS AND
OPPORTUNITIES
Figure 4 Data-reliant sectors and their shares of EU GDP
Source: Frontier Economics analysis of OECD Trade in Value Added Database
Source: Other business sector services includes Legal & accounting, Scientific R&D, Marketing and
Administrative services. The sector shares are as reported in TiVA for the year 2015. While subsequent modelling
applies growth in line with overall IMF statistics and forecasts, the sector shares are not assumed to change.
But that does not capture the value of cross-border data flows to the EU. To
develop an understanding of that value, we look at how these sectors are impacted
by changes to the levels of restrictiveness applied to cross-border data flows via
the effects on trade between the EU and major partners involving these sectors.
We focus on trade for the reasons documented in section 2: cross-border data
flows play an important role in facilitating international trades, and restrictions on
cross-border data flows increase the costs of doing international trade.
3.3 We measure restrictions on cross-border data
flows affecting these sectors
We capture the extent of restrictions on data through the OECD’s services trade
restrictiveness index (STRI). The STRI scores countries by assessing various
aspects of regulation that affect cross-border trade. While the focus is on services
trade, the STRI is also relevant to goods given the interdependence between
goods and services, a feature that has been enhanced considerably through
digitisation and data.
The STRI includes a specific component on cross-border restrictions on data flows,
which captures different types of restrictions that if implemented increase the
overall level of restrictions. Each of these restrictions is weighted equally for any
given sector, though weights differ by sector. Adding (removing) any one restriction
increases (decreases) overall restrictiveness by the same proportion as any other
data restriction in that sector.
frontier economics 21THE VALUE OF CROSS-BORDER DATA FLOWS TO EUROPE: RISKS AND
OPPORTUNITIES
These specific restrictions are:
Cross-border transfer of personal data is possible when certain private sector
safeguards are in place;
Cross-border transfer of personal data is possible only to countries with
substantially similar privacy protection;
Cross-border transfer is subject to approval on a case-by-case basis;
Certain data must be stored locally; or
Cross-border transfer of data is prohibited.
Each sector within a country is assessed according to these aspects, which can
be cumulative. The higher the STRI score, the more restrictive a country is.
In terms of interpretation, the STRI should be understood as a tool for comparing
the levels of restrictiveness across different countries and sectors, and to
understand the specific types of restrictions that contribute to it. The components
in it, and the weights attached to them, are arrived at in a detailed deliberative
procedure, leveraging a consensus view across sector experts. The five
restrictions specified in relation to data in the STRI will not capture all the nuance
around restrictions on data, and there is scope for some overlap between them.
They are intended to give a summary view of how different countries and sectors
compare. From this we can derive indicative estimates of how trade would change
if countries increased or decreased their restrictiveness.
3.4 We model two scenarios with different restrictions
on cross-border data flows
3.4.1 Scenarios
We use a gravity model of trade which includes the STRI as one variable explaining
bilateral trade flows in order to capture the effects of changes in data
restrictiveness on trade between the EU and partners in the sectors of interest.
The modelling requires specifying a baseline against which changes to the degree
of restrictions on cross-border data flows under hypothetical scenarios can be
measured. The change in the number of STRI restrictions in place is used to
compute changes in STRI score for both EU and trading partners, from which
percentage trade impacts are calculated. The STRI changes under the different
scenarios can be summarised as follows:
Figure 5 STRI changes by scenario
Country group Challenge scenario: Growth scenario
China, India and Russia All 5 data restrictions Removing data restrictions
apply’ so only one remains active
EU and other countries Two new data restrictions One data restriction is
are added removed
Source: Scenario assumptions
frontier economics 22THE VALUE OF CROSS-BORDER DATA FLOWS TO EUROPE: RISKS AND
OPPORTUNITIES
The baseline
This represents current policy settings in the EU and major trade partners. We
assume that existing GDPR data transfer mechanisms apply, although under
increased scrutiny, and that the UK is granted adequacy. We assume that other
trade partners maintain levels of restrictiveness reported as at end 2020.
The challenge scenario
In this scenario, global levels of restrictiveness increase. Liberal data regimes (the
EU, the US, Canada, Japan, and Switzerland, for example) become moderately
restrictive, and more restrictive regimes (India, Russia and China, for example)
become highly restrictive. In the EU, GDPR transfer mechanisms generally cannot
be relied on, and additional restrictions are introduced for international data
transfers under the EU’s data strategy (e.g. Data Governance Act and Data Act).
This includes the possibility of requiring businesses that are data intermediaries to
establish a legal representation in the EU (a form of localisation of business
presence in addition to any data localisation requirements per se). In practical
terms this means the restrictive countries move to the highest restrictiveness level
in our model (five elements of STRI restrictions), while other countries add two
STRI elements.
Growth scenario
Major trading partners undertake commitments to eliminate restrictions on cross-
border data flows. Flexibility to pursue public policy objectives is retained, but
countries accept disciplines that seek to ensure that public policy measures are no
more trade restrictive than necessary to achieve the policy purpose that is sought.
We assume that for restrictive jurisdictions, there is greater level of flexibility
(reflecting their status as developing countries) so their restrictiveness does not
converge to those of developed countries. In addition, any remaining uncertainty
around GDPR transfer mechanisms is eliminated, and an enhanced Privacy Shield
is negotiated with the US and upheld by the Court of Justice of the EU.
In terms of representing this scenario in the modelling framework, we assume that
most countries shed one element of restrictiveness. For example, if jurisdictions,
under the baseline, require that partners must have substantially similar privacy
protections as a pre-condition for liberalising data transfers, we assume that this
requirement is lifted in the growth scenario.
By contrast, we assume that the currently restrictive countries, notably China, India
and Russia, substantially liberalise. Specifically, they converge to one line of STRI
restriction. This is the same level that most OECD and EU countries are at now.
But as China, India and Russia together account for a fairly small share of EU
trade, the growth scenario is therefore relatively incremental. In practical terms the
growth scenario involves the restrictive countries moving to one line of restriction,
while other countries remove one line.
frontier economics 23THE VALUE OF CROSS-BORDER DATA FLOWS TO EUROPE: RISKS AND
OPPORTUNITIES
3.4.2 Use of gravity models
The technical annex explains these models in greater detail. Gravity models are
the workhorse of international trade analysis. They model trade between pairs of
countries as a positive function of their respective size and inversely proportional
to the square of the distances between them. Distance acts as a basic variable of
trade cost. Other variables that affect trade costs can be included, such as linguistic
differences, institutional quality and trade variables. Trade variables include the
STRI. We can thus capture the effects of changes to data restrictiveness once
other factors are accounted for.
The key parameter of the gravity model, for our purposes, is the elasticity that
captures the responsiveness of bilateral trade flows in the sectors of interest to
changes in the STRI. In practical terms, we run the model for each scenario: in
each scenario, the STRI assumes a different value in line with the level of
restrictiveness assumed for the country/ jurisdiction in question.
The impact on a country’s exports is the product of the increase in partner
restrictions and the increase in own restrictions. The latter effect reflects the fact
that when a country imposes localisation measures, it affects its own firms as well
as foreign ones. Moreover, because localisation increases trade costs, it biases
production towards home markets, i.e. it functions as an export tax.
3.5 Limitations
The overall approach is conservative, in the sense that it is likely to understate the
economic effects of changes to restrictions. This is for several reasons:
The STRIs may not capture all aspects of policy that affect data flows. That is,
there may be other aspects of data policies that are not reflected in the specific
elements of the STRI. For instance, limitation on the legal structure of data
providers or ownership restrictions are not captured by the data segment of the
STRI. Similarly, indices such as the STRI are not equipped to capture the
effects on businesses of uncertainty concerning future policy changes.
Building on the above, some aspects of data regimes (e.g. the draft Data
Governance Act) also specify localisation requirements in terms of business
operations, e.g. establishing a commercial presence and registering as a local
entity for data intermediaries. These restrictions are captured by the STRI, but
we do not include them in the model as we seek to focus primarily on
restrictions imposed on data flows.
Our approach uses trade and national account data, which is based on
transactions whose value can be observed because they involve a flow of
money between parties. However, data flows are also important to activity
within firms (e.g. between the software and research division of a firm, and its
production division). These activities are significant but are not captured in
trade data. Moreover, national account data will not capture non-market
benefits (such as health and environmental benefits) that are enabled by the
activity of data-reliant sectors (e.g. the contribution of engineering services and
wind turbines to reducing greenhouse gas emissions).
frontier economics 24THE VALUE OF CROSS-BORDER DATA FLOWS TO EUROPE: RISKS AND
OPPORTUNITIES
The relationship between GDP and trade reported in this analysis reflects some
of the longer-run effects of data restrictions, via trade, on innovation and
productivity. However, our approach does not explicitly address the underlying
mechanics of these relationships or some of the broader effects of data flows
on innovation For example, research and development activities and product
testing often occur through cross-border value chains that involve large scale
flows of different types of data (industrial, IP, and personal data). While this is
captured in the observed relationship between productivity and trade, it is not
possible to see the mechanism of action. In addition, as these are average
effects looking at trade overall (rather than the effects of data), the impact in
the context of European countries and sectors might be more specific.
Our modelling approach implicitly assumes that the proportion of activities in
the EU economy that are “data reliant” remains constant over the next decade.
However, it is likely that further digitalisation of the EU economy will take place,
meaning both that more sectors will be data reliant, and that the importance of
data may increase further in sectors that already are data reliant. As a result,
the importance of cross-border data flows may be greater in the future.
frontier economics 25THE VALUE OF CROSS-BORDER DATA FLOWS TO EUROPE: RISKS AND
OPPORTUNITIES
4 THE IMPACT OF DATA LOCALISATION
ON TRADE AND ECONOMIC GROWTH
In this section, we draw on the key role that cross-border data flows play in modern
international trade to measure their overall economic contribution. We measure the
impacts of policy scenarios that lead to changes in the extent of data localisation
compared to current settings. Section 4.1 models the impacts of the policy
scenarios described in the section 3.4 on trade providing detail in terms of countries
and sectors. Section 4.2 reports estimates for GDP and employment by policy
scenario, based on the estimated trade effects. Section 4.3 provides further
evidence in terms of the exporter firms affected and the trading partners. Section
4.4 considers the hypothetical case in which cross-border data flows are
prohibited, as a way of measuring the overall economic contribution they currently
make to the EU via trade. Section 4.5 presents some concluding observations.
4.1 Trade impacts of policy scenarios
4.1.1 Challenge scenario
Definition
Under the challenge scenario, previously liberalised jurisdictions become more
restrictive. In the EU, GDPR transfer mechanisms cannot be relied on to a large
extent, and additional restrictions are introduced for international data transfers
under the EU’s data strategy (e.g. Data Governance Act and Data Act). This
includes the possibility of requiring businesses that are data intermediaries to
establish a legal representation in the EU (a form of localisation of business
presence in addition to any data localisation requirements per se). Hitherto
restrictive jurisdictions move to the highest level of restrictiveness possible, by
mandating data localisation. In line with the relatively conservative approach taken,
we do not assume any changes to other (non-data) aspects of policy.
Main results
Table 1 reports the main results for this scenario. The table below shows the impact
on EU exports for the various sectors, first in absolute terms, then as a percentage
of sector exports (to see which are relatively more affected), and finally as a
percentage of total exports (across all sectors) to gain a sense of their overall
impact. Overall, we see annual impacts of €116bn, which represent 4% of total
(ex EU) exports. To put this into perspective, €116bn is equivalent
approximately to 20% of the fall in exports experienced by EU economies in
2008, linked to the global financial crisis.23
Manufactured goods account for just over half of this impact. The sectors most
heavily impacted in terms of the effect on their exports are IT, media, telecoms
and cultural services (which all see a 10% or greater decrease in their
23
According to World Bank data, EU exports fell by 12% (€601bn in today’s money) in 2008 compared to 2007.
frontier economics 26You can also read