QUÉBEC PUBLIC TRANSIT POLICY - BETTER CHOICES FOR CITIZENS Passenger transportation in Québec
←
→
Page content transcription
If your browser does not render page correctly, please read the page content below
Passenger
      transportation
          in Québec:
BETTER CHOICES FOR CITIZENS
                   QUÉBEC PUBLIC
                   TRANSIT POLICY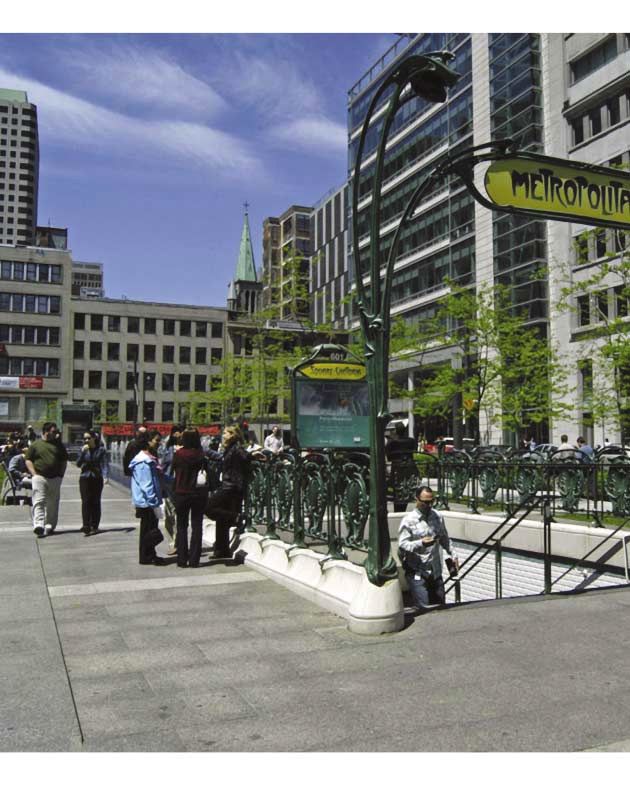
Passenger
      transportation
          in Québec:
BETTER CHOICES FOR CITIZENS
                   QUÉBEC PUBLIC
                   TRANSIT POLICY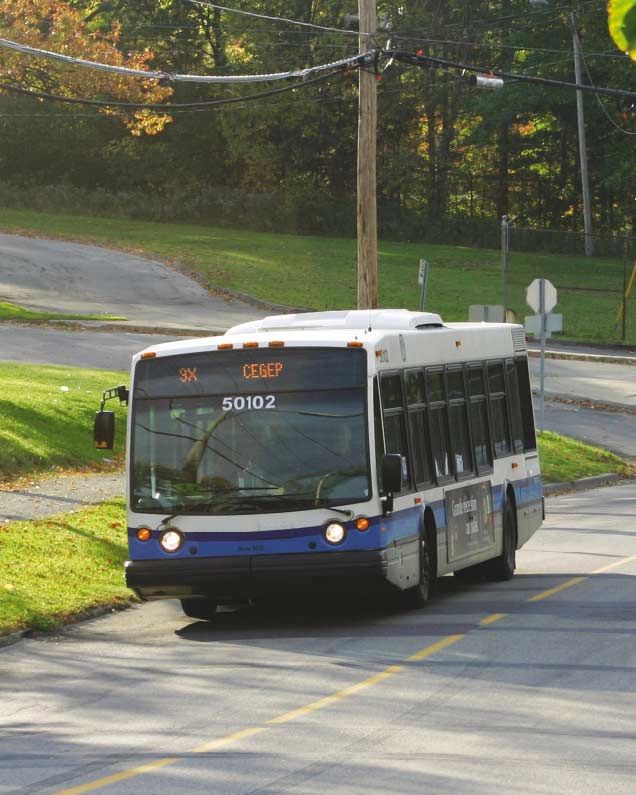
Cover page:
In association with the Réseau de transport de la Capitale

© Gouvernement du Québec
Ministère des Transports

ISBN-13: 978-2-550-48295-6 (PDF)
ISBN-10: 2-550-48295-6 (PDF)

Legal deposit – Bibliothèque et Archives nationales du Québec, 2006
Legal deposit – Library and Archives Canada, 2006
MESSAGE FROM THE
     PREMIER
     As promised, our government is now making public its policy on public transit,
     entitled Better Choices for Citizens. It reflects Québec’s aim to be a leader in
     sustainable development. Our Sustainable Development Act, the new strategy on
     energy and the Climate Change Action Plan are all a clear indication of our intention
     in this regard. The Québec Public Transit Policy is an extension of our government’s
     consistent efforts along these lines.

     It also brings us one step closer to the Québec we want by improving the quality
     of lives for today’s Québecers, while building the future for our children.

     Though our accomplishments are encouraging, we can still do better.
     Québec is a North American leader in the realm of public transit. We have every right
     to take pride in the accessibility of our public transit systems and the use we make
     of them compared to other modes of transportation.

     Yet we can do that much better by increasing the use of public transit.

     And this is the overriding issue addressed by Québec’s public transit policy.
     Our government is convinced that we can substantially increase ridership,
     which can only have a positive economic, environmental and social impact.

     Getting everyone involved
     We will achieve this by improving the services available to the public, investing
     in infrastructures and equipment, and offering new alternatives to motorists.

     All this will be achieved by asking everyone to do their fair share: the government,
     municipalities, public transit authorities, users, motorists and employers. The federal
     government will also be involved because of the resources at its disposal.

     Hence, the implementation of our public transit policy will depend on everyone’s
     contribution. I am confident that those efforts will be forthcoming because it is in
     everyone’s best interest.

     Premier of Québec

     Jean Charest

                                                     MESSAGE FROM THE PREMIER                  III
MESSAGE FROM THE
     Minister of Tranport
     Public transit is a crucial issue for our society.

     Urban development and prosperity as well as the quality of life of citydwellers depend
     on the accessibility and smooth operation of public transit. Public transit that provides
     people with outstanding service is a real alternative to the automobile, thus contributing
     directly to sustainable development, less dependence on oil and the battle against
     greenhouse gas emissions.

     Investing in public transit is also a lever for economic development because
     of the transportation industry’s role in our production chain.

     Clear goals, realistic funding
     The new policy on public transit published by our government embarks
     on the initiatives required to tackle this social challenge.
     It is the result of an extensive consultation process. In it, our government sets clear
     goals, all of which aim to increase the use of public transit over other modes of
     passenger transport throughout Québec, in both urban and rural areas.
     Implementation of this policy depends on realistic financing consistent with
     everyone doing their fair share.

     I therefore take great pride in unveiling Québec’s first policy devoted exclusively
     to public transit – a policy that will contribute to improving the quality of our lives and,
     above all, to giving people better options.

     Minister of Transport

     Michel Després

                                  MESSAGE FROM THE MINISTER OF TRANSPORT                            V
TABLE OF
      CONTENTS
      Message from the Premier                                                     III

      Message from the Minister of Tranport                                         V

      Note to the Reader                                                           XII

      SUMMARY                                                                     XIII

      INTRODUCTION                                                                  1

      CHAPTER 1       PUBLIC TRANSIT – A SOCIAL CHALLENGE                           3
      1.1 A prerequisite for urban development and prosperity,
          and quality of life for citydwellers                                      4
      1.2 A contribution to sustainable development                                 4
      1.3 A lever for economic development                                          5
      1.4 A means of saving energy and reducing the use of petroleum products       5
      1.5 A means of combatting greenhouse gas emissions                            6
      1.6 A means of improving public health and quality of life                    7

      CHAPTER 2       THE GOAL SET AND THE MEANS TO ATTAIN IT                       9
      2.1 The new policy’s goal: Greater use of public transit                    10
           2.1.1 Assets                                                           11
                  2.1.1.1 Modern and efficient public transit services            11
                  2.1.1.2 Substantial use compared to elsewhere in Canada         11
                  2.1.1.3 Urban traffic levels that compare favourably to those
                          in the rest of North America                            13
                  2.1.1.4 Converging indicators                                   13
           2.1.2 A still-fragile situation                                        13
      2.2 The goal: An 8% increase in ridership by 2012                           15
      2.3 The means selected                                                      15

                                                                    TABLE OF CONTENTS    VII
CHAPTER 3       GETTING EVERYONE TO DO THEIR FAIR SHARE                         17
       3.1 The present situation: Who pays what for public
           transit?                                                                    18
       3.2 Primarily a municipal responsibility                                        20
            3.2.1 Operating costs – A municipal responsibility                         21
            3.2.2 Capital expenditures: Arranging sources of complementary
                  funding outside the government                                       21
            3.2.3 Municipal road network management and urban development bylaws       22
       3.3 Public transit authorities: Delivering quality services efficiently         22
       3.4 The government: Serving as coordinator and coach                            22
       3.5 Users: The main beneficiaries, who have to pay their fair
           share of the costs                                                          23
       3.6 Motorists: Beneficiaries who must also contribute                           23
       3.7 Employers: Facilitating beneficiaries                                       24
       3.8 The federal government: A new partner                                       24
       3.9 The Montréal area: Rectifying the regional imbalance                        24
       3.10 The governance of Québec transit authorities                               27

       CHAPTER 4       IMPROVING SERVICES                                              29
       4.1 Direct funding for improving services:
           A public transit envelope from the Green Fund                               30
       4.2 Tax incentives for public transit                                           31
            4.2.1 Public transit passes                                                31
            4.2.2 Reimbursement of the diesel fuel tax                                 31
       4.3 Public transit safety and security                                          31

       CHAPTER 5       MODERNIZING AND DEVELOPING INFRASTRUCTURES
                       AND EQUIPMENT                                                   33
       5.1 The need to upgrade aging infrastructures and
           equipment                                                                   34
       5.2 Major investments already announced                                         34
       5.3 More government aid for capital expenditures                                35
            5.3.1 SOFIL’s assistance program for public transit capital expenditures   35
            5.3.2 The government assistance program for public transit                 35

VIII
5.4 Enhancing the government assistance program for public transit                37
     5.4.1 An innovation dimension                                                37
     5.4.2 New eligible expenses                                                  37
     5.4.3 A three-year financial framework                                       37
     5.4.4 Municipalities with a population under 20,000                          37
     5.4.5 Access to transportation for people with reduced mobility              37

CHAPTER 6       OTHER ALTERNATIVES TO DRIVING                                     39
6.1 Sparsely populated municipalities                                             40
6.2 Intraregional transportation by bus and access to buses and taxis             41
6.3 Initiatives by public institutions, private enterprise and industrial parks   42
6.4 Walking and cycling                                                           42
6.5 Improving the energy efficiency of passenger transportation by road           44

CHAPTER 7       EXPECTED RESULTS                                                  45

CONCLUSION A POLICY FOR ALL QUÉBECERS                                             49

APPENDICES                                                                        51
APPENDIX I      PUBLIC TRANSIT AUTHORITIES                                        53
APPENDIX II     DESCRIPTION OF ROLES                                              55
APPENDIX III    CURRENT FUNDING SYSTEM                                            57

                                                                 TABLE OF CONTENTS     IX
LIST OF GRAPHS
AND TABLES
Graph 1 Change in the modal share of public transit in Québec, 1991-2016
(working days in autumn) 10
Graph 2 Change in the number of public transit trips per resident
served in Québec and the rest of Canada, 1991-2004 12
Graph 3 Change in the modal share of public transit in certain
Québec agglomerations, 1991-2016 (working days in autumn) 14
Graph 4 Financial contributions of public transit partners in Québec,
2004 18
Graph 5 Contribution by partners to public transit funding in Québec
and the rest of Canada, 2004 20
Graph 6 Actual and planned investments in public transit in Québec,
1995-2015 23
Graph 7 Change in the percentage of trips made by walking
and cycling in Québec, 1991-2016 (working days in autumn) 43
Graph 8 Change in the modal share of public transit in Québec,
1991-2016 (working days in autumn) 46
Table 1 Use of public transit in Québec and elsewhere in Canada,
2004 12
Table 2 Modal share of public transit in select Canadian agglomerations,
2001 15
Table 3 Public transit fares in select Canadian agglomerations,
2006 19
Table 4 Breakdown of public transit funding provided by SOFIL
and contributions required of municipalities,
2006-2010 36
Table 5 Public transit assistance program –
Subsidy rate by category 58
XACRONYMS
ACIT Association des Conseils intermunicipaux de transport
AEE Agence de l’efficacité énergétique
AMT Agence métropolitaine de transport
ATCQ Association Transports collectifs Québec
ATUQ Association du transport urbain du Québec
CMQ Communauté métropolitaine de Québec
CMTC Conseil métropolitain de transport en commun
COTREM Conseil des transports de la région de Montréal
CPI Consumer price index
CUTA Canadian Urban Transit Association
FQM Fédération québécoise des municipalités
GHG Greenhouse gas
IBT Intermunicipal Board of Transport
LRT Light rail transit system
MITA Municipal and intermunicipal transit agency
MMC Montréal Metropolitan Community
MTQ Ministère des Transports du Québec
OPHQ Office des personnes handicapées du Québec
PTA Public transit authority
PTC Public transit corporation
RCM Regional County Municipality
REC Regional Elective Council
RPTB Regional Public Transport Board
SOFIL Société de financement des infrastructures locales du Québec
SPTB Standardized property tax base
UMQ Union des municipalités du Québec
XINOTE TO THE
READER
This Québec policy focuses essentially on ground passenger transportation,
including that for people with reduced mobility. Hence it applies to the following modes:
urban and rural public transit, and interurban and intraregional transportation by bus.
It also covers alternatives to the use of private automobiles, such as walking
and cycling.
XIISUMMARY
The government is now making public Québec’s new policy on public transit – Better
Choices for Citizens – a policy directly in line with the implementation of sustainable
development because of the economic, environmental and social dimensions of access
to and use of public transit.
THE GOAL
The overall goal of the government’s new policy is to increase the use of public
transit throughout Québec, in both urban and rural areas.
• The government’s goal is an 8% increase in public transit ridership by 2012.
• This increase will enable public transit to gain a greater share of all modes of
passenger transportation.
To attain that goal, the government can count on modern, efficient public transit
services, a higher rate of public transit use in Québec than elsewhere in Canada,
and urban traffic levels that compare favourably to those in the rest of North America.
Despite this encouraging profile, the situation remains fragile, and the government,
together with its partners, must take a number of initiatives to increase the use of
public transit throughout Québec.
THE MEANS SELECTED
The government is adopting four sets of means to achieve its goal:
• The government wants everyone to do their fair share. Municipalities will retain
primary responsibility for public transit. The government will serve as coordinator
and coach while mainly assuming the bulk of the costs attached to upgrading and
maintaining infrastructures and equipment, a sum that could amount to $8 billion
over the next ten years based on the estimates provided by public transit authorities.
In its new policy, the government spells out each partner’s responsibilities as well as
what it expects of Ottawa. The new policy also includes initiatives aimed at rectifying
the imbalance in the Montréal area.
• The use of public transit depends on providing better services for the public.
To achieve this, public transit authorities will receive direct incentives for improving
the amount and quality of services they offer and encouraging people to make
greater use of public transit, through direct aid for service improvements. The
government will provide $130 million a year for this purpose from the component
of the Green Fund set up under the Climate Change Action Plan. There will be tax
incentives to induce employers and workers to make greater use of public transit.
Also, the government will pay special attention to public transit safety and security.
XIII• Initiatives are being taken to modernize and develop infrastructures and equipment.
The effort aimed at upgrading infrastructures and equipment is already under way,
with over $2 billion invested in the past ten years, while the minimum amount
needed for the next ten years is estimated at $4.6 billion. More must be done,
which is why public transit authorities will benefit from two funding programs for
public transit: the creation of SOFIL’s assistance program for public transit capital
expenditures, and enhancements to the government’s assistance program for
public transit.
• The government’s new policy is not limited to supporting public transit. It is also
backing other alternatives to the automobile. This aspect of the policy specifically
targets sparsely populated municipalities, regional county municipalities, and
regional elective councils, i.e. areas where there are few alternatives to driving,
intraregional transportation by bus, access to buses and taxis by people with
reduced mobility, public institutions, private enterprise and industrial parks where
promising initiatives have to be encouraged, as well as walking and cycling. The
government is also emphasizing initiatives aimed at improving the energy efficiency
of passenger transportation by road.
The measures encompassed by this fourfold set of means are summarized
in the table below.
EXPECTED RESULTS
Québec’s public transit policy also sets out the main results the government expects
to see in terms of ridership, the supply of services, energy consumption, pollutant
and greenhouse gas emissions, and traffic congestion.
XIVQuébec’s public transit policy
The goal
Increase the use of public transit throughout Québec
The target set
An 8% increase in public transit ridership by 2012 (40 million more trips by public transit a year),
thereby increasing public transit’s share of all modes of passenger transportation
The means selected
1 2 3 4
Have everyone do their fair share Improve the services available Modernize and develop infrastructures Support further alternatives
to the public and equipment to the automobile
Municipalities: Primary responsibility Direct funding for service improvements Improved government assistance for Sparsely populated municipalities
• Municipalities bear financial responsi- • $130 million a year to improve the ser- capital expenditures • Enhancements to the assistance pro-
bility for operating costs vices available to the public • SOFIL’s assistance program for public gram for rural public transit
• Extra assistance for capital expenditures • Public transit envelope from the Green transit capital expenditures • Incentive for making the regional elec-
on top of government funding Fund set up as part of the Climate • The government’s assistance program tive council responsible for coordinating
Public transit authorities: Provide quality Change Action Plan for public transit public transit in rural areas
services efficiently • Matching funding from municipalities Improvements to the government assis-
The government: Serve as coordinator • Signature of performance agreements tance program for public transit Intraregional transportation by bus and
and coach between the government, municipalities • An innovation dimension access to buses and taxis
and public transit authorities concerned • New eligible expenses
Users: The main beneficiaries, who have • Funding for regional connections
to bear their fair share of the costs • A three-year financial framework • Specific support for transportation for
Tax incentives for public transit • Eligibility of municipalities with a popula- people with reduced mobility
Motorists: Beneficiaries who must also tion under 20,000
do their share • Public transit passes Initiatives by public institutions, private
• Reimbursement of the diesel fuel tax • Access to transportation for people with enterprise and industrial parks
Employers: Facilitating beneficiaries reduced mobility
Incentives for walking and cycling
The federal government: A new partner New initiatives to bolster public transit More energy-efficient passenger trans-
The Montréal area: An imbalance to rec- safety and security portation by road
tify
Appointment of an agent and financial
proposal expected from the MMC by
September 30, 2006
Governance of public transit authorities
• Government openness
• Important to avoid wall-to-wall solutions
XVINTRODUCTION
The government is now making public its policy on public transit,
entitled Better Choices for Citizens.
• More than ever before, the development and optimal use of public transit poses a
social challenge: Chapter 1 discusses this fact by reviewing the close ties between
public passenger transportation, urban prosperity, economic growth and sustainable
development.
• Chapter 2 states the new policy’s goal and the four means selected to attain it.
Above all, the government wants to increase the use of public transit and will
achieve this by relying on major assets that must be put to the best possible use.
• Chapters 3, 4, 5 and 6 detail each of the four means being implemented in order
to describe the initiatives under way to attain the goal.
Thus Québec’s public transit policy covers in turn:
- the respective roles of the various parties involved in public transit, namely,
municipalities (who bear primary responsibility in this area), the government,
public transit authorities, users, motorists, employers and the federal government;
- the steps taken to improve services;
- the efforts made to modernize and develop infrastructures and equipment;
- the initiatives selected to provide new alternatives to the automobile.
• Chapter 7 presents the main results expected from the implemented policy.
• In conclusion, with its public transit policy, the government is reiterating its
underlying conviction: even though its track record is highly encouraging, public
transit can assume a greater role and people can be given choices that will benefit
society as a whole.
1Chapter 1
PUBLIC TRANSIT:
A SOCIAL CHALLENGE
Source: Ministère des Transports du Québec.PUBLIC TRANSIT:
A SOCIAL CHALLENGE
The development, good condition and increased use of 1.2 A CONTRIBUTION TO SUSTAINABLE
public transit pose an undeniable social challenge due to the DEVELOPMENT
economic, environmental and social factors related to its
existence and accessibility. Every time there is a shift from travelling by automobile to
using public transit, it helps to:
1.1 A PREREQUISITE FOR URBAN • decongest road traffic;
DEVELOPMENT AND PROSPERITY,
AND QUALITY OF LIFE FOR • reduce emissions of pollutants and greenhouse gases;
CITYDWELLERS • meet the transportation needs of workers, seniors,
students, people with reduced mobility and people with
In urban areas, public transit is essential for agglomerations modest incomes;
to function properly. It is a priority means of combatting
traffic congestion and reducing greenhouse gas emissions. • reduce traffic accidents, health costs, and insurance
It is worth recalling that in 2003, transportation alone premiums for drivers and the population as a whole;
accounted for nearly 37.5% of greenhouse gas emissions in
Québec. Public transit is an essential infrastructure, just like • encourage walking and counter the sedentary lifestyle
the road network and water and sewer systems. Could we associated with always driving;
imagine Montréal today without its metro or other public
transit services, or Québec’s large cities without bus lines? • make visitor stays more enjoyable by providing means of
transportation.
In sparsely populated areas, public transit also has a social
function. Just like in urban areas, for many people who live On April 13, 2006 the Québec government passed the
there it is the only means of getting to work, health Sustainable Development Act. It “[Unofficial translation]
establishments and schools, or of taking part in recreational establishes new rules of governance in the entire public
activities. administration by ensuring the coordination, coherence and
harmonization necessary in its work so that the
Providing Québecers with reduced mobility and who are environment, society and the economy are factored into
wheelchair users with access to means of transportation every decision. With this statute, the government can
is an economic and social concern. exercise leadership, set an example, fulfil its role of
stewardship over resources with greater efficiency and
quality, and guarantee the success of Québec’s sustainable
development plan.”
The government’s desire to support and further the
development of public transit is one of the preferred means
of achieving sustainable development in Québec. The priority
assigned to public transit aims to meet today’s needs
without compromising the ability of future generations to
deal with theirs. It reflects a commitment to take into
consideration the indivisible nature of the environmental,
social and economic dimensions of transportation activities.
4Chapter 1
1.3 A LEVER FOR ECONOMIC 1.4 A MEANS OF SAVING ENERGY
DEVELOPMENT AND REDUCING THE USE OF
Public transit is a lever for economic development. Today’s
PETROLEUM PRODUCTS
economy depends on skilled labour and just-in-time Increasing use of public transit is an effective means of
production strategies. Within the context of globalization reducing the use of petroleum products through a shift from
and the integration of the North American market, economic the automobile to public transit modes. Québec depends
growth and the ongoing competitiveness of Québec entirely on imports for its supply of oil. Gasoline and diesel
businesses and regional economic centres demand efficient, fuel prices jumped by 44% from 2002 to 2005.2 In addition
competitive and safe transportation networks and systems. to environmental, social and economic reasons, it is entirely
This makes it important to have an integrated vision that in Québec’s interests to rationalize its use of petroleum
encompasses public transit and its positive impact on traffic products, reduce transportation costs and foster
conditions. improvements to public transit availability.
For employers, access to public transit is very often a factor On May 4, 2006 the government published the Quebec
in locating their business. Efficient public transit systems Energy Strategy 2006-2015 – Using Energy to Build the
help improve the quality of life of their employees and Québec of Tomorrow. The strategy aims to [achieve
broaden the pool of labour their enterprise can draw on. leadership in sustainable development] “by developing our
own potential for renewable energy, by investing in energy
Moreover, investments in public transit produce substantial efficiency, by increasing the pace of development and
economic benefits for Québec. Over 11,600 people work for implementation of new energy technologies.” The
transit corporations and private firms that provide public government’s objective is to reduce our dependency on
transit services, not to mention over 3,500 indirect jobs with petroleum products for transportation and heating buildings.
suppliers. The energy-saving objective it has set is a 10% reduction
In the Montréal area alone, purchases of goods and services in present-day consumption by 2015.
for public transit authorities amounted to $284 million in To achieve this, the government will propose an energy-
2003.1 The production of public transit equipment is a very efficiency plan that covers every market and all forms of
well-established industry in Québec. Companies such as energy. The Agence de l’efficacité énergétique has a
Bombardier, Prévost, Novabus and Alstom are leading mandate to identify the cost-effective energy-savings that
producers of top-quality equipment. In addition to their can be achieved.
employees, there are over 5,000 jobs at their suppliers,
most of whom are also based in Québec. Québec’s new public transit policy will make a direct
contribution to the implementation of those means.
1. BOARD OF TRADE OF METROPOLITAN MONTREAL. Public Transit: A powerful economic-development engine for the metropolitan Montreal region.
Montréal: La Chambre, December 2004. 35 f. http://www.ccmm.qc.ca/documents/memoires/2004_2005/BTTM_PublicTransit_study.pdf
2. Bulletin d’information sur les prix des produits pétroliers au Québec. Montréal: Régie de l’énergie, 1997. http://www.regie-energie.qc.ca/energie/pet-
role_tarifs.html.
PUBLIC TRANSIT: A SOCIAL CHALLENGE 51.5 A MEANS OF COMBATTING
GREENHOUSE GAS EMISSIONS
Public transit is also a good means of reducing greenhouse
gas emissions and thereby combatting climate change.
Climate change represents a serious threat to ecosystems
and the entire planet. In Québec, it is already affecting public
health and safety, as well as the integrity of infrastructures
and various building structures, not only in northern and
coastal areas, but virtually everywhere. For example, climate
change is taking the form of more frequent and intense
occurrences of extreme weather such as ice storms,
torrential rain, heat waves and coastal storms, with all the
Source: Ministère des Transports du Québec
ensuing consequences. These changes are also modifying
the abundance and quality of natural resources, and making
the environment fragile. In urban areas, they lead to more Despite this good record, recent trends are worrisome.
smog alerts and intense heat in summer. From 1990 to 20033 Québec’s greenhouse gas emissions
increased by 6.6%. This rise is mainly due to the
Climate change is forcing countries to make their economies transportation (19.9% increase in emissions) as well as
more carbon-clean while coping with growing global residential, commercial and institutional sectors (19%
competition. More than ever before, Québec is determined increase), while industrial emissions dropped by 6.8%
to meet the challenge of global warming by developing its during the same period. In 2003 road transportation alone
economy in a sustainable manner and preparing to adapt accounted for 32.1% of Québec’s greenhouse gas emissions
to the anticipated impacts. and had climbed by 21.6%.
In 2003 Québec definitely had the best record in Canada in Based on the growth scenarios currently available, there is
terms of per-capita greenhouse gas emissions. They every likelihood this trend will continue unless something
averaged 12.1 CO2-equivalent tonnes per capita, compared is done. Québec’s 2006-2011 Climate Change Action Plan,
to 16.8 in Ontario and 71 in Alberta, while the Canadian which the government recently made public, aims precisely
average stood at 23.4. This fine performance is mainly the to curb that trend and reduce greenhouse gas emissions
result of Québec’s past investments in a clean, renewable in order to fulfil its commitment to contributing to the
energy source: hydroelectricity. Close to 97% of the power attainment of Canada’s objectives under the Kyoto Protocol.
generated in Québec comes from this source.
Québec is also in the forefront in transportation. The
automobiles on its roads are among the most energy-
efficient in Canada, and Montréal ranks among the top
cities in North America for public transit ridership. Yet this
outstanding performance must not compromise the need
to sustain the effort to reduce greenhouse gas emissions,
especially in the transportation sector.
3. MINISTÈRE DU DÉVELOPPEMENT DURABLE, DE L’ENVIRONNEMENT ET DES PARCS. Inventaire québécois des gaz à effet de serre en 2003 et évolution
depuis 1990. Québec: MDDEP, 2006. http://www.mddep.gouv.qc.ca/changements/ges/2003/index.htm.
6Chapter 1
1.6 A MEANS OF IMPROVING PUBLIC
HEALTH AND QUALITY OF LIFE
Public transit as well as walking and cycling have a direct
impact on quality of life and public health.
• By reducing the use of automobiles, public transit makes
it possible to cut down on the air pollutants associated
with fuel combustion. There is a direct relationship
between the amount of automobile use and occurrences
of smog in big cities. The reduction in smog through the
use of public transit curbs the effect of air pollution on
public health.
• Replacing automobiles with public transit also has a
positive impact on the frequency of traffic accidents.
• In addition, walking and cycling contribute directly to the
health of their practitioners. As we all know, these ways
of getting around are one of the solutions for improving
the physical fitness of Québecers and countering obesity.
Whether viewed from an economic, social or environmental
standpoint, the development of public transit is therefore
truly a social challenge.
All studies agree in emphasizing the priority nature of
supporting public transit and the positive impact such
support would have on society as a whole.
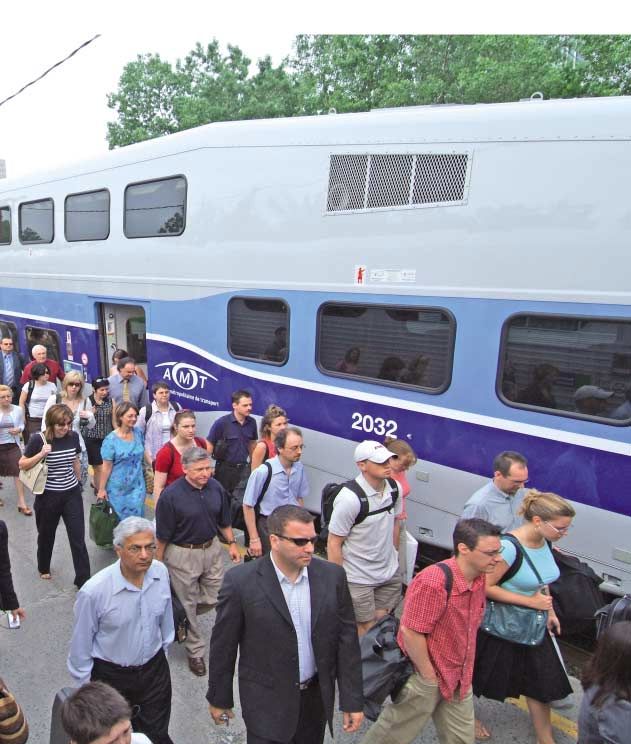
PUBLIC TRANSIT: A SOCIAL CHALLENGE 7Chapter 2
THE GOAL SET AND THE MEANS TO ATTAIN IT
Source: Agence métropolitaine de transport.THE GOAL SET AND THE MEANS TO ATTAIN IT
2.1 THE NEW POLICY’S GOAL: GREATER This trend has to be curbed.
USE OF PUBLIC TRANSIT • The government is targeting an 8% increase in ridership
With its policy on public transit, the government is pursuing by 2012.
an overall objective of increasing the use of this mode of • This growth will enable public transit to increase its
transportation by people throughout Québec. From 2003 to share of all modes of passenger transportation in
2004, public transit ridership dropped by 1% in Québec Québec’s main agglomerations.
while increasing in the other Canadian provinces.
The target means 40 million more trips, which would bring
the total number of public transit trips in Québec to
approximately 550 million. That increase is equivalent to the
number of trips handled every year by Québec City’s transit
system.
Graph 1 - Change in the modal share of public transit in Québec, 1991-2016
(working days in autumn)
Source: Origin-destination survey in the Montréal, Québec City, Outaouais, Trois-Rivières and Sherbrooke areas.
10Chapter 2
2.1.1 Assets Moreover, within the context of the work being done to
modernize government and the government’s project to
The government can count on a number of assets to attain foster regional and municipal autonomy, it is encouraging
its goal. agreements to be signed with regional elective councils to
experiment with projects for optimizing and integrating
public transit services at the regional level.
2.1.1.1 Modern and efficient public
transit services
First of all, Québec has modern, efficient, quality public
transit services that already benefit over 70% of the
population. The replacement cost value of public transit
infrastructures and equipment amounts to over $16.6 billion:
$12.8 billion for the Montréal metro alone, $1.3 billion for
commuter trains, and $2.5 billion for the bus system
(garages, buses etc.).
There are nine4 public transit corporations operating
systems in Québec’s six largest agglomerations. Also, in
the Montréal area, the suburbs are covered by nine
intermunicipal boards of transport, three municipal and
intermunicipal transit agencies and a regional public
transport board. In the Montréal area, the Agence
métropolitaine de transport coordinates and supports the
funding of transit services that have a regional scope.
Elsewhere in Québec, nine municipalities with a population
over 20,000 benefit from the government assistance Source: Ministère des Transports du Québec.
program for public transit. Appendix II describes the roles
of the various public transit players in Québec.
2.1.1.2 Substantial use compared
The pooling of public transit services is progressing rapidly to elsewhere in Canada
in rural areas. Here we mean school buses, paratransit,
medical transport, taxis and car-pooling. It involves creating Another asset is that Québecers already make substantial
a single window for providing transportation throughout a use of public transit.
regional county municipality. This approach seeks to improve
In 2004, some 510 million trips were made by public transit
use of the resources available within a territory, and involves
in Québec, accounting for nearly one third of the Canadian
modes of transportation mainly subsidized by the Québec
total. Québec is also noteworthy for having a far higher
government.
usage rate of public transit services than is found in the rest
The plan to pool services was bolstered in 2003 by creation of Canada.
of the government assistance program for public transit in
Yet as Graph 2 on the following page shows, this lead has
rural areas. To date, 61 regional county municipalities out
narrowed in recent years.
of a potential 81 have benefited from a total of nearly
$2.5 million in government funding under a financial Table 1 compares the number of public transit trips per
arrangement in which the municipalities are the capita in Québec with rates elsewhere in Canada. Québec
government’s partners. comes in first with the highest rate of public transit usage
(95 trips per capita, compared to 80 in Ontario and 59 in
British Columbia).
4. See Appendix I.
THE GOAL SET AND THE MEANS TO ATTAIN IT 11Graph 2 - Change in the number of public transit trips
per resident served in Québec and the rest of Canada, 1991-2004
Trips per resident served
Québec
Rest of Canada
Source: Internal data from the Ministère des Transports du Québec and statistics for the rest of Canada from the Canadian Urban Transit Association,
Operating Statistics of Canadian Urban Transit Systems, 1991 to 2004.
Table 1 - Use of public transit in Québec and elsewhere in Canada, 2004
Population Annual Trips
Province served ridership per capita, 2004
Québec 5,385,790 509,246,486 94.6
Ontario 8,769,106 700,159,258 79.8
Alberta 2,065,225 137,872,534 66.8
Manitoba 639,396 39,424,636 61.7
British Columbia 3,290,872 192,578,502 58.5
Nova Scotia 404,000 17,188,976 42.5
Saskatchewan 445,175 15,820,392 35.5
Newfoundland & Labrador 145,000 3,147,332 21.7
New Brunswick 240,599 5,056,620 21.0
Northwest Territories 41,205 449,417 10.9
Source: Internal data from the Ministère des Transports du Québec and statistics for the rest of Canada from the Canadian Urban Transit Association,
Operating Statistics of Canadian Urban Transit Systems, 1991 to 2004.
12Chapter 2
2.1.1.3 Urban traffic levels that compare • Finally, in less urbanized areas, over half of the regional
favourably to those in the rest of North county municipalities have set up a public transit
America window, and more and more regional elective councils
hope to propose various formulas for region-wide
Regarding traffic, Montréal ranks high among North integration.
America’s agglomerations in terms of time spent travelling.
The level of traffic congestion in Montréal is less than that
2.1.2 A still-fragile situation
found in similar-sized American cities, mainly because of the
high population density and more widespread use of public Despite this encouraging record, the situation remains fragile
transit. and recent trends are cause for concern.
Traffic congestion, however, remains a worrisome In fact, the use of public transit has grown more slowly than
phenomenon. It basically affects big cities, especially the use of automobiles, and today public transit is still
Montréal, but also Québec City and Gatineau. In the Montréal seeing its share of urban trips shrink, as shown in Graph 3
urban area, the annual cost of recurrent congestion was an on the next page.
estimated $779 million5 in 1998, most (73%) attributable to
the extra time it takes drivers to commute between home • In the Montréal area, for example, public transit’s share
and work. of all motorized trips dropped from 22.5% in 1991 to
19.5% in 2003 according to origin-destination surveys.
The cost of congestion to business amounts to $97 million,
including $70 million for trucking and $27 million for • Overall, in Québec’s main urban centres, public transit’s
employees travelling to and from work by road. share of all motorized trips shrank from 20.3% in 1991
to 16.5% in 2003.
2.1.1.4 Converging indicators • The situation is similar in most agglomerations in North
America and the rest of the world.
These different findings can be summed up in one general
observation: over the years, Québec has acquired efficient, The rise in the number of automobiles on the road is mainly
safe, quality public transit services. If we compare the due to higher household net income and the fragmentation
current situation in certain cities in Québec with that in of activities.
comparably sized cities in Canada or the United States,
many indicators point to Québec being in a good position. Based on 2001 census data (the most recent figures
available), Table 2 compares the shares of the different
• In terms of fares, the average price of regular and discount modes of transportation for home-work trips in select
passes is lower in Québec than in other Canadian cities. Québec cities to those in a few other Canadian
agglomerations of similar size.
• The performance of Québec’s public transit authorities
compares favourably with that of their counterparts Public transit’s share of all motorized modes is declining
across Canada. in Québec’s largest cities. The Ministère des Transports du
Québec forecasts, shown in Graph 3 below, point to this
• On the outskirts of the large centres, the intermunicipal
trend continuing in the years ahead unless something is
boards of transport and municipal and intermunicipal
done. It is necessary therefore to reverse the trend.
transit agencies that for 20 years have been using
private enterprise serve as a model whose effectiveness
is proven by a sharp increase in service availability. With
the creation of the Agence métropolitaine de transport,
the addition of several commuter train lines has
substantially increased the services available in the
Montréal area.
5. Louis GOURVIL, Évaluation de la congestion routière dans la région de Montréal. Montréal: Transports Québec, 2004. XXI, 88 p.
THE GOAL SET AND THE MEANS TO ATTAIN IT 13Grap 36 - Change in the modal share of public transit
in certain Québec agglomerations,
1991-2016 (working days in autumn)
25%
Montréal agglomeration
20%
Overall Overall (observed)
Overall (trend)
15% Montréal (observed)
Québec City agglomeration Montréal (trend)
Québec City (observed)
Québec City (trend)
Sherbrooke
agglomeration Sherbrooke (observed)
Sherbrooke (trend)
10%
Trois-Rivieres (observed)
Trois-Rivières (trend)
Outaouais (observed)
Outaouais agglomeration
5%
Trois-Rivières
agglomeration
0%
1991 1993 1995 1997 1999 2001 2003 2005 2007 2009 2011 2013 2015
Source: Origin-destination survey in the Montréal, Québec City, Outaouais, Trois-Rivières and Sherbrooke areas.
6. The territories indicated here are those covered by the regional origin-destination surveys for each agglomeration. In each case, they cover the census
metropolitan area (CMA) as defined by Statistics Canada. For more details about the origin-destination surveys and their coverage, as well as the
overall findings, see http://www1.mtq.gouv.qc.ca/fr/services/documentation/statistiques/enquetes/.
14Chapter 2
Table 2 – Modal share of public transit
in select Canadian agglomerations, 2001
Population Modal share
Home – work trips
System Province Automobile Public transit Walking Other
Population over 1 million
Toronto Ont. 71.4% 22.4% 4.6% 1.6%
Vancouver B.C. 79.2% 11.5% 6.5% 2.8%
Montréal Qué. 70.4% 21.7% 5.9% 2.0%
Population of 150,000
to 1 million
Winnipeg Man. 78.4% 13.2% 6.1% 2.3%
Québec City Qué. 81.2% 9.8% 7.0% 2.0%
Hamilton Ont. 85.3% 8.0% 5.1% 1.6%
Population
under 150,000
Sudbury Ont. 87.0% 4.9% 6.6% 1.5%
Sherbrooke Qué. 85.7% 5.6% 7.2% 1.5%
Saint-John N.B. 87.0% 4.3% 6.9% 1.8%
Source: Statistics Canada, 2001 Census.
2.2 THE GOAL: AN 8% INCREASE Before 2012, the results achieved will have to be evaluated
IN RIDERSHIP BY 2012 to determine if any adjustments are needed. A new target
will be set for another five-year term.
With this policy, the government is pursuing the general
objective of increasing the use of public transit in Québec.
2.3 THE MEANS SELECTED
It has set a specific target: we should be able to achieve an
To attain this goal, the government has chosen four sets of
8% increase in public transit ridership by 2012.
means:
• This target means an additional 40 million trips on top of
• getting everyone to do their fair share;
the approximately 510 million trips now taken annually
by public transit users in Québec. • improving the services available to the public;
• This will make it possible to reverse the trend and • modernizing and developing infrastructures and
increase public transit’s share of all trips by people equipment;
in Québec’s main agglomerations.
• at the same time, supporting other alternatives to the
automobile.
THE GOAL SET AND THE MEANS TO ATTAIN IT 15Chapter 3
GETTING EVERYONE
TO DO THEIR FAIR SHARE
Source: Société de transport de l’Outaouais.GETTING EVERYONE
TO DO THEIR FAIR SHARE
Greater use of public transit is based on the assumption that 3.1 THE PRESENT SITUATION: WHO
all parties involved must do their fair share. In specifying this PAYS WHAT FOR PUBLIC TRANSIT?
first means of attaining its objective, the government is
therefore calling on municipalities (who bear primary First, a brief description of current public transit funding
responsibility for public transit), as well as on public transit is in order.
authorities, users, motorists, employers and the federal
government to help. From 1991 to 2004, the annual expenditures of public transit
authorities, including the Agence métropolitaine de transport,
They all have a role to play in the governance or funding of rose by 34% from $1.1 to $1.5 billion. During that period,
public transit. The government intends to spell out these the consumer price index climbed by 21%.
various responsibilities while taking into consideration the
situation of each region, and especially the Montréal area, Expenditures are funded by contributions from a set of
where the demands of public transit greatly exceed the partners, namely, users, motorists, municipalities and the
bounds of a single municipality. Québec government. Graph 4 shows their relative
contributions in 2004.
The government also wants to reiterate the role it intends to
play in public transit: the role of coordinator and coach, with, The Québec government became involved in funding public
in the latter case, a focus on funding capital expenditures transit in the early 1970s at the request of municipalities
and offering specific assistance for the improvement and in order to back a mode of transportation that sustains the
development of services. economy while improving the quality of urban life and
mobility of low-income earners. Hence the government
provided the funding for major investments that
municipalities lacked.
18Chapter 3
Today, funding takes the following form: • The municipal share of public transit funding climbed
from 26% in 1991 to 40% from 1992 to 1995, then
• The Québec government subsidizes capital expenditures, dropped to 35% by 2000. It subsequently rose to 36%
thereby covering most of the capital spending of the in 2004.
Agence métropolitaine de transport and transit
corporations. It provides intermunicipal boards of • Meanwhile, users’ share of funding public transit has
transport as well as municipal and intermunicipal transit climbed more or less steadily from 34% in 1991 to 42%
agencies with operating grants that cover a portion of the in 2004. The improvement in the self-funding ratio is due
capital expenditures included in the contract fulfilled by mainly to a sharp rise in fares, particularly in recent
private firms. It also provides funding for the operating years. Fares are generally equivalent to those in other
expenses of the Agence métropolitaine de transport and Canadian agglomerations of the same size, with the
transit corporations by transferring the proceeds of the exception of regular or discount passes, which cost
fees and tax levied on motorists through provincial less in Québec. Table 3 compares the fare schedules
taxation.7 of select Québec cities with those of comparably sized
municipalities elsewhere in Canada.
Table 3 - Public transit fares in select Canadian agglomerations, 2006
Population 2006 Fares
System Province Regular fares Student discount fares
Pass Ticket Cash Pass Ticket Cash
Population over 1 million
Toronto Ont. $99.75 $2.10 $2.75 $83.75 $1.40 $1.85
Vancouver B.C. $69.00 $1.80 $2.25 $40.00 $1.50 $1.50
Montréal Qué. $63.00 $1.92 $2.50 $33.75 $1.00 $1.50
Population of 150,000
to 1 million
Winnipeg Man. $71.25 $1.85 $2.00 $48.15 $1.25 $1.65
Québec City Qué. $65.00 $2.30 $2.50 $43.65 $1.55 $2.50
Hamilton Ont. $65.00 $1.70 $2.10 $50.00 $1.35 $2.10
Population under
150,000
Sudbury Ont. $66.00 $1.80 $2.30 $60.00 $1.30 $1.80
Sherbrooke Qué. $56.00 $2.85 $2.85 $44.00 $2.85 $2.85
Saint-John N.B. $59.00 $1.80 $2.25 $49.00 $1.55 $2.00
Note: Moreover, Université de Sherbrooke students ride free under an agreement between the university and the Société de transport de Sherbrooke.
Source: Websites of the transit authorities concerned.
7. A $30 registration surcharge on pleasure vehicles in territories served by a public transit corporation during the 1990s, and a gasoline tax
of 1.5¢ per litre in the Montréal metropolitan area since 1996.
GETTING EVERYONE TO DO THEIR FAIR SHARE 19Graph 5 - Contribution by partners to public transit funding
in Québec and the rest of Canada, 2004
Users Municipalities Provinces Federal Motorists
government and others
Note: The federal contribution to Québec in 2004 does not appear because it was insignificant.
Sources: Québec data from 2004 annual and operating reports.
Data for the rest of Canada from CUTA, Summary of Canadian Transit Statistics (2004 data).
The breakdown of public transit funding in Québec differs 3.2 PRIMARILY A MUNICIPAL
from that found elsewhere. Graph 5 compares the RESPONSIBILITY
contributions of the various partners in Québec in 2004 with
the funding formulas in the rest of Canada. It shows that the A fundamental point must be emphasized at the outset:
share of the funding borne by the Québec government and municipalities bear the primary responsibility for public
municipalities is higher than elsewhere across the country. transit and must continue to do so. They are directly
Conversely, the share covered by users and motorists is accountable to residents for the services whose governance
lower. and funding they control directly.
These figures do not, however, reflect the present situation • It is up to municipalities, as those primarily responsible
in Ontario, and therefore Canada. Since October 2004, the for organizing services, to ensure that public transit
Ontario government has transferred a portion of the authorities have the financial resources required to
provincial gasoline tax to public transit authorities, in fact, a provide a sufficient quantity and quality of services.
rising percentage until October 2006.
• Municipalities approve transit authority budgets and
Because of this decision made by the Ontario government, borrowing, and are responsible for covering operating
motorists’ contribution to funding public transit in the rest of deficits as well as their share of capital expenditures.
Canada will climb substantially in the years ahead.
20Chapter 3
• Municipal elected officers appoint the board of directors
of their transit authority.8
• Regional county municipalities are responsible for
coordinating the use of existing public transit resources
in the region and assist in funding them.
This principle explains municipal responsibility for funding
operating costs. As for capital expenditures, municipal
funding complements the government’s contribution. These
fundamental responsibilities remain the same under
Québec’s new policy on public transit.
3.2.1 Operating costs – A municipal responsibility
It is only normal that municipalities cover public transit
operating costs: these costs stem from local decisions and a
very large portion covers employee salaries, which are
based on collective agreements negotiated by the
municipalities. Source: Agence métropolitaine de Montréal (park-and-ride lots).
However, the government intends to provide specific aid to 3.2.2 Capital expenditures: Arranging sources
municipalities to cover additional operating expenses directly of complementary funding outside
related to improving available services. These new
the government
arrangements will be discussed in Chapter 4, “Improving
services.” With the new Québec policy on public transit, the
government is reasserting its intention of covering the bulk
There is also a problem with intraregional bus services,
of capital expenditures. This point is all the more critical
which often run a deficit and are the only form of public
considering the magnitude of the required investments:
transit between rural areas and an urban centre. At present
public transit systems and infrastructures are aging and
these services receive no public funding.
major investments will soon be required. In addition to these
substantial sums, an effort must be made to provide
infrastructures and equipment plans that make the services
even more attractive.
The government is announcing a number of new initiatives
aimed at providing municipalities with greater assistance for
capital expenditures. These initiatives will be spelled out with
the implementation of the means of modernizing and
developing infrastructures and equipment. The recent
assistance provided by the Québec government and Ottawa
through the Société de financement des infrastructures
locales du Québec indicates what direction the government’s
efforts will take.
8. The boards of directors also include two user representatives, one specifically for paratransit for people with disabilities.
GETTING EVERYONE TO DO THEIR FAIR SHARE 213.2.3 Municipal road network management and 3.4 THE GOVERNMENT: SERVING AS
urban development bylaws COORDINATOR AND COACH
It is also worth recalling that metropolitan communities and In public transit, the government primarily coordinates
municipalities are responsible for land development, manage Québec-wide policies.
the road networks under their jurisdiction, and enact urban
development bylaws – three instruments for controlling • As such, the government establishes general
urban sprawl and mobility, and stimulating the use of public orientations, sets objectives and coordinates the
transit. initiatives called for from each public transit player.
• Hence it is up to the government to set up the legal and
3.3 PUBLIC TRANSIT AUTHORITIES: regulatory framework surrounding implementation of the
DELIVERING QUALITY SERVICES orientations.
EFFICIENTLY The government also serves as a coach by providing
Public transit authorities include transit corporations, targeted and defined support for the various parties
intermunicipal boards of transport, municipal and responsible for providing public transit services.
intermunicipal transit agencies, and all authorities
Thus, as mentioned earlier, the government covers the bulk
responsible for providing public transit services.
of the costs involved in developing and refurbishing
Public transit authorities fall under municipal jurisdiction. infrastructures and equipment, costs that municipalities
They have an obligation to deliver quality services efficiently. alone cannot cover.
As a general rule, transit corporations provide the services
These costs are substantial, as shown in Graph 6. Over the
directly, while the other authorities outsource them to private
past ten years, investments have risen to some $2 billion.
enterprise.
Over the next ten years, an estimated $4.6 billion will be
• Each transit authority determines the level of service and needed for equipment maintenance and upgrades. Moreover,
fares in its territory. based on public transit corporation estimates, the required
investments could amount to $8 billion if all the proposed
• The quality of services depends largely on these development projects are undertaken.
decisions and the financial resources available to public
transit authorities. Within the framework of its new policy on public transit, the
government has also decided to play this role of coach with
• Public transit authorities are also responsible for labour regard to certain specifically defined operating expenses,
relations and contracts. namely, those directly related to developing and improving
customer services.
It should be noted that in 2004, public transit authority
revenues from operations covered 53% of direct operating It should be noted that the government deals directly with
costs, compared to 70% in Ontario and 58% in British demand for urban transportation by means of the highway
Columbia. The lower self-funding ratio of Québec transit and expressway network under its immediate jurisdiction.
authorities is mainly due to less revenue from fares. Hence the Québec policy on public transit implies that the
government gives preference to public transit vehicles and
In terms of efficiency, Québec transit authorities compare encourages alternatives to private automobiles.
favourably with their counterparts in Ontario and British
Columbia. In 2004 they had the lowest operating costs per
passenger: $2.25 compared to $2.57 in Ontario and $2.74 in
British Columbia.
22Chapter 3
Graphique
Graph 66 -- Actual
Investissements réalisés
and planned et prévus
investments en transport
in public transit inenQuébec,
commun au Québec,
1995-2015
1995-2015
$4.6G
Percentage funding covered by the MTQ:
50% Buses
75% Garages, terminals, reserved lanes, park-and-ride lots
75% Repairs and replacements
100% Metro, trains and LRT
$2.1G
Buses, garages, reserved lanes Buses, garages, reserved lanes Buses, garages, reserved lanes and terminals
and terminals and terminals Commuter trains (renovation, car replacement and
Metro renovation (Réno-station 1) Commuter trains (development) northeast line development)
Metro extension and renovation Laval metro, metro renovation (Réno-station and Réno-système)
Replacement of MR-63 cars, etc.
Source: Internal data from the Ministère des Transports du Québec.
3.5 USERS: THE MAIN BENEFICIARIES, 3.6 MOTORISTS: BENEFICIARIES WHO
WHO HAVE TO PAY THEIR FAIR MUST ALSO CONTRIBUTE
SHARE OF THE COSTS The development and use of public transit directly benefits
Users are the main beneficiaries of public transit services. motorists by reducing traffic congestion. This is why, in the
It is therefore normal that they cover at least part of the cost past, the government decided that motorists living in one of
of these services. the six census metropolitan areas (which correspond to the
territories of Québec’s nine public transit corporations) would
The government considers it important for users to continue contribute directly to funding public transportation through
paying their fair share of public transit costs. Fares, however, an annual $30 fee collected with their vehicle registration.
must not inhibit use or restrict access to the service. For the same reason, a tax of 1.5¢ per litre of gasoline
has been collected and allocated for public transit in the
Montréal area since 1996.
GETTING EVERYONE TO DO THEIR FAIR SHARE 23You can also read