London Legacy Development Corporation Housing Requirements Study - Report of Findings
←
→
Page content transcription
If your browser does not render page correctly, please read the page content below
LEB2

                London Legacy
                Development
                Corporation Housing
                Requirements Study

                Report of Findings
                March 2018

Opinion Research Services   |   The Strand • Swansea • SA1 1AF   |   01792 535300   |   www.ors.org.uk   |   info@ors.org.uk
Opinion Research Services   |   LLDC – Strategic Housing Market Assessment                                March 2018

                                             Opinion Research Services | The Strand, Swansea SA1 1AF
                                             Jonathan Lee | Nigel Moore | Scott Lawrence | Trevor Baker
                                             enquiries: 01792 535300 · info@ors.org.uk · www.ors.org.uk

                                             © Copyright March 2018

                                                                        2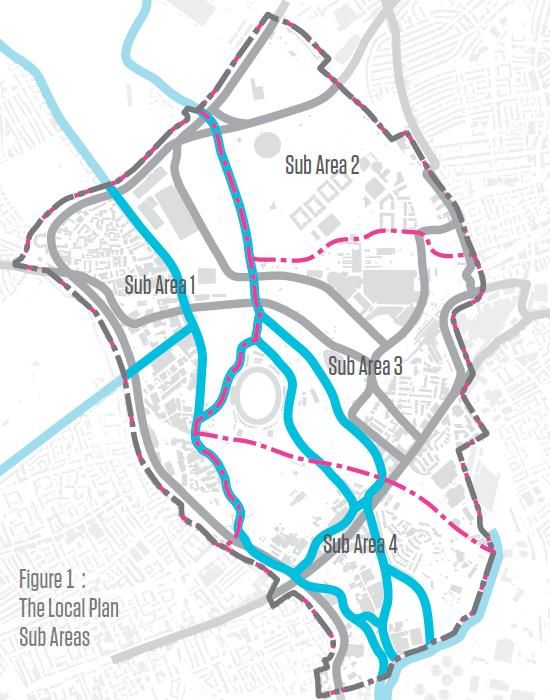
Opinion Research Services      |    LLDC – Strategic Housing Market Assessment                                                                                            March 2018

        Contents
        Contents ............................................................................................................ 3

        1. Introducing the Study .................................................................................... 7
        Background to the project and wider policy context
             The LLDC ...................................................................................................................................................... 7
             Project Overview ......................................................................................................................................... 7
             Geography ................................................................................................................................................... 8
             Study Approach ........................................................................................................................................... 9
             Government Policy ...................................................................................................................................... 9
            The London Housing Strategy 2017 ........................................................................................................... 10
            The Draft London Plan 2017 ....................................................................................................................... 10
             London Specific SHMAs ............................................................................................................................. 11

        2. Defining the Housing Market Area .............................................................. 12
        An evidence base to identify functional housing markets
             Introduction............................................................................................................................................... 12
             The Housing Market Area – Conclusion from Previous SHMAs ................................................................ 12
             Outer North East London SHMA 2015 ...................................................................................................... 13
             Hackney SHMA 2014 ................................................................................................................................. 14
             Tower Hamlets SHMA 2017 Update.......................................................................................................... 15

        3. Market Signals ............................................................................................. 17
        Considering the balance between housing need and supply
             Defining Market Signals............................................................................................................................. 17
             House Prices and Affordability .................................................................................................................. 18
             Private Rent ............................................................................................................................................... 20
             Overcrowding ............................................................................................................................................ 21
             Summary of Market Signals ...................................................................................................................... 22
             Conclusions on Market Signals .................................................................................................................. 23

                                                                                         3
Opinion Research Services | LLDC – Strategic Housing Market Assessment March 2018
4. Objectively Assessed Need .......................................................................... 25
Analysing the evidence to establish overall housing need
The Process for Assessing OAN ................................................................................................................. 25
Dwellings in LLDC....................................................................................................................................... 26
GLA Demographic Forecasts October 2017 .............................................................................................. 27
Utilising data from the Population Survey for OAN .................................................................................. 28
Population and Household Projection in LLDC .......................................................................................... 31
Converting to Dwellings ............................................................................................................................. 32
CLG Consultation ........................................................................................................................................ 33
Previous Sub-Regional SHMAs .................................................................................................................. 35
Conclusions on Population Projection Based OAN ................................................................................... 35
Summary of Models .................................................................................................................................. 36
5. Affordable Housing Need ............................................................................ 37
Identifying households who cannot afford market housing
Introduction............................................................................................................................................... 37
Past Trends and Current Estimates of the Need for Affordable Housing ................................................. 38
Local Authority Data: Homeless Households and Temporary Accommodation ........................................ 38
Census Data: Concealed Households and Overcrowding .......................................................................... 39
Housing Register Data ................................................................................................................................ 46
Households Unable to Afford their Housing Costs ..................................................................................... 48
Establishing Affordable Housing Need ...................................................................................................... 50
Current Unmet Need for Affordable Housing ............................................................................................ 50
Conclusions on the Backlog of Need ......................................................................................................... 53
Future Housing Need and the Housing Mix .............................................................................................. 53
Housing Size Mix........................................................................................................................................ 56
6. Needs of different groups............................................................................ 59
Addressing the need for all types of housing
People Wishing to Build their Own Homes ............................................................................................... 59
Housing for Older People .......................................................................................................................... 61
Households with Specific Needs ............................................................................................................... 67
Boat Dwellers ............................................................................................................................................ 69
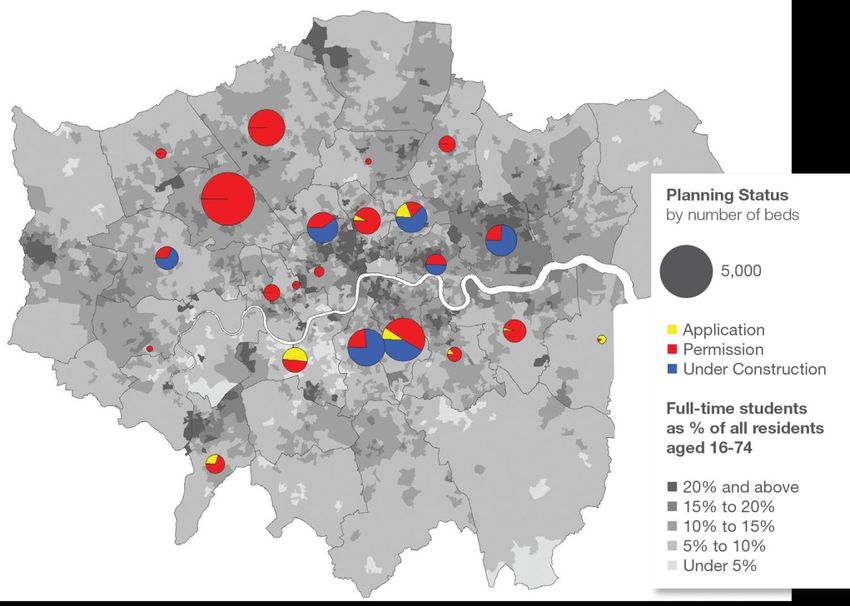
Student Housing ........................................................................................................................................ 71
4
Opinion Research Services      |   LLDC – Strategic Housing Market Assessment                                                                                           March 2018

        7. Gypsy and Traveller Accommodation Assessment ...................................... 74
             Introduction............................................................................................................................................... 74
             Methodology ............................................................................................................................................. 74
             Survey of Travelling Communities ............................................................................................................. 74
             Planning Definition of a Traveller .............................................................................................................. 75
             Unknown Households ............................................................................................................................... 76
             Households that do not meet the Planning Definition ............................................................................. 77
             Draft London Plan...................................................................................................................................... 77
             Planning Status of Households .................................................................................................................. 77
             LLDC Local Plan 2015-31............................................................................................................................ 78
             Waiting Lists .............................................................................................................................................. 78
             Previous GTAA Need Scenarios ................................................................................................................. 78
             Pitch Needs – Gypsies and Travellers that meet the Planning Definition................................................. 79
             Pitch Needs – Unknown Gypsies and Travellers ....................................................................................... 80
             Pitch Needs - Gypsies and Travellers that do not meet the Planning Definition ...................................... 80
             Travelling Showpeople Needs ................................................................................................................... 81
             Summary of Need to be Addressed .......................................................................................................... 81
             Transit Requirements ................................................................................................................................ 82
             Conclusions................................................................................................................................................ 82

        8. Conclusions ................................................................................................. 84
        Summary of Key Findings and Conclusions
             Household Projections and Objectively Assessed Needs .......................................................................... 84
             Housing Mix and Tenure ........................................................................................................................... 85
             Housing for Older People .......................................................................................................................... 86
             Households with Specific Needs ............................................................................................................... 87
             Boat Dwellers ............................................................................................................................................ 87
             Student Housing ........................................................................................................................................ 87
             Gypsies and Travellers ............................................................................................................................... 88
             Travelling Showpeople .............................................................................................................................. 88
             Transit Provision ........................................................................................................................................ 88
             Summary of Need to be Addressed .......................................................................................................... 88

                                                                                        5
Opinion Research Services      |    LLDC – Strategic Housing Market Assessment                                                                                           March 2018

        Appendix A....................................................................................................... 89
        Additional Need:             Unknown Households and Households that do not meet the Planning Definition

        Appendix B ....................................................................................................... 91
        Table of Figures

        Appendix C ....................................................................................................... 94
        Glossary of Terms
             Definitions ................................................................................................................................................. 94
             Acronyms and Initials ................................................................................................................................ 97

                                                                                         6
Opinion Research Services   |   LLDC – Strategic Housing Market Assessment                                          March 2018

        1. Introducing the Study
        Background to the project and wider policy context

        The LLDC
        1.1
                The LLDC (London Legacy Development Corporation) was established in 2012. It continues the work
                of the Olympic Park Legacy Company and other agencies which used to operate in the area, including
                planning powers previously held by the London Thames Gateway Development Corporation, the
                Olympic Delivery Authority and the host boroughs.
        1.2
                It was formed as a Mayoral Development Corporation under the powers of the Localism Act 2011,
                and covers portions of the London boroughs of Newham, Tower Hamlets, Hackney and Waltham
                Forest. The remit of the LLDC was “to promote and deliver physical, social, economic and
                environmental regeneration of the Olympic Park and its surrounding area, in particular by maximising
                the legacy of the 2012 Olympic and Paralympic Games, by securing high-quality sustainable
                development and investment, ensuring the long-term success of the facilities and assets within its
                direct control and supporting and promoting the aim of convergence”.
        1.3
                The LLDC serves as the local planning authority for the area, and as such is required to produce a
                local plan supported by robust evidence. The adopted Local Plan sets out the Legacy Corporation’s
                strategy for the sustainable development of its area as a whole, including the general amount, type
                and location of new development it considers could take place and the policies to which applications
                for planning permission should conform in order to meet these objectives.

        Project Overview
        1.4
                This document represents a new Housing Requirements Study for LLDC which seeks to understand
                the housing needs of the area in more detail to comply with national planning policy requirements.
                This includes assessment of the full housing needs of the area, including that of different groups such
                as gypsies and travellers.

                                                                        7
Opinion Research Services   |   LLDC – Strategic Housing Market Assessment                                 March 2018

        Geography
        1.5
                LLDC covers planning authority areas previously part of four boroughs including Newham, Tower
                Hamlets, Hackney and Waltham Forest. Figure 1 below shows the 4 sub-areas covered by LLDC. The
                4 sub-areas do not coincide with the 4 local authority boundaries.

        Figure 1:   Map of Sub-areas for London Legacy Development Corporation

                                                                        8
Opinion Research Services   |   LLDC – Strategic Housing Market Assessment                                            March 2018

        Study Approach
        1.6
                For this study, ORS have adopted a two-fold approach to assessing the market and affordable needs
                for LLDC. We have sought to assess the housing needs of LLDC from 2015-31 (the end of the plan
                period) on the basis of its current population and household figures, and then a further five years
                into the future up to 2036. Given that the area contains only around 10,000 dwellings at the current
                time then the existing population is relatively low and therefore needs generated by this population
                are also low. However, much of the population which does reside in the area has move there
                recently following the 2012 Olympics and the regeneration of the area allowing a high rate of recent
                development. The figures for the housing needs for LLDC form part of the evidence base which helps
                to comply with the requirement of the National Planning Policy Framework and with Planning
                Practice Guidance.
        1.7
                However, separately, we have also sought to draw on the actual planned level of development in the
                LLDC to help project the future housing needs of particular sub-groups. ORS undertook a large scale
                face to face household survey in the LLDC area, which is reported separately to this Housing
                Requirements Study. The 2017 household survey was used to help develop population and
                household projections for LLDC based upon its planned future dwelling delivery. The future planned
                dwelling delivery cannot be considered to be an objective measure of the housing needs of the LLDC
                area because of circularity issues and in particular the role of LLDC in meeting the wider housing
                needs of London.
        1.8
                The population and household projections are based upon GLA projections, themselves based on
                past delivery, therefore the need shown by the population and household projection is directly linked
                to that delivery. However, they can be used to look at the needs of particular groups in the
                population on the assumption that the level of planned delivery is met. This report also discusses the
                role of the Legacy Corporation area in meeting the wider, strategic needs for housing across London.

        Government Policy
        1.9
                The National Planning Policy Framework (NPPF) contains a presumption in favour of sustainable
                development, and states that Local Plans should meet the full, objectively assessed needs for market
                and affordable housing in the housing market area. However, within the context of the London Plan,
                a responsibility for establishing the level of future housing provision required rests with the local
                planning authority.
        1.10
                Given this context, Strategic Housing Market Assessments (SHMAs) primarily inform the production
                of the Local Plan (which sets out the spatial policy for a local area). Their key objective is to provide
                the robust and strategic evidence base required to establish the full Objectively Assessed Need
                (OAN) for housing in the Housing Market Area (HMA) and provide information on the appropriate
                mix of housing and range of tenures needed. They do not set a ‘housing target’ for the planning
                authority.
        1.11
                Planning Practice Guidance (PPG) on the assessment of housing and economic development needs
                was published in March 2014 and has been updated in March 2015. The Ministry for Housing,
                Communities and Local Government (MHCLG) are currently consulting on a new draft NPPF and also
                on new Planning Practice Guidance. This will have a significant impact on the way in which
                objectively assessed needs are calculated, but will have minimal impact upon the calculation of
                housing tenure and size mix. The new Planning Practice Guidance is unlikely to be in place before
                March 2019, so it is necessary to apply the current PPG until that time.

                                                                        9
Opinion Research Services    |     LLDC – Strategic Housing Market Assessment                                                   March 2018

        The London Housing Strategy 2017
        1.12
                   The London Housing Strategy, published as a draft in September 20171 defines a set of policies and
                   strategies to address housing issues across London. The draft London Housing Strategy sits alongside
                   significant funding streams to deliver more affordable homes and also polices seeking to release
                   more land for housing development in general with the aim to rapidly increase delivery across
                   London. The draft Housing Strategy can be summarised as:

               »    Seeking to build 90,000 new affordable homes in London by 2021 including properties with rents
                    around London Affordable Rent levels (social rented), London Living Rent properties and London
                    Shared Ownership schemes;
               »    Releasing more land for housing across London, particularly for affordable housing;
               »    Ensuring a better deal for private renters, including promoting build to rent and developing a new
                    London Model focusing on tenancy security and living conditions;
               »    Improving the skills, capacity and building methods of the construction industry
               »    Supporting new housing providers, including community builders self-build, build to rent private
                    schemes, modular and community led schemes; and
               »    Helping tackle homelessness.

        The Draft London Plan 2017
        1.13
                   The London Plan 2016 remains the adopted development plan, though “the Draft London Plan” is a
                   material consideration in planning decisions. It gains more weight as it moves through the process to
                   adoption, however the weight given to it is a matter for the decision maker.”2
        1.14
                   Housing is covered in Chapter 4 of the new London Plan3 published in draft November 2017 and
                   subject to consultation until March 2018. The new London Plan references the 2017 London SHMA4
                   and sets a net housing completions target of 64,935 per year between 2019/20 and 2028/29. The
                   targets relating to LLDC are shown below including non self-contained units of approximately 24 per
                   annum.

        Figure 2:     Draft new London Plan Targets for Housing average net completions per annum 2019/20 - 2028/29

                                   Area                                  Total                On small sites (
Opinion Research Services | LLDC – Strategic Housing Market Assessment March 2018
London Specific SHMAs
1.16
The GLA have produced a London SHMA (2017) covering the whole of Greater London which has
been used to underwrite the evidence base for the new London Plan. The size and tenure mix
identified in the study is shown in Figure 3 and shows a very high need for affordable housing,
particularly for 1 bedroom dwellings.
Figure 3: Greater London SHMA 2017 Size and Tenure Mix (Source: GLA. Note: All figures presented unrounded for
transparency)
Number of Bedrooms
Tenure
1 2 3 4 Total % of total
Market 10,682 2,043 4,101 6,210 23,037 35%
Intermediate 4,334 3,434 2,409 1,693 11,869 18%
Low Cost Rent 21,318 5,311 2,462 1,881 30,972 47%
All Tenure 36,335 10,788 8,971 9,783 65,878 100%
1.17
The draft new London Plan 2017 states only that boroughs are not required to carry out a separate
assessment, but should work to the targets set in the new London Plan:
“For the purposes of the Plan, London is considered as a single housing market area, with a
series of complex and interlinked sub-markets. The advantage of strategic planning is that it
allows London to focus development in the most sustainable locations, allowing all of
London’s land use needs to be planned for with an understanding of how best to deliver
them across the capital. Because of London’s ability to plan strategically, boroughs are not
required to carry out their own housing needs assessment but must plan for, and seek to
deliver, the housing targets in this Plan. These have been informed by the SHLAA and the
SHMA.” (Paragraph 4.1.2)
11Opinion Research Services | LLDC – Strategic Housing Market Assessment March 2018
2. Defining the Housing Market Area
An evidence base to identify functional housing markets
Introduction
2.1
A first step to understanding housing needs is to identify the housing market area (HMA) for any
study area. Often this involves a detailed analysis of the migration, travel to work and house prices
of the study areas. However, in the case of LLDC extensive work has already been undertaken in the
surrounding area which has identified the HMAs for North and East London. Therefore, rather than
start from first principles, this study draws on the existing work which has already been undertaken.
The Housing Market Area – Conclusion from Previous SHMAs
2.2
On the basis of the evidence contained in SHMAs undertaken which cover the LLDC area, we would
conclude that:
» Greater London can be considered as a single large housing market area which contains many
smaller overlapping housing market areas within it.
» Migration and travel to work flows do not identify any distinct housing market areas in London.
» House price represents a means of identifying separate housing market areas in London. The
Valuation Office Agency (VOA) has worked with house price and rent nationally to identify Broad
Rental Market Areas (BRMAs) which determined available Local Housing Allowance levels.
» BRMAs represent the most practical and pragmatic approach to identifying housing market areas in
London. The 13 BRMAs in London will allow small groups of London boroughs to plan together.
» 100% of Tower Hamlets’ population falls in the Inner East London BRMA, with 92% of Hackney’s
population also falling in this BRMA. 100% of Newham’s population falls within the Outer East
London BRMA.
» The area covered by LLDC can therefore be considered to fall across two HMAs in London and does
not form a distinct HMA of its own.
2.3
Both of the HMAs which overlap with the LLDC area have undertaken relatively recent SHMA.
Therefore we will proceed by reviewing the outcomes of the SHMA’s covering Newham, Waltham
Forest, Hackney and Tower Hamlets as a context for the needs of the LLDC area.
12Opinion Research Services | LLDC – Strategic Housing Market Assessment March 2018
Outer North East London SHMA 2015
2.4
The Outer North East London Boroughs Strategic Housing Market Assessment 2015 (SHMA) covered
the London Boroughs of Barking and Dagenham, Havering, Newham, Redbridge and Waltham Forest,
although it should be noted that Waltham Forest were not a direct participant in the study and are
currently undertaking their own SHMA.
2.5
The SHMA identifies the Full Objective Assessed Need for Housing in the Outer East London HMA
(Newham and Waltham Forest) to be 96,100 dwellings over the 22-year Plan period 2011-33,
equivalent to an average of 4,370 dwellings per year. This includes the Objectively Assessed Need for
Affordable Housing of 37,400 dwellings over the same period, equivalent to an average of 1,700
dwellings per year.
2.6
The figures below summarise the housing size and tenure mix for each of the boroughs over a 22
year period.
Figure 4: Full Objectively Assessed Need for Housing; Size and Tenure Mix across Outer East London 2011-33 (Note: Figures
may not sum due to rounding)
Outer East London
Newham Waltham Forest TOTAL
MARKET HOUSING
1 bedroom 2,600 2,500 5,200
2 bedrooms 6,400 4,900 11,200
3 bedrooms 20,200 19,400 39,600
4 bedrooms 700 2,400 3,100
5+ bedrooms -300 0 -300
Total Market Housing 29,600 29,200 58,800
AFFORDABLE HOUSING
1 bedroom -500 1,300 800
2 bedrooms 5,300 3,900 9,200
3 bedrooms 13,100 7,500 20,600
4 bedrooms 3,300 2,100 5,400
5+ bedrooms 1,000 400 1,400
Total Affordable Housing 22,200 15,200 37,400
TOTAL 51,800 44,400 96,200
2.7
The main need identified was for 3 bedroom market and affordable housing (63% of the total need),
with 2-bedroom properties forming a further 21%. The proportionate need for 3-bedroom dwellings
was slightly higher in market housing rather than affordable (67% vs. 55%), and the reverse was true
for two bedroom properties (19% market vs. 25% affordable).
13Opinion Research Services | LLDC – Strategic Housing Market Assessment March 2018
Hackney SHMA 2014
2.8
The Hackney SHMA 2014, sought to replicate the methodology of the Greater London SHMA 2013.
Figure 5 summarises the annual need from each source of need over a 24 year period 2011-35.
Figure 5: Annualised Summary of Household Projections and Backlog of Need for Hackney 2011-2035 (Source: GLA, CLG and
ORS)
Source of Housing Need Annual Figure
Household projection – GLA Central trend 1,528
Concealed households 89
Sharing Households 70
Homeless Households 36
Non-homeless household and those needing to move due to harassment 10
Total without Vacant Dwellings and Second homes 1,733
Additional allowance for vacant and second homes 25
Objectively Assessed Housing Need 1,758
2.9
Therefore, in summary, the OAN for Hackney following the methodology adopted in the GLA SHMA
2013 is 1,758 dwellings per annum.
2.10
The overall size and tenure mix for Hackney is shown in Figure 6 and Figure 7. The overall pattern
shows an overwhelming need for social with little projected growth in market housing. Similar to the
Outer North East London SHMA, the primary need identified is for 3-bedroom housing, however in
contrast it should be noted that in the social tenure there proportionately higher need for smaller
properties, primarily 1-bedroom (41% of the total social need).
Figure 6: Overall Housing Tenure Mix for Hackney 2011-2035 (Note: Figures may not sum due to rounding)
Housing Type Number of dwellings
Market housing 16,600
Intermediate affordable housing 2,500
Social rented housing 22,500
Total Housing Requirement 41,600
Market housing 39.8%
Intermediate affordable housing 6.0%
Social rented housing 54.2%
Figure 7: Overall Size Mix for Hackney 2011-2035 (Note: Figures may not sum due to rounding)
Market Intermediate Social TOTAL
1 Bedroom -100 1300 9,300 10,500
2 Bedrooms 3,300 200 6,800 10,300
3 Bedrooms 8,400 400 6,100 14,900
4 Bedrooms 5,000 500 300 5,800
Total 16,600 2,500 22,500 41,600
14Opinion Research Services | LLDC – Strategic Housing Market Assessment March 2018
Tower Hamlets SHMA 2017 Update
2.11
In 2014, ORS undertook the London Borough of Tower Hamlets Strategic Housing Market
Assessment. And this study was subsequently updated in advance of the publication of the draft
Local Plan in 2017.
2.12
In 2017, ORS calculated Objectively Assessed Need based on demographic projections and assessed
these against Market Signals to determine if a higher rate of housing delivery is necessary to address
housing market problems. This takes account of household growth based on CLG 2014-based
projections (the starting point); adjusts for long-term migration trends and the GLA household
projections; responds to suppressed household formation, responds to market signals; and takes
account of vacant and second homes.
2.13
Based upon the information set out above, Figure 8 summarises each of the stages for establishing
the Full Objectively Assessed Need for Housing (unrounded figures).
Figure 8: Full Objectively Assessed Need for Housing across Tower Hamlets 2016-31
Stage Tower Hamlets
HOUSEHOLDS HOUSEHOLDS DWELLINGS
Demographic starting point
50,717 (53,162)
CLG household projections 2016-36
Baseline household projections
36,934 (38,715)
GLA 2015-interim ‘Central Variant’ 2016-31
DWELLINGS
Allowance for transactional vacancies and second homes
1,780
Based on dwellings without a usually resident household
Housing need based on Household projections 38,715
Adjustment for suppressed household formation rates 1,418 1,462
Baseline housing need based on demographic projections 40,177
In response to market signals
Dwellings needed (in addition to the adjustment for 20% of 38,715 = 7,743
concealed families and homeless households to deliver the 7,743 – 1,462= 6,281
overall 20% uplift proposed)
Full Objectively Assessed Need for Housing 2016-31 46,458
Average Annual Need for housing 2016-31 3,097
2.14
Based upon long-term trend migration projections the SHMA therefore identifies the Full Objective
Assessed Need for Housing in Tower Hamlets to be 46,500 dwellings over the 15-year Plan period
2016-31, equivalent to an average of 3,100 dwellings per year. This includes the Objectively
Assessed Need for Affordable Housing of 21,100 dwellings over the same period, equivalent to an
average of 1,407 dwellings per year. More details on the size and tenure mix of dwellings required
are provided below in Figure 9:
15Opinion Research Services | LLDC – Strategic Housing Market Assessment March 2018
Figure 9: Full Objectively Assessed Need for Housing; Size and Tenure Mix across Tower Hamlets for 2016-31 (Figures rounded
5
to avoid giving a spurious impression of precision and totals may not sum for that reason)
AFFORDABLE INTERMEDIATE TOTAL CHANGE
MARKET HOUSING
HOUSING HOUSING e.g. LCHO 2016-31
TYPE OF HOUSING
1 bedroom 7,800 4,500 300 12,600
2 bedrooms 12,300 5,800 800 18,900
3 bedrooms 6,000 5,600 700 12,300
4+ bedrooms -700 3,200 200 2,700
TOTAL 25,400 19,100 2,000 46,500
AFFORDABLE INTERMEDIATE TOTAL CHANGE
MARKET HOUSING
HOUSING HOUSING e.g. LCHO 2016-31
TYPE OF HOUSING
1 bedroom 30.7% 23.6% 15% 27.1%
2 bedrooms 48.4% 30.4% 40% 40.6%
3 bedrooms 23.6% 29.3% 35% 26.5%
4+ bedrooms -2.8% 16.8% 10% 5.8%
TOTAL 100.0% 100.00% 100.00% 100.0%
2.15
The main need identified was for 2-bedroom market and affordable housing, corresponding to two
fifths of the total need), with 1 and 2-bedroom properties forming approximately a further a quarter
each. The proportionate need for 2-bedroom dwellings was substantially higher in market housing
rather than affordable (48% vs. 30%), offset by the higher need for large (4+ bedroom) properties in
the affordable sector.
5
The size and tenure mix would usually be split between flats and houses to provide a guide, but in reality it is recognised that
most future housing developments in Tower Hamlets may necessarily be flats.
16Opinion Research Services | LLDC – Strategic Housing Market Assessment March 2018
3. Market Signals
Considering the balance between housing need and supply
Defining Market Signals
3.1
While demographic trends are typically the key to the assessment of OAN, it is also important to
consider current Market Signals and how these may affect housing needs. PPG identifies a range of
housing market signals that should be considered when determining the future housing number. Key
to this is how market signals should be taken into account:
The housing need number suggested by household projections (the starting point) should be
adjusted to reflect appropriate market signals, as well as other market indicators of the balance
between the demand for and supply of dwellings (Paragraph 019)
A worsening trend in any of these indicators will require upward adjustment to planned housing
numbers compared to ones based solely on household projections. (Paragraph 020)
Planning Practice Guidance: Assessment of housing and economic development needs (March 2014)
3.2
PPG and the PAS OAN technical advice note emphasise the importance of considering indicators in
the context of longer-term trends and looking at rates of change as well as absolute levels – for
example, house prices in the housing market may be higher or lower than the national average,
however the more important consideration is whether or not they are becoming more (or less)
expensive at a rate that differs from the national rates or rates in similar areas.
Appropriate comparisons of indicators should be made. This includes comparison with
longer term trends (both in absolute levels and rates of change) in the housing market area;
similar demographic and economic areas; and nationally. (Paragraph 020)
Planning Practice Guidance: Assessment of housing and economic development needs (March 2014)
17Opinion Research Services | LLDC – Strategic Housing Market Assessment March 2018
3.3
To identify areas with similar demographic and economic characteristics, we have analysed data
from the ONS area classifications together with data from the CLG Index of Multiple Deprivation. The
outcome of this was that the Newham & Waltham Forest HMA and the Hackney & Tower Hamlets
HMA share similar demographic and economic characteristics with Camden & Islington HMA,
Lambeth, Lewisham & Southwark HMA and Barnet, Enfield & Haringey HMA. Therefore, in
considering market signals, we have considered these areas as appropriate comparators and
compared them against the study HMA.
House Prices and Affordability
3.4
House prices in the UK have been relatively volatile in the past 10 years. Prices increased by 5.2% in
the 12 months to December 20176; prices rose fastest in the South West (7.6%), East Midlands
(6.3%), and West Midlands (6.1%). Prices in London increased by 2.5%.
3.5
The average UK house price was £226,750 in December 2017 compared to the peak of the previous
high of £190,000 in the three months August to October 2007, which was overtaken in 2014.
Average house price trends 2006 - 2017 as demonstrated by the House Price Index (HPI) show the
price divergence between London and the rest of the UK.
Figure 10: Annual house percentage price rates of change, UK Figure 11: UK and London House Price Index 2006-2017
all dwellings 2006-2017 (Source: Regulated (Source: Land Registry, ONS)
Mortgage Survey. Note: Not seasonally adjusted)
UK London
15 225%
200%
10
175%
5 150%
0 125%
-5 100%
75%
-10
50%
-15 25%
-20 0%
6
http://landregistry.data.gov.uk/app/ukhpi
18Opinion Research Services | LLDC – Strategic Housing Market Assessment March 2018
House Prices in the Wider HMAs
3.6
House price trends (2001-2017) are illustrated in Figure 12, which shows lower quartile house prices
adjusted for the impact of inflation. Therefore, the prices reflect real changes which have occurred
since 2001 when removing the impact of background inflation.
3.7
It is clear that real house prices rose sharply in the period 2001-2007 with Tower Hamlets and
Hackney in particular seeing house price rises which were higher than the London average.
th
Figure 12: Real House Price Trends: Lower Quartile Prices adjusted to 2015 values using CPI (Table D7BT Release Date 12 Sept
2017) (Source: ONS; Bank of England. Note: HMA figures derived using population weighted average of Local
Authority data)
Newham & Waltham Forest HMA Hackney & Tower Hamlets HMA
Greater London ENGLAND
£400,000
£350,000
£300,000
£250,000
£200,000
£150,000
£100,000
£50,000
£-
2001 2002 2003 2004 2005 2006 2007 2008 2009 2010 2011 2012 2013 2014 2015 2016 2017
3.8
Figure 13 shows how real house prices in the area have varied when compared with England. This
shows that real house prices in the wider area around LLDC are currently above their long-term
average trends.
Figure 13: Real House Price Trends relative to England: Lower Quartile Prices adjusted to 2015 values using CPI (Table D7BT
th
Release Date 12 Sept 2017) (Source: ONS; Bank of England. Note: HMA figures derived using population weighted
average of Local Authority data)
Newham & Waltham Forest HMA Hackney & Tower Hamlets HMA Greater London
+£250,000
+£200,000
+£150,000
+£100,000
+£50,000
£0
2001 2002 2003 2004 2005 2006 2007 2008 2009 2010 2011 2012 2013 2014 2015 2016 2017
19Opinion Research Services | LLDC – Strategic Housing Market Assessment March 2018
Affordability in the Wider HMAs
3.9
Figure 14 below shows the ratio of lower quartile house price to lower quartile workplace-based
earnings in the two HMAs between 2001 and 2016. This long term trend for the area shows that
affordability worsened in the period 2001-08 (when there was an increase in real house prices),
improved between 2008 and 2009, but has since risen back to peak levels. Of course, it is also
important to remember that affordability can be influenced by supply issues (e.g. lower housing
delivery levels) and demand side issues (e.g. lower availability of mortgage finance for first time
buyers).
Figure 14: Ratio of Lower Quartile House Price to Lower Quartile Workplace-Based Earnings (Source: ONS. Note: HMA figures
derived using population weighted average of Local Authority data)
Newham & Waltham Forest HMA Hackney & Tower Hamlets HMA
16.0 Greater London ENGLAND
14.0
12.0
10.0
8.0
6.0
4.0
2.0
0.0
2001 2002 2003 2004 2005 2006 2007 2008 2009 2010 2011 2012 2013 2014 2015 2016
Private Rent
3.10
The English Housing Survey (EHS) 2015-167 identified that 20% (4.5 million) of households were
renting from a private landlord, much higher than the rate of 12% a decade earlier in 2005-06. The
EHS also shows that households aged 25-34 were more likely to be renting privately (46%) than
buying a home, up from 24% in 2005-06. Owner occupation in this age group dropped from 56% to
38% over the same 10 year period. Of all private renters, 21% were in London and 79% in the rest of
the Country. The proportion of households in the private rented sector in London grew from 17% in
2005-06 to 28% in 2015-16, larger than the mortgagor sector (26% in 2015-16).
3.11
Importantly, the Government sees the PRS having an important and long term role in meeting the
housing need of the nation; and although the NPPF and PPG do not mention the current or future
role of housing benefit, the policy to support low-income households in the private rented sector
with housing benefit is long-standing and housing benefit is explicitly factored into the long-term
forecasts for public spending. The current consultation on a new draft NPPF includes the addition of
build to rent schemes to the list of affordable housing, so some forms of privately provided rented
accommodation will now be considered as affordable housing if this is adopted.
7
https://www.gov.uk/government/uploads/system/uploads/attachment_data/file/595785/2015-16_EHS_Headline_Report.pdf
20Opinion Research Services | LLDC – Strategic Housing Market Assessment March 2018
Overcrowding
3.12
Overcrowding is considered in detail in the section of this document discussing the need for
affordable housing. PPG also identifies a series of other factors to monitor alongside overcrowding,
including concealed and sharing households, homelessness and the numbers in temporary housing
(paragraph 19):
Indicators on overcrowding, concealed and sharing households, homelessness and the numbers in
temporary accommodation demonstrate un-met need for housing. Longer term increase in the
number of such households may be a signal to consider increasing planned housing numbers.
Planning Practice Guidance (March 2014), ID 2a-019
3.13
These were also considered when establishing the need for affordable housing, and the overall
housing number was increased to take account of the needs of homeless households and concealed
families with younger family representatives who would not have been counted as part of the
household projections. This adjustment has already been incorporated as a response to the
identified un-met need for housing, and can be considered as part of the response to market signals.
3.14
For clarity, concealed households are defined as; “family units or single adults living within other
households, who may be regarded as potential separate households which may wish to form given
appropriate opportunity8”, whereas overcrowded households are households that do not have
enough rooms to accommodate their size (based on a standardised formula – see paragraph 5.18).
8
https://www.gov.uk/government/uploads/system/uploads/attachment_data/file/6338/1776873.pdf
21Opinion Research Services | LLDC – Strategic Housing Market Assessment March 2018
Summary of Market Signals
3.15
As acknowledged earlier in this section, there is no single formula that can be used to consolidate the
implications of this information; and furthermore the housing market signals will have been
predominantly influenced by relatively recent housing market trends. Nevertheless, the indicators
provide a context for considering the balance between housing need and supply.
3.16
In terms of headline outputs, the market signals when compared to relevant comparator areas show:
Figure 15: Summary of Market Signals (Note: HMA figures derived using population weighted average of Local Authority data)
Lambeth,
Newham & Hackney & Barnet,
Camden & Lewisham Greater
Waltham Tower Enfield & England
Islington & London
Forest Hamlets Haringey
Southwark
INDICATORS RELATING TO PRICE
House prices
2016-17 price £313,900 £390,800 £486,400 £367,600 £350,500 £333,500 £148,000
Relative to
Lower quartile +112% +164% +229% +148% +137% +125% -
England
house price
2011-12 price £181,000 £235,500 £315,200 £219,600 £218,000 £216,000 £125,000
5-year change +73% +66% +54% +67% +61% +54% +18%
Rents
2016-17 cost £1,354 £1,802 £2,003 £1,575 £1,513 £1,748 £852
Relative to
Average monthly +59% +112% +135% +85% +78% +105% -
England
rent
2011-12 cost £921 £1,310 £1,734 £1,185 £1,224 £1,312 £705
5-year change +47% +38% +16% +33% +24% +33% +21%
Affordability
2016 ratio 14.2 14.3 17.3 13.9 15.3 12.8 7.2
Lower quartile Relative to
house price to +98% +100% +142% +94% +114% +78% -
England
workplace-based
earnings 2011 ratio 9.1 8.5 11.9 9.1 10.7 9.0 6.7
5-year change +57% +68% +45% +53% +43% +42% +7%
INDICATORS RELATING TO QUANTITY
Overcrowding
2011 proportion 29.2% 33.5% 30.8% 25.9% 21.1% 21.7% 8.7%
Relative to
Overcrowded +234% +283% +253% +196% +141% +148% -
England
households
2001 proportion 21.2% 28.4% 27.5% 21.6% 15.7% 17.3% 7.1%
10-year change +37% +18% +12% +20% +34% +25% +23%
Rate of development
2001-11 change 8.7% 24.1% 11.5% 10.9% 8.4% 8.7% 8.3%
Increase in stock Relative to
+4% +189% +38% +31% +1% +4% -
England
22Opinion Research Services | LLDC – Strategic Housing Market Assessment March 2018
3.17
On the basis of this data we can conclude:
» House Prices: lower quartile prices are much higher than the national average in both HMAs,
with a lower quartile price of £313,900 in Newham & Waltham Forest and a lower quartile
price of £390,800 in Hackney & Tower Hamlets, compared to England’s £148,000 (based on
2016-17 values). The current lower quartile price in Camden & Islington is higher again at
£486,400, but other comparator areas and Greater London have quartile prices somewhere
between those of the two wider HMAs
» Rents: for average private sector rents in 2016-17, both Newham & Waltham Forest and
Hackney & Tower Hamlets are above the national average. Rate of change in rents have been
greater in these two HMAs than similar comparator areas, across Greater London and the
national average;
» Affordability: (in terms of the ratio between lower quartile house prices and lower quartile
workplace-based earnings) is currently ‘worse’ in Newham & Waltham Forest (14.2) and
Hackney & Tower Hamlets (14.3) than across England as a whole (7.2), but is lower than
comparator areas Camden and Islington and Barnet, Enfield & Haringey;
» Overcrowding: (in terms of Census occupancy rates) shows that 29.2% of households in
Newham & Waltham Forest are overcrowded and 33.5% of households in Hackney & Tower
Hamlets are overcrowded based on an objective measure, which is much higher than England
(8.7%). However, the comparator area Camden & Islington has a similar rate of overcrowding
and other comparator areas are also much higher than the national average. The proportion
of overcrowded households has increased most in Newham & Waltham Forest over the last
10 years (37%), however the increase of overcrowded households in Hackney & Tower
Hamlets was lower than the national average (18% cf. 23%);
» Rate of development: (in terms of increase in dwelling stock over the last 10 years) shows
that development has increased the stock size by 8.7% in Newham & Waltham Forest, similar
to England (8.3%). However, the rate of development in Hackney & Tower Hamlets was much
greater than both of these and all comparator areas at 24.1%.
Conclusions on Market Signals
3.18
As previously noted, PPG suggests that “household projections should be adjusted to reflect
appropriate market signals” where there is a “worsening trend in any of these indicators”
(paragraphs 19-20). The indicators collectively show that circumstances in the area around LLDC are
generally similar to those across other areas of London; so any uplift must be determined in this
context.
3.19
There is no definitive guidance on what level of uplift is appropriate. Nevertheless, the Inspector
examining the Eastleigh Local Plan judged 10% to be reasonable given the market signals identified
for that HMA:
“It is very difficult to judge the appropriate scale of such an uplift … Exploration of an uplift
of, say, 10% would be compatible with the “modest” pressure of market signals recognised
in the SHMA itself.”
23Opinion Research Services | LLDC – Strategic Housing Market Assessment March 2018
3.20
We would also note that impact of market signals adjustments for the Greater London SHMA 2017
was an increase of around 20% above the baseline household projections. It is also the case the
London Borough of Camden SHMA contains a market signal uplift of 20% and this was agreed at the
Examination in Public of their Local Plan.
3.21
Given the relative market signal indicators for Newham & Waltham Forest and Tower Hamlets &
Hackney HMAs, together with the views of the Eastleigh and Camden Inspectors and the Greater
London SHMA, it would seem to be reasonable to consider an uplift of 20% as appropriate for LLDC.
The area experiences housing market pressures which are in line with other most highly pressurised
markets in London. However, in the next section we also consider a range of wider options to assess
the potential objectively assessed needs for LLDC.
24Opinion Research Services | LLDC – Strategic Housing Market Assessment March 2018
4. Objectively Assessed Need
Analysing the evidence to establish overall housing need
The Process for Assessing OAN
4.1
A key objective of this study is to explore the potential calculation of the Objectively Assessed Need
for LLDC. The process for developing OAN is now a demographic process to derive housing need
from a consideration of population and household projections. To this, external market and macro-
economic constraints are applied (‘Market Signals’) in order to embed the need in the real world as
shown in Figure 16. The need to balance jobs and workers is a matter for the HMA, not any
individual planning authority, so in the case of LLDC this would be the Greater London area.
Figure 16: Process for establishing a Housing Number for the HMA (Source: ORS based on NPPF and PPG)
4.2
It is important to recognise that the OAN does not take account of any possible constraints to future
housing supply, or any development led planned growth. Such factors will be subsequently
considered by the planning authority before establishing the final Housing Requirement. Therefore,
the OAN for LLDC is not the current Local Plan housing target, or any future planned delivery. These
are policy-on figures which not only meet the housing needs of the LLDC area, but also play a role in
meeting the wider needs of London.
The assessment of development needs is an objective assessment of need based on facts and
unbiased evidence. Plan makers should not apply constraints to the overall assessment of need,
such as limitations imposed by the supply of land for new development, historic under performance,
viability, infrastructure or environmental constraints. However, these considerations will need to be
addressed when bringing evidence bases together to identify specific policies within development
plans. Planning Practice Guidance (March 2014), ID 2a-004
25Opinion Research Services | LLDC – Strategic Housing Market Assessment March 2018
Dwellings in LLDC
4.3
Through the survey conducted in 2017, the LLDC area was estimated to contain 9,712 households.
Allowing a 2.4% vacancy and second home rate, this would give a total of almost exactly 10,000
dwellings (9,950) in the area in 2017. While the aim of this study is to provide the OAN for the
periods 2015-31 and 2015-36, we will start with the 2017 figure of 10,000 dwellings in the area as a
useful starting point to illustrate potential OAN scenarios.
4.4
It is the case that as of 2016 the population of LLDC accounts for 6.5% of the population of Tower
Hamlets, 5.4% of the population of Newham and 1.3% of the population of Hackney. While a small
area of Waltham Forest also lies within the LLDC area this does not contain residential communities
and therefore does not contribute to the population of Waltham Forest or LLDC.
4.5
For the remainder of this report we consider the potential level of the OAN for LLDC based both upon
existing research and current National Planning Policy Framework and Planning Practice Guidance,
but also on potential changes set in a current Government consultation which may come in to effect
in March 2018. All the models presented seek to represent alternative policy-off scenarios which
can be considered to represent the range for the OAN for LLDC.
26Opinion Research Services | LLDC – Strategic Housing Market Assessment March 2018
GLA Demographic Forecasts October 2017
4.6
In July 2017, the GLA published a series of demographic projections for London boroughs. This did
not include projections for LLDC, but did include all the local authorities which cover the area. One of
the models used to project the demographic needs was based upon dwelling led models for
projected delivery and therefore cannot be used to consider OAN because it is constrained to a
particular dwelling target already.
4.7
However, the GLA demographic data also considered three other possible demographic growth
scenarios based upon past migration trends for London. These alone are not the OAN for any area
because it is also necessary to consider a market signal response. In the models set out below we
have considered a market signal responses or 20% in line with other studies in the area.
4.8
The three models we have used in this section are set out in Figure 17:
Model 1: Uses localised 15 year long-term migration flows for London. This generates a need of 329
dwellings per annum when market signals are also considered and needs apportioned to the LLDC area.
Model 2: Uses “central trend” 10 year migration flows for London. This generates a need of 431 dwellings
per annum when market signals are also considered and needs apportioned to the LLDC area. The central
trend is the projection favoured by the London SHMA.
Model 3: Uses short-term 5 year migration flows for London. This generates a need of 512 dwellings per
annum when market signals are also considered and needs apportioned to the LLDC area.
Figure 17: Potential OAN for LLDC Based Upon July 2017 GLA Demographic Data 2015-31 (Source: GLA 2016 Based Demogrpahic
Projections)
2015-31 Annual 2015-36 Annual
Model Dwelling Dwelling Dwelling Dwelling
Growth Growth Growth Growth
Model 1: Long-term trend with 2.4% vacancy and 20% market
5,269 329 6,451 307
signals
Model 2: Central trend with 2.4% vacancy and 20% market signals 6,888 431 8,448 402
Model 3: Short-term trend with 2.4% vacancy and 20% market
8,198 512 10,062 479
signals
27Opinion Research Services | LLDC – Strategic Housing Market Assessment March 2018
Utilising data from the Population Survey for OAN
4.9
The GLA demographic projections provide a projection of population change in each borough. An
approach such as that in Models 1-3 assumes that given (for example) that 1.3% of residents of
Hackney are also residents of LLDC, then 1.3% of the projected growth in Hackney over the period
2015-31 will occur within LLDC. However, since the demographic composition of the Hackney
portion of LLDC is not the same as the whole of Hackney, this approach would be flawed and
therefore the figures should be treated with caution.
4.10
The primary data collected through the 2017 survey in LLDC allowed an accurate demographic
picture of LLDC to be developed. Figure 18 shows the percentage of residents in each area by age
group for the LLDC as a whole and subdivided into boroughs, along with data for each of the three
boroughs as a whole. This illustrates the difference in demographic composition:
Figure 18: Demographic breakdown of LLDC by Portion of Borough and Wider area (Source: 2017 Population Survey, GLA)
LLDC Portion of Boroughs Whole Boroughs
Tower Tower
Age Overall Newham Hackney Newham Hackney
Hamlets Hamlets
0 to 4 5.8% 5.6% 5.9% 6.5% 8.3% 7.1% 7.5%
5 to 9 4.9% 4.6% 4.0% 7.0% 7.4% 6.6% 6.7%
10 to 14 4.7% 4.6% 2.3% 6.9% 5.9% 5.5% 5.6%
15 to 19 5.8% 6.1% 2.0% 6.3% 5.9% 5.2% 5.0%
20 to 24 11.9% 12.9% 7.5% 9.1% 8.1% 8.9% 6.1%
25 to 29 17.9% 19.2% 17.9% 11.1% 11.3% 14.2% 11.6%
30 to 34 16.6% 16.4% 26.3% 12.0% 11.5% 13.7% 14.1%
35 to 39 11.8% 12.0% 14.9% 8.8% 8.8% 10.1% 10.6%
40 to 44 6.3% 6.1% 8.9% 5.7% 6.6% 7.0% 7.1%
45 to 49 4.0% 3.8% 3.8% 5.4% 6.0% 5.3% 5.9%
50 to 54 2.9% 2.5% 2.3% 5.7% 5.2% 4.3% 5.3%
55 to 59 2.6% 2.5% 1.0% 4.0% 4.3% 3.4% 4.1%
60 to 64 1.9% 1.4% 2.0% 4.1% 3.2% 2.7% 3.1%
65 to 69 1.0% 0.7% 0.3% 3.0% 2.4% 2.0% 2.4%
70 to 74 0.6% 0.5% 0.3% 1.1% 1.7% 1.4% 1.8%
75 to 79 0.5% 0.4% 0.3% 1.1% 1.3% 1.1% 1.3%
80 to 84 0.6% 0.5% 0.1% 1.4% 0.9% 0.8% 1.0%
85+ 0.3% 0.2% 0.4% 0.8% 0.8% 0.8% 0.9%
28You can also read