Corticothalamic gating of population auditory thalamocortical transmission in mouse
←
→
Page content transcription
If your browser does not render page correctly, please read the page content below
RESEARCH ARTICLE

                                    Corticothalamic gating of population
                                    auditory thalamocortical transmission in
                                    mouse
                                    Baher A Ibrahim1,2, Caitlin A Murphy3,4, Georgiy Yudintsev5,
                                    Yoshitaka Shinagawa1, Matthew I Banks3,4, Daniel A Llano1,2,5,6*
                                    1
                                     Department of Molecular and Integrative Physiology, University of Illinois, Urbana-
                                    Champaign, United States; 2Beckman Institute for Advanced Science and
                                    Technology, University of Illinois, Urbana-Champaign, United States; 3Department
                                    of Neuroscience, School of Medicine and Public Health, University of Wisconsin-
                                    Madison, Wisconsin-Madison, United States; 4Department of Anesthesiology,
                                    School of Medicine and Public Health, University of Wisconsin-Madison, Wisconsin-
                                    Madison, United States; 5Neuroscience Program, University of Illinois, Urbana-
                                    Champaign, United States; 6College of Medicine, University of Illinois, Urbana-
                                    Champaign, United States

                                    Abstract The mechanisms that govern thalamocortical transmission are poorly understood.
                                    Recent data have shown that sensory stimuli elicit activity in ensembles of cortical neurons that
                                    recapitulate stereotyped spontaneous activity patterns. Here, we elucidate a possible mechanism
                                    by which gating of patterned population cortical activity occurs. In this study, sensory-evoked all-
                                    or-none cortical population responses were observed in the mouse auditory cortex in vivo and
                                    similar stochastic cortical responses were observed in a colliculo-thalamocortical brain slice
                                    preparation. Cortical responses were associated with decreases in auditory thalamic synaptic
                                    inhibition and increases in thalamic synchrony. Silencing of corticothalamic neurons in layer 6 (but
                                    not layer 5) or the thalamic reticular nucleus linearized the cortical responses, suggesting that layer
*For correspondence:                6 corticothalamic feedback via the thalamic reticular nucleus was responsible for gating stochastic
d-llano@illinois.edu                cortical population responses. These data implicate a corticothalamic-thalamic reticular nucleus
Competing interests: The            circuit that modifies thalamic neuronal synchronization to recruit populations of cortical neurons for
authors declare that no             sensory representations.
competing interests exist.
Funding: See page 18
Received: 05 March 2020             Introduction
Accepted: 23 May 2021               Our experience of the world relies on how sensory information is processed. Thalamocortical projec-
Published: 24 May 2021              tions are critical for activation of the cerebral cortex, which is thought to contain the neural circuits
                                    that drive our conscious awareness of sensory stimuli. A classical view of thalamocortical function is
Reviewing editor: Andrew J
King, University of Oxford,
                                    that cortical activity during sensory perception is predictable based on activity in the thalamus and
United Kingdom                      patterns of synaptic convergence of thalamocortical axons onto cortical neurons. Thus, sensory proc-
                                    essing in this classical scheme behaves as a series of hierarchical linear filters, whose tuning is modi-
   Copyright Ibrahim et al. This
                                    fied by feedback, creating more complex response properties that reach the level of conscious
article is distributed under the
                                    perception by activating the cortex (Riesenhuber and Poggio, 1999; Vidyasagar and Eysel, 2015).
terms of the Creative Commons
Attribution License, which          However, this view does not comport with findings that population activity in sensory cortices is
permits unrestricted use and        often stereotyped and recapitulates patterns of cortical spontaneous activity (MacLean et al., 2005;
redistribution provided that the    Kenet et al., 2003; Miller et al., 2014; Sakata and Harris, 2009). As such, a hypothesis has
original author and source are      emerged that sensory representations are developed by early exposure to sensory stimuli and
credited.                           stored in the cortex within intracortical networks, and that the thalamus activates these pre-wired

Ibrahim et al. eLife 2021;10:e56645. DOI: https://doi.org/10.7554/eLife.56645                                                         1 of 23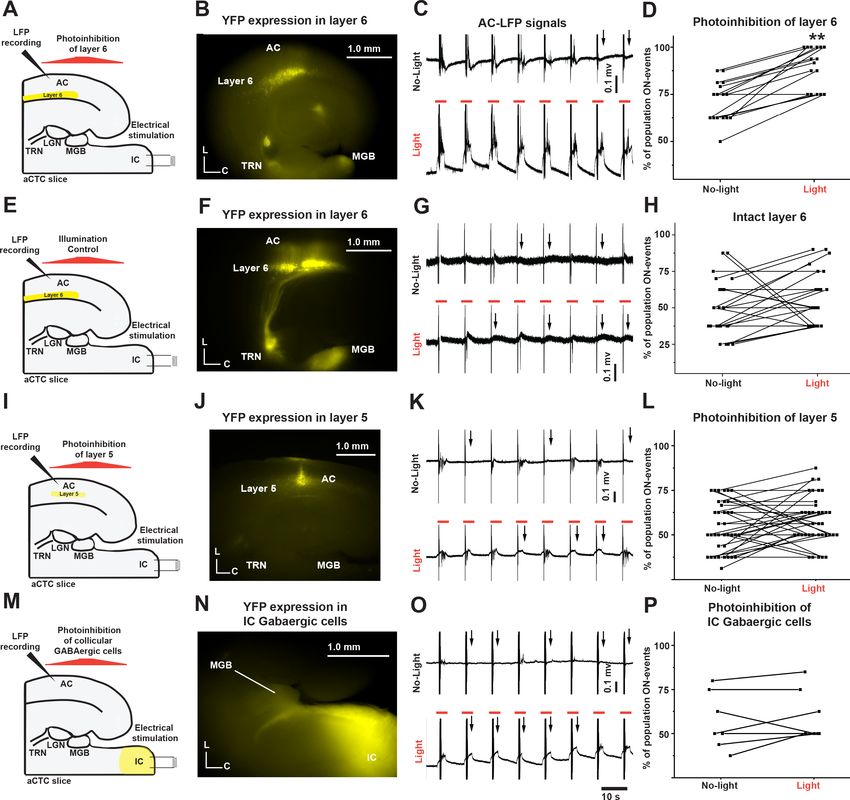
Research article Neuroscience
sensory representations upon sensory stimulation (MacLean et al., 2005; Petersen, 2005). Some
observations that support this hypothesis are that spontaneous cortical activity is highly determined
by the internal cortical connectivity (Kenet et al., 2003; Sanchez-Vives and McCormick, 2000), and
is not easily predictable from activity in thalamocortical afferents (MacLean et al., 2005;
Cossart et al., 2003). In addition, spontaneous cortical activity is the main substrate for the genera-
tion of the internal percepts during states without external sensory input, such as memory recall and
dreaming (Takeuchi et al., 2011; Nir and Tononi, 2010). Further, despite substantial differences in
the form and organization in the initial processing stages of different modalities of sensation, at the
level of the thalamus and cortex, neural circuits across modalities are relatively homogeneous (Shep-
herd, 2011; Douglas et al., 1989; Phillips et al., 2019). These findings suggest that there is a com-
mon function of thalamocortical circuits that is not tied to specific modalities of perception.
Given that connected neuronal ensembles are likely the main functional unit for behavior and cog-
nition (Uhlhaas et al., 2009; Buzsáki, 2010), a major control point for the activation of cortical
ensembles, and therefore cognition more generally, may lie in the thalamus. Here, we examine the
mechanisms by which all-or-none population responses (hereafter called ‘Population ON’ or ‘Popula-
tion OFF’ responses) in the auditory cortex (AC) are gated. We find that gating of cortical activity
occurs via corticothalamic projection to the thalamic reticular nucleus (TRN), which is a long-enig-
matic structure that partially surrounds and sends GABAergic projections to thalamocortical neurons.
Further, we observed that population OFF responses in the AC are associated with increases in syn-
aptic inhibition and neuronal desynchronization in the auditory thalamus. These findings suggest
that one mode of thalamocortical function is to select groups of cortical neurons for activation based
on feedback from cortical layer 6.
Results
Stochastic AC responses to sound presentations in vivo
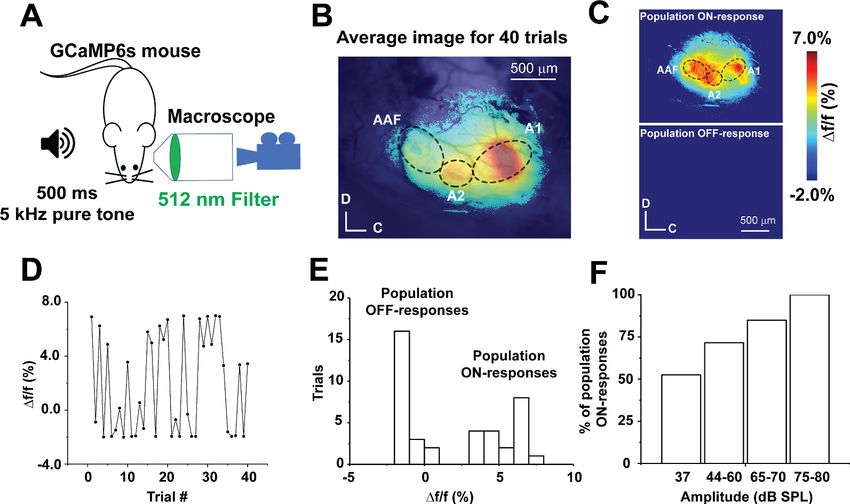
Transcranial calcium imaging of the AC of an anesthetized GCaMP6s mouse following repeated pre-
sentations of a 5 kHz-37 dB SPL pure tone (Figure 1A) revealed cortical activity in three distinct
areas, the primary AC (A1), secondary AC (A2), and anterior auditory field (AAF), consistent with pre-
vious work (Issa et al., 2014; Figure 1B, MATLAB code in Figure 1—source code 1). Such sound-
evoked cortical activity represented the average of the cortical responses to 40 presentations of the
same tone. Across the 40 trials of the same sound presentation, we observed that A1 showed either
a full population response (here called population ON cortical responses) or no response (referred
to here as population OFF cortical responses), with some variability within each class (Figure 1C,
MATLAB code in Figure 1—source code 1). Inspection of the individual cortical responses over time
revealed the responses to be independent of stimulus presentation order (Figure 1D, Figure 1—
source data 1). Collectively, a histogram of Df/f of sound-evoked calcium signals from A1 across tri-
als showed two classes of A1 responses (‘Population ON’ vs. ‘Population OFF,’ Figure 1E, Figure 1—
source data 1). A greater frequency of the population ON cortical responses was observed with
increasing sound pressure level (Figure 1F, Figure 1—source data 1). Similar stochastic population
sensory cortical responses have been observed previously (MacLean et al., 2005; Kenet et al.,
2003; Miller et al., 2014; Sakata and Harris, 2009), but the mechanisms that determine whether a
population ON or OFF response occurs have not yet been elucidated.
Stochastic AC responses to electrical stimuli to IC in vitro
To examine the circuit mechanisms underlying the stochastic nature of the responses (Figure 2),
brain slices that retain connectivity between the inferior colliculus (IC), medial geniculate body
(MGB), thalamic reticular nucleus (TRN) and AC were constructed (Figure 2—figure supplement
1; Llano et al., 2014; Slater et al., 2015). The auditory colliculo-thalamocortical (aCTC) mouse brain
slice retains the synaptic connections between these structures: hence, electrical stimulation of the
IC evoked neuronal activity in all of these brain structures as indicated by stimulus-evoked flavopro-
tein autofluorescence (FA) and calcium-dependent fluorescence signals (Figure 2A–E). Figure 2B
and D, (MATLAB codes in Figure 2—source code 1 and 2), show the average of the stimulus-
evoked activity of the connected brain structures in the aCTC slice after 10 trials of IC stimulation.
However, review of the individual time series of Df/f of the stimulus-evoked FA and calcium signals
Ibrahim et al. eLife 2021;10:e56645. DOI: https://doi.org/10.7554/eLife.56645 2 of 23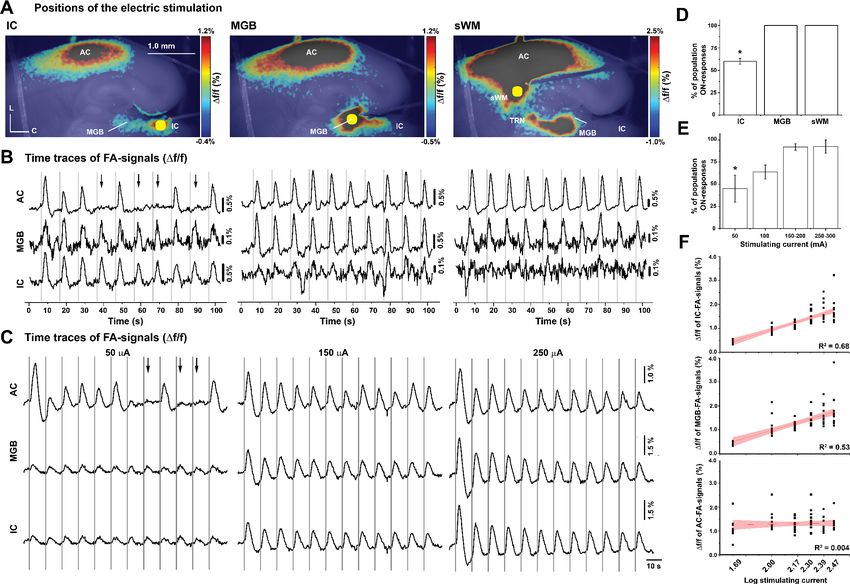
Research article Neuroscience
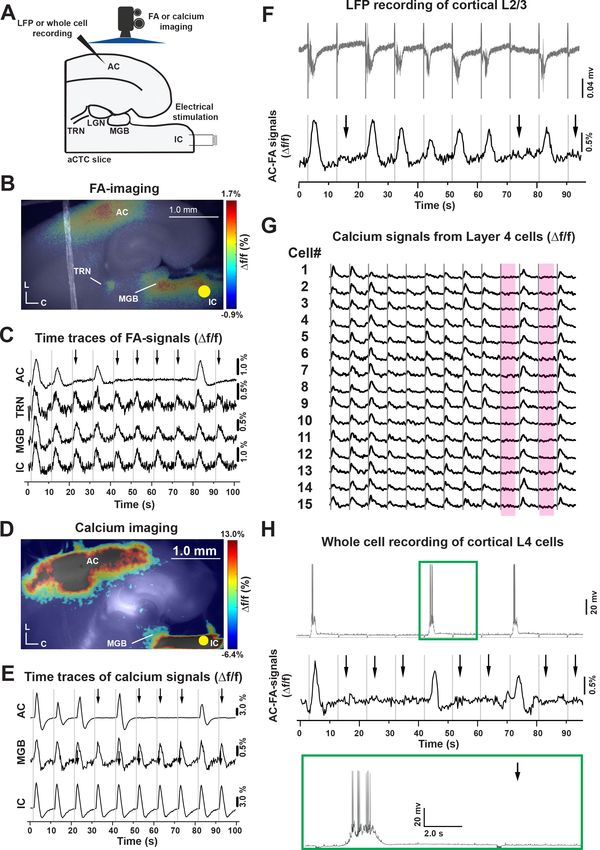
Figure 1. Stochastic auditory cortical population responses to repeated sound presentations in vivo. (A) A cartoon image showing the experimental
design of transcranial calcium imaging of the left AC of GCaMP6s mouse during a 500 ms pure tone (5 kHz) exposure to the right ear. (B) Pseudocolor
image representing the average map of AC activation indicated by Df/f of sound-evoked calcium signals following 40 trials of 5 kHz-37 dB SPL pure
tone stimulation. (C) Two pseudocolor images representing an individual trial for population ON cortical response (top) versus population OFF cortical
response (bottom). (D) A line graph of Df/f of the sound-evoked Ca signals of A1 across 40 trials of playing 5 kHz, 37 dB SPL over time. (E) A histogram
of the Df/f of sound-evoked calcium signals following 40 trials of 5 kHz-37 dB SPL stimulation (bin size = 1%). (F) A bar graph showing the percentage of
population ON cortical responses across different sound levels at 5 kHz pure tone; A1: Primary auditory cortex, A2: Secondary auditory cortex, AAF:
Anterior auditory field, C: Caudal, D: Dorsal.
The online version of this article includes the following source data and source code for figure 1:
Source code 1. The MATLAB code used to produce Figure 1B and C.
Source data 1. Data values of Figure 1D-F.
across trials of IC stimulation (Figure 2C and E, Figure 2—source data 1 and 2) reveals stochastic
responses in the AC; a pattern that was similar to the in vivo data, despite the fact that MGB, TRN,
and IC were always responsive to IC stimulation. The FA and calcium signals were determined based
on predetermined criteria (Figure 2—figure supplement 2, Figure 2—figure supplement 2—
source data 1, see Materials and methods). This finding was consistent with whole-cell recording
from MGB and TRN cells (Figure 2—figure supplement 3), where spikes were seen in response to
each stimulus irrespective of the presence of a population AC response. We note that similar to pre-
vious studies, FA and calcium signals from the MGB are smaller than those from AC (Dana et al.,
2014; Llano et al., 2009), which may be related to limited alignment of mitochondria-containing
neuropil processes or low baseline expression of GCaMP in the MGB, respectively.
To ensure that metabolic or imaging artifacts did not drive the observation of these stochastic
population cortical responses, local field potentials (LFPs) were recorded in the AC while simulta-
neously conducting FA imaging, and the LFPs also showed all-or-none response patterns that
strongly correlated with the FA signals (Figure 2F, Figure 2—source data 3). We also observed sto-
chastic population AC responses in brain slices prepared using a different anesthetic (isoflurane)
without transcardiac perfusion in a different laboratory using a biphasic stimulator vs. monophasic
stimulator (Figure 2—figure supplement 4), suggesting that the stochastic responses were not spe-
cific to a particular slice preparation or stimulation technique.
Looking more closely at the activity of cortical layer 4 cells, the stimulus-evoked calcium signals of
a small population of layer 4 cells following IC stimulation showed that a similar population layer 4
cells was activated with each population ON response and that population OFF responses were
Ibrahim et al. eLife 2021;10:e56645. DOI: https://doi.org/10.7554/eLife.56645 3 of 23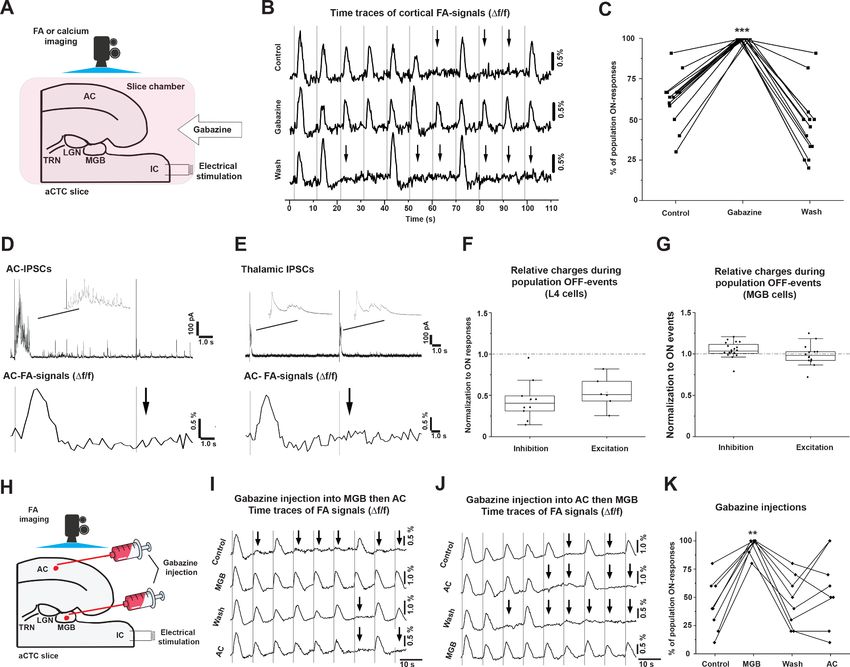
Research article                                                                                                              Neuroscience

Figure 2. Stochastic auditory cortical responses to repeated electrical stimuli in vitro. (A) A cartoon image showing the experimental design of
simultaneous FA or calcium imaging and IC stimulation of the aCTC slice, which were also associated with LFP or whole-cell recording from cortical 3/4
layers in other experimental setups. (B and D) Pseudocolor images showing the neuronal activation indicated by evoked FA or calcium signals,
respectively, in the IC, MGB, TRN, and AC following IC stimulation (nine animals). (C and E) The time series of Df/f of evoked FA or calcium signals,
Figure 2 continued on next page

Ibrahim et al. eLife 2021;10:e56645. DOI: https://doi.org/10.7554/eLife.56645                                                                  4 of 23
Research article                                                                                                               Neuroscience

Figure 2 continued
respectively, in the IC, MGB, TRN, and AC following IC stimulation. (F) The time series of the L3/4 LFP signals
(top panel) and Df/f of the evoked cortical FA signals (bottom panel) following IC stimulation. (G) The time
series of evoked calcium signals of a small population of layer 4 cells following IC stimulation, the two rose

Figure 3. The effect of stimulation location and amplitude on the occurrence of OFF-cortical responses. (A) Pseudocolor images of the evoked FA
signals in aCTC slice after electrical stimulation of the IC, the MGB, or the subcortical white matter, respectively. (B) The time series of Df/f of the
evoked FA signals in AC, MGB, and IC following electrical stimulation of IC, MGB, or the subcortical white matter, respectively. (C) The time series of
Df/f of the evoked FA signals in AC, MGB, and IC following the stimulation of the IC with different stimulating current amplitudes. (D and E) Bar graphs
showing the percentage of population ON cortical responses at different loci of stimulation and across different stimulating current amplitudes at the
IC, respectively. (F) Line graphs showing the relationship between stimulating current amplitude and Df/f of FA signals from IC (top), MGB (middle), and
AC (bottom), respectively; Black arrows refer to the missing cortical responses (‘population OFF’ responses) indicated by the absence of cortical FA,
vertical gray lines indicate the onset of IC stimulation, and yellow circles indicate the position of the electrical stimulation; sWM: subcortical white
matter.
The online version of this article includes the following source data and source code for figure 3:
Source code 1. The main MATLAB code used to produce Figure 3A.
Source code 2. The supplementary MATLAB code used to produce Figure 3A.
Source data 1. Time traces of FA signals in Figure 3B.
Source data 2. Data values of Figure 3D.
Source data 3. Time traces of FA signals in Figure 3C.
Source data 4. Data values of Figure 3E.
Source data 5. Data values of Figure 3F.

Ibrahim et al. eLife 2021;10:e56645. DOI: https://doi.org/10.7554/eLife.56645                                                                    5 of 23
Research article                                                                                                   Neuroscience

                                    associated with an absence of layer four responses. For instance, all neurons ceased to respond dur-
                                    ing stimuli # 9 and 11 (Figure 2G, rose ribbons, Figure 2—source data 4) and (Figure 2—figure
                                    supplement 5). Whole-cell recordings of layer 4 cells during population ON population responses
                                    revealed a plateau of depolarization upon which rode several action potentials (Figure 2H, green
                                    box, Figure 2—source data 5), resembling previously described UP states (Sanchez-Vives and
                                    McCormick, 2000; Rigas and Castro-Alamancos, 2007; Fanselow and Connors, 2010), which was
                                    supported by the bimodal distribution shown by the post stimulus membrane potential of such layer
                                    4 cells during population ON cortical responses (Figure 2—figure supplement 6, Figure 2—figure
                                    supplement 6—source data 1, see, Materials and methods). Collectively, these data suggest that IC
                                    stimulation produces stochastic population responses in the AC, and that these population
                                    responses are stereotyped and represent stimulus-induced UP states.
                                       To determine the locus of control for whether a population ON or population OFF response
                                    would be elicited, we moved the stimulating electrode from the IC to the MGB and then to the sub-
                                    cortical white matter (Figure 3A, MATLAB codes in Figure 3—source code 1 and 2). Population
                                    ON/OFF cortical responses occurred only after electrical stimulation of IC, and not by the direct
                                    stimulation of MGB or the subcortical white matter (Figure 3B and D, Figure 3—source data 1 and
                                    2, Kruskal-Wallis: p=0.001, pairwise comparison: p=0.023 for IC vs. MGB or subcortical white matter
                                    and p=1 for MGB vs. subcortical white matter, Dunn’s post hoc test, n = 5). To determine the impact
                                    of stimulating current amplitude on the likelihood of eliciting a population ON-cortical response, dif-
                                    ferent amplitudes of stimulating current were delivered to the IC (Figure 3C, Figure 3—source data
                                    3). Similar to the in vivo data, the percentage of population ON cortical responses increased with
                                    increasing amplitude of the stimulating current (Figure 3E, Figure 3—source data 4, RM-ANOVA:
                                    *F(3,9)=9.7, p=0.003, pairwise comparison: *p=0.009 for 50 vs. 150–200 mA, *p=0.008 for 50 vs. 250–
                                    300 mA, Bonferroni post hoc test, n = 4 slices from four animals), which was consistent with the in
                                    vivo results (Figure 1F). Moreover, while there was a log-linear relationship between the FA signals
                                    of either IC or MGB and the stimulating current amplitude (Figure 3F, Figure 3—source data 5,
                                    R2 = 0.68, p=2.210 19 for IC and R2 = 0.53, p=3.310 13 for MGB), this relationship was lost
                                    between the cortical responses and stimulating current amplitude (Figure 3F, Figure 3—source
                                    data 5, R2 = 0.004, p=0.6), suggesting that the magnitude of the cortical response is not predictable
                                    from stimulus amplitude.

                                    Population OFF cortical responses are driven by inhibition in the MGB
                                    Because population OFF cortical responses represented a full absence of stimulus-evoked cortical
                                    activity, we reasoned that population OFF cortical responses could be driven by inhibition. To inves-
                                    tigate this idea, global disinhibition in the aCTC slice by bath application of gabazine (SR-95531, 200
                                    nM), the GABAA-R blocker, was conducted. Under simultaneous FA imaging and IC stimulation,
                                    gabazine perfusion was able to retrieve all missing cortical responses compared to control
                                    (Figure 4B and C, Figure 4—source data 1 and 2, Kruskal-Wallis: p=2.510 7, pairwise compari-
                                    son: p=5.0810 4 for gabazine vs. control, p=4.110 7 for gabazine vs. wash, and p=0.34 for con-
                                    trol vs. wash, Dunn’s post hoc test, n = 14 trials obtained from five animals), which suggested that
                                    the population OFF cortical responses were driven by inhibitory inputs. We further investigated the
                                    AC and MGB to search for the site of inhibition that drove population OFF cortical responses.
                                    Whole-cell recording of cortical layer 4 or MGB cells voltage-clamped at +10 mV was conducted
                                    simultaneously with FA imaging following the stimulation of the IC to track the IPSCs during popula-
                                    tion ON vs. population OFF cortical responses. Consistent with the previous finding that stimulation
                                    of the IC evoked a post-stimulus UP-states activity in layer 4 cells during the population ON cortical
                                    responses only (Figure 2H; Fanselow and Connors, 2010; Haider et al., 2006), layer 4 cells demon-
                                    strated a surge of evoked post-stimulus IPSCs during population ON cortical responses only
                                    (Figure 4D). In contrast, MGB cells showed evoked post-stimulus IPSCs following every trial of IC
                                    stimulation during population ON and population OFF cortical responses (Figure 4E). Quantita-
                                    tively, while these evoked cortical post-stimulus IPSCs and EPSCS in the layer 4 cells were signifi-
                                    cantly smaller during population OFF compared to population ON cortical responses (Figure 4F,
                                    Figure 4—source data 3, paired sample Wilcoxon Signed Rank Test: p=0.006 for IPSCs, n = 10 cells
                                    from four animals and p=0.036 for EPSCs, n = 6 cells from four animals), the evoked post-stimulus
                                    IPSCs in the MGB cells were larger during population OFF compared to population ON cortical
                                    responses, with no difference in the net excitatory transferred charges (Figure 4G, Figure 4—source

Ibrahim et al. eLife 2021;10:e56645. DOI: https://doi.org/10.7554/eLife.56645                                                       6 of 23
Research article Neuroscience Figure 4. The population OFF cortical responses are driven by MGB inhibition. (A) A cartoon image showing the experimental design of simultaneous FA imaging and IC stimulation as well as gabazine perfusion. (B) The time series of Df/f of the evoked cortical FA signals with ACSF (control, top trace), with gabazine (middle trace), or wash by ACSF (bottom trace). (C) A plot of the results showing that the percentage of population ON cortical responses was significantly higher than that of control and wash. (D) Evoked post-stimulus IPSCs recorded from layer 4 cells (top panel), and the Df/f of the evoked cortical FA responses (bottom panel) following the IC stimulation. (E) Evoked post-stimulus IPSCs recorded from MGB cells (top panel), and the Df/f of the evoked cortical FA responses (bottom panel) following the IC stimulation. (F and G) Scatterplots of the area under the curve (AUC) of the evoked post-stimulus IPSCs and EPSCs recorded from AC or MGB, respectively, during population OFF cortical responses and normalized against those recorded during population ON cortical events. (H) A cartoon image showing the experimental design of simultaneous FA imaging, IC stimulation, and selective gabazine injection into MGB or AC using a picospritzer. (I and J) The time series of Df/f of the evoked cortical FA signals during a counterbalanced gabazine injection starting into MGB then AC or AC then MGB, respectively. (K) A plot of the results showing that the percentage of population ON cortical responses were significantly higher after the injection of gabazine into MGB; Black arrows refer to the occurrence of population OFF cortical responses indicated by the absence of the cortical FA signals; Vertical gray lines indicate the onset of IC stimulation; IPSCs: Inhibitory postsynaptic currents, and EPSCs: Excitatory postsynaptic currents. The online version of this article includes the following source data and figure supplement(s) for figure 4: Source data 1. Time traces of FA signals in Figure 4B. Source data 2. Data values of Figure 4C. Source data 3. Data values of Figure 4F. Source data 4. Data vaues of Figure 4G. Source data 5. Time traces of FA signals in Figure 4I. Source data 6. Time traces of FA signals in Figure 4J. Figure 4 continued on next page Ibrahim et al. eLife 2021;10:e56645. DOI: https://doi.org/10.7554/eLife.56645 7 of 23
Research article Neuroscience
Figure 4 continued
Source data 7. Data values of Figure 4K.
Figure supplement 1. The injection of gabazine into MGB and AC.
data 4, paired sample Wilcoxon Signed Ranks Test: p=0.011 for IPSCs, n = 20 cells from seven ani-
mals and p=0.56 for EPSCs, n = 14 cells from four animals). These findings suggest that MGB cells
receive more inhibition during population OFF cortical responses with no change in excitation, which
led us to hypothesize that MGB activity could be modulated by inhibitory inputs during the popula-
tion OFF cortical responses.
To test this hypothesis, we determined whether disinhibition of the MGB could yield population
ON cortical responses to all stimuli. Under simultaneous FA imaging and IC stimulation, the specific
injection of gabazine (Figure 4—figure supplement 1) into the MGB in the aCTC slice was able to
significantly increase the percentage of population ON cortical responses (Figure 4I and J, Fig-
ure 4—source data 5 and 6), indicated by the Df/f of the evoked cortical FA signals (Figure 4K, Fig-
ure 4—source data 7, RM-ANOVA: F(3,21) = 13.9, p=3.1710 5, pairwise comparison:
*p=5.910 5, 1.5 10 4, 0.0026 for gabazine in MGB vs. control, wash, and gabazine in AC,
respectively, Bonferroni post hoc test, n = 8 slices from seven animals). In contrast, the same effect
was not observed after selective gabazine injection into the AC (Figure 4K, Figure 4—source data
7, RM-ANOVA: F(3,21) = 13.9, pairwise comparison: p=0.73 and 1.0 for gabazine in AC vs. control
and wash, respectively, Bonferroni post hoc test, n = 8 slices from seven animals), consistent with
data obtained from the whole-cell recording of layer 4 cells (Figure 4D and F). Accordingly, these
data confirmed that the population OFF cortical responses could be driven by thalamic inhibition.
Synchronized MGB cells are associated with population ON-cortical
responses
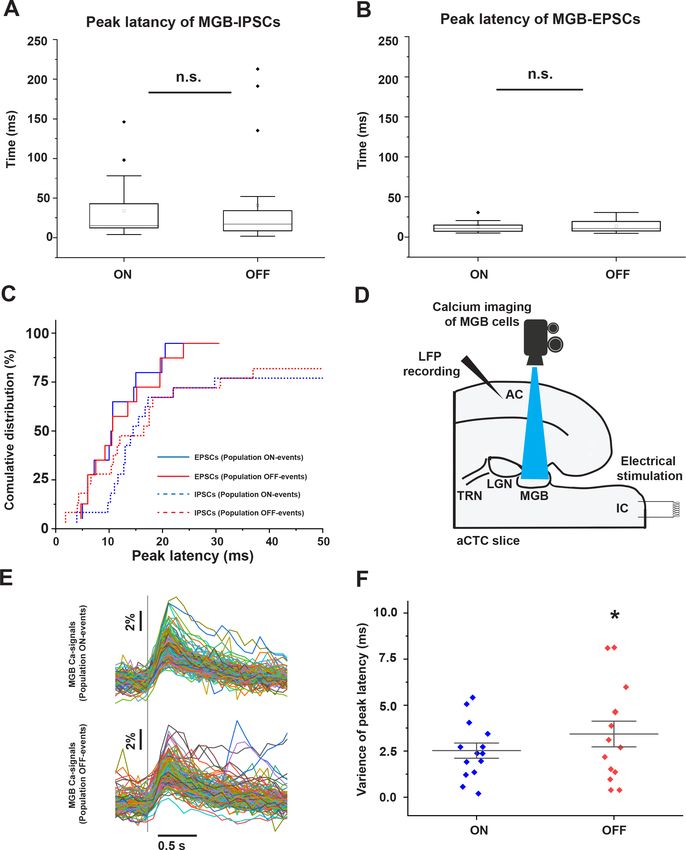
Although the mean peak latencies of IPSCs and EPSCs received by MGB cells showed no difference
during population ON and population OFF cortical responses (Figure 5A and B, Figure 5—source
data 1, paired sample Wilcoxon Signed Ranks Test: p=0.28, n = 20 cells from seven animals for
IPSCs and paired t-test: t(12) = 0.72, p=0.48, n = 14 cells from four animals for EPSCs), the cumula-
tive distribution function showed that some MGB cells (~50% of the recorded cells) received earlier
IPSCs during population OFF cortical responses (Figure 5C, Figure 5—source data 1). These earlier
inhibitory signals received by some MGB cells could negatively impact the synchronization between
the MGB cells required to pass the sensory information to the cortex. To test this hypothesis, the
time courses of calcium signals of MGB cells, which were found to match the voltage signals that
were simultaneously recorded in a separate experiment (Figure 5—figure supplement 1), were
imaged following the stimulation of the IC, and were compared during population ON vs. popula-
tion OFF cortical responses (Figure 5D and E, Figure 5—source data 2). We observed that the vari-
ance of the peak latencies of the evoked calcium signals from all thalamic cells was larger during
population OFF cortical responses than population ON responses (Figure 5F, Figure 5—source
data 3, paired sample t-test: t(13) = 2.37, *p=0.033, n = 14 paired responses (population ON vs.
population OFF) including 339 cells from five animals). We note that the absolute latencies of the
calcium imaging responses are considerably longer than those measured electrophysiologically.
However, despite the relatively slow time course of the calcium response, the peak times remained
relatively stable during population ON responses. These data suggest that synchronous thalamic
relay cell activity is required to evoke a cortical population ON response, consistent with previous
work (Bruno and Sakmann, 2006).
Corticothalamic layer 6 cells are the main driver of the missing cortical
response via TRN
The data described above suggest that MGB cells receive more inhibition during population OFF
cortical responses. Therefore, we investigated the source of these potential inhibitory inputs. As pre-
viously reported, the MGB can be inhibited by the cortex through the feedback inhibition by TRN
(Lam and Sherman, 2010) or by the IC through the feedforward inhibition by IC GABAergic cells
(Peruzzi et al., 1997; Winer et al., 1996). Therefore, we determined if inhibition of either of these
Ibrahim et al. eLife 2021;10:e56645. DOI: https://doi.org/10.7554/eLife.56645 8 of 23Research article Neuroscience Figure 5. Desynchronized MGB cellular activity is associated with population OFF-cortical responses. (A and B) Plots of peak latencies of IPSCs (A) and EPSCs (B) measured in the MGB after IC stimulation. No difference was seen in the mean latency during population ON vs. OFF responses. (C) Cumulative distribution functions of the peak latencies of IPSCs (dotted line) and EPSCs (solid line) during population ON (blue line) or population OFF- cortical responses (red line) showing that ~50% of MGB cells received earlier IPSCs during population OFF cortical responses (red dotted line). (D) A Figure 5 continued on next page Ibrahim et al. eLife 2021;10:e56645. DOI: https://doi.org/10.7554/eLife.56645 9 of 23
Research article                                                                                                             Neuroscience

Figure 5 continued
cartoon image showing the experimental design of simultaneous calcium imaging of MGB, LFP recording form the cortex, and the IC stimulation. (E)
The sweeps of the evoked calcium signals of all activated cells during population ON (top) vs. population OFF (bottom) cortical responses indicated by
the post-stimulus cortical LFP signals recorded from L3/4. (F) A scatterplot showing a higher variance of the peak latencies of MGB cells activated
during population OFF cortical response compared to those activated during population ON cortical responses. Vertical gray line indicates the onset of
IC stimulation.
The online version of this article includes the following source data and figure supplement(s) for figure 5:
Source data 1. Data values of Figure 5A-C.
Source data 2. Time traces of calcium signals in Figure 5E.
Source data 3. Data values of Figure 5F.
Figure supplement 1. Calcium imaging from MGB cells.

                                    pathways (to disinhibit the MGB) could retrieve the missing cortical responses. Corticothalamic layer
                                    6 cells indirectly inhibit thalamic relay cells by exciting GABAergic neurons in the TRN, a shell-like
                                    structure of GABAergic neurons that surrounds the most of dorsolateral part of the thalamus
                                    (Crandall et al., 2015; Guo et al., 2017). Therefore, the feedback inhibition of MGB via corticothala-
                                    mic layer 6-TRN pathway was examined. Injection of the AC of NTSR1-Cre neonates with halorho-
                                    dopsin-AAV resulted in a successful Cre-dependent expression of eNpHR3.0 receptors in the
                                    corticothalamic layer 6 as well as their projections to TRN and MGB indicated by YFP tag
                                    (Figure 6B). Photoinhibition of corticothalamic layer 6 cells by illumination with 565 nm light resulted
                                    in a significant increase in the probability of population ON cortical responses as indicated by the
                                    recovery of the post-stimulus LFP signals from L3/4 compared to the control (Figure 6C and D, Fig-
                                    ure 6—source data 1, paired t-test: t(15) = 7.06, **p=3.810 6, n = 16 trials from four animals). A
                                    control experiment was done by injecting NTSR1-Cre mice with a virus expressing YFP without the
                                    inhibitory opsin. The same illumination of the aCTC slice expressing YFP in layer 6 cells (Figure 6F)
                                    with a 565 nm light of could not retrieve the population ON cortical responses (Figure 6G and H,
                                    Figure 6—source data 2, paired t-test: t(24) = 1.3, p=0.2, n = 25 trials from five animals). To exam-
                                    ine the impact of silencing corticothalamic layer 6 neurons using FA imaging, the AC of a separate
                                    group of NTSR1-Cre neonates was injected with DREADDs-AAV virus, which resulted in a successful
                                    Cre-dependent expression of the inhibitory chemogenetic receptors, hM4Di, as indicated by
                                    mCherry tag specifically in corticothalamic layer 6 cells as well as their projections to TRN and MGB
                                    (Figure 6—figure supplement 1B). Consistent with the previous data, the chemical inhibition of cor-
                                    ticothalamic layer 6 cells expressing hM4Di receptors by their chemical actuator, CNO, significantly
                                    increased the frequency of population ON cortical responses as indicated by Df/f of evoked cortical
                                    FA signals compared to the control (Figure 6—figure supplement 1C and D, Figure 6—figure sup-
                                    plement 1—source data 1 and 2, paired test: t(3) = 3.66, p=0.035, n = 4 trials from four animals).
                                    The control experiment was done by injecting other NTSR1-Cre mice with a virus expressing
                                    mCherry without the DREADDs, and the perfusion of CNO to the aCTC slices taken from these ani-
                                    mals could not retrieve the population ON cortical responses (Figure 6—figure supplement 1E,
                                    Figure 6—figure supplement 1—source data 3, paired test: t(4) = 0.9, p=0.4, n = 5 trials from five
                                    animals).
                                        Given that corticothalamic layer 6 cells project to MGB through a direct excitatory synapse, fur-
                                    ther examination was required to test if the TRN is the main driver of corticothalamic layer six effect.
                                    Blocking of the TRN activity by NBQX, the AMPA-R blocker (Sun et al., 2013; Lee et al., 2010a),
                                    which was specifically injected into TRN, significantly increased the probability of population ON cor-
                                    tical events indicated by Df/f of the evoked cortical FA signals (Figure 6—figure supplement 1G
                                    and H, Figure 6—figure supplement 1—source data 4 and 5, paired test: t(5) = 6.03,
                                    **p=5.210 4, n = 8 trials from seven animals). To test the specificity of corticothalamic layer 6-TRN
                                    pathway to modulate MGB activity, we performed a control experiment by inhibiting layer 5 cortico-
                                    thalamic cells, which do not have significant projections to the TRN (Crabtree, 2018). The injection
                                    of the AC of RBP4-Cre neonatal mice with halorhodopsin virus resulted in a successful Cre-depen-
                                    dent expression of eNpHR3.0 receptors in layer 5 cells as indicated by YFP tag (Figure 6J). In con-
                                    trast to layer 6 cells, the projections from layer five to MGB in the aCTC slice are sparse, as has been
                                    previously described (Llano and Sherman, 2008), so they are not well seen in the low-magnification
                                    image (Figure 6J). However, with high magnification, the layer 5 projections to MGB were observed

Ibrahim et al. eLife 2021;10:e56645. DOI: https://doi.org/10.7554/eLife.56645                                                                10 of 23
Research article Neuroscience Figure 6. The population OFF cortical responses were driven by the feedback inhibition of MGB by corticothalamic layer six via TRN. (A and E) Cartoon images showing the experimental design of simultaneous IC stimulation, LFP recording, and photoinhibition for aCTC slice with and without eNpHR3.0 receptors, respectively. (B and F) Images of aCTC slice of NTSR1-Cre mouse showing the expression of eNpHR3.0 receptors as indicated by YFP tag and YFP only, respectively, in NTSR1-positive corticothalamic layer 6 cells as well as their projections to TRN and MGB. (C, G, K and O) The time series of the post-stimulus cortical LFP signals from L3/4 following IC stimulation without (top panel) and with 565 nm light (bottom panel). (D) A scatterplot of percent population ON responses pre- and post-light application showing that the percentage of population ON cortical events was higher during the photoinhibition of corticothalamic layer 6 cells. (H) A scatterplot of percent population ON responses pre- and post-light application showing that the illumination of the aCTC slice expressing no inhibitory opsin with 565 nm light could not retrieve the population ON cortical responses. (I) A cartoon image showing the experimental design of simultaneous IC stimulation, LFP recording, and photoinhibition of layer 5 cells (J) Image of aCTC slice of RBP4-Cre mouse showing the expression of eNpHR3.0 receptors as indicated by YFP tag in RBP4-positive layer 5 cells. (L) A scatterplot of percent population ON responses pre- and post-light application showing that the photoinhibition of layer 5 cells could not retrieve the population ON cortical responses. (M) A cartoon image showing the experimental design of simultaneous IC stimulation, LFP recording, and photoinhibition of IC GABAergic cells (N) Image of aCTC slice from GAD2-Cre mouse showing the Cre-dependent expression of halorhodopsin indicated by YFP tag in GABAergic cells Figure 6 continued on next page Ibrahim et al. eLife 2021;10:e56645. DOI: https://doi.org/10.7554/eLife.56645 11 of 23
Research article                                                                                                                   Neuroscience

Figure 6 continued
of the IC as well as their projections to MGB. (P) A scatterplot of the percentage of cortical population ON responses showing no change after the
photoinhibition of IC GABAergic cells by light; Black arrows refer to the occurrence of population OFF cortical responses indicated by the absence of
post-stimulus cortical LFP signals from L3/4; Vertical gray lines indicate the onset of IC stimulation; Orange lines indicate the time period of illumination
(3 s).
The online version of this article includes the following source data and figure supplement(s) for figure 6:
Source data 1. Data values of Figure 6D.
Source data 2. Data values of Figure 6H.
Source data 3. Data values of Figure 6L.
Source data 4. Data values of Figure 6P.
Figure supplement 1. Chemical inhibition of corticothalamic layer 6 cells and TRN blocking retrieved the missing cortical responses.
Figure supplement 1—source data 1. Time traces of FA signals in Figure 6—figure supplement 1C.
Figure supplement 1—source data 2. Data values of Figure 6—figure supplement 1D.
Figure supplement 1—source data 3. Data values of Figure 6—figure supplement 1E.
Figure supplement 1—source data 4. Time traces of FA signals in Figure 6—figure supplement 1G.
Figure supplement 1—source data 5. Data values of Figure 6—figure supplement 1H.
Figure supplement 2. The projections from layer 5 cells to the MGB in the aCTC slice.

                                      (Figure 6—figure supplement 2). Consistent with the previous data, the photoinhibition of layer 5
                                      cells expressing eNpHR3.0 receptors by illumination with 565 nm light could not retrieve the missing
                                      cortical responses, indicated by no recovery of the post-stimulus LFP signals from L3/4 compared to
                                      control (no light) (Figure 6K and L, Figure 6—source data 3, paired t-test: t(36) = 0.46, p=0.18,
                                      n = 37 trials from four animals), which suggests that the population OFF cortical responses were spe-
                                      cifically driven by MGB inhibition through corticothalamic layer 6-TRN pathway. To suppress feedfor-
                                      ward inhibition, the IC of neonatal GAD2-Cre mice was injected with halorhodopsin-AAV virus (see
                                      Materials and methods) to induce the expression of halorhodopsin specifically in the GABAergic cells
                                      of the IC in a Cre-dependent manner. As expected, GABAergic cells of the IC as well as their projec-
                                      tions to MGB expressed halorhodopsin indicated by the presence of YFP (Figure 6N). Photoinhibi-
                                      tion of GABAergic cells of the IC by illumination with 565 nm light was not able to retrieve the
                                      missing cortical responses as indicated by no recovery of the post-stimulus LFP signals recorded
                                      from L3/4 (Figure 6O and P, Figure 6—source data 4, Paired t-test: t(6) = 1.03, p=0.34, n = 7 tri-
                                      als from five animals). Accordingly, based on the data shown in Figure 6 and Figure 6—figure sup-
                                      plement 1, we conclude that the population OFF cortical responses were most likely driven by the
                                      feedback inhibition of MGB by corticothalamic layer 6 cells via TRN.

                                      Discussion
                                      We observed stochastic population cortical responses in the mouse AC following the presentations
                                      of pure tones in vivo or electrical stimulation of the IC in vitro. Population ON responses were associ-
                                      ated with synchronized responses among MGB cells, whereas population OFF responses were asso-
                                      ciated with TRN-mediated inhibition at the level of the MGB, under the control of layer 6
                                      corticothalamic projections. Other inhibitory projections to the MGB from the IC had no impact on
                                      the probability of eliciting a population ON response. It is unlikely that population OFF cortical
                                      responses were a sign of cortical adaptation, because adaptation responses are generally character-
                                      ized by gradual decrease of the response amplitude, rather than the all-or-none responses observed
                                      here (Chung et al., 2002; Abolafia et al., 2011). We conclude from these findings that layer 6 corti-
                                      cothalamic neurons gate population activity in the AC via their projections to TRN, which
                                      desynchronize MGB neurons. Previous work has suggested that corticothalamic axons, via the strong
                                      inhibition to thalamocortical cells by way of the TRN (Crandall et al., 2015; Olsen et al., 2012;
                                      Paz and Huguenard, 2015; Steriade et al., 1996; Guillery and Harting, 2003; McAlonan et al.,
                                      2008), control thalamocortical information flow (Destexhe, 2000; Yu et al., 2004). In the current
                                      study, the gating mechanism appears to involve TRN-based desynchronization of thalamocortical
                                      neurons rather than diminishing the overall thalamic response, which is consistent with previous find-
                                      ings showing that the TRN can desynchronize thalamocortical cells via multiple mechanisms (Pita-
                                      Almenar et al., 2014). This explanation is also consistent with our finding that direct electrical

Ibrahim et al. eLife 2021;10:e56645. DOI: https://doi.org/10.7554/eLife.56645                                                                       12 of 23
Research article Neuroscience
stimulation of the thalamus did not lead to stochastic AC response because direct electrical stimula-
tion is likely to elicit highly synchronous responses among MGB neurons. It is also possible that
silencing layer six corticothalamic neurons led to changes in likelihood of activating the AC via intra-
cortical connections of NTSR1-positive neurons. Future work involving selective silencing of cortico-
reticular terminals vs. corticocortical terminals will be needed to distinguish between these
possibilities. It will also be important to determine if the mechanisms observed in the current slice
data are also seen in adult animals. Juveniles were used to maximize slice connectivity, but now that
specific hypotheses may be proposed, elements of the proposed thalamocortical gating mechanisms
can be examined in adult preparations. We also note that population OFF cortical responses in the
current study were never initiated by the first stimulation of the IC. Rather they were always elicited
by the subsequent IC stimulation, which suggests that population OFF cortical responses occurred
only after evoked cortical activity that could change the internal dynamics of the cortical cells. More-
over, the strong association between the high probability of the OFF cortical responses and the low
level of stimulation suggests that cortico-reticulothalamic control of thalamocortical transmission is
most likely to be effective when signal-to-noise ratio is low. This finding is consistent with the notion
that top-down modulation is mostly required for the attentional modulation of weak signals and that
highly salient signals rely on bottom-up mechanisms to activate perceptual representations
(reviewed in Asilador and Llano, 2020). Classical models have viewed sensory processing stations,
including the thalamus and cortex, as a series of feedforward, hierarchically organized filters
whereby combinations of receptive fields produce increasingly selective feature detectors, culminat-
ing in uniquely selective neurons (Riesenhuber and Poggio, 1999; Vidyasagar and Eysel, 2015).
This type of organization implies that moment-to-moment perception is a reflection of detailed
streams of information coursing through ascending sensory systems, to be consciously perceived
when those streams engage highly selective cells in the cortex. An alternative view is that ascending
information is used to create and modify a bank of sensory representations that are recruited
depending on behavioral needs, and that conscious perception reflects activation of these pre-wired
circuits (Ringach, 2009; Llinás, 1994; Mishkin, 1982). Thus, conscious perception may involve the
release of stereotyped patterns of cortical activity. One potential role of thalamocortical transmission
in this model is to select cortical ensembles rather than impress sensory information upon them. Our
data suggest that at the thalamocortical level, sensory inputs activate stereotyped patterns of popu-
lation cortical activity. Future work in awake preparations will help to establish whether population
ON responses correspond to perception of sensory stimuli.
Critical for any such mechanism of control of cortical ensembles is a means by which those ensem-
bles are selected. The current data suggest that the TRN, under the control of layer 6 projections,
gates populations of thalamic neurons by desynchronizing their responses, decreasing the likelihood
of engendering a population cortical response. A mechanism of TRN-based modification of thalamic
synchrony to activate the cortex has been proposed previously (Saalmann and Kastner, 2011) and
is consistent with the finding that synchronized populations of thalamic neurons are required to opti-
mally activate the cortex (Bruno and Sakmann, 2006) and that the TRN is at the heart of a prefrontal
cortex-based mechanism to shape cortical activation under changing cognitive demands
(Zikopoulos and Barbas, 2006; Wimmer et al., 2015; Yingling and Skinner, 1975). Further, the
TRN receives inputs from basal forebrain, amygdala and non-reciprocally linked regions of the thala-
mus (Kimura et al., 2007; Lam and Sherman, 2005; Lam and Sherman, 2015; Crabtree et al.,
1998; Crabtree and Isaac, 2002; Lee et al., 2010b; Desı̂lets-Roy et al., 2002; Zikopoulos and Bar-
bas, 2012; Aizenberg et al., 2019), forming an assortment of inputs to potentially modulate TRN,
and ultimately select cortical circuits for activation. Given the putative role of the TRN in the selec-
tion of thalamic, and therefore cortical circuits during sensory perception, one would predict that
disruption of TRN activity could lead to uncontrolled release of patterns of cortical activity. Consis-
tent with this idea, ample evidence has accumulated to suggest that schizophrenia, a disease charac-
terized by the presence of auditory hallucinations, involves disruption of the TRN (Pratt and Morris,
2015; Ferrarelli and Tononi, 2011; Young and Wimmer, 2017; Bencherif et al., 2012; Light and
Braff, 1999; Patterson et al., 2008; Ferrarelli et al., 2007; Ferrarelli et al., 2010; Wamsley et al.,
2012; Ferrarelli and Tononi, 2017).
Ibrahim et al. eLife 2021;10:e56645. DOI: https://doi.org/10.7554/eLife.56645 13 of 23Research article Neuroscience
Conclusion
Here, we describe a unique stimulus-evoked population cortical all-or-none response, which sug-
gests that thalamus recruits cortical ensembles of pre-wired sensory representations upon external
stimulation in conjunction with internal cortical dynamics of corticothalamic neurons. These data also
suggest that corticothalamic modulators control the temporal coordination between the thalamic
cells to gate the activation of the intracortical network. It will be important in future studies to more
fully understand how other regulators of the TRN, such as the basal forebrain, prefrontal cortex and
amygdala, influence the selection of cortical circuits during active behavior.
Materials and methods
Animals
C57BL/6J (Jackson Laboratory, stock # 000664), C57BL/6J-Tg (Thy1-GCaMP6s) GP4.3Dkim/J a.k.a.
GCaMP6s mice (Jackson Laboratory, stock # 024275), BALB/c (Jackson Laboratory, stock # 000651),
Gad2-IRES-Cre (Jackson Laboratory, stock # 010802), NTSR1-Cre (MMRRC, 017266-UCD) and RBP4-
Cre (MMRRC, 031125-UCD). Mice of both sexes were used. All applicable guidelines for the care
and use of animals were followed. All surgical procedures were approved by the Institutional Animal
Care and Use Committee (IACUC). Animals were housed in animal care facilities approved by the
Association for Assessment and Accreditation of Laboratory Animal Care (AAALAC).
In vivo imaging
The detailed procedures have been described before (Yudintsev et al., 2020). In brief, adult
GCaMP6s mice were used for transcranial in vivo imaging of evoked calcium signals from the left
AC. For each experiment, the mouse was anesthetized with a mixture of ketamine and xylazine (100
mg/kg and 3 mg/kg, respectively) delivered intraperitoneally. The animal’s body temperature was
maintained within the range of 35.5˚C and 37˚C using a DC temperature controller (FHC, ME, USA).
Mid-sagittal and mid-lateral incisions were made to expose the dorsal and lateral aspects of the skull
along with the temporalis muscle. The temporalis muscle was separated from the skull to expose the
ventral parts of the underlying AC. The site was cleaned with sterile saline, and the surface of the
skull was thinned by a surgical drill. A small amount of dental cement (3M ESPE KETAC) was mixed
to a medium level of viscosity and added to the head of the bolt just enough to cover it. A head-
bolt was bonded to the top of the skull, and the dental cement was allowed to set. An Imager 3001
integrated data acquisition and analysis system (Optical Imaging Ltd., Israel) was used to image the
cortical responses to sound in mice. A macroscope consisting of 85 mm f/1.4 and 50 mm f/1.2 Nikon
lenses was mounted to an Adimec 1000 m high-end CCD camera (7.4 7.4 mm pixel size, 1004
1004 resolution), and centered above the left AC, focused approximately 0.5 mm below the surface
of the exposed skull. Acoustic stimuli were generated using a TDT system three with an RP 2.1
enhanced real-time processor and delivered via an ES1 free field electrostatic speaker (Tucker-Davis
Technologies, FL, USA), located approximately 8 cm away from the contralateral ear. All imaging
experiments were conducted in a sound-proof chamber and images were obtained at 10 frames per
second. Each trial of sound presentation was composed of two conditions (10 s each); Condition 0
(C0), where there is no sound and condition 1 (C1), where there is a 500 ms sound presentation that
comes after 5 s from the onset of the C1. For imaging, the blue light exposure was only on during
the 10 s of each trial, and there was a 5 s interval between the two conditions during which the blue
light was off. This intermittent schedule of the blue light exposure was done to lower the likelihood
of photobleaching. 500 ms pure tones of 5 kHz, at 37, 44, 50, 55, 60, 65, 70, 75, or 80 dB SPL were
used for acoustic stimulation. The response window was set as one second starting from the 5th sec-
ond for C0 or from the onset of sound for C1. The Df/f of the response window was computed as
the difference between Df/f0 (C0) and Df/f1 (C1) using a custom MATLAB code (Figure 1—source
code 1).
Virus injection
To modulate specific cell types, Cre recombinase-expressing mice were used to provide an expres-
sion of opto- or chemo-genetic probes in those specific cells 11 days after viral injection at P4. The
detailed procedures have been described before (Huynh et al., 2020). For all neonates,
Ibrahim et al. eLife 2021;10:e56645. DOI: https://doi.org/10.7554/eLife.56645 14 of 23Research article Neuroscience
cryoanesthesia was induced after five to ten minutes. A toe pinch was done to confirm that the mice
were fully anesthetized. A small animal stereotaxic instrument (David Kopf Instruments, Tujunga, CA)
was used with a universal syringe holder (David Kopf Instruments, Tujunga, CA) and standard ear
bars with rubber tips (Stoelting, Wood Dale, IL) were used to stabilize the head. The adaptor stage
was cooled by adding ethanol and dry ice to an attached well. A temperature label (RLC-60-26/56,
Omega, Norwalk, CT) was attached to the stage to provide the temperature of the stage during
cooling. The temperature was kept above 2˚C to prevent hypothermia or cold-induced skin damage
of the neonatal mice and below 8˚C to sustain cryoanesthesia. Glass micropipettes (3.5-inches, World
Precision Instruments, Sarasota, FL) were pulled using a micropipette puller (P-97, Sutter Instru-
ments, Novato, CA) and broken back to a tip diameter between 35 and 50 mm.
The micropipette was filled with mineral oil (Thermo Fisher Scientific Inc, Waltham, MA) and
attached to a pressure injector (Nanoliter 2010, World Precision Instruments, Sarasota, FL) con-
nected to a pump controller (Micro4 Controller, World Precision Instruments, Sarasota, FL). The AC
of NTSR1-Cre (Olsen et al., 2012; Bortone et al., 2014; Kim et al., 2014; Mease et al., 2014) or
RBP4-Cre (Jeong et al., 2016; Grant et al., 2016) neonates was injected with eNpHR3.0 AAV1
(AAV-EF1a-DIO-eNpHR3.0-YFP with titer equal to 4.7–5.7 1012, referred to hereafter as halorho-
dopsin-AAV) constructs from UNC Vector Core (Chapel Hill, NC), AAV1-Ef1a-DIO EYFP (control for
halorhodopsin), Gi-coupled hM4Di DREADDs AAV8 (AAV8-DIO-hSyn-hM4Di-mCherry, referred to
here as DREADDs-AAV), AAV8-hSyn-DIO-mCherry (control for DREADDs), or AAV9-FLEX-EGFP (for
the histology done on RBP4-Cre mouse) constructs from Addgene (Cambridge, MA). The micropi-
pette carrying the viral particles was first located above the AC in the left hemisphere at 1.5 mm
anterior to lambda and just at the edge of the skull’s flat horizon. The tip was lowered to 1.2 mm
from the brain surface and was then pulled back to 1.0 mm for the first injection where 200 nL of hal-
orhodopsin-AAV or DREADDs-AAV was injected at 200 nL/min. After the injection was finished, the
micropipette was left in the brain for 1 min before removing to allow the injectate to settle into the
brain. Following the first injection, the tip was pulled back stepwise in 0.1 mm increments, and 200
nL of the injectate was injected at every step until the tip reached 0.3 mm from the surface. In total,
1600 nL of AAV was injected into the AC. The incision was sutured using 5/0 thread size, nylon
sutures (CP Medical, Norcross, GA). To target the GABAergic cells of the inferior colliculus (IC), the
IC of GAD2-Cre (Taniguchi et al., 2011; Lammel et al., 2015; Villalobos et al., 2018) neonatal
mice was injected with halorhodopsin-AAV following the same procedures shown above, but the
micropipette loaded by halorhodopsin-AAV was located over the IC at the left hemisphere at 2.0
mm posterior to lambda and 1.0 mm laterally from the midline. The neonates were transferred back
onto a warming pad to recover. After 5–7 min, their skin color was returned to normal, and they
started moving. After recovery, all neonates were returned to their nest with the parents.
Brain slicing
For all in vitro experiments, 15- to 18-day-old mice were initially anesthetized with ketamine (100
mg/ kg) and xylazine (3 mg/kg) intraperitoneally and transcardially perfused with chilled (4˚C)
sucrose-based slicing solution containing the following (in mM): 234 sucrose, 11 glucose, 26
NaHCO3, 2.5 KCl, 1.25 NaH2PO4, 10 MgCl2, 0.5 CaCl2. After the brain was removed from the skull,
it was cut to obtain auditory colliculo-thalamocortical brain slice (aCTC) as shown (Figure 2—figure
supplement 1) and as described before (Llano et al., 2014; Slater et al., 2015). 600 mm thick hori-
zontal brain slices were obtained to retain the connectivity between IC, MGB, TRN and AC. All slices
were incubated for 30 min at 33˚C in a solution composed of (in mM: 26 NaHCO3, 2.5 KCl, 10 glu-
cose, 126 NaCl, 1.25 NaH2PO4, 3 MgCl2, and 1 CaCl2). After incubation, all slices were transferred
to a perfusion chamber coupled to an upright Olympus BX51 microscope, perfused with artificial
cerebrospinal fluid (ACSF) containing (in mM) 26 NaHCO3, 2.5 KCl, 10 glucose, 126 NaCl, 1.25
NaH2PO4, 2 MgCl2, and 2 CaCl2. Another set of experiments was done in a different laboratory to
exclude any experimental factors related to our laboratory environment, chemicals, or anesthesia. As
reported previously (Krause et al., 2014), following full anesthesia by isoflurane, a C57BL/6J mouse
was immediately decapitated without cardiac perfusion, the animal’s brain was extracted and
immersed in cutting artificial CSF [cACSF; composed of (in mM) 111 NaCl, 35 NaHCO3, 20 HEPES,
1.8 KCl, 1.05 CaCl2, 2.8 MgSO4, 1.2 KH2PO4, and 10 glucose] at 0–4˚C. Slices were maintained in
cACSF at 24˚C for >1 hr before transfer to the recording chamber, which was perfused at 3–6 ml/
min with ACSF [composed of (in mM) 111 NaCl, 35 NaHCO3, 20 HEPES, 1.8 KCl, 2.1 CaCl2, 1.4
Ibrahim et al. eLife 2021;10:e56645. DOI: https://doi.org/10.7554/eLife.56645 15 of 23Research article Neuroscience
MgSO4, 1.2 KH2PO4, and 10 glucose]. All of the solutions were bubbled with 95% oxygen/5% car-
bon dioxide and all experiments were done at room temperature.
Electrical stimulation
All the electrical stimulation protocols in the IC evoked similar cortical response patterns. One sec-
ond electrical train pulses of (250 mA, 40 Hz, 1 ms pulse width) to IC was the main stimulating proto-
col as described before (Ibrahim et al., 2017). However, one second durations of electrical
stimulation were not suitable for electrophysiology experiments because responses were inter-
mingled with the stimulus artifact. Therefore, for whole-cell and LFP recording, the stimulation of IC
was done with a single 3 ms pulse (300–500 mA) or 100 ms long trains of pulses (250 mA, 40 Hz, 1 ms
pulse width) were used. The electrical stimulation was done using a concentric bipolar electrode
(Cat#30201, FHC) every 10–20 s. The parameters of the electrical pulses were adjusted by a B and K
precision wave generator (model # 4063) and World Precision Instruments stimulation isolator (A-
360). In another stimulation set up (Our collaborator’s laboratory), a biphasic current pulse (200 mA,
5 ms; STG4002 stimulator, Multichannel Systems, Reutlingen, Germany) was delivered to IC at 0.05
Hz using bipolar tungsten electrodes (100 KW, FHC Inc, Bowdoin, ME).
Imaging
For calcium imaging in vitro, slices from GCaMP6s mice or wild-type mice loaded with CAL-520, AM
(Abcam, ab171868) calcium dye were used. For CAL-520, AM calcium dye loading, the aCTC slices
were incubated in 48 ml of DMSO dye solution +2 ml of Pluronic F-127 (Cat# P6866, Invitrogen) in 2.5
ml of the incubating solution at 35–36˚C for 25–28 min according to MacLean and Yuste, 2009;
Yuste et al., 2011. The slices then were incubated in normal incubating solution (shown above) for
30 min to wash the extra dye. Imaging was done under ACSF perfusion as described before.
Depending on the experiment, the evoked calcium or flavoprotein autofluorescence (FA) signals fol-
lowing IC stimulation (Ibrahim et al., 2017; Shibuki et al., 2003; Shibuki et al., 2009;
Husson et al., 2007) were measured using a stable DC fluorescence illuminator (Prior Lumen 200)
and a U-M49002Xl E-GFP Olympus filter cube set (excitation: 470–490 nm, dichroic 505 nm, emis-
sion 515 nm long pass, 100 ms exposure time for FA and 5 ms for calcium signals). All data were col-
lected using Retiga EXi camera at a frame rate of 4 Hz for FA and 10 Hz. The time trace of the FA or
calcium population signals were obtained by placing regions of interest (ROI) over brain regions (IC,
MGB, TRN or AC). The collected time traces were used to compute the Df/f. For the calcium signals
obtained from cortical or thalamic cells, the ROIs were manually made around the cell body. A
strong correlation between voltage and calcium signals validated the calcium signals obtained from
thalamic cells containing CAL-520 dye after simultaneous whole-cell recording and calcium imaging
following the injection of a positive current to the cell (Figure 5—figure supplement 1). The average
background value was calculated by drawing an ellipse with radii 2.25 times that of the original ROI
and subtracting all cell ROI from that ellipse to eliminate overlap. Finally, the Df/f was computed
after 40% of the background value was subtracted from the cell’s average value for neuropil correc-
tion. Df/f was computed using the average signal of a 2 s period before the stimulus onset. As illus-
trated in Figure 2—figure supplement 2, the ON-cortical responses were determined following two
criteria. Each signal required a rising and falling phase as well as a z-score greater than 3.
Pharmacological intervention
To inhibit GABAA receptors globally, GABAA-receptor antagonist (Yaron-Jakoubovitch et al.,
2013), gabazine (Cat# 1262, Tocris) was added to the bath ACSF solution 200 nM, which is near the
synaptic IC50 for this compound (Lindquist et al., 2005). To specifically inhibit the GABAA receptors
in either MGB or AC, a continuous flow of gabazine (400 nM) was injected into MGB or AC in a
counterbalanced manner through a glass pipette (broken tip, 35 mm) which was connected to a
picospritzer (Toohey Company, New Jersey, USA). The pipette was filled by a solution composed of
1 ml ACSF +10 mL Alexa Fluor 594 hydrazide, sodium salt dye (Cat#A10438, Invitrogen) to visualize
the flow of the solution and to ensure that it was restricted to the site of injection (Figure 4—figure
supplement 1). The injection was done under 10 psi pressure for 5 min and continuously during
imaging. As reported before, to block TRN activity (Sun et al., 2013; Lee et al., 2010a), the AMPA
receptor blocker NBQX (20 mM, Cat# 0373, Tocris) was injected into TRN of the aCTC slice following
Ibrahim et al. eLife 2021;10:e56645. DOI: https://doi.org/10.7554/eLife.56645 16 of 23You can also read