Vapor plumes in a tropical wet forest: spotting the invisible evaporation - HESS
←
→
Page content transcription
If your browser does not render page correctly, please read the page content below
Hydrol. Earth Syst. Sci., 25, 619–635, 2021
https://doi.org/10.5194/hess-25-619-2021
© Author(s) 2021. This work is distributed under
the Creative Commons Attribution 4.0 License.

Vapor plumes in a tropical wet forest:
spotting the invisible evaporation
César Dionisio Jiménez-Rodríguez1,2 , Miriam Coenders-Gerrits1 , Bart Schilperoort1 ,
Adriana del Pilar González-Angarita3 , and Hubert Savenije1
1 Water Resources Section, Delft University of Technology, Stevinweg 1, 2628 CN Delft, the Netherlands
2 Tecnológico de Costa Rica, Escuela de Ingeniería Forestal, 159-7050, Cartago, Costa Rica
3 independent researcher

Correspondence: César Dionisio Jiménez-Rodríguez (cdjimenezcr@gmail.com)

Received: 13 January 2020 – Discussion started: 23 January 2020
Revised: 19 December 2020 – Accepted: 22 December 2020 – Published: 11 February 2021

Abstract. Forest evaporation exports a vast amount of wa-         Savenije, 2004; Shuttleworth, 1993). Forest evaporation is
ter vapor from land ecosystems into the atmosphere. Mean-         considered of major importance as a regional and local cool-
while, evaporation during rain events is neglected or con-        ing system (Ellison et al., 2017) as a result of its capacity
sidered of minor importance in dense ecosystems. Air con-         to recycle the atmospheric moisture at different timescales
vection moves the water vapor upwards leading to the for-         (van der Ent and Savenije, 2011). The water vapor origi-
mation of large invisible vapor plumes, while the identifica-     nating from evaporation at the surface is horizontally trans-
tion of visible vapor plumes has not yet been studied. This       ported in the atmosphere by advection (Lavers et al., 2015;
work describes the formation process of vapor plumes in a         Strong et al., 2007), where forest presence at continental
tropical wet forest as evidence of evaporation processes hap-     scale induces the “biotic pump mechanism” that favors the
pening during rain events. In the dry season of 2018 at La        maintenance of similar precipitation amounts between in-
Selva Biological Station (LSBS) in Costa Rica it was pos-         land and coastal environments (Makarieva and Gorshkov,
sible to spot visible vapor plumes within the forest canopy.      2007; Makarieva et al., 2013a). Meanwhile, vertical transport
The combination of time-lapse videos at the canopy top with       is linked to wind shear (Chen et al., 2015) and convection
conventional meteorological measurements along the canopy         (Trzeciak et al., 2017) that, in large ecosystems, influence
profile allowed us to identify the driver conditions required     the formation of convective clouds at the top of the atmo-
for this process to happen. This phenomenon happened only         spheric boundary layer (Fuentes et al., 2016; Manoli et al.,
during rain events. Visible vapor plumes during the daytime       2016). This process plays an important role in the forma-
occurred when the following three conditions are accom-           tion of precipitation in tropical basins (Adams et al., 2011;
plished: presence of precipitation (P ), air convection, and a    van der Ent and Savenije, 2011) because of the contribution
lifting condensation level value smaller than 100 m at 43 m       of water vapor originating from local evaporation (Brubaker
height (zlcl.43 ).                                                et al., 1993).
                                                                     Evaporation is usually neglected or considered of minor
                                                                  importance during rain events in dense forest ecosystems
                                                                  (Klaassen et al., 1998). This is because during rainfall the
1   Introduction                                                  vapor pressure deficit is close to zero (Bosveld and Bouten,
                                                                  2003; Loescher et al., 2005; Mallick et al., 2016), reduc-
Forest cover in tropical regions is endangered by deforesta-      ing the atmospheric water demand and stopping the tran-
tion (Curtis et al., 2018; Rosa et al., 2016), compromising the   spiration process (Gotsch et al., 2014). However, the incre-
evaporation flux from land. Forest evaporation is a mixture       ment of evaporation with the size of rain events suggests that
of water vapor originating from water intercepted on plant        evaporation also occurs during the events and not only after-
surfaces, soil water, and plant transpiration (Roberts, 1999;

Published by Copernicus Publications on behalf of the European Geosciences Union.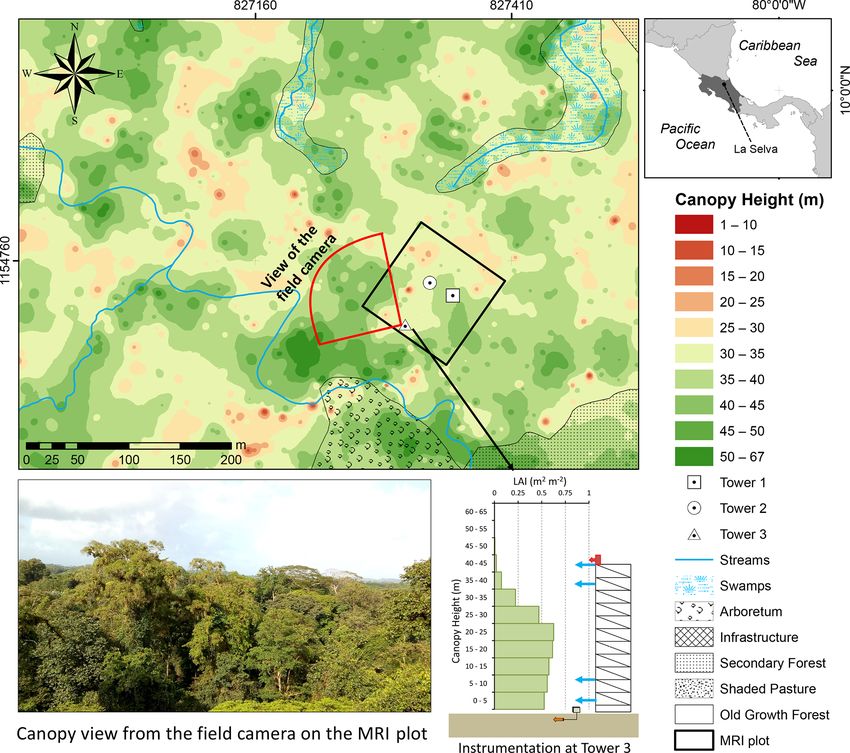
620                                                   C. D. Jiménez-Rodríguez et al.: Vapor plumes in a tropical wet forest

wards (Allen et al., 2020). This has been evidenced by dis-       to identify the meteorological conditions when visible vapor
crepancies found between modeled and measured evapora-            plumes are present in a tropical wet forest and it tries (3)
tion rates in tropical forests (Schellekens et al., 2000). When   to explain the processes involved in the formation of these
it rains, part of the precipitation is intercepted and evapo-     plumes. The data analysis is based on conventional meteo-
rated directly to the atmosphere (David et al., 2006) even        rological data vertically distributed along the forest canopy
when vapor pressure deficit and available radiation are low       layer and time-lapse videos during daytime conditions.
(Lankreijer et al., 1999). Under high-humidity conditions, a
portion of the precipitation can evaporate after a raindrop
splashes on the canopy or the forest floor. This process is       2     Methodology
known as “splash-droplet evaporation” (Dunin et al., 1988;
                                                                  2.1    Study site
Dunkerley, 2009; Murakami, 2006) and is based on the prin-
ciple that raindrop size increases with rain intensity. Con-      The monitoring was carried out at La Selva Biological
sequently, when larger drops hit the surface (e.g., ground,       Station (LSBS) on the Caribbean lowlands of Costa Rica
leaves, and branches), this allows the formation of smaller       (10◦ 260 0000 N, 83◦ 590 0000 W). This station registered a mean
rain droplets that can be easily evaporated after the splash.     annual precipitation of 4351 mm yr−1 , a mean annual tem-
This process has been identified as the main source of evapo-     perature of 26.3 ◦ C, and a mean daily temperature differ-
ration that explains the difference between intercepted water     ence of 9.5 ◦ C. A short dry season occurs at LSBS between
and measured evaporation in studies carried out in banana         February and April every year, and it is characterized by a
plants (Bassette and Bussière, 2008) and eucalyptus planta-       reduction in precipitation without the vegetation experienc-
tions (Dunin et al., 1988).                                       ing a soil water deficit (Sanford et al., 1994; Lieberman and
   Forest evaporation produces coherent structures of water       Lieberman, 1987; Loescher et al., 2005). LSBS is covered
vapor called plumes, cells, or rolls (Couvreux et al., 2010).     by a matrix of old-growth and secondary forests, small for-
Plumes of water vapor have been identified above forest           est plantations, and experimental permanent plots with mixed
ecosystems during the daytime with a high-resolution scan-        tree species (Fig. 1). All instrumentation was placed within
ning Raman lidar technique (Cooper et al., 2006; Kao et al.,      the area of 1.0 ha of the major research infrastructure plot
2000). These plumes reached heights above the canopy up to        (MRI plot), located within an old-growth forest on the upper
100 m, depicting their importance as water vapor providers        terrace of the Puerto Viejo river (Sanford et al., 1994). The
at local scale. This phenomenon has been studied in astro-        MRI plot is situated in the upper section of a small hill facing
physics (Berg et al., 2016; Sparks et al., 2019), vulcanol-       southwest towards an affluent of the Puerto Viejo river. The
ogy (Kern et al., 2017; Sioris et al., 2016), and regional and    soil is classified as Andic Humidotropept with a clay and or-
global meteorology (Herman et al., 2017; Knoche and Kun-          ganic matter content of 35 % and 23 %, respectively (Sollins
stmann, 2013; Wang, 2003; Wright et al., 2017). However,          et al., 1994). The tree density in 2017 was 371 trees ha−1 of
to the best of our knowledge, little attention has been paid      individuals with a tree diameter bigger than 10 cm. The palm
to the small events observed during rain events. Addition-        Welfia regia H. Wendl and the tree Pentaclethra macroloba
ally, Couvreux et al. (2010) highlighted the lack of sam-         (Willd.) Kuntze are the most abundant species with 56 and
pling techniques able to characterize the occurrence of these     43 trees ha−1 , respectively. The average leaf area index (LAI)
plumes close to the surface. Visible vapor plumes are classi-     in 2005 was 3.56 m2 m−2 (Tang et al., 2012). The plot is lo-
fied as ascending clouds formed by clusters of tiny particles     cated within a stable forest plot in terms of changes in canopy
of water in liquid form (Spellman, 2012). This characteris-       height and tree biomass fixation (Dubayah et al., 2010).
tic makes it difficult to measure them with sophisticated sys-
tems based on 3D wind components (e.g., eddy-covariance           2.2    Experimental design
systems) that are developed to measure water in gas form
(Foken et al., 2012a). These types of measurements are sen-       The monitoring was carried out on the MRI plot in the high-
sitive to rainy and high-humidity conditions (Camuffo, 2019;      est tower (43 m), which is located within a depression of the
Foken et al., 2012b; Kelton and Bricout, 1964; Moncrieff          forest canopy (Fig. 1). Along the vertical axis of the tower
et al., 2005; Mauder and Zeeman, 2018; Peters et al., 1998),      the air temperature (◦ C) and relative humidity (%) were mea-
making it difficult to use them to identify the occurrence of     sured with HOBO® smart sensors (part code: S-THB-M008).
visible vapor plumes in forested ecosystems. This mismatch        The sensors were located at 2, 8, and 43 m height, placed
between measurement systems and target phenomena under-           at a distance of 1.5 m from the tower, and protected with a
lines the need to identify the conditions under which visible     radiation shield (HOBO® part code: RS-3) of 10 cm diame-
vapor plumes are formed. This type of constraint requires an      ter. The use of radiation shields together with conventional
innovative data analysis approach, which is the focus of this     air temperature sensors allows for keeping a mean absolute
paper. This work aims (1) to test an innovative approach to       error during the daytime in warm tropical ecosystems be-
link visual information and conventional meteorological data      low 0.3 ◦ C (da Cunha, 2015; Terando et al., 2017). Also, the
describing a local hydrological phenomenon. It also aims (2)      shelter provided by the forest canopy for the measurements

Hydrol. Earth Syst. Sci., 25, 619–635, 2021                                           https://doi.org/10.5194/hess-25-619-2021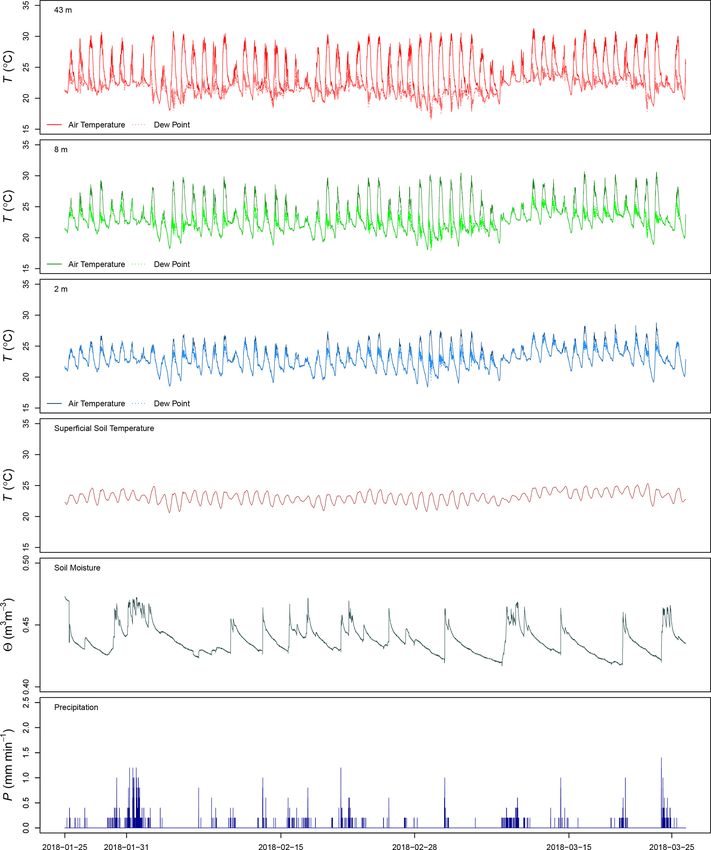
C. D. Jiménez-Rodríguez et al.: Vapor plumes in a tropical wet forest 621
carried out at 2 m helps one record similar temperatures to 2.4 Data analysis
the surrounding near-surface environment (Lundquist and
Huggett, 2008). The measurement of minimum air temper- Data processing and analysis was performed with the open-
atures or nighttime temperatures does not require the cover source software R (R Core Team, 2017). All temperatures
of the radiation shield to keep low biases (< 0.5 ◦ C) on the were converted from K to ◦ C. Superficial soil temperature
mean air temperature due to the reduced or total absence of (Ts.0 , ◦ C) was estimated with Eq. (1) (Holmes et al., 2008).
solar radiation (Terando et al., 2017). At the highest point of This equation describes the diurnal variations of soil temper-
the tower, the precipitation (mm min−1 ) was recorded with ature as sine waves depending on the 24 h moving averages
a Davis® rain gauge. Soil temperature (◦ C) was measured of soil temperature at 5 cm depth (Ts.5 , ◦ C). The daily ampli-
in two different locations at 5 and 15 cm depth with a soil tude of air temperature (TA , ◦ C) is defined as the difference
temperature sensor (HOBO® part code: TMC20-HD). Soil between Ts.5 and the air temperature at 2 m (T2 m ). The oscil-
moisture (2, m3 m−3 ) was measured at the same locations lations are determined by the damping depth (ν, m), which is
as soil temperature at 5 cm depth with an ECH2 O® EC sen- calculated with Eq. (2). The depth difference between the Ts.0
sor. Soil temperature was recorded with a four-channel data and Ts.5 is defined as zb (m). The sine pattern depends on the
logger (HOBO® part code: U12-008) and the other sensors angular frequency (ω, s−1 ), time (t) in s, and φ (–) as a con-
with a USB Micro Station (HOBO® part code: H21-USB). stant for phase change. Equation (3) is used to determine ω
Meteorological data collected along the tower, as well as soil with τ (s) as the wave period. Equation (2) calculates ν with
temperature data were recorded with averages of 1 and 5 min, the soil thermal diffusivity (η, m2 s−1 ) and ω. Equation (4)
respectively. All data were summarized in 5 min time inter- (Nakshabandi and Kohnke, 1965) is used to determine η,
vals for the analysis. A Bushnell® Natureview® Essential HD where ρs is the soil bulk density of 0.76 g cm−3 (Sollins et al.,
camera (12 megapixels) was installed at the top of the tower 1994) for the experimental plot, cs is the specific heat for clay
facing northwest. soils (837.36 W kg−1 ◦ C−1 ), and k is the soil thermal con-
ductivity of 1.58 W m−1 ◦ C−1 (Pielke, 2013). The last two
2.3 Monitoring period parameters were chosen according to the soil water condi-
tions during the monitoring period, which was close to soil
All environmental variables were monitored between 24 Jan- field capacity (see Appendix B).
uary 2018 and 26 March 2018. The camera was installed −zb zb
to collect photographs above the canopy between 21 and 25 Ts.0 = Ts.5 + TA e( ν ) sin(ωt − + φ) (1)
ν
March 2018. The photographs were set to be collected con- r
tinuously from 05:00 to 18:30 local time (UTC−6). How- 2η
ν= (2)
ever, the light conditions determined which images were se- ω
lected for analysis (see Appendix A). These pictures were 2π
ω= (3)
used to determine when the vapor plumes were visible at the τ
MRI plot. The photographs were classified into three condi- k
η= (4)
tions (Fig. 2): ρs c s
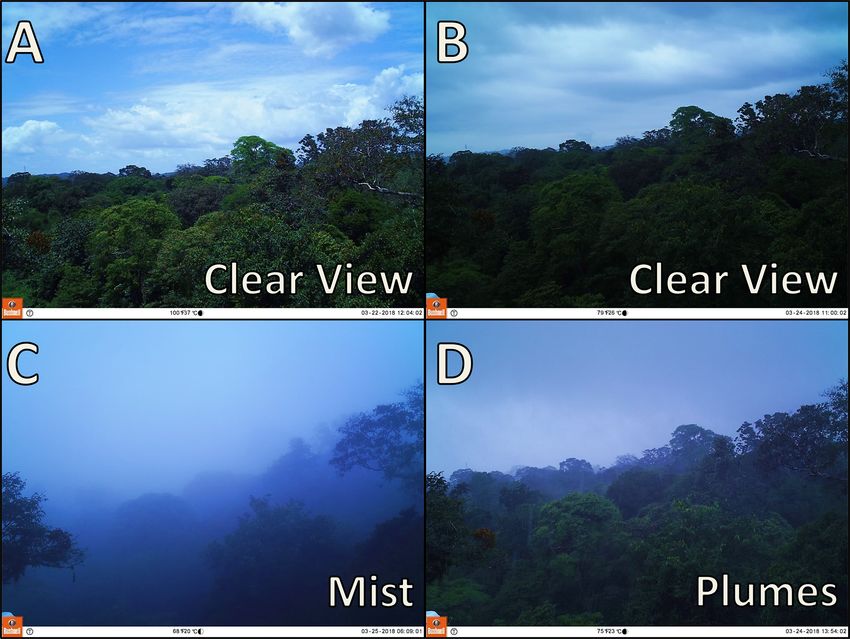
The virtual potential temperature (θv , ◦ C) of the air was
– Clear view includes all the pictures with clear and
calculated to take into account the variation in the adiabatic
cloudy sky where the canopy is clearly visible and there
lapse rate due to changes in pressure (Barr et al., 1994; Stull,
is neither mist nor plumes present (Fig. 2a and b).
1988, 2017). For saturated (cloudy) air conditions Eq. (5) cal-
– Mist and fog include the presence of a homogeneous culates the θv based on the water vapor mixing ratio (ψs ) of
blurry view of the canopy. The blurriness of each pic- the saturated air, the liquid water mixing ratio (ψL ), and the
ture varies depending on the humidity conditions. Spe- virtual temperature (θ ). The parameters ψs and ψL were de-
cial care was taken to prevent the erroneous classifica- termined with Eqs. (7) and (8), respectively. These equations
tion of photographs affected by a fogged-up lens. This require one to know the mass of the liquid water in the air
category is subsequently called “mist” (Fig. 2c). (mliq.air ), the mass of the water vapor in the air (mvap.air ),
and the mass of the dry air (mdry.air ). Due to the lack of in-
– Plumes include the presence of buoyant vapor clouds strumentation to estimate the mass of liquid water in the air,
rising from the forest canopy (Fig. 2d). These we used a fixed value of 0.05 g m−3 . This value corresponds
cloud bodies change their vertical position in con- to the liquid water content (LWC) in the air reported by
secutive frames. Rising vapor plumes can be ob- Thompson (2007) for continental fog events. The selection
served in the online video of 24 March 2018 avail- of this value was based on (1) the similarity between the va-
able at https://doi.org/10.4121/uuid:997cc9d8-2281- por plumes and fog and (2) the fact that both types of events
453e-b631-5f93cfebe00e (Jiménez-Rodríguez et al., occur close to the ground surface. The variables mvap.air and
2019b). mdry.air were determined using the saturation and actual va-
por pressures of the air (Stull, 2017). The virtual temperature
https://doi.org/10.5194/hess-25-619-2021 Hydrol. Earth Syst. Sci., 25, 619–635, 2021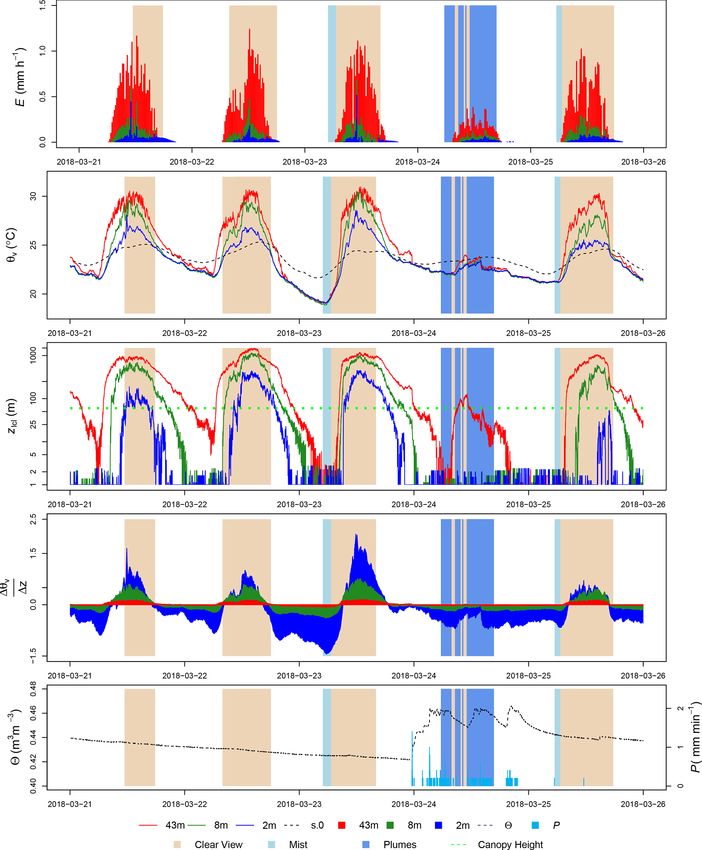
622                                                       C. D. Jiménez-Rodríguez et al.: Vapor plumes in a tropical wet forest

Figure 1. Canopy height and land cover map of the area surrounding the major research infrastructure plot (MRI plot) at La Selva Biological
Station, Costa Rica. The photograph shows the view from the field camera at the top of the tower.

was estimated with Eq. (6), where 0d is the dry adiabatic               and the dew point temperature lapse rate (0dew ) (Stull, 2017).
lapse rate near the surface (0.0098 ◦ C m−1 ), z is the height
above the ground in meters, and Tz is the air temperature at                     Tz − Tdew.z
                                                                        zlcl =                                                         (9)
the same heights.                                                                0d − 0dew

θv.z = θz (1 + 0.608 ψs − ψL )                                 (5)         An estimation of the evaporation during the monitored
                                                                        period was retrieved from Jiménez-Rodríguez et al. (2020).
θ z = T z + 0d z                                               (6)
                                                                        This data set is used only as a reference for the evaporation
       mvap.water
ψs =                                                           (7)      process during the monitoring period on the same site. This
         mdry.air                                                       is because this quantification has limitations accomplishing
       mliq.water                                                       the Monin–Obukhov similarity theory (MOST) for complex
ψL =                                                           (8)
         mdry.air                                                       terrains (Breedt et al., 2018). So, it is based only on the verti-
   Convection can be identified by evaluating the tempera-              cal transport of water vapor, neglecting the advected energy
ture gradient ( 1θ v                                                    of the forest canopy.
                  1z ) due to the absence of wind profile mea-
surements to determine the atmospheric stability parameter
along the tower. Values of 1θ    v
                              1z > 0 are linked to stable strat-        3   Results and discussion
                         1θv
ification; meanwhile, 1z < 0 shows an unstable stratifica-
tion (Stull, 2017), which will drive convection.                        The monitoring period experienced a diurnal variation in air
   The condensation of vapor close to the forest canopy can             temperature along the vertical profile of the canopy, with a
be identified by calculating the lifting condensation level             temperature difference of more than 10 ◦ C at 43 m and less
(zlcl ) in meters with Eq. (9). This equation determines the el-        than 7 ◦ C at 2 m height (Fig. 3). The highest temperatures
evation at which a parcel of air condensates allowing the for-          were registered at 43 m height reaching more than 30 ◦ C, de-
mation of clouds. This equation uses the difference between             creasing in magnitude towards the forest floor. These peak
air temperature (Tz ) and dew point temperature (Tdew.z ) at            temperatures were recorded around noon with differences up
one specific height (z), divided by the difference between 0d           to 5 ◦ C between the air temperatures at 43 and 2 m height.

Hydrol. Earth Syst. Sci., 25, 619–635, 2021                                                    https://doi.org/10.5194/hess-25-619-2021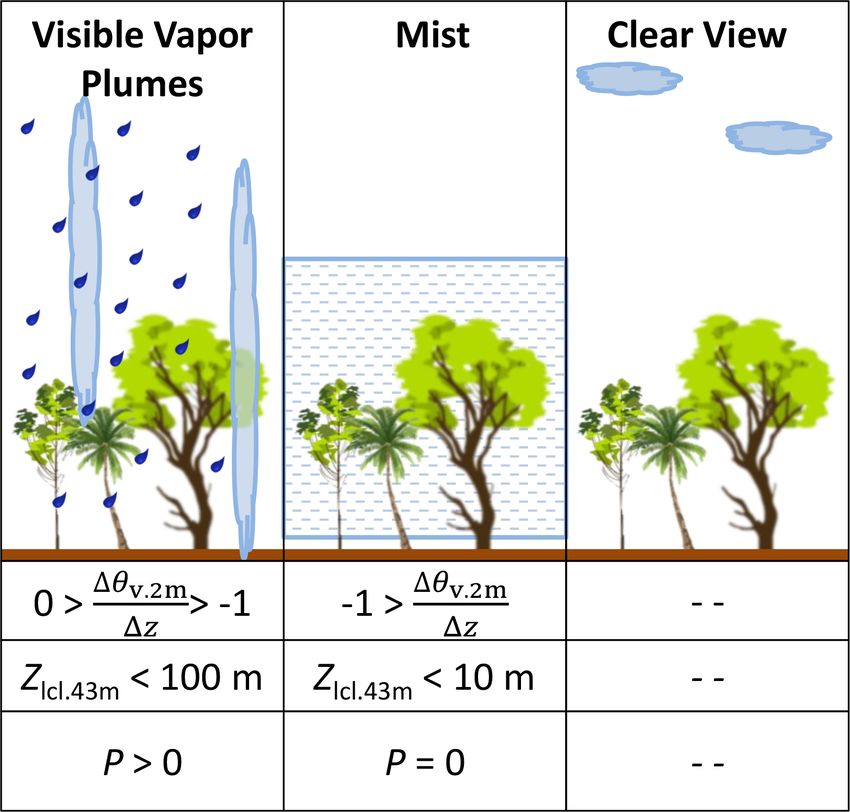
C. D. Jiménez-Rodríguez et al.: Vapor plumes in a tropical wet forest                                                                                    623

Figure 2. Visual monitoring showing the three conditions used to classify the canopy photographs on the time-lapse videos. The pictures
(a) and (b) show the clear view classification, with picture (a) on a sunny day and picture (b) during rain. Picture (c) describes the mist and
picture (d) shows the plumes rising from the forest canopy.

The Ts.0 oscillates between 20.7 and 25.4 ◦ C. The amplitude              Table 1. Daily summary of precipitation and evaporation at 43, 8,
of the oscillation increased with the sunniest days, but the              and 2 m height according to Jiménez-Rodríguez et al. (2020) for the
daily difference did not exceed 4 ◦ C. The maximum 2 value                experimental site during the monitoring period.
was 0.47 m3 m−3 during the heavy rains, almost reaching the
saturation point for clay soils of 0.50 m3 m−3 (Saxton and                     Date               Precipitation         Evaporation (mm d−1 )
Rawls, 2006). The minimum 2 was recorded after the driest                                            (mm d−1 )        0–43 m       0–8 m       0–2 m
period just before the rains on 24 March 2018 (0.42 m3 m−3 ),
getting close to soil field capacity for clay soils (Saxton and                2018-03-21                    0.0           6.0         1.5         0.7
Rawls, 2006). Evaporation always occurred during daytime                       2018-03-22                    0.0           5.4         1.1         0.4
                                                                               2018-03-23                    4.6           5.8         1.1         0.3
on all sampling days (Fig. 3). During the four sunny days,
                                                                               2018-03-24                   58.7           1.8         0.5         0.2
the evaporation was larger than 5 mm d−1 , with a contribu-
                                                                               2018-03-25                    0.0           5.3         1.2         0.5
tion of more than 1.0 mm d−1 from 8 m height and no more
than 0.7 mm d−1 from 2 m height (Jiménez-Rodríguez et al.,                   Note: all evaporation values correspond to the water vapor produced from the
                                                                             forest floor up to the specified height.
2020). In contrast, on 24 March 2018 the continuous rains
summed up to 58.7 mm d−1 and the evaporation was esti-
mated as 1.8 mm d−1 at 43 m and only 0.2 mm d−1 at 2 m                    clear view conditions in between the rains. Mist formation
height (Table 1).                                                         was identified on 23 and 25 March 2018 before 07:00. Mist
   During the visual monitoring with the field camera, clear              might have been formed early in the morning during the 21
view conditions were predominant along four days (Fig. 3).                and 22 March 2018 sampling dates. However, the time-lapse
These days were characterized by sunny conditions with tem-               video did not work at those times (Table A1). These mist
peratures above the 25 ◦ C, no large rain events, and a de-               events were linked with superficial soil temperatures higher
creasing trend in soil moisture. These days were character-               than 2 ◦ C with respect to air temperature. Finally, the va-
ized by cumulus clouds crossing the sky above the forest                  por plumes were visible only during rainy conditions on 24
canopy in the daytime. Any water vapor ascending from the                 March 2018 (videos available at Jiménez-Rodríguez et al.,
forest canopy needed to reach a height of more than 100 m                 2019b). Soil temperatures during this day were warmer than
to form visible vapor plumes (Fig. 3). Also, on 24 March                  the air column along the forest canopy (Fig. 3).
2018 it was possible to identify three short periods with

https://doi.org/10.5194/hess-25-619-2021                                                      Hydrol. Earth Syst. Sci., 25, 619–635, 2021
624 C. D. Jiménez-Rodríguez et al.: Vapor plumes in a tropical wet forest
Evaporation during sunny days provided the conditions of aerosols at LSBS. One source is linked to wind carrying
to form vapor plumes as those described by Cooper et al. aerosols from nearby agricultural land uses (Loescher et al.,
(2006) and Kao et al. (2000). The evaporation peaks dur- 2004). A second source is linked to convective rains that
ing these days occurred around noon, registering a zlcl higher characterize the dry season at LSBS. Additionally, the pres-
than 500 m (Fig. 3), which is the height required to form vis- ence of bioparticles cannot be discarded (e.g., airborne bacte-
ible clouds. This is the reason why is not possible to see the ria, fungi, pollen, and plant fragments) as a source of aerosols
vapor rising from the surface. The vapor plumes were visible from the forests (Huffman et al., 2013; Valsan et al., 2015).
on the day with continuous precipitation (24 March 2018). The high intensity rains may induce a bioparticles burst from
On this day, the zlcl dropped beneath 100 m because during the forest canopy. These bioparticles have been reported in
rain events the θv of all the air columns dropped quickly. This Australia (Bigg et al., 2015), India (Valsan et al., 2015),
drop kept the θv beneath the superficial soil temperature, al- Mexico (Rodriguez-Gomez et al., 2020), and the Amazon
lowing a localized convection event. This convection process (Pöschl et al., 2010). Also, convective rains transport a por-
forced the evaporated water to move upwards, forming buoy- tion of the required aerosols for the condensation process
ant clouds close to the forest surface. The evaporation during from the free troposphere into the boundary layer and later
rain events is the result of the splash-droplet evaporation pro- they form clouds (Wang et al., 2016). Meanwhile, the splash-
cess (Murakami, 2006; Dunkerley, 2009), which can provide droplet evaporation process (Murakami, 2006) provides the
water vapor as a consequence of the fragmentation of rain- main source of water vapor after raindrops hit the canopy and
drops when hitting the surface. soil surfaces. As plumes are not stagnant and continue mov-
Energy convection plays an important role in forest ing upwards thanks to air convection, the water vapor is re-
ecosystems during the nighttime (Bosveld et al., 1999). This moved from the understory towards higher altitudes. The wa-
is a consequence of the mass transport capacity of the in- ter condensation at the canopy level drastically reduced the
termittent nocturnal convective fluxes (Cooper et al., 2006). volume of water vapor due to the phase change (Makarieva
The convection process is forced by the ground heat flux et al., 2013b). This allowed the ambient air to remain unsatu-
(Jacobs et al., 1994), which is enhanced by the larger soil rated allowing the continuous provision of water vapor by the
moisture in clay soil, which increases the soil heat capac- splash-droplet evaporation process continuously more water
ity (Abu-Hamdeh, 2003). A coupled canopy system enables vapor.
sensible heat and water vapor transport from the soil to the at- Cloud formation usually happens high above the surface
mosphere just above the canopy layer (Göckede et al., 2007). boundary layer where the forest canopy is located, but the
This facilitates the generation of the convection process, al- available information of cloud formation close to the forest
lowing the ascending warm air to cool down at the canopy top canopy is scarce. The temperature gradient ( 1θ v
1z ) at 43, 8,
and condensate, forming the visible water vapor plumes. The and 2 m is negative during plumes and mist conditions, while
condensation releases heat (Goosse, 2015), driving the con- clear view conditions have a larger range with more positive
vection. Vapor plumes are always present as a consequence gradients. Lifting condensation level is a key element that
of the moisture exchange between the surface and the atmo- allowed us to differentiate between plumes and mist condi-
sphere (Lawford, 1996), where evaporation from land cover tions (see Appendix C). The combination of variables such as
with enough water supply provides the required air moisture zlcl , 1θv
1z , and P allows one to identify the formation of vapor
(Kao et al., 2000). However, the conditions needed to form a plumes in tropical wet forests (Fig. 4). The zlcl is the height
visible buoyant cloud close to the surface require a big differ- in the atmosphere at which a parcel of moist air becomes
ence in air temperature over height. The temperature gradient saturated if it experiences a forced ascent (Stull, 2017). It
at 43, 8, and 2 m is negative during plumes and mist condi- provides an estimate of the height at which the clouds can
tions; meanwhile clear view conditions have a larger range be formed. The temperature gradient is an indicator of how
with more positive values (see Appendix C). easily a parcel of air can be lifted (Spellman, 2012) and can
The visible vapor plumes can be spotted on the canopy be used as a proxy of the atmospheric stability. During un-
depressions surrounding the tower (Fig. 1). These depres- stable atmospheric conditions ( 1θ v
1z < 0) it is easier for the
sions are characterized by a low leaf area index and shorter air parcels to move upwards than under stable conditions
canopy height, which translates into areas with low poten- ( 1θ v
1z > 0). Finally, precipitation saturates the air column and
tial to produce transpiration during rain events. This implies provides the water vapor after the splash-droplet evaporation
that the main source of water vapor is linked to water evap- process on the canopy and forest floor surfaces.
orated from wet surfaces and soil evaporation, while tran- During the full monitoring period at LSBS, only 1.4 % of
spiration may contribute to a lesser extent. Visible vapor our study period accomplished the conditions required for
plumes are the result of the condensation of water vapor ris- the formation of visible vapor plumes (precipitation, zlcl <
ing from a warmer surface. When a column of warm humid 100 m, and 0 > 1θ v
1z > −1). These conditions differ from
air reaches the dew point temperature, the water vapor con- those needed to form mist. In a tropical wet forest in Costa
densates around aerosols in the air allowing the formation of Rica, fog and mist formation happens before sunrise (Allen
clouds (Stull, 2017). In this regard, there are different sources et al., 1972). However, fog does not involve the upward con-
Hydrol. Earth Syst. Sci., 25, 619–635, 2021 https://doi.org/10.5194/hess-25-619-2021C. D. Jiménez-Rodríguez et al.: Vapor plumes in a tropical wet forest 625
Figure 3. Virtual potential temperature (θv ), lifting condensation level (zlcl ) in an untransformed semilogarithmic scale, and temperature
gradient ( 1θv
1z ) at 43, 8 and 2 m height. Additionally, precipitation (P ) and soil moisture (2) are shown during the visual monitoring between
21 and 25 March 2018. Evaporation (E) measurements were retrieved from Jiménez-Rodríguez et al. (2020). Background-colored areas
denote the three categories in which the photographs were classified: clear view, mist, and plumes.
https://doi.org/10.5194/hess-25-619-2021 Hydrol. Earth Syst. Sci., 25, 619–635, 2021626 C. D. Jiménez-Rodríguez et al.: Vapor plumes in a tropical wet forest
et al., 2012a). This means that the localized nature of the vis-
ible vapor plumes makes measuring them very susceptible to
sensor placement, complicating its monitoring using eddy-
covariance systems located high above the canopy. Addition-
ally, measuring devices based on 3D wind components (e.g.,
eddy-covariance systems) are developed to measure water in
gas form (Foken et al., 2012a) and are not intended to mea-
sure visible vapor plumes that are ascending clusters of tiny
water particles (Spellman, 2012).
The description of the formation process of visible va-
por plumes provides a first step towards understanding this
phenomenon within forest hydrology. This description helps
identify when this phenomenon occurs, allowing one to
screen existing data sets in other tropical research sites to
analyze its frequency of occurrence. However, it is impor-
tant to test if the conditions required to form visible vapor
plumes are the same in other latitudes and ecosystems. Also,
new developments in air temperature monitoring techniques,
such as distributed temperature sensing (Euser et al., 2014;
Heusinkveld et al., 2020; Izett et al., 2019; Schilperoort et al.,
Figure 4. Simplification diagram describing the required conditions 2018) or thermal infrared imagery (Costa et al., 2019; Egea
to form visible vapor plumes in a tropical wet forest and the differ- et al., 2017; Lapidot et al., 2019; Nieto et al., 2019), may con-
ences between mist and clear view conditions.
tribute to accurately quantify the contribution of visible vapor
plumes as local recyclers of forest evaporation. These meth-
ods are suitable alternatives to eddy-covariance systems that
vective flux needed for vapor plumes, while mist is affected are sensitive to rainy conditions when visible vapor plumes
by this upward convective flux but without rain (Stull, 2017). occur.
Vapor plumes are buoyant cloud formations with an identifi- Understanding the formation process is a prerequisite be-
able shape (Spellman, 2012), which is the main characteristic fore the quantification of such a complex process. Further
that allows differentiation between fog and mist events. Mist studies aiming to analyze the occurrence of visible vapor
and fog are formed by microscopic water droplets floating in plumes in more detail will need to consider the conditions
the air, which can reduce the visibility to less than 1 km in that give origin to this phenomenon: air convection, precip-
the case of fog or a lesser extent with mist (Spellman, 2012). itation presence, and lifting condensation level at the top of
This paper described the formation of visible vapor plumes the canopy. While the quantification of its contribution to the
based on photographs as a visual indication of a process hydrological cycle have to overcome the limitations of cur-
that is usually invisible to the human eye. The occurrence rent measuring techniques. The identification of air convec-
of this phenomenon under rainy conditions makes it diffi- tion should be based on direct measurements of ground heat
cult to quantify its contribution to the forest evaporation with flux (e.g., soil heat flux plates), a more detailed air tempera-
current measuring techniques. Vapor plumes occurring dur- ture profile along the forest canopy (e.g., using distributed
ing rainy days compromise the performance of more sophis- temperature sensing), and multiple wind speed measure-
ticated instruments that are highly sensitive to rain or mist ments along the canopy profile (e.g., at least one per canopy
conditions (Centre for Atmospheric Science, 2020; Mauder layer plus one above the canopy). This set of measurements
and Zeeman, 2018). Instruments such as sonic anemometers will help identify air convection and advection within the
(e.g., CSAT3, CSAT3B) and open-path CO2 /H2 O analyzers canopy structure. The wind measurements should be carried
(e.g., LI-7500) are strongly affected by high humidity and pairing sonic and cup anemometers at the same locations, al-
rainfall (Campbell Scientific Inc., 2017, 2019; Foken et al., lowing one to overcome the limitations of sonic anemometers
2012a; LI-COR, 2016; Moncrieff et al., 2005). The presence during rain events (Mauder and Zeeman, 2018), when liquid
of rain causes departures from the measurements, increasing water covers the ultrasonic transducers.
the sonic speed (Camuffo, 2019; Kelton and Bricout, 1964; The evaporation contribution to the local hydrological cy-
Peters et al., 1998) or blocking the face of the transducers cle by visible vapor plumes requires a detailed quantification
(Campbell Scientific Inc., 2017), causing a frequency loss of the latent heat flux (ρλE) above and below the canopy.
during rain events (Zhang et al., 2016). The eddy-covariance The use of net radiometers at different heights (same loca-
technique is considered the standard measurement for de- tions as wind speed measurements) will complement the de-
termining atmospheric fluxes; however, it is dependent on tailed air temperature and wind speed measurements. It is im-
fully turbulent transport over a homogeneous surface (Foken portant to underline that some experimental sites worldwide
Hydrol. Earth Syst. Sci., 25, 619–635, 2021 https://doi.org/10.5194/hess-25-619-2021C. D. Jiménez-Rodríguez et al.: Vapor plumes in a tropical wet forest 627
accomplish the equipment requirements mentioned above 4 Conclusions
(FLUXNET, 2020), opening the opportunity to reanalyze
their data sets towards the identification of the conditions Visual monitoring captured the formation of visible vapor
needed for the formation of visible vapor plumes. Also, these plumes close to the surface boundary layer of a tropical
sites provide an opportunity to quantify the bias that eddy- wet forest during rainy conditions. These visible plumes are
covariance systems have due to the existence of this phe- the visual evidence of evaporation processes happening dur-
nomenon. Direct measurements of atmospheric water (gas ing rain events, where the splash-droplet evaporation pro-
and liquid phase) can be achieved with closed-path gas an- cess provides the required water vapor to form visible va-
alyzers (e.g., LI-7000DS-LI-COR, EC155-Campbell Sci., por plumes. This water vapor is part of the intercepted water
FMA-Los Gatos Research), allowing one to determine the to- evaporated from the forest floor and plant surfaces since tran-
tal water content in the air. These measurements will benefit spiration is likely reduced by the low vapor pressure deficit
from combining high-resolution infrared images from above but not stopped. It is raised by air convection, driven by
and below the canopy, allowing one to study the spatial dis- warm soil temperatures, finally condensing close to the forest
tribution of the phenomenon. These images will provide in- canopy due to the drop in the virtual potential air temperature
formation under day and night conditions, helping one to along the forest air column. Consequently, this phenomenon
identify the splash-droplet evaporation process at canopy and can be identified in tropical wet forest when precipitation oc-
ground level when the view field is focused towards specific curs, the lifting condensation level at 43 m height (zlcl ) is
locations of the forest canopy. Finally, further research can lower than 100 m, and the temperature gradient ( 1θ v
1z ) at 2 m
search for the detailed source of vapor with the implementa- height is between 0 and −1 ◦ C m−1 . Contrary to the vapor
tion of the direct measurement of water stable isotopes using plumes, mist appears when no precipitation occurs (P = 0),
mass spectrometers or cavity output spectroscopy. This type zlcl at 43 m is less than 10 m, and 1θv ◦
1z is less than −1 C m .
−1
of research can provide more insights into the effect of vapor This work also brings attention to the forest evaporation role
plumes on the microclimate of forest ecosystems. Moreover, during rain events, where little information is available. The
the occurrence of this phenomenon in other vegetation types exploratory nature of this work opened new research oppor-
may be addressed to understand the main drivers and the role tunities aiming to improve the setup to monitor this phe-
played in local hydrological systems. nomenon and provide a further accurate quantification of the
contribution within the local hydrology.
https://doi.org/10.5194/hess-25-619-2021 Hydrol. Earth Syst. Sci., 25, 619–635, 2021628 C. D. Jiménez-Rodríguez et al.: Vapor plumes in a tropical wet forest
Appendix A: Time-lapse videos detailed information
Table A1. Time windows with suitable images for analysis during the five sampling days surveyed with the camera.
Sampling date Time interval Initial time Final time
2018-03-21 5 min 11:27 17:45
2018-03-22 5 min 08:00 11:00
2018-03-22 1 min 11:00 18:00
2018-03-23 1 min 05:10 16:42
2018-03-24 1 min 05:30 16:42
2018-03-25 1 min 05:32 17:38
Note: the change of sampling intervals from 5 to 1 min was carried out on the
second day of video monitoring, with the aim of improving the quality of the
survey. The camera was set to take images from 05:00 to 18:30; the time
windows showed in the table correspond to the period with images suitable for
analysis.
Hydrol. Earth Syst. Sci., 25, 619–635, 2021 https://doi.org/10.5194/hess-25-619-2021C. D. Jiménez-Rodríguez et al.: Vapor plumes in a tropical wet forest 629 Appendix B: Daily variables measured at the MRI plot Figure B1. Detailed measurements performed at the MRI plot between 24 and 26 March 2018 along the canopy and within the soil. https://doi.org/10.5194/hess-25-619-2021 Hydrol. Earth Syst. Sci., 25, 619–635, 2021
630                                                           C. D. Jiménez-Rodríguez et al.: Vapor plumes in a tropical wet forest

Appendix C: Boxplots

Figure C1. Boxplots describing the temperature gradients ( 1θ    v
                                                               1z ) and lifting condensation level (zlcl ) at 43, 8, and 2 m, as well as soil moisture
(2) and total precipitation (P ) of the three visual categories evaluated.

Hydrol. Earth Syst. Sci., 25, 619–635, 2021                                                       https://doi.org/10.5194/hess-25-619-2021
C. D. Jiménez-Rodríguez et al.: Vapor plumes in a tropical wet forest 631
Code availability. The R script used for the data anal- Adams, D. K., Fernandes, R. M. S., Kursinski, E. R., Maia, J. M.,
ysis is available online in the 4TU data repository at Sapucci, L. F., Machado, L. A. T., Vitorello, I., Monico, J.
https://doi.org/10.4121/13720795 (Jiménez-Rodríguez et al., F. G., Holub, K. L., Gutman, S. I., Filizola, N., and Bennett,
2021). R. A.: A dense GNSS meteorological network for observing
deep convection in the Amazon, Atmos. Sci. Lett., 12, 207–212,
https://doi.org/10.1002/asl.312, 2011.
Data availability. Time-lapse videos are available online in the Allen, L. H., Lemon, E., and Müller, L.: Environ-
4TU data repository at https://doi.org/10.4121/uuid:997cc9d8- ment of a Costa Rican Forest, Ecology, 53, 102–111,
2281-453e-b631-5f93cfebe00e (Jiménez-Rodríguez et al., 2019b). https://doi.org/10.2307/1935714, 1972.
Meteorological data used in this manuscript are available online Allen, S. T., Aubrey, D. P., Bader, M. Y., Coenders-Gerrits, M.,
in the 4TU data repository (https://doi.org/10.4121/uuid:e70993d2- Friesen, J., Gutmann, E. D., Guillemette, F., Jiménez-Rodríguez,
5852-4f63-9aff-39451fbd3fde; Jiménez-Rodríguez et al., 2019a). C., Keim, R. F., Klamerus-Iwan, A., Mendieta-Leiva, G., Porada,
P., Qualls, R. G., Schilperoort, B., Stubbins, A., and Van Stan II,
J. T.: Key Questions on the Evaporation and Transport of Inter-
Author contributions. The project conceptualization and funding cepted Precipitation, 269–280, Springer International Publishing,
acquisition was carried out by CDJR and MCG. The investigation Cham, https://doi.org/10.1007/978-3-030-29702-2_16, 2020.
and data curation was carried out by AdPGA and CDJR. Data anal- Barr, A. G., King, K. M., Gillespie, T. J., Den Hartog, G.,
ysis was performed by BS and CDJR. Finally, the project admin- and Neumann, H. H.: A comparison of bowen ratio and
istration, writing of the original manuscript, and data visualization eddy correlation sensible and latent heat flux measurements
was carried out by CDJR with input from all coauthors. above deciduous forest, Bound.-Lay. Meteorol., 71, 21–41,
https://doi.org/10.1007/BF00709218, 1994.
Bassette, C. and Bussière, F.: Partitioning of splash
and storage during raindrop impacts on banana
Competing interests. The authors declare that they have no conflict
leaves, Agr. Forest Meteorol., 148, 991–1004,
of interest.
https://doi.org/10.1016/j.agrformet.2008.01.016, 2008.
Berg, J., Goldstein, D., Varghese, P., and Trafton, L.: DSMC sim-
ulation of Europa water vapor plumes, Icarus, 277, 370–380,
Acknowledgements. This work was carried out with a fellowship https://doi.org/10.1016/j.icarus.2016.05.030, 2016.
from the Organization for Tropical Studies (Glaxo Centroamerica Bigg, E. K., Soubeyrand, S., and Morris, C. E.: Persistent after-
Fellowship–Fund 502), with the aid of a scholarship from PINN- effects of heavy rain on concentrations of ice nuclei and rainfall
MICITT Costa Rica (contract: PED-032-2015-1), and the aid of suggest a biological cause, Atmos. Chem. Phys., 15, 2313–2326,
grant 863.15.022 from The Netherlands Organization for Scien- https://doi.org/10.5194/acp-15-2313-2015, 2015.
tific Research (NWO). Also, NASA’s funding NNX12AN43H and Bosveld, F. C. and Bouten, W.: Evaluating a Model of Evap-
80NSSC18K0708 provided the Leaf Area Index data sets. Special oration and Transpiration with Observations in a Partially
thanks to Bernal Matarrita, Orlando Vargas, Wagner López, Danilo Wet Douglas-Fir Forest, Bound.-Lay. Meteorol., 108, 365–396,
Brenes, Diego Dierick, Enrique Castro, and Marisol Luna for their https://doi.org/10.1023/A:1024148707239, 2003.
help and advice at the research station, to all the staff of the OTS for Bosveld, F. C., Holtslag, A. M., and Van Den Hurk, B. J.:
their willingness to support our project, and to Shigeki Murakami Nighttime convection in the interior of a dense Dou-
and one anonymous reviewer who helped to improve the paper. glas fir forest, Bound.-Lay. Meteorol., 93, 171–195,
https://doi.org/10.1023/A:1002039610790, 1999.
Breedt, H. J., Craig, K. J., and Jothiprakasam, V. D.: Monin-
Financial support. This research was supported by the Organi- Obukhov similarity theory and its application to wind flow mod-
zation for Tropical Studies (Glaxo Centroamerica Fellowship– elling over complex terrain, J. Wind Eng. Indust. Aerodynam.,
Fund 502 grant), the PINN-MICITT Costa Rica (grant no. PED- 182, 308–321, https://doi.org/10.1016/j.jweia.2018.09.026,
032-2015-1), The Netherlands Organization for Scientific Re- 2018.
search (NWO) (grant no. 863.15.022), and NASA (grant nos. Brubaker, K. L., Entekhabi, D., and Eagleson, P. S.: Es-
NNX12AN43H and 80NSSC18K0708). timation of Continental Precipitation Recycling, J.
Climate, 6, 1077–1089, https://doi.org/10.1175/1520-
0442(1993)0062.0.CO;2, 1993.
Review statement. This paper was edited by Laurent Pfister and re- Campbell Scientific Inc.: CSAT3 Three Dimensional Sonic
viewed by Shigeki Murakami and one anonymous referee. Anemometer Revision: 4/17, available at: https://s.campbellsci.
com/documents/us/manuals/csat3.pdf (last access: 29 June
2020), 2017.
Campbell Scientific Inc.: CSAT3B Three-Dimensional Sonic
Anemometer, available at: https://s.campbellsci.com/documents/
References us/manuals/csat3b.pdf (last access: 29 June 2020), 2019.
Camuffo, D.: Chapter 20 – Measuring Wind and Indoor Air Mo-
Abu-Hamdeh, N. H.: Thermal Properties of Soils as affected tions, in: Microclimate for Cultural Heritage (Third Edition),
by Density and Water Content, Biosyst. Eng., 86, 97–102,
https://doi.org/10.1016/S1537-5110(03)00112-0, 2003.
https://doi.org/10.5194/hess-25-619-2021 Hydrol. Earth Syst. Sci., 25, 619–635, 2021632 C. D. Jiménez-Rodríguez et al.: Vapor plumes in a tropical wet forest edited by: Camuffo, D., 483–511, Elsevier, third edition edn., and Sullivan, C. A.: Trees, forests and water: Cool in- https://doi.org/10.1016/B978-0-444-64106-9.00020-1, 2019. sights for a hot world, Global Environ. Change, 43, 51–61, Centre for Atmospheric Science: Sonic Anemometers, avail- https://doi.org/10.1016/j.gloenvcha.2017.01.002, 2017. able at: http://www.cas.manchester.ac.uk/restools/instruments/ Euser, T., Luxemburg, W. M. J., Everson, C. S., Mengistu, M. G., meteorology/sonic/ (last access: 29 June 2020), Department of Clulow, A. D., and Bastiaanssen, W. G. M.: A new method to Earth and Environmental Sciences. The University of Manch- measure Bowen ratios using high-resolution vertical dry and wet ester, 2020. bulb temperature profiles, Hydrol. Earth Syst. Sci., 18, 2021– Chen, Q., Fan, J., Hagos, S., Gustafson Jr., W. I., and Berg, L. K.: 2032, https://doi.org/10.5194/hess-18-2021-2014, 2014. Roles of wind shear at different vertical levels: Cloud system or- FLUXNET: Fluxdata, The Data Portal serving the FLUXNET com- ganization and properties, J. Geophys. Res.-Atmos., 120, 6551– munity, available at: https://fluxnet.fluxdata.org/ (last access: 5 6574, https://doi.org/10.1002/2015JD023253, 2015. April 2020), 2020. Cooper, D., Leclerc, M., Archuleta, J., Coulter, R., Eichinger, W., Foken, T., Aubinet, M., and Leuning, R.: The Eddy Covari- Kao, C., and Nappo, C.: Mass exchange in the stable boundary ance Method, pp. 1–19, Springer Netherlands, Dordrecht, layer by coherent structures, Agr. Forest Meteorol., 136, 114– https://doi.org/10.1007/978-94-007-2351-1_1, 2012a. 131, https://doi.org/10.1016/j.agrformet.2004.12.012, 2006. Foken, T., Leuning, R., Oncley, S. R., Mauder, M., and Aubi- Costa, J., Egipto, R., Sánchez-Virosta, A., Lopes, C., and Chaves, net, M.: Corrections and Data Quality Control, pp. 85–131, M.: Canopy and soil thermal patterns to support water and heat Springer Netherlands, Dordrecht, https://doi.org/10.1007/978- stress management in vineyards, Agr. Water Manag., 216, 484– 94-007-2351-1_4, 2012b. 496, https://doi.org/10.1016/j.agwat.2018.06.001, 2019. Fuentes, J. D., Chamecki, M., Nascimento dos Santos, R. M., Couvreux, F., Hourdin, F., and Rio, C.: Resolved Ver- Von Randow, C., Stoy, P. C., Katul, G., Fitzjarrald, D., Manzi, A., sus Parametrized Boundary-Layer Plumes. Part I: A Gerken, T., Trowbridge, A., Souza Freire, L., Ruiz-Plancarte, J., Parametrization-Oriented Conditional Sampling in Large- Furtunato Maia, J. M., Tóta, J., Dias, N., Fisch, G., Schumacher, Eddy Simulations, Bound.-Lay. Meteorol., 134, 441–458, C., Acevedo, O., Rezende Mercer, J., and Yañez-Serrano, A. M.: https://doi.org/10.1007/s10546-009-9456-5, 2010. Linking Meteorology, Turbulence, and Air Chemistry in the Curtis, P. G., Slay, C. M., Harris, N. L., Tyukavina, A., and Hansen, Amazon Rain Forest, B. Am. Meteorol. Soc., 97, 2329–2342, M. C.: Classifying drivers of global forest loss, Science, 361, https://doi.org/10.1175/BAMS-D-15-00152.1, 2016. 1108–1111, https://doi.org/10.1126/science.aau3445, 2018. Göckede, M., Thomas, C., Markkanen, T., Mauder, M., Rup- da Cunha, A. R.: Evaluation of measurement errors of tempera- pert, J., and Foken, T.: Sensitivity of Lagrangian Stochas- ture and relative humidity from HOBO data logger under dif- tic footprints to turbulence statistics, Tellus B, 59, 577–586, ferent conditions of exposure to solar radiation, Environ. Monit. https://doi.org/10.1111/j.1600-0889.2007.00275.x, 2007. Assess., 187, 236, https://doi.org/10.1007/s10661-015-4458-x, Goosse, H.: The energy balance, hydrological and carbon cycles, in: 2015. Climate System Dynamics and Modelling, chap. 2, Cambridge David, J. S., Valente, F., and Gash, J. H.: Evaporation University Press, 2015. of Intercepted Rainfall, in: Encyclopedia of Hydro- Gotsch, S. G., Asbjornsen, H., Holwerda, F., Goldsmith, G. R., logical Sciences, chap. 43, American Cancer Society, Weintraub, A. E., and Dawson, T. E.: Foggy days and dry https://doi.org/10.1002/0470848944.hsa046, 2006. nights determine crown-level water balance in a seasonal trop- Dubayah, R. O., Sheldon, S. L., Clark, D. B., Hofton, M. A., Blair, ical montane cloud forest, Plant Cell Environ., 37, 261–272, J. B., Hurtt, G. C., and Chazdon, R. L.: Estimation of tropical https://doi.org/10.1111/pce.12151, 2014. forest height and biomass dynamics using lidar remote sensing at Herman, R. L., Ray, E. A., Rosenlof, K. H., Bedka, K. M., Schwartz, La Selva, Costa Rica, J. Geophys. Res.-Biogeosc., 115, G00E09, M. J., Read, W. G., Troy, R. F., Chin, K., Christensen, L. E., https://doi.org/10.1029/2009JG000933, 2010. Fu, D., Stachnik, R. A., Bui, T. P., and Dean-Day, J. M.: En- Dunin, F. X., O’Loughlin, E. M., and Reyenga, W.: Interception hanced stratospheric water vapor over the summertime continen- loss from eucalypt forest: Lysimeter determination of hourly tal United States and the role of overshooting convection, At- rates for long term evaluation, Hydrol. Process., 2, 315–329, mos. Chem. Phys., 17, 6113–6124, https://doi.org/10.5194/acp- https://doi.org/10.1002/hyp.3360020403, 1988. 17-6113-2017, 2017. Dunkerley, D. L.: Evaporation of impact water droplets in in- Heusinkveld, V. W., Antoon van Hooft, J., Schilperoort, B., Baas, terception processes: Historical precedence of the hypothe- P., claire ten Veldhuis, M., and van de Wiel, B. J.: Towards sis and a brief literature overview, J. Hydrol., 376, 599–604, a physics-based understanding of fruit frost protection us- https://doi.org/10.1016/j.jhydrol.2009.08.004, 2009. ing wind machines, Agr. Forest Meteorol., 282–283, 107868, Egea, G., Padilla-Díaz, C. M., Martinez-Guanter, J., Fernández, https://doi.org/10.1016/j.agrformet.2019.107868, 2020. J. E., and Pérez-Ruiz, M.: Assessing a crop water stress index Holmes, T. R. H., Owe, M., De Jeu, R. A. M., and Kooi, H.: Esti- derived from aerial thermal imaging and infrared thermometry mating the soil temperature profile from a single depth observa- in super-high density olive orchards, Agr. Water Manag., 187, tion: A simple empirical heatflow solution, Water Resour. Res., 210–221, https://doi.org/10.1016/j.agwat.2017.03.030, 2017. 44, 1–11, https://doi.org/10.1029/2007WR005994, 2008. Ellison, D., Morris, C. E., Locatelli, B., Sheil, D., Cohen, J., Huffman, J. A., Prenni, A. J., DeMott, P. J., Pöhlker, C., Ma- Murdiyarso, D., Gutierrez, V., van Noordwijk, M., Creed, son, R. H., Robinson, N. H., Fröhlich-Nowoisky, J., Tobo, Y., I. F., Pokorny, J., Gaveau, D., Spracklen, D. V., Tobella, Després, V. R., Garcia, E., Gochis, D. J., Harris, E., Müller- A. B., Ilstedt, U., Teuling, A. J., Gebrehiwot, S. G., Sands, Germann, I., Ruzene, C., Schmer, B., Sinha, B., Day, D. A., An- D. C., Muys, B., Verbist, B., Springgay, E., Sugandi, Y., dreae, M. O., Jimenez, J. L., Gallagher, M., Kreidenweis, S. M., Hydrol. Earth Syst. Sci., 25, 619–635, 2021 https://doi.org/10.5194/hess-25-619-2021
C. D. Jiménez-Rodríguez et al.: Vapor plumes in a tropical wet forest                                                                    633

   Bertram, A. K., and Pöschl, U.: High concentrations of biolog-         cooling in coniferous and broadleaved tree species of the
   ical aerosol particles and ice nuclei during and after rain, At-       Mediterranean maquis, Agr. Forest Meteorol., 271, 285–294,
   mos. Chem. Phys., 13, 6151–6164, https://doi.org/10.5194/acp-          https://doi.org/10.1016/j.agrformet.2019.02.014, 2019.
   13-6151-2013, 2013.                                                 Lavers, D. A., Ralph, F. M., Waliser, D. E., Gershunov, A., and Det-
Izett, J. G., Schilperoort, B., Coenders-Gerrits, M., Baas, P.,           tinger, M. D.: Climate change intensification of horizontal water
   Bosveld, F. C., and van de Wiel, B. J. H.: Missed Fog?, Bound.-        vapor transport in CMIP5, Geophys. Res. Lett., 42, 5617–5625,
   Lay. Meteorol., 173, 289–309, https://doi.org/10.1007/s10546-          https://doi.org/10.1002/2015GL064672, 2015.
   019-00462-3, 2019.                                                  Lawford, R.: Some scientific questions and issues for the GEWEX
Jacobs, A. F. G., Van Boxel, J. H., and El-Kilani, R.                     Continental-scale International Project (GCIP) research commu-
   M. M.: Nighttime free convection characteristics within                nity, in: Proceedings of the Second International Science Confer-
   a plant canopy, Bound.-Lay. Meteorol., 71, 375–391,                    ence on Global Energy and Water Cycle, 17–21 June, Washing-
   https://doi.org/10.1007/BF00712176, 1994.                              ton, DC., pp. 162–167, 1996.
Jiménez-Rodríguez, C. D., González-Angarita, A. P., Coenders-          LI-COR: LI-7500RS, Open Path CO2 /H2 O Gas Analyzer, available
   Gerrits, A., Savenije, H., and Wenninger, J.: Meteorologi-             at:      https://www.licor.com/documents/c7tyf0czqn9ezkq1ki3b
   cal data and isotope signatures of water samples collected             (last access: 29 June 2020), 2016.
   at La Selva, https://doi.org/10.4121/uuid:e70993d2-5852-4f63-       Lieberman, D. and Lieberman, M.: Forest tree growth and dynamics
   9aff-39451fbd3fde, 2019a.                                              at La Selva, Costa Rica (1969–1982), J. Trop. Ecol., 3, 347–358,
Jiménez-Rodríguez, C. D., González-Angarita, A. P., and Coenders-         https://doi.org/10.1017/S0266467400002327, 1987.
   Gerrits, A. M. J.: Vapor Plumes Video at La Selva Biological Sta-   Loescher, H., Gholz, H., Jacobs, J., and Oberbauer, S.: En-
   tion. 4TU.Centre for Research Data, Dataset, 4TU.Centre for Re-        ergy dynamics and modeled evapotranspiration from a wet
   search Data, https://doi.org/10.4121/uuid:997cc9d8-2281-453e-          tropical forest in Costa Rica, J. Hydrol., 315, 274–294,
   b631-5f93cfebe00e, 2019b.                                              https://doi.org/10.1016/j.jhydrol.2005.03.040, 2005.
Jiménez-Rodríguez, C. D., Coenders-Gerrits, M., Wenninger,             Loescher, H. W., Bentz, J. A., Oberbauer, S. F., Ghosh, T. K.,
   J., Gonzalez-Angarita, A., and Savenije, H.: Contribution              Tompson, R. V., and Loyalka, S. K.: Characterization and
   of understory evaporation in a tropical wet forest during              dry deposition of carbonaceous aerosols in a wet tropi-
   the dry season, Hydrol. Earth Syst. Sci., 24, 2179–2206,               cal forest canopy, J. Geophys. Res.-Atmos., 109, D02309,
   https://doi.org/10.5194/hess-24-2179-2020, 2020.                       https://doi.org/10.1029/2002JD003353, 2004.
Jiménez-Rodríguez, C., Coenders, M., Schilperoort, B., Gonzalez-       Lundquist, J. D. and Huggett, B.: Evergreen trees as inexpensive
   Angarita, A. P. (Adriana del Pilar): Visible vapor plumes in           radiation shields for temperature sensors, Water Resour. Res., 44,
   a tropical wet forest: R script, 4TU.ResearchData, Software,           W00D04, https://doi.org/10.1029/2008WR006979, 2008.
   https://doi.org/10.4121/13720795, 2021.                             Makarieva, A. M. and Gorshkov, V. G.: Biotic pump of atmospheric
Kao, C.-Y., Hang, Y.-H., Cooper, D., Eichinger, W., Smith,                moisture as driver of the hydrological cycle on land, Hydrol.
   W., and Reisner, J.: High-resolution modeling of LIDAR                 Earth Syst. Sci., 11, 1013–1033, https://doi.org/10.5194/hess-11-
   data: Mechanisms governing surface water vapor variabil-               1013-2007, 2007.
   ity during SALSA, Agr. Forest Meteorol., 105, 185–194,              Makarieva, A. M., Gorshkov, V. G., and Li, B.-L.: Re-
   https://doi.org/10.1016/S0168-1923(00)00182-9, 2000.                   visiting forest impact on atmospheric water vapor trans-
Kelton, G. and Bricout, P.: wind velocity measurements us-                port and precipitation, Theor. Appl. Climatol., 111, 79–96,
   ing sonic techniques1, B. Am. Meteorol. Soc., 45, 571–580,             https://doi.org/10.1007/s00704-012-0643-9, 2013a.
   https://doi.org/10.1175/1520-0477-45.9.571, 1964.                   Makarieva, A. M., Gorshkov, V. G., Sheil, D., Nobre, A. D.,
Kern, C., Masias, P., Apaza, F., Reath, K. A., and Platt, U.: Re-         and Li, B.-L.: Where do winds come from? A new the-
   mote measurement of high preeruptive water vapor emissions             ory on how water vapor condensation influences atmospheric
   at Sabancaya volcano by passive differential optical absorp-           pressure and dynamics, Atmos. Chem. Phys., 13, 1039–1056,
   tion spectroscopy, J. Geophys. Res.-Solid Ea., 122, 3540–3564,         https://doi.org/10.5194/acp-13-1039-2013, 2013b.
   https://doi.org/10.1002/2017JB014020, 2017.                         Mallick, K., Trebs, I., Boegh, E., Giustarini, L., Schlerf, M., Drewry,
Klaassen, W., Bosveld, F., and de Water, E.: Water storage and            D. T., Hoffmann, L., von Randow, C., Kruijt, B., Araùjo, A.,
   evaporation as constituents of rainfall interception, J. Hydrol.,      Saleska, S., Ehleringer, J. R., Domingues, T. F., Ometto, J. P. H.
   212–213, 36–50, https://doi.org/10.1016/S0022-1694(98)00200-           B., Nobre, A. D., de Moraes, O. L. L., Hayek, M., Munger, J. W.,
   5, 1998.                                                               and Wofsy, S. C.: Canopy-scale biophysical controls of transpi-
Knoche, H. R. and Kunstmann, H.: Tracking atmospheric wa-                 ration and evaporation in the Amazon Basin, Hydrol. Earth Syst.
   ter pathways by direct evaporation tagging: A case study for           Sci., 20, 4237–4264, https://doi.org/10.5194/hess-20-4237-2016,
   West Africa, J. Geophys. Res.-Atmos., 118, 12345–12358,                2016.
   https://doi.org/10.1002/2013JD019976, 2013.                         Manoli, G., Domec, J.-C., Novick, K., Oishi, A. C., Noormets,
Lankreijer, H., Lundberg, A., Grelle, A., Lindroth, A., and Seib-         A., Marani, M., and Katul, G.: Soil-plant-atmosphere condi-
   ert, J.: Evaporation and storage of intercepted rain analysed by       tions regulating convective cloud formation above southeast-
   comparing two models applied to a boreal forest, Agr. For-             ern US pine plantations, Glob. Change Biol., 22, 2238–2254,
   est Meteorol., 98–99, 595–604, https://doi.org/10.1016/S0168-          https://doi.org/10.1111/gcb.13221, 2016.
   1923(99)00126-4, 1999.                                              Mauder, M. and Zeeman, M. J.: Field intercomparison of pre-
Lapidot, O., Ignat, T., Rud, R., Rog, I., Alchanatis, V., and             vailing sonic anemometers, Atmos. Meas. Tech., 11, 249–263,
   Klein, T.: Use of thermal imaging to detect evaporative                https://doi.org/10.5194/amt-11-249-2018, 2018.

https://doi.org/10.5194/hess-25-619-2021                                                Hydrol. Earth Syst. Sci., 25, 619–635, 2021
You can also read