Assessing the contribution of the ENSO and MJO to Australian dust activity based on satellite- and ground-based observations
←
→
Page content transcription
If your browser does not render page correctly, please read the page content below
Atmos. Chem. Phys., 21, 8511–8530, 2021
https://doi.org/10.5194/acp-21-8511-2021
© Author(s) 2021. This work is distributed under
the Creative Commons Attribution 4.0 License.

Assessing the contribution of the ENSO and MJO to Australian dust
activity based on satellite- and ground-based observations
Yan Yu1 and Paul Ginoux2
1 Atmosphericand Oceanic Sciences Program, Princeton University, Princeton, NJ 08540, USA
2 NOAA   Geophysical Fluid Dynamics Laboratory, Princeton, NJ 08540, USA

Correspondence: Yan Yu (yanyu@princeton.edu)

Received: 23 November 2020 – Discussion started: 15 December 2020
Revised: 25 March 2021 – Accepted: 10 May 2021 – Published: 7 June 2021

Abstract. Despite Australian dust’s critical role in the re-      currence of extreme dust events, in southeastern Australia,
gional climate and surrounding marine ecosystems, the con-        currently hypothesized to be attributed to the interaction be-
trolling factors of the spatiotemporal variations of Australian   tween MJO-induced anomalies in convection and wind and
dust are not fully understood. Here we assess the connec-         ENSO-induced anomalies in soil moisture and vegetation.
tions between observed spatiotemporal variations of Aus-
tralian dust with key modes of large-scale climate vari-
ability, namely the El Niño–Southern Oscillation (ENSO)
and Madden–Julian Oscillation (MJO). Multiple dust ob-            1   Introduction
servations from the Aerosol Robotic Network (AERONET),
weather stations, and satellite instruments, namely the Mod-      Australia represents a major contributor of dust to the South-
erate Resolution Imaging Spectroradiometer (MODIS) and            ern Hemisphere (Tanaka and Chiba, 2006), influencing re-
Multi-angle Imaging SpectroRadiometer (MISR), are exam-           gional climate and the marine ecosystems of the surround-
ined. The assessed multiple dust observations consistently        ing ocean basins. The substantial aerosol loading in the at-
identify the natural and agricultural dust hotspots in Aus-       mosphere from dust storms in Australia exerts a direct ef-
tralia, including the Lake Eyre basin, Lake Torrens basin,        fect on the radiation budget through the absorption and scat-
Lake Frome basin, Simpson Desert, Barwon–Darling basin,           tering of incoming shortwave radiation and the absorption
Riverina, Barkly Tableland, and the lee side of the Great         and emission of outgoing longwave radiation (Choobari et
Dividing Range, as well as a country-wide, austral spring-        al., 2013; Miller et al., 2004; Tegen and Lacis, 1996). Dust
to-summer peak in dust activity. Our regression analysis of       aerosols also produce an indirect effect by influencing the nu-
observed dust optical depth (DOD) upon an ocean Niño in-          cleation, microphysics, development, and optical properties
dex confirms previous model-based findings on the enhanced        of clouds, thereby altering rainfall patterns (DeMott et al.,
dust activity in southern and eastern Australia during the        2010). The deposition of transported dust over ocean affects
subsequent austral spring and summer dust season follow-          ocean biogeochemistry through changes to the iron supply
ing the strengthening of austral wintertime El Niño. Our          (Gabric et al., 2010; Jickells et al., 2005). Australia’s arid
analysis further indicates the modulation of the ENSO–dust        and semiarid regions provide a key supply of iron to the
relationship with the MJO phases. During sequential MJO           Southern Ocean and Antarctica by dust, during the present
phases, the dust-active center moves from west to east, as-       (Li et al., 2010), glacial (Lamy et al., 2014), and inter-
sociated with the eastward propagation of MJO, with the           glacial (Revel-Rolland et al., 2006) periods. Since most of
maximum enhancement in dust activity at about 120, 130,           the Southern Ocean is iron-limited (Sunda and Huntsman,
and 140◦ E, corresponding to MJO phases 1–2, 3–4, and             1997), the transport and deposition of Australian dust af-
5–6, respectively. MJO phases 3–6 are favorable for en-           fect its productivity and carbon uptake (Boyd et al., 2004;
hanced ENSO modulation of dust activity, especially the oc-       Gabric et al., 2002). Therefore, deeper understanding of the
                                                                  spatiotemporal variations in Australian dust emissions and

Published by Copernicus Publications on behalf of the European Geosciences Union.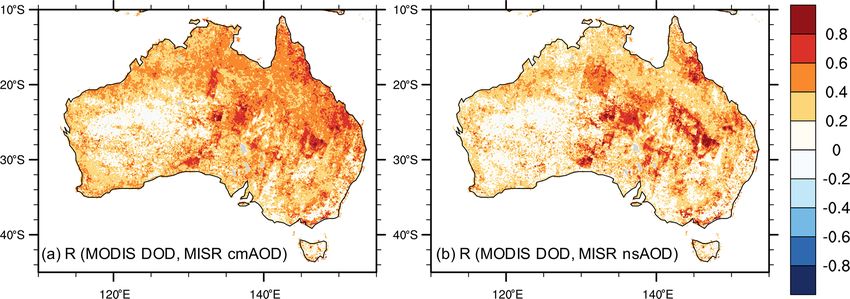
8512                       Y. Yu and P. Ginoux: Assessing the contribution of ENSO and MJO to Australian dust activity

their driving mechanisms will have broad implications on the         ability across eastern Australia (Rotstayn et al., 2011). On
regional and global climate.                                         longer timescales, Lamb et al. (2009) revealed a pronounced
   The current understanding of Australian dust activity             and consistent dust maximum during 1959 to 1973 and a
largely extends from interpretation of ground-based observa-         much more dust-free period after 1977 across central east-
tions and satellite aerosol products, which have not been thor-      ern Australia, based on the frequency of dust events reported
oughly intercompared over this region. Using a dust storm in-        at weather stations. This regime shift in Australian dustiness
dex (DSI) derived from dust storm and visibility observations        was attributed to wind field changes associated with oscil-
made at Australian Bureau of Meteorology (BoM) stations              lations in the Pacific climate system, including the latitudi-
(McTainsh et al., 1998), O’Loingsigh et al. (2014) assessed          nal displacement of the South Pacific Convergence Zone, and
the spatial distribution of frequency and intensity of dust ac-      SST changes of the Pacific Decadal Oscillation and North Pa-
tivity at 160 stations across Australia. Based on dust load-         cific Oscillation (Lamb et al., 2009). From the paleoclimate
ing derived from the satellite aerosol optical depth (AOD),          perspective, the geochemical characteristics of Australian
namely the Deep Blue algorithm applied to Moderate Res-              dust deposition in New Zealand over the last 8000 years have
olution Imaging Spectroradiometer (MODIS) data from the              been used to identify corresponding dust sources, thereby in-
polar-orbiting Terra and Aqua satellites, Ginoux et al. (2012)       ferring patterns of aridity in eastern Australia and climate
identified the Lake Eyre basin as the leading natural dust           variability associated with ENSO during the Holocene (Marx
source in Australia, consistent with previous ground-based           et al., 2009).
(McTainsh, 1989) and satellite-based (Bullard et al., 2008;             On intraseasonal to interseasonal timescales, the variabil-
Prospero et al., 2002) identification of dust sources. Ginoux        ity in Australia’s atmospheric and terrestrial states features
et al. (2012) further identified agricultural dust sources in the    the dominant signal from the Madden–Julian Oscillation
Murray–Darling Basin in southeastern Australia, including            (MJO) (Notaro, 2018; Risbey et al., 2009; Wheeler et al.,
the Victorian Big Desert, Riverina, and the Barwon–Darling           2009; Yu and Notaro, 2020); yet, the potential role of MJO
basin, consistent with an earlier satellite-based dust source        on Australia’s dust emission and transport remains under-
identification (Prospero et al., 2002) and model-based wind          studied. The MJO is characterized by eastward-propagating,
erodibility during dry years (Webb et al., 2006); however,           large-scale wave-like disturbances in the tropics, particularly
these agricultural dust sources generated minimal dust storm         across the tropical Indo-Pacific region, with a typical cy-
frequency at nearby weather stations (McTainsh, 1989; Mc-            cle of 30–60 d (Madden and Julian, 1971, 1972). During
Tainsh et al., 1989, 1998, 2007; O’Loingsigh et al., 2014).          an MJO event, anomalous convection acts as a tropical heat
Ginoux et al. (2012) attributed the potential inconsistency          source, emitting stationary Rossby waves that propagate into
in dust source maps among datasets to the various tempo-             the extratropics and significantly modulate the extratropi-
ral coverage of each dataset. The apparent inconsistency be-         cal circulation (Matthews et al., 2004; Seo and Son, 2012).
tween satellite- and ground-based spatial distribution of dust       Previous modeling and observational analyses have identi-
frequency and intensity could also be a result of the differen-      fied significant influence of MJO on rainfall and circulation
tial spatial coverage of these datasets. Therefore, it is critical   across Australia (Marshall et al., 2013; Risbey et al., 2009;
to rigorously cross-validate these observations of dustiness         Wheeler et al., 2009). An observational study by Wheeler
in Australia.                                                        et al. (2009) identified rainfall responses across extratrop-
   Observations and general circulation models (GCMs) have           ical Australia to MJO-induced changes in vertical motion
shown substantial variability in the occurrence and inten-           and meridional moisture transport during austral summer and
sity of dust emissions across Australia on interannual to            other seasons, respectively. Marshall et al. (2013) uncov-
decadal timescales, primarily driven by persistent anomaly           ered that the observed probability of an upper decile heat
in rainfall associated with Pacific sea surface temperature          event varies according to MJO phase and time of year, with
(SST) fluctuations, particularly El Niño-Southern Oscilla-           the greatest impact of the MJO on extreme heat occurring
tion (ENSO) events (Bullard and Mctainsh, 2003; Evans                over southern Australia in austral spring during phases 2–3.
et al., 2016; Lamb et al., 2009; Risbey et al., 2009; Strong         The convectively active MJO phases 5–6 are also responsible
et al., 2011; Webb et al., 2006). Corresponding to the ENSO-         for anomalous vegetation growth in the northern Australian
induced rainfall anomalies, during El Niño conditions, there         monsoon region (Notaro, 2018), which further supports cir-
is increased wind erosion in central and southeastern Aus-           culation changes over a broader region across the continent
tralia, while during La Niña years the sources are shifted           (Yu and Notaro, 2020).
to the southwestern regions (Webb et al., 2006). Based on               Furthermore, MJO may interact with ENSO on the mod-
the Geophysical Fluid Dynamics Laboratory (GFDL) cli-                ulation of Australian dust emission. First, surface west-
mate model (CM3), Evans et al. (2016) further uncovered the          erly anomalies introduced by the MJO can force down-
role of climate–vegetation interactions in amplifying and per-       welling oceanic Kelvin waves and influence ENSO evolution
sisting ENSO’s modulation on dust emission in southeastern           (Kessler et al., 1995; McPhaden and Taft, 1988), thereby trig-
Australia. The modulation on dust emission and loads was             gering ENSO’s modulation on Australian dust emission. Sec-
simulated to further amplify the ENSO-related rainfall vari-         ond, ENSO modulates MJO’s propagation, resulting in dif-

Atmos. Chem. Phys., 21, 8511–8530, 2021                                               https://doi.org/10.5194/acp-21-8511-2021
Y. Yu and P. Ginoux: Assessing the contribution of ENSO and MJO to Australian dust activity                                 8513

ferentiated spatiotemporal evolution of MJO (Wei and Ren,            This retrieval of DOD is on the basis of the Ångström ex-
2019) and its influence on Australia’s regional climate. Fur-     ponent’s sensitivity to particle size, with smaller values of
thermore, the convection and circulation anomalies intro-         Ångström exponent indicating larger particles (Eck et al.,
duced by MJO can enhance or weaken the basic response of          1999), and the previously established relationship between
regional climate to ENSO events, depending on the phase of        Ångström exponent and fine-mode AOD (Anderson et al.,
MJO, as demonstrated by an observational study on extreme         2005). In short, MODIS DOD represents the optical depth
precipitation over northern South America (Shimizu et al.,        of absorbing, coarse-mode aerosols that are often dust over
2017). Despite MJO’s critical influence on the regional cli-      bare ground or sparsely vegetated regions. Details about the
mate, its direct or indirect role in modulating dust emission     retrieval process and estimated errors are summarized by
or concentration in Australia has, to our knowledge, never        Pu and Ginoux (2018a). MODIS DOD products have been
been explicitly investigated in either observations or models.    widely used for the identification and characterization of
   Motivated by the current knowledge gap in the large-scale      dust sources (Baddock et al., 2009, 2016; Ginoux et al.,
climate drivers of Australian dust activity, the present study    2012), as well as examination of variations in regional and
first assesses the multiple satellite and ground-based obser-     global dustiness (Pu et al., 2019, 2020; Pu and Ginoux,
vations of dustiness in Australia, and then establishes the       2017, 2018a). Following the recommendation from Baddock
connection between the observed spatiotemporal variations         et al. (2016) and previous applications of MODIS DOD (Pu
in Australian dust activity with ENSO and MJO. We further         et al., 2019, 2020; Pu and Ginoux, 2017, 2018a), here we use
provide hypotheses regarding ENSO and MJO’s modulation            DOD with a low-quality flag of QA = 1, under the assump-
on Australian dust activity, through ENSO’s cumulative in-        tions that (1) dust sources are better detected using DOD with
fluence on vegetation and soil properties and MJO’s short-        a low-quality flag and that (2) retrieved aerosol products are
term perturbation on convection and extreme precipitation.        poorly flagged over dust source regions.
Sections 2, 3, and 4 present the data and methods, results,
and conclusions and discussion, respectively.                     2.1.2   MISR

                                                                  Benefiting from its multiangle observations, MISR data can
2     Data and methods                                            be used to directly retrieve AOD and particle properties
                                                                  (Diner et al., 1998). In the current study, version 23, level 2,
2.1     Dust optical depth proxies                                daily MISR 550 nm coarse-mode AOD (cmAOD) and non-
                                                                  spherical AOD (nsAOD) at 4.4 km resolution (Garay et al.,
Dust optical depth (DOD) is a column integration of extinc-       2020) are compared with MODIS DOD. The MISR non-
tion coefficient by mineral particles. The current study exam-    spherical AOD fraction is often referred to as “fraction of
ines DOD proxies during 2000–2019 from MODIS onboard              total AOD due to dust”, as dust is the primary nonspherical
the polar-orbiting Terra and Aqua satellites, the Multiangle      aerosol particle in the atmosphere, especially over desert re-
Imaging SpectroRadiometer (MISR) instrument (Diner et al.,        gions such as those found in the arid and semiarid regions in
1998) on Terra, and the ground-based AErosol RObotic NET-         Australia (Kalashnikova et al., 2005). The MISR nonspher-
work (AERONET) (Holben et al., 1998) sun photometers,             ical AOD has been used to examine variations in dustiness
with distinct retrieval algorithms.                               in North Africa and the Middle East (Yu et al., 2013, 2016,
                                                                  2018a, 2020). Similar to our use of MODIS DOD with a
2.1.1    MODIS                                                    low-quality flag, here we analyze the raw MISR cmAOD and
                                                                  nsAOD retrieval without quality filtering. MISR cmAOD and
Following Pu et al. (2020), daily DOD is retrieved from col-      nsAOD are also interpolated to a 0.1◦ × 0.1◦ grid using the
lection 6.1, level 2, MODIS Deep Blue aerosol products (Hsu       algorithm described by Ginoux et al. (2010). Due to its rel-
et al., 2013; Sayer et al., 2013), including aerosol optical      atively narrow swath of ∼ 380 km, MISR samples the study
depth (AOD), single-scattering albedo (ω), and the Ångström       region about every 10 d.
exponent (α). All the daily variables are first interpolated to
a 0.1◦ × 0.1◦ grid using the algorithm described by Ginoux        2.1.3   AERONET
et al. (2010). To account for dust’s absorption of solar radi-
ation and separate dust from scattering aerosols, such as sea     The version 3, level 2 (cloud-screened and quality-assured),
salt, we require the single-scattering albedo at 470 nm to be     sub-daily AERONET coarse-mode AOD (cmAOD) at
less than 0.99 for the retrieval of DOD. Based on the size dis-   500 nm obtained from 18 sun photometers across Australia
tribution of dust towards the coarse range and to separate it     (Giles et al., 2019) and retrieved by the Spectral Deconvolu-
from fine particles, DOD is retrieved as a continuous function    tion Algorithm (SDA) (O’Neill et al., 2003) is analyzed here
of AOD and the Ångström exponent:                                 along with DOD from MODIS and cmAOD from MISR. In
                                                                  the analysis of annual mean and seasonal cycle, AERONET
DOD = AOD × (0.98 − 0.5089α + 0.051α 2 ).                  (1)    cmAOD monthly data are first screened by removing those

https://doi.org/10.5194/acp-21-8511-2021                                           Atmos. Chem. Phys., 21, 8511–8530, 2021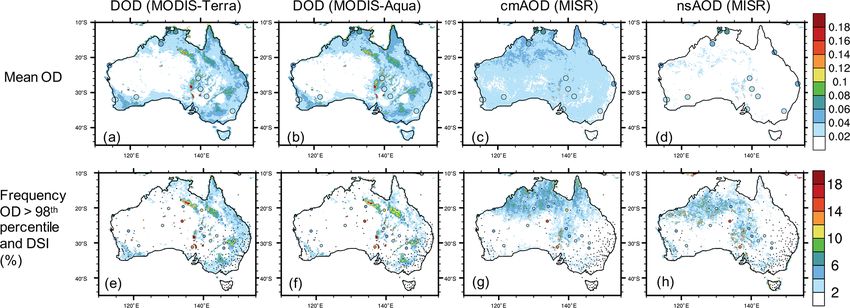
8514                      Y. Yu and P. Ginoux: Assessing the contribution of ENSO and MJO to Australian dust activity

months with fewer than 5 d of records. To calculate annual        2.3     Seasonal cycle of dustiness
means, years with less than 5 months of records are removed.
Annual mean and seasonal cycle are only analyzed for the          To achieve statistically meaningful analysis of the dusti-
15 AERONET stations with at least 5 months of data for at         ness annual cycle, the peak month of each dustiness mea-
least 3 years. Colocated cmAOD from AERONET and satel-            sure, namely DOD from MODIS, cmAOD and nsAOD from
lite products are further compared. Here a “collocated obser-     MISR, cmAOD from AERONET, and DSI from weather sta-
vation” is identified when there is available MODIS DOD or        tions, is obtained via a two-step approach. First, a sinusoid
MISR cmAOD over the 0.1◦ grid covering the AERONET                function of month is fitted for each dustiness measure,
site within ±0.5 h of the corresponding AERONET site ob-
servation. Although further spatial smoothing may improve                        iπ         iπ
                                                                  D(i) = α sin      + β cos    + γ,                          (3)
the consistency between AERONET and satellite measure-                            6          6
ments (Yu et al., 2013), here we keep the fine satellite pixels   where i stands for the calendar month (1 for January, 2 for
to evaluate the accuracy of satellite products at their origi-    February, . . . , and 12 for December); D(i) is the 20-year av-
nal spatial resolution. At each AERONET site, one satellite       erage dustiness in month i; and α, β, and γ are estimated by
observation is often associated with multiple AERONET ob-         minimizing the square error between the predicted and ob-
servations in time. In this case, AERONET observations are        served D(i)’s (i = 1 to 12).
temporally averaged, resulting in only one pair of colocated         Following this, the peak month of dustiness is obtained
and averaged satellite–AERONET DOD observations for a             from the predicted dustiness among 12 months. The peak
given colocated incident at each AERONET site. Larger tem-        month is regarded as statistically meaningful only if (1) the
poral averaging windows, such as ±1 h, do not improve the         predicted and observed seasonal cycle of dustiness are signif-
consistency between satellite and AERONET measurements,           icantly correlated with correlation exceeding 0.58 (n = 12),
likely due to the fine spatial scale considered in the current    based on the Student’s t test at a significance level of 0.05,
study.                                                            (2) the root-mean-square error between the predicted and ob-
                                                                  served dustiness is below a quarter of the annual mean dusti-
2.2    DSI from weather stations
                                                                  ness, and (3) the amplitude of the predicted dustiness sea-
                                                                  sonal cycle (maximum minus minimum) exceeds half of the
The present study analyzes meteorological records of dust
                                                                  maximum value among 12 months.
activity, based on nine weather codes that are related to dust
events as defined by the World Meteorological Organiza-
                                                                  2.4     Large-scale climate indices, environmental
tion (WMO). The meteorological records are obtained from
                                                                          variables, and associated analysis
the National Climatic Data Center (NCDC) global and U.S.
Integrated Surface hourly data set at 1489 weather stations       The connection between dust emission and large-scale cli-
in Australia. Following O’Loingsigh et al. (2014), the daily      mate indices is established here using MODIS DOD, which
Dust Storm Index (DSI) at a specific station is a weighted        has both morning and afternoon coverage for almost all pix-
sum of dust activity, calculated by                               els in Australia, and station DSI during 2003–2019. Regres-
                                                                  sion and composite analyses are conducted to assess the role
DSI = 5 × SDS + MDS + 0.05 × LDE,                          (2)    of ENSO and MJO in regulating Australian dust emission
                                                                  by modulating soil and vegetation properties and perturbing
   where severe dust storm (SDS) = 1 if a decreased (code         convection and extreme precipitation activities, respectively.
33), stable (code 34), or begun/increasing (code 35) severe
dust storm with visibility < 200 m is reported at least once      2.4.1    Ocean Niño Index and regression analysis
and 0 otherwise; moderate dust storm (MDS) = 1 if a de-
creased (code 30), stable (code 31), or begun or increasing       To assess ENSO’s modulation on Australian dustiness, an
(code 32) slight or moderate sand or dust storm with vis-         Ocean Niño Index (ONI) is analyzed. ONI is calculated as
ibility < 1000 m is reported at least once and 0 otherwise;       the 3-month running mean of Extended Reconstructed Sea
and local dust event (LDE) = 1 if raised dust or sand (code       Surface Temperature, version 5 (ERSSTv5) (Huang et al.,
07), well-developed dust whirls (i.e., “dust devils”, 08), or     2017), SST anomalies in the Niño 3.4 region (5◦ N–5◦ S,
distant or past dust storm (code 09) is reported at least once    120–170◦ W), based on centered 30-year base periods up-
and 0 otherwise. The credibility and temporal stability of DSI    dated every 5 years (Climate Prediction Center, 2020). The
was evaluated in detail by O’Loingsigh et al. (2014). Similar     influence of ENSO on DOD and DSI is quantified based
to the AERONET data availability screening, annual mean           on regression of seasonal average of daily DOD and oc-
and seasonal cycle are only analyzed for 182 weather sta-         currence of extremely high daily DOD during December–
tions with at least 5 months of effective data, namely with at    February (DJF) and September–November (SON) upon an-
least 5 d of DSI available during these months for at least 3     tecedent 3-month-averaged Niño 3.4 (sample size = 17 based
years during 2000–2019.                                           on 17 years of data). The regression analysis is performed

Atmos. Chem. Phys., 21, 8511–8530, 2021                                             https://doi.org/10.5194/acp-21-8511-2021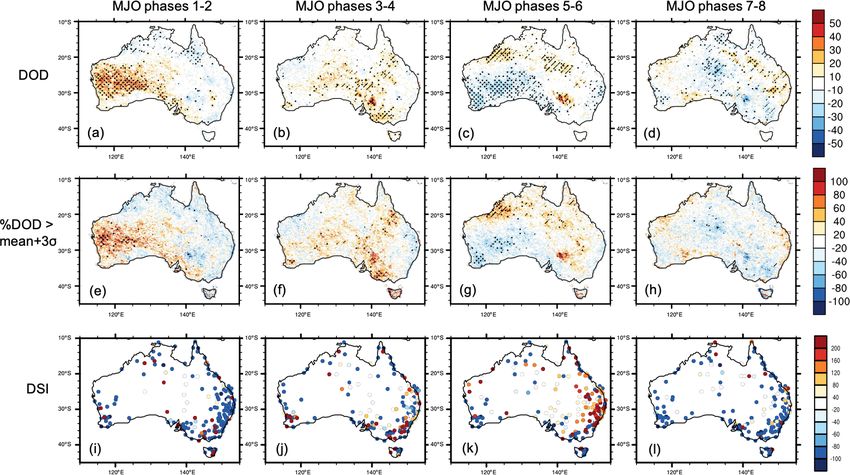
Y. Yu and P. Ginoux: Assessing the contribution of ENSO and MJO to Australian dust activity                                             8515

Table 1. Summary of the observational datasets for environmental variables applied in the current analyses across Australia.

  Variables      Dataset                                Period             Temporal        Spatial resolution    References
                                                                           resolution
  Leaf area     NOAA Climate Date Record                2000–2019          Daily           0.0833◦ × 0.0833◦     Vermote and NOAA
  index (LAI)   (CDR) Leaf Area Index (LAI)                                                                      CDR Program (n.d.)
                and Fraction of Absorbed Pho-
                tosynthetically Active Radiation
                (FAPAR) dataset
  Surface soil European Space Agency (ESA)              2000–2018          Daily           0.25◦ × 0.25◦         Dorigo et al. (2017)
  moisture      Climate Change Initiative (CCI)
                global satellite-observed soil mois-
                ture dataset
  Precipitation NOAA Climate Prediction Cen-            2000–2019          Daily           0.5◦ × 0.5◦           Chen et al. (2008)
                ter (CPC) Global Unified Gauge-
                Based Analysis of Daily Precipita-
                tion
  Near-         Commonwealth Scientific and             2000–2018          Daily           0.01◦ × 0.01◦         McVicar (2011)
  surface       Industrial Research Organisation
  wind speed    (CSIRO) near-surface wind speed
                dataset

with stations that have more than 2 weeks of daily DSI dur-             averaged 850 hPa zonal wind, 200 hPa zonal wind, and
ing the focal season (DJF or SON) of at least 12 out of the             satellite-observed outgoing longwave radiation (OLR) data.
17 years. Although regression analysis does not directly in-            Longer-timescale variability resulting from ENSO and other
fer causality, the resultant identification of covariability be-        interannual variations with periods longer than about 200 d is
tween Australian dust and antecedent ENSO state indicates               removed prior to the EOF analysis. The combination of PC1
higher likelihood of the latter driving the former than the op-         (RMM1) and PC2 (RMM2) of RMM reflects the magnitude
posite. To account for the non-Gaussian distribution of DOD             and phase of the MJO. When the amplitude is greater than 1,
and DSI, here the significance of regression coefficient is ob-         eight MJO phases are determined by the sign of RMM1 and
tained through a Monte Carlo permutation test with 1000 it-             RMM2. Phases 1 and 2 mark the time when the MJO’s con-
erations, following Yu and Notaro (2020). In each iteration,            vective envelope is centered near the western Indian Ocean,
the time series of DOD or DSI is randomly scrambled, lead-              and phases 5–6 mark the time when the envelope is near
ing to a random estimate of the regression coefficient on ONI.          northern Australia (Wheeler et al., 2009).
The probability distribution function (PDF) of the random                  Composite analysis is conducted for DOD, frequency of
regression coefficients is used to test if the regressions in the       extremely high DOD, and DSI in each of the consecutive two
original, non-permutated data are statistically significant. In         MJO phases (phases 1–2, 3–4, 5–6, and 7–8) during the dust
the current study, a significance level of 0.05 is used to in-          season of September–February. The results are expressed as
dicate statistically significant results. Given the insignificant       the differences between the phase-specific DOD or DSI and
autocorrelation at a 1-year lag with all the dust and environ-          the all-phase seasonal averages. The composite analysis is
mental variables across the major dusty regions in central and          applied to stations that have more than 7 d of daily DSI in
southeastern Australia (Fig. S1 in the Supplement), the cur-            each MJO phase group during the dust season (September to
rent statistical significance test does not account for the po-         February) of at least 12 out of the 17 years. A Monte Carlo
tential problem with random scrambling caused by autocor-               bootstrap test with 1000 iterations is used to determine the
relation.                                                               significance of anomalies in dustiness during various MJO
                                                                        phases. In each iteration, daily dustiness measures are ran-
2.4.2   Real-time multivariate MJO index and composite                  domly sampled with the same size as a particular group of
        and regression analysis                                         MJO phases. These randomly sampled dustiness measures
                                                                        are used to construct a PDF of sample mean dustiness and
To assess the potential influence of MJO and its interaction            test if the mean dustiness during specific MJO phases is
with ENSO on Australian dust activity, the real-time mul-               lower than the 2.5th or higher than the 97.5th percentile of
tivariate MJO index (RMM) (Wheeler and Hendon, 2004)                    the PDF.
is examined. RMM is derived as the principal components                    Further, regression of dustiness upon ONI is performed
(PCs) corresponding to the leading two empirical orthogonal             for each MJO phase group to evaluate potential role of
functions (EOF) of the combined fields of near-equatorially

https://doi.org/10.5194/acp-21-8511-2021                                                  Atmos. Chem. Phys., 21, 8511–8530, 2021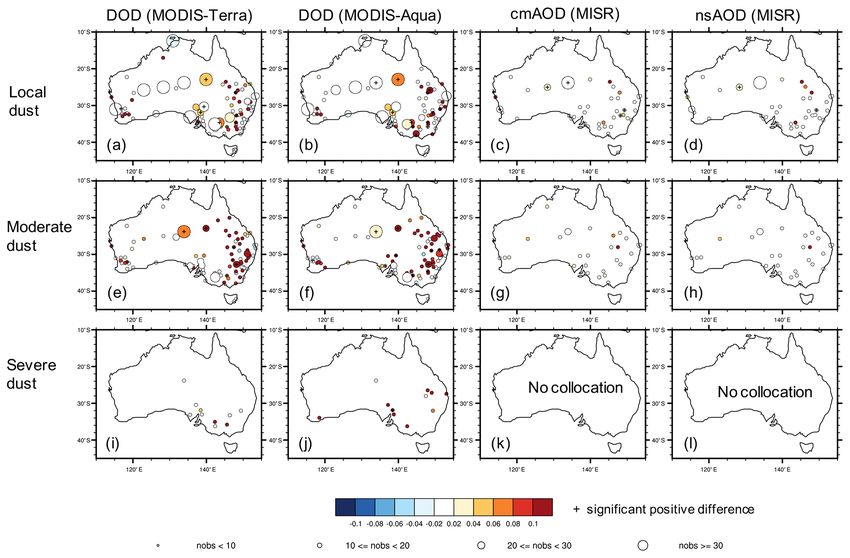
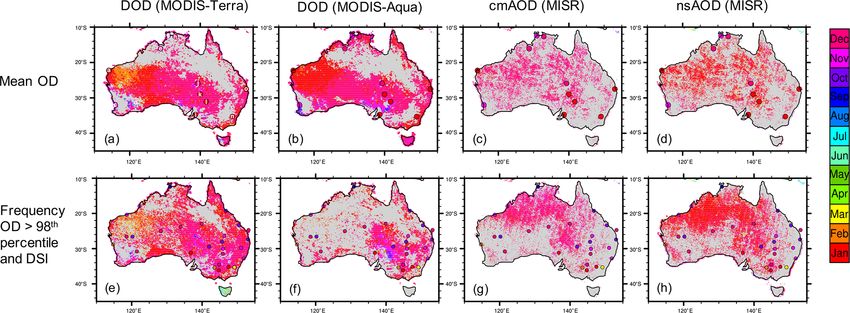
8516                        Y. Yu and P. Ginoux: Assessing the contribution of ENSO and MJO to Australian dust activity

Figure 1. Dominant land cover type across Australia in 2012, marked with key dust source regions. The land cover data is from MODIS,
based on the International Geosphere-Biosphere Programme (IGBP) classification scheme (Sulla-Menashe and Friedl, 2018). The land cover
fraction of 18 classes is interpolated from 0.05 to 0.1◦ .

Figure 2. Annual mean dust activity over Australia during 2000–2019. In (a–d), the map represents average DOD from (a) MODIS-Terra
and (b) MODIS-Aqua and (c) coarse-mode AOD (cmAOD) and (d) non-sphere AOD (nsAOD) from MISR. Filled circles represent cmAOD
from 15 AERONET sites, which are identical in (a–d). In (e–h), the map represents frequency of DOD proxies exceeding the 98th percentile
of all observations from each instrument, namely 0.205 for DOD from MODIS-Terra, 0.198 for DOD from MODIS-Aqua, 0.095 for cmAOD
from MISR, and 0.062 for nsAOD from MISR. Filled circles represent the Dust Storm Index (DSI, %) at 1489 weather stations, which is
identical in (e–h). Dots in (e–h) represent stations with annual mean DSI smaller than 2 %. Grey indicates pixels with satellite sampling less
than 10 d during the analyzed 20 years.

Atmos. Chem. Phys., 21, 8511–8530, 2021                                                     https://doi.org/10.5194/acp-21-8511-2021
Y. Yu and P. Ginoux: Assessing the contribution of ENSO and MJO to Australian dust activity                                        8517

Figure 3. Month of peak dust activity over Australia during 2000–2019. In (a–d), the map represents average DOD from MODIS-Terra and
MODIS-Aqua and cmAOD and nsAOD from MISR. Filled circles represent DOD from 15 AERONET sites, which are identical in (a–d). In
(e–h), the map represents frequency of DOD proxies exceeding the 98th percentile of all observations from each instrument. Filled circles
represent DSI from 182 weather stations. Only statistically meaning seasonal cycle peak month is shown for each dustiness measure, as
outlined in Sect. 2.3.

MJO in modulating ENSO’s influence on Australian dusti-                nals are evaluated by the aforementioned non-parametric ap-
ness. Phase-specific, seasonal mean DOD and DSI are cal-               proaches.
culated before being regressed on antecedent ONI. For a
specific station in specific MJO phases during the dust sea-
son, the phase-specific, seasonal mean DSI is only computed            3     Results
when daily DSI is available on at least 7 d, otherwise re-
                                                                       3.1    Comparison of multiple observations of dustiness
ported as missing value. The statistical significance of MJO’s
modulation on the ENSO–dust relationship is assessed by                MODIS DOD from both Terra and Aqua and station-based
a Monte Carlo test with 1000 iterations. In each iteration,            DSI consistently identify the natural and agricultural dust
daily dustiness measures are randomly sampled from the en-             hotspots in Australia, including the Lake Eyre basin, Lake
tire dust season with the same size as a particular group of           Torrens basin, Lake Frome basin, Simpson Desert, Barwon–
MJO phases and averaged to obtain a random-phase mean                  Darling basin, Riverina, Barkly Tableland, and the lee side of
dustiness measure for each year. The time series of these              the Great Dividing Range (Figs. 1 and 2). The annual mean
random-phase mean dustiness measures is regressed on the               MODIS DOD reaches 0.2 over Lake Eyre, Lake Torrens, and
antecedent ONI, resulting in a PDF of the regression coef-             Lake Frome, where over 30 % of days observe a DOD ex-
ficients to test if the regression coefficient from the realistic,     ceeding 0.2, the 98th percentile of all MODIS DODs across
phase-specific dustiness is lower than the 2.5th or higher than        Australia. MISR cmAOD and nsAOD are generally lower
the 97.5th percentile of the PDF.                                      than MODIS DOD in magnitude and exhibit minimal spatial
                                                                       variation. Moreover, MISR only captures the margin of Lake
2.4.3   Other environmental variables                                  Eyre basin and Barkly Tableland and shows relatively low
                                                                       dustiness over the Barwon–Darling basin and mostly invalid
To examine the potential mechanisms underlying the modu-               retrievals over the Lake Torrens and Lake Frome basins. The
lation of ENSO and MJO on Australian dustiness, we assess              failure of MISR in capturing the agricultural dust hotspots
the connection between these large-scale climate drivers and           in Australia is likely attributed to a lack of dust–smoke mix-
various environmental factors such as surface wind speed,              ture in the look-up table involved in the operational MISR
precipitation, soil moisture, and leaf area index (LAI) across         retrieving algorithm (Kahn et al., 2010). This shortage leads
Australia. The data sources of these environmental variables           to less reliable retrievals of both cmAOD and nsAOD from
are outlined in Table 1. Regression and composite analyses             MISR over the fire-prone dust hotspots in southeastern Aus-
are applied to these environmental variables, similar to those         tralia (Garay et al., 2020). The spatial distribution of mean
applied to the dustiness observations. To account for the non-         cmAOD from AERONET is largely consistent with the satel-
Gaussian distribution of these environmental variables, the            lite observations. The apparently high DOD from MODIS
statistical significance of the regression and composite sig-          and cmAOD from AERONET over the coastal region is

https://doi.org/10.5194/acp-21-8511-2021                                                 Atmos. Chem. Phys., 21, 8511–8530, 2021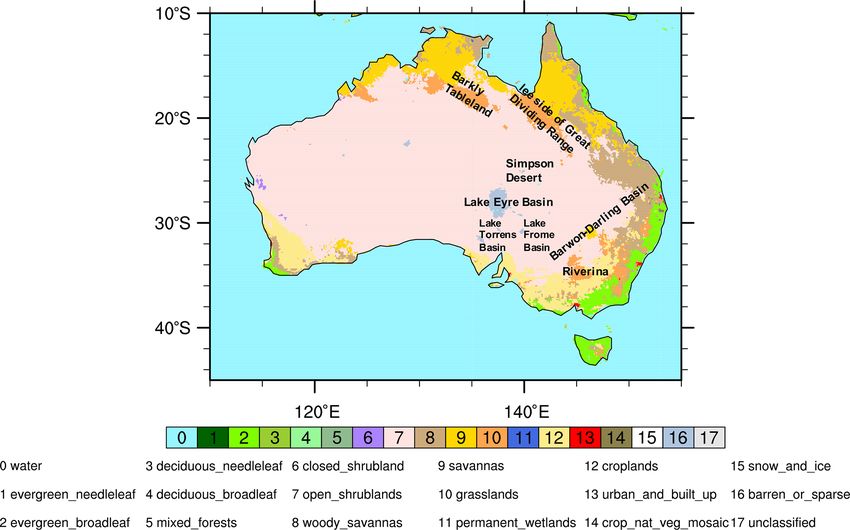
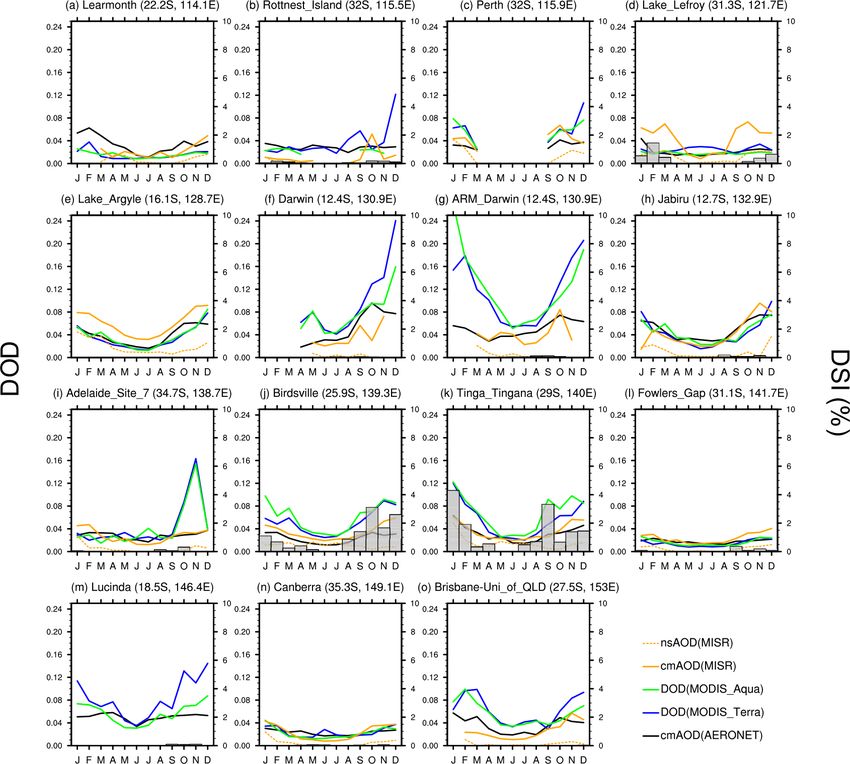
8518                        Y. Yu and P. Ginoux: Assessing the contribution of ENSO and MJO to Australian dust activity

Figure 4. Seasonal cycle of dust activity at 15 AERONET sites in Australia. Lines represent mean DOD from MODIS-Terra (blue) and
MODIS-Aqua (green), cmAOD from MISR (solid orange) and nsAOD from MISR (dashed orange), and cmAOD from AERONET (black)
by month, referring to the left y axis. Bars, referring to the right y axis, represent mean DSI over weather stations located within 100 km
of each AERONET site. The seasonal cycle of dust activity from satellite and in-site observations is obtained from the active years of each
AERONET site. The AERONET sites are presented by longitude from west to east, matching the letters in Fig. 3a.

likely caused by the abundance of sea salt aerosol and its              Birdsville and Tinga Tingana, located near the dust hotspots
mixture with dust and biomass burning aerosols.                         in Simpson Desert and Lake Eyre basin, respectively (Fig. 4).
   DOD from MODIS, cmAOD from AERONET and MISR,                         The largest disagreement between satellite and station-based
and nsAOD MISR exhibit a generally consistent seasonal cy-              observations of dustiness occurs over the Barwon–Darling
cle in dust activity, which peaks in austral spring to summer,          basin and its northern downwind regions in eastern Australia,
namely November, December, and January, across most of                  where MODIS DOD and station DSI indicate peak dustiness
the country (Figs. 3 and 4). In particular, the seasonal cycle in       in November to December, while cmAOD and nsAOD from
DOD proxies is generally consistent between all satellite in-           MISR indicates undetectable seasonal cycle peak. The incon-
struments and AERONET at most sites in Australia. The sea-              sistency between MISR and other sources of dustiness mea-
sonal cycle in DOD proxies and DSI are highly consistent in             sure is likely attributed to the uncertainty in MISR’s retrieval

Atmos. Chem. Phys., 21, 8511–8530, 2021                                                    https://doi.org/10.5194/acp-21-8511-2021
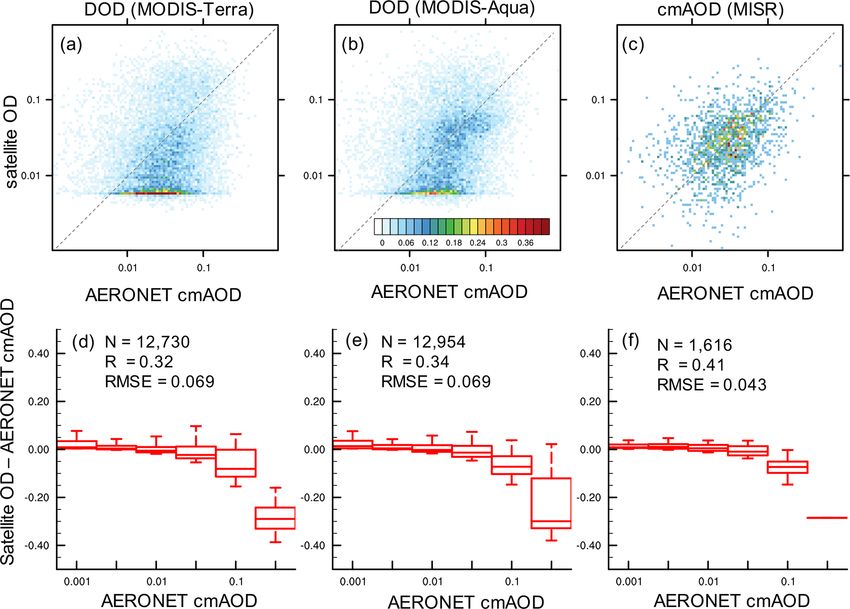
Y. Yu and P. Ginoux: Assessing the contribution of ENSO and MJO to Australian dust activity                                     8519

Figure 5. Comparison of MODIS DOD and MISR cmAOD against colocated AERONET cmAOD. (a–c) Joint probability density (%) of
colocated cmAOD from AERONET and (a) DOD from MODIS-Terra, (b) DOD from MODIS-Aqua, and (c) cmAOD from MISR. (d–f)
Boxplot of the difference in colocated measurements between (d) DOD from MODIS-Terra, (b) DOD from MODIS-Aqua, and (c) cmAOD
from MISR and cmAOD from AERONET, as a function of AERONET cmAOD. The boxplots show the 5th, 25th, 50th, 75th, and 95th
percentiles of the DOD difference. The sample size (N), correlation coefficients (R), and root-mean-square error (RMSE) with colocated
AERONET cmAOD are provided in (d–f) for the corresponding satellite product.

of dust–smoke mixtures (Kahn et al., 2010). Over the Lake            cal limits of retrieving algorithm. Furthermore, both MODIS
Eyre–Torrens–Frome basin, the morning satellite observa-             and MISR display a wider spread at higher DOD or cmAOD
tions, namely MODIS-Terra and MISR, display a summer-                and an overall underestimation, especially when AERONET
time peak in dustiness, while the afternoon satellite observa-       DOD exceeds 0.1 (Fig. 5). This underestimation of high opti-
tion from MODIS-Aqua and all-day station observations in-            cal depth has been reported by previous global validations of
dicate a springtime peak. This contrast between the seasonal         total AOD from MODIS (Sayer et al., 2019; Wei et al., 2019)
cycles in morning and afternoon dustiness suggests a season-         and MISR (Garay et al., 2020), as well as MODIS DOD (Pu
ally varying diurnal evolution of dust emission in southern          and Ginoux, 2018b). The underestimation of high DOD po-
central Australia.                                                   tentially leads to the deteriorated correlations between colo-
   The general comparison between colocated satellite DOD            cated satellite DOD or cmAOD and AERONET DOD over
or cmAOD and AERONET cmAOD exhibits reasonable                       the dustiest region near the Lake Eyre basin, compared with
quality of satellite retrievals over the majority of Australia,      less dusty regions in Australia (Fig. 6). Given the distinct
but wider spreads of DOD from both MODIS-Terra and                   retrieval algorithms involved in the satellite DOD, cmAOD,
MODIS-Aqua, and cmAOD from MISR, especially cor-                     and AERONET cmAOD, the moderate but significant cor-
responding to colocated high cmAOD from AERONET                      relations (p < 0.001) between colocated, thousands-satellite
(Figs. 5 and 6). The wide spread of MISR cmAOD, compared             DOD or cmAOD and AERONET cmAOD (Fig. 5) demon-
with colocated AERONET cmAOD, is partly attributed to                strate the reliability of MODIS DOD and MISR cmAOD in
the limited spectral range of MISR. Very few MODIS DOD               representing coarse-mode aerosol loads.
retrievals reach lower than 0.005, likely due to the numeri-

https://doi.org/10.5194/acp-21-8511-2021                                               Atmos. Chem. Phys., 21, 8511–8530, 2021
8520                      Y. Yu and P. Ginoux: Assessing the contribution of ENSO and MJO to Australian dust activity

Figure 6. Correlation between colocated hourly cmAOD from AERONET and satellite measurements at 18 AERONET sites in Australia.
The satellite measurements include (a) DOD from MODIS-Terra, (b) DOD from MODIS-Aqua, and (c) cmAOD from MISR. The sizes
of the dots indicate the number of colocated observations. A missing circle in (c) indicates no collocation between MISR and AERONET
observations.

Figure 7. Correlation between colocated, daily MODIS-Terra DOD and MISR (a) cmAOD and (b) nsAOD. The number of collocations per
pixel between MODIS and MISR during 2000–2019 generally varies from 100 to 800 for DOD and 20 to 200 for nsAOD. Grey indicates
areas with fewer than 10 collocations per pixel.

   According to the comparison between colocated MODIS              thermore, higher MODIS DOD is observed on reported dusty
DOD and MISR cmAOD and nsAOD, as well as satellite                  days at most stations in Australia, especially during country-
DOD proxies versus station dust storm observations, coarse-         wide local dust and moderate dust events, as well as severe
mode AOD is an acceptable approximation of dustiness                dust events in the south and east with MODIS-Aqua (Fig. 8).
over the dust hotspots in central and southeastern Australia        Insufficient number of collocations between ground observa-
(Figs. 7 and 8). While the correlation between MODIS DOD            tions and MISR overpasses likely leads to the minimal signal
and MISR cmAOD exceeds 0.4 across the majority of the               in MISR cmAOD or nsAOD, as previously shown in the an-
country, even exceeding 0.6 over central eastern Australia,         nual mean (Fig. 2).
the correlation between MODIS DOD and MISR nsAOD                       Overall, the general consistency between MODIS DOD
reaches 0.6 only near the major dust source regions, e.g., the      and colocated AERONET cmAOD, MISR cmAOD, and
Lake Eyre–Torrens–Frome basin, the Simpson Desert, and              MISR nsAOD and qualitative consistency between MODIS
northern downwind area of the Barwon–Darling basin. Fur-            DOD and station dust observations provides confidence in

Atmos. Chem. Phys., 21, 8511–8530, 2021                                               https://doi.org/10.5194/acp-21-8511-2021
Y. Yu and P. Ginoux: Assessing the contribution of ENSO and MJO to Australian dust activity 8521
Figure 8. Difference in satellite DOD proxies between dusty days and clear days at weather stations in Australia. The color of the filled dots
represents the difference in (a, e, i) DOD from MODIS-Terra, (b, f, j) DOD from MODIS-Aqua, (c, g, k) cmAOD from MISR, and (d, h, i)
nsAOD from MISR between days with no reported dust observation and days with reported (a–d) ”local dust”, (e–h) ”moderate dust”, and
(i–l) “severe dust”. The size of the dots indicates number of days with both weather observations and valid satellite retrievals within 25 km at
each station. A plus sign indicates a significant positive difference in DOD between dusty and clear days based on a Monte Carlo bootstrap
test (p < 0.05).
the credibility of MODIS DOD records in the representation of the Great Dividing Range, 0.04 over the Barwon–Darling
of dustiness over the bare ground and sparsely vegetated re- basin, and 0.03 over Riverina during the subsequent Decem-
gions of Australia. Considering the temporal and spatial cov- ber to February (DJF). The +1 ◦ C warming in the Niño 3.4
erage of each dataset, only results from MODIS DOD, rep- region during JAS causes an increase in the frequency of ex-
resented by the average between the morning (Terra) and af- treme DOD of about 5 % over the lee side of the Great Divid-
ternoon (Aqua) overpasses, and station DSI are presented in ing Range and 2 % over Riverina, and an increase in DSI of
the following section of climatic modulation on Australian about 1 % over the Barwon–Darling basin and Riverina dur-
dustiness. ing the subsequent DJF. The El Niño condition in the aus-
tral autumn and winter also leads to enhanced dust emissions
3.2 Modulation from ENSO and MJO on Australian across the Simpson Desert and Barwon–Darling basin during
dustiness the subsequent September–November (SON).
The lagged response in Australian dust activity to ENSO
According to regression analysis applied to multiple dust ob- is attributed to ENSO’s persistent and cumulative influence
servation data sets and Niño 3.4 at various antecedent time, on the regional soil moisture and LAI (Fig. 10). The El Niño-
austral wintertime El Niño supports enhanced dust activity in induced inhibited rainfall across eastern and central Australia
southern and eastern Australia during the subsequent austral (e.g., Risbey et al., 2009) leads to the depletion of soil mois-
summer dust season (Fig. 9). An SST anomaly of +1 ◦ C in ture and a resulting reduction in vegetation cover, thereby fa-
the Niño 3.4 region during July to September (JAS) leads to voring dust emission. In austral summer, the El Niño-induced
an increase in daily mean DOD of about 0.05 over the lee side reduction in vegetation cover across eastern Australia likely
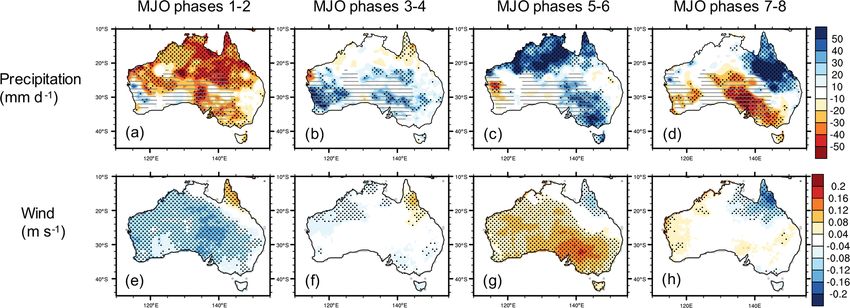
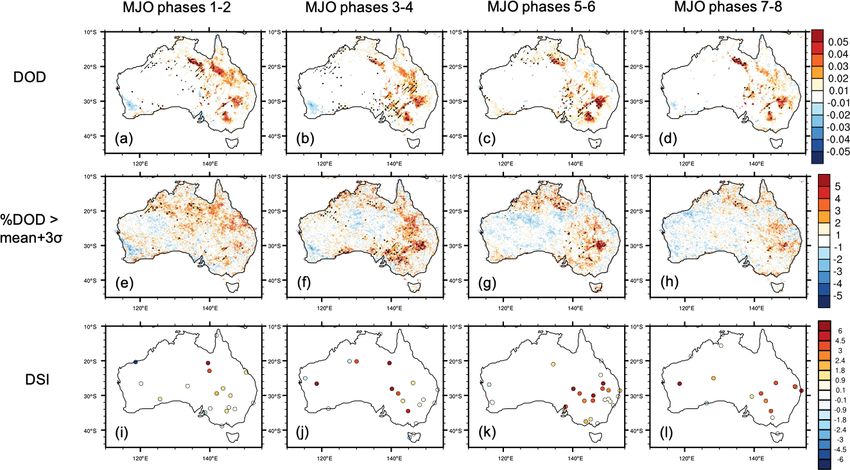
https://doi.org/10.5194/acp-21-8511-2021 Atmos. Chem. Phys., 21, 8511–8530, 20218522 Y. Yu and P. Ginoux: Assessing the contribution of ENSO and MJO to Australian dust activity Figure 9. Regression of anomalies in seasonal dust activity in (a, b, e, f, i, j) December–February (DJF) and (c, d, g, h, k, l) September– November (SON) upon antecedent Niño 3.4. Analyzed dust variables include seasonal (a–d) DOD averaged from MODIS-Terra and MODIS- Aqua, (e–h) frequency of daily DOD anomaly exceeding 3 times the interannual standard deviation, and (i–l) DSI. (a, c, e, g, i, k) Regression coefficient between (a, e, i) DJF dust and antecedent July–September (JAS) Niño 3.4 (ENSO leading dust for 5 months), and (c, g, k) SON dust and antecedent May–July (MJJ) Niño 3.4 (ENSO leading dust for 4 months). In (a, c, e, g), the stitches indicate regions with significant regression coefficient (p < 0.05), based on Monte Carlo bootstrap test; and the slashes further denotes regions with significant positive correlation between MODIS DOD and MISR nsAOD. In (i, k), only statistically significant regression coefficients (p < 0.05) are shown. (b, d, f, h, j, l) Boxplot of the regression coefficient of seasonal dustiness on Niño 3.4 at different antecedent times as a function of the leading time of Niño 3.4, showing the 5th, 25th, 50th, 75th, and 95th percentiles of regression coefficient at all pixels within the dust source region (25–35◦ S, 135–155◦ E). causes a reduction in surface roughness and strengthened sur- 4, and 5–6, respectively (Fig. 11). During MJO phases 5–6, face wind that further enhances dust emission. The response i.e., the convection-active phases for Australia, the increased magnitude in soil moisture and LAI in austral summer and surface wind speed over the majority of the continent, es- spring peaks after 3–6 months of the ENSO signal, support- pecially over the dust hotspots in the Lake Eyre–Torrens– ing the 3–6 month lag in the dustiness response to ENSO. Frome basin and Riverina, appears responsible for the en- The currently identified importance of vegetation in the mod- hanced dustiness (Fig. 12). Surprisingly, the enhanced dusti- ulation of ENSO on dust emissions in Australia confirms ness over the central and eastern Australian dust hotspots the model-based finding about the role of climate–vegetation seems to be associated with anomalously wet conditions dur- interactions in amplifying and persisting ENSO’s modula- ing all MJO phases. Given that central and southern Aus- tion on dust emission in southeastern Australia by Evans tralia generally receive less than 1 mm of rainfall on an av- et al. (2016). erage day, we hypothesize that over these arid or semiarid According to the composite of DOD, frequency of extreme regions, enhanced rainfall during the MJO phases 3–6 in aus- DOD, and station-based DSI, the dust-active center moves tral spring and summer associated with enhanced convection from west to east associated with the eastward propagation of and occurrence of thunderstorms supports higher occurrence MJO, with a maximum enhancement in dust activity at about of haboob type of dust events. Several case studies have re- 120, 130, and 140◦ E, corresponding to MJO phases 1–2, 3– ported haboob dust events in the central and eastern Australia Atmos. Chem. Phys., 21, 8511–8530, 2021 https://doi.org/10.5194/acp-21-8511-2021
Y. Yu and P. Ginoux: Assessing the contribution of ENSO and MJO to Australian dust activity                                           8523

Figure 10. Regression of anomalies in seasonal LAI, soil moisture, and surface wind speed in (a, b, e, f, i, j) December–February (DJF)
and (c, d, g, h, k, l) September–November (SON) upon Niño 3.4. (a, c, e, g, i, k) Regression coefficient between (a) LAI, (e) soil moisture,
and (i) surface wind speed during DJF and Niño 3.4 during antecedent July–September (JAS) (ENSO leading environmental conditions for
5 months), and SON (c) LAI, (g) soil moisture, and (k) surface wind speed during SON and Niño 3.4 during antecedent May–July (MJJ)
(ENSO leading environmental conditions for 4 months). Figure elements are the same as Fig. 9a–h.

(McTainsh et al., 2005; Shao et al., 2007). Strong et al. (2011)        ately enhanced dustiness over the Lake Eyre–Torrens–Frome
found that about 24 % of dust storms in the lower Lake Eyre             basin in response to antecedent El Niño. We hypothesize that
basin during 2005–2006 are associated with thunderstorms.               the enhanced response in dustiness across southeastern Aus-
Our alternative hypothesis relies on the supply of fine parti-          tralia to ENSO during MJO phases 3–6 can be attributed
cles by occasional flooding from MJO-induced storms. For                to the interplay between MJO-induced anomalies in convec-
supply-limited and/or transport-limited dust sources such as            tion, rainfall, and wind and the ENSO-induced anomalies in
those in southeastern Australia, lack of occasional storms un-          soil moisture and vegetation. While the dry soils and dimin-
der drier conditions usually leads to the failure of sediment           ished vegetation caused by El Niño provide favorable con-
replenishment, thereby leading to anomalously inactive dust             ditions for dust emission (Fig. 10), the active convections
emission (Arcusa et al., 2020; Bullard and Mctainsh, 2003).             and elevated occurrence of extreme precipitation during MJO
   ENSO’s regulation of dust emission varies in magnitude               phases 3–6, as well as strengthened surface wind during MJO
by MJO phases, with MJO phases 3–6 favorable for en-                    phases 5–6, likely trigger more dust emission and extreme
hanced ENSO regulation on dust activity, especially the oc-             dust events across southeastern Australia through either ha-
currence of extreme dust events, in southeastern Australia              boob type of dust events or additional sediment supply by
(Fig. 13). An SST anomaly of +1 ◦ C in the Niño 3.4 re-                 occasional flooding (Fig. 12).
gion in austral winter is associated with an increased DOD
by over 0.05, an increased frequency of extreme DOD by
over 5 %, and an increased DSI by 2 % over the Barwon–                  4   Discussion and conclusions
Darling basin and Riverina during MJO phases 5–6 in aus-
                                                                        The current study investigates the contribution of large-
tral spring and summer. MJO phases 3–4 feature a moder-
                                                                        scale climate variability represented by ENSO and MJO to

https://doi.org/10.5194/acp-21-8511-2021                                                   Atmos. Chem. Phys., 21, 8511–8530, 2021
8524 Y. Yu and P. Ginoux: Assessing the contribution of ENSO and MJO to Australian dust activity Figure 11. Mean anomalies (% climatology) in dust activity by MJO phase in September–February. Analyzed dust variables include (a–d) DOD averaged from MODIS-Terra and MODIS-Aqua, (e–h) frequency of daily DOD anomaly exceeding 3 times the interannual standard deviation, and (i–l) DSI. The anomalies for each consecutive two MJO phases, namely phases 1–2, 3–4, 5–6, and 7–8, are calculated as the percentage differences between these two phases and the long-term average during September–February of 2003–2019. The composites consist of 376, 492, 613, and 450 d with RMM > 1 for phases 1–2, 3–4, 5–6, 7–8, respectively. In (a–h), the stitches indicate regions with significant percentage difference with the climatology (p < 0.05), based on a Monte Carlo bootstrap test, and the slashes further denote regions with significant positive correlation between MODIS DOD and MISR nsAOD. In (i–l), only statistically significant percentage differences (p < 0.05) are shown. Figure 12. Mean anomalies in daily precipitation and surface wind speed by MJO phase in September–February. Figure elements are the same as in Fig. 11a–h. Grey dashes indicates areas with seasonal mean rainfall less than 1 mm d−1 . Atmos. Chem. Phys., 21, 8511–8530, 2021 https://doi.org/10.5194/acp-21-8511-2021
Y. Yu and P. Ginoux: Assessing the contribution of ENSO and MJO to Australian dust activity                                            8525

Figure 13. Regression of anomalies in dust activity during each consecutive two MJO phases in September–February upon the antecedent
June–August (JJA) Niño 3.4 by MJO phase. Analyzed dust variables include (a–d) DOD averaged from MODIS-Terra and MODIS-Aqua, (e–
h) frequency of daily DOD anomaly exceeding 3 times the interannual standard deviation, and (i–l) DSI. The anomalies for each consecutive
two MJO phases, namely phases 1–2, 3–4, 5–6, and 7–8, are calculated as the differences between these two phases and the long-term average
during September–February of 2003–2019. In (a–h), the stitches indicate regions with significant regression coefficient (p < 0.05), based
on the Monte Carlo bootstrap test for the null hypothesis of a phase-invariant regression coefficient, and the slashes further denote regions
with significant positive correlation between MODIS DOD and MISR nsAOD. In (i–l), only statistically significant regression coefficients
(p < 0.05) are shown.

the modulation of Australian dust activity on the intrasea-              Niño 3.4 SST confirms the previous model-based findings
sonal to interannual time scales. Multiple sources of dusti-             by Evans et al. (2016) on the enhanced dust activity in south-
ness measurements, namely DOD from MODIS, cmAOD                          ern and eastern Australia during the subsequent austral sum-
and nsAOD from MISR, cmAOD from AERONET, and                             mer dust season following the strengthening of austral win-
DSI from weather stations, are intercompared in terms of                 tertime El Niño. Composites of dustiness during sequential
their annual mean, seasonal cycle, and day-to-day varia-                 MJO phases demonstrates the propagation of the dust-active
tions over a 20-year period from 2000 to 2019. These as-                 center from west to east associated with the eastward move-
sessed dust observations consistently identify the natural               ment of MJO, with maximum enhancement in dust activity
and agricultural dust hotspots in Australia, including the               at about 120, 130, and 140◦ E corresponding to MJO phases
Lake Eyre–Torrens–Frome basin, Simpson Desert, Barwon–                   1–2, 3–4, and 5–6, respectively. Our analysis further indi-
Darling basin, Riverina, Barkly Tableland, and the lee side              cates the modulation of the ENSO–dust relationship with the
the Great Dividing Range, and a country-wide dust peak                   MJO phases; MJO phases 3–6 are favorable for amplifying
during austral spring-to-summer, confirming the previous                 ENSO’s modulation on dust activity, especially the occur-
ground-based (McTainsh, 1989) and satellite-based (Bullard               rence of extreme dust events in southeastern Australia.
et al., 2008; Ginoux et al., 2012; Prospero et al., 2002)                   Although the current study demonstrates the general reli-
identification of dust sources. Furthermore, the intercompar-            ability of MODIS DOD over the arid and semiarid regions
ison between the multiple dust observations demonstrates                 in Australia, uncertainties of this product should be noted.
the credibility of MODIS DOD – a widely analyzed satel-                  For example, the retrieval of MODIS DOD relies on the
lite dust observation with optimal temporal and spatial cov-             light-absorbing and coarse-mode nature of dust and is un-
erage – over the arid to semiarid regions in central and south-          able to distinguish between dust and the coarse-mode part of
eastern Australia. Regression analysis of MODIS DOD upon                 biomass burning aerosols (e.g., Noyes et al., 2020), leading to

https://doi.org/10.5194/acp-21-8511-2021                                                   Atmos. Chem. Phys., 21, 8511–8530, 2021
8526                      Y. Yu and P. Ginoux: Assessing the contribution of ENSO and MJO to Australian dust activity

potential misrepresentation of dust and smoke aerosols over       of ENSO and MJO are established upon regression and com-
the wildfire hotspots in northern Australia (Van Der Werf         posite analyses, which do not directly infer causality. Ad-
et al., 2017). Given the potential contamination from biomass     vanced statistical approaches, such as the Stepwise General-
burning aerosols, our interpretation of the currently exam-       ized Equilibrium Feedback Assessment (SGEFA) (Yu et al.,
ined connection between dust and climatic drivers mainly          2017, 2018b), will be useful to evaluate the role of large-scale
focuses on central and southeastern Australia. In addition,       climate modes and local environmental changes in the emis-
for haboob dust events, which often occur with the pres-          sion and transport of Australian dust. In addition, the present
ence of convective clouds, MODIS and MISR algorithms              study focuses on the natural drivers of Australian dust activ-
are unlikely to perform aerosol retrievals. Given the single      ity, while anthropogenic dust emission from land use change
assumption on dust particle shape involved in nsAOD, the          is a key contributor to total dust emission in Australia (Gi-
MISR nsAOD is often regarded as a better proxy of DOD             noux et al., 2012; Tegen et al., 2004; Webb and Pierre, 2018).
than coarse-mode AOD. But the limited temporal coverage           Indeed, disturbed soil and vegetation from land use, such as
of MISR makes it less useful for studying the day-to-day          pastoral and agricultural activity in eastern Australia, have
variations and extreme events of dust activity, especially cor-   caused substantial increase in dust emission and deposition
responding to MJO. Typically, MISR only samples about 5 d         during the 20th century (Brahney et al., 2019; Cattle, 2016).
during each MJO phase group (phases 1–2, 3–4, 5–6, and            The modulation of land use on dust emission and transport
7–8) per dust season (September to February) over most pix-       from Australia may also be quantified and compared with
els in Australia. Furthermore, the retrieval of the dust–smoke    natural drivers through future Earth system modeling.
mixtures, typically present over the southeastern shrublands
and grasslands in Australia, is subject to huge uncertainty in
the operational MISR aerosol product (Garay et al., 2020;         Code and data availability. The MODIS Deep Blue aerosol prod-
Kahn et al., 2010). Therefore, MISR cmAOD and nsAOD               ucts were acquired from the Level-1 and Atmosphere Archive and
are analyzed here only to support the reliability of MODIS        Distribution System (LAADS) Distributed Active Archive Center
DOD in representing dust activity. Overall, the optimal spa-      (DAAC), located at the Goddard Space Flight Center in Greenbelt,
                                                                  Maryland (https://ladsweb.modaps.eosdis.nasa.gov/; Wolfe, 2021).
tial and temporal coverage of MODIS aerosol products with
                                                                  The MISR aerosol products were acquired from the NASA Lan-
an over 20-year record warrant its application for studying
                                                                  gley Research Center Atmospheric Science Data Center (https:
the spatiotemporal variations and environmental drivers of        //l0dup05.larc.nasa.gov/cgi-bin/MISR/main.cgi; Kusterer, 2021).
global aerosol loads.                                             The AERONET coarse-mode aerosol optical depth data were
   The current analysis on the connection between environ-        downloaded from https://aeronet.gsfc.nasa.gov (Holben, 2021). The
mental factors, such as LAI, soil moisture, wind, and precip-     NCDC Integrated Surface Hourly Database was accessed from ftp:
itation, and ENSO and MJO leads to the hypothetical mech-         //ftp.ncdc.noaa.gov/pub/data/noaa/ (National Centers for Environ-
anisms underlying the identified modulation of ENSO and           mental Information, 2021a). NOAA CPC precipitation data were
MJO on Australian dustiness. We hypothesize that the dry          provided by the NOAA/OAR/ESRL PSD, Boulder, Colorado, USA,
soils and diminished vegetation resulting from the El Niño-       from their website at https://psl.noaa.gov/data/gridded/data.cpc.
induced rainfall reduction provide favorable conditions for       globalprecip.html (Physical Sciences Laboratory, 2021). NOAA
                                                                  CDR leaf area index was downloaded from https://data.nodc.
dust emission during the subsequent season; the enhanced
                                                                  noaa.gov/cgi-bin/iso?id=gov.noaa.ncdc:C00898 (National Centers
convective activity and strengthened surface wind during
                                                                  for Environmental Information, 2021b). ESACCI soil moisture
MJO phases 3–6 likely triggers more dust emission and ex-         data were download from https://www.esa-soilmoisture-cci.org/
treme dust events across southeastern Australia during the        node/238 (European Space Agency and Technische Universität
El Niño-associated dry years, thereby amplifying ENSO’s           Wien (TUW), 2021). The Australian near-surface wind speed data
modulation on dust emission. Under the hypothesized mech-         were downloaded from https://data.csiro.au/collections/collection/
anism, we expect more pronounced MJO enhancement of               CI38391 (McVicar, 2021). The code used in this work can be ob-
ENSO’s modulation on dust following El Niño than La Niña          tained from the corresponding author.
conditions. One explanatory hypothesis for this relation-
ship builds partly on the occurrence of haboob dust storms
and their connection with MJO-induced anomalies in deep           Supplement. The supplement related to this article is available on-
convection over southeastern Australia. An alternative hy-        line at: https://doi.org/10.5194/acp-21-8511-2021-supplement.
pothesis relies on the supply of sediments by MJO-induced
storms and their resulting occasional flooding. Our results
shed light on a potential linkage between extreme precip-         Author contributions. YY conceived the study, analyzed the data,
                                                                  and wrote the manuscript with contributions from PG. PG retrieved
itation and enhanced dust emission in Australia. These al-
                                                                  the MODIS DOD data from MODIS Deep Blue aerosol products.
ternatives motivate further evaluation of these hypothesized
mechanisms underlying the modulation of ENSO and MJO
on dust emissions across Australia in an Earth system model.
Furthermore, the current hypotheses regarding the influence

Atmos. Chem. Phys., 21, 8511–8530, 2021                                             https://doi.org/10.5194/acp-21-8511-2021
You can also read


