Consciousness and Cognition
←
→
Page content transcription
If your browser does not render page correctly, please read the page content below
Consciousness and Cognition 89 (2021) 103087
Contents lists available at ScienceDirect
Consciousness and Cognition
journal homepage: www.elsevier.com/locate/concog
What is the relationship between Aphantasia, Synaesthesia
and Autism?
C.J. Dance a, *, M. Jaquiery b, D.M. Eagleman c, D. Porteous d, A. Zeman e, J. Simner a
a
School of Psychology, University of Sussex, BN1 9QJ, UK
b
Department of Experimental Psychology, University of Oxford, OX2 6GG, UK
c
Department of Psychiatry & Behavioral Sciences, Stanford University School of Medicine, 94305, USA
d
Centre for Genomic & Experimental Medicine Institute of Genetics & Molecular Medicine, University of Edinburgh, EH4 2XU, UK
e
College of Medicine and Health, University of Exeter, EX1 2LU, UK
A R T I C L E I N F O A B S T R A C T
Keywords: For people with aphantasia, visual imagery is absent or markedly impaired. Here, we investigated
Aphantasia the relationship between aphantasia and two other neurodevelopmental conditions also linked to
Synaesthesia imagery differences: synaesthesia, and autism. In Experiment 1a and 1b, we asked whether
Autism
aphantasia and synaesthesia can co-occur, an important question given that synaesthesia is linked
Mental imagery
to strong imagery. Taking grapheme-colour synaesthesia as a test case, we found that synaesthesia
Generation Scotland
can be objectively diagnosed in aphantasics, suggesting visual imagery is not necessary for syn
aesthesia to occur. However, aphantasia influenced the type of synaesthesia experienced
(favouring ‘associator’ over ‘projector’ synaesthesia - a distinction tied to the phenomenology of
the synaesthetic experience). In Experiment 2, we asked whether aphantasics have traits asso
ciated with autism, an important question given that autism – like aphantasia – is linked to weak
imagery. We found that aphantasics reported more autistic traits than controls, with weaknesses
in imagination and social skills.
1. Introduction
When asked to imagine a sunset, most people can create a picture of the scene within their mind’s eye, as a visual mental image.
People with aphantasia lack this ability (no clear ‘mental picture’ in the mind) even though they can describe what a sunset looks like
(Zeman, Dewar, & Della Sala, 2015). Scientists have known for at least 100 years that some individuals do not experience visual
imagery (Galton, 1880) but aphantasia has only recently has entered mainstream research (e.g., Jacobs, Schwarzkopf, & Silvanto,
2018; Keogh & Pearson, 2018; Zeman et al., 2015; Zeman et al., 2020). The present study adds to this body of literature by investi
gating the relationship between aphantasia and two other neurodevelopmental conditions, synaesthesia and autism spectrum conditions
(henceforth, autism). As we shall see below, synaesthesia has been linked with higher-than-average mental imagery (e.g., Barnett &
Newell, 2008; Price, 2009; Spiller, Jonas, Simner, & Jansari, 2015), raising the question of whether people with aphantasia can
experience synaesthesia at all. In contrast, autism has been linked with poor imagery (or at the very least, with poor imagination - a
distinction we will elaborate on below) raising the question of whether aphantasia and autism might overlap in some way. We present
two studies testing these ideas, but begin with a brief overview of key concepts.
* Corresponding author.
E-mail address: c.dance@sussex.ac.uk (C.J. Dance).
https://doi.org/10.1016/j.concog.2021.103087
Received 1 September 2020; Received in revised form 1 January 2021; Accepted 17 January 2021
Available online 3 February 2021
1053-8100/© 2021 Elsevier Inc. All rights reserved.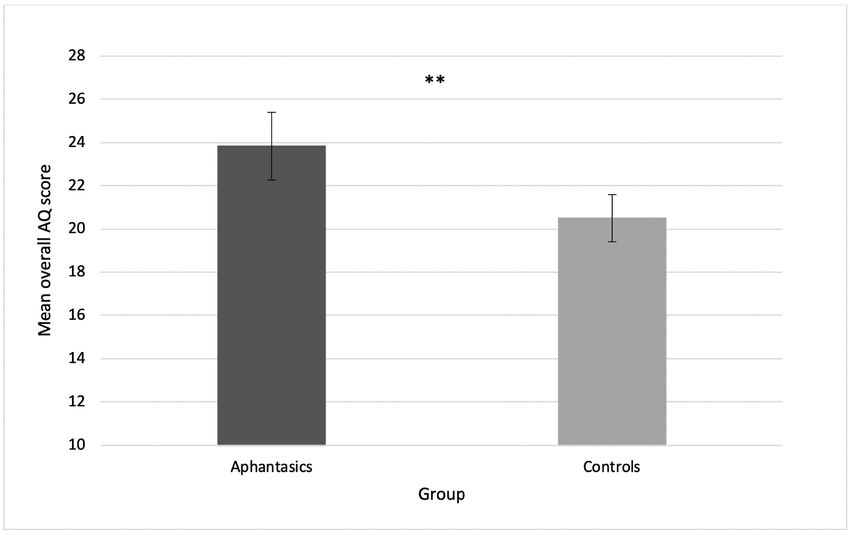
C.J. Dance et al. Consciousness and Cognition 89 (2021) 103087
Aphantasia is most often a congenital or life-long condition, in which individuals experience an absence of visual imagery, or
imagery that is only vague or dim (Zeman et al., 2015). Previous prevalence estimates for aphantasia range from 0.7% (Zeman et al.,
2020) to 2.1% (Faw, 2009) and 6.7% (Betts, 1909) for individuals with no mental imagery at all, but are as high as 10–11% or 15.3%
(Faw and Betts respectively) for imagery that is either absent or dim/vague. Since visual imagery has been linked to a number of
aspects important in everyday life (e.g., autobiographical memory recall; short term memory recall; task-oriented motivation; Keogh &
Pearson, 2014; Schacter & Addis, 2007; Vasquez & Buehler, 2007), it may seem surprising that many aphantasics live their lives
without knowing they are different (Watkins, 2018; Zeman, Dewar, & Della Sala, 2016). However, some aphantasics describe problems
with autobiographical memory and face recognition (Zeman et al., 2020), and the condition may have implications for visual pro
cessing strategies and even career choices (e.g., aphantasics are less likely to enter the arts, and more likely to work in science and
maths; Zeman et al., 2020). In the current study we will further investigate the implications of aphantasia, asking whether it is related
to two other conditions: autism and synaesthesia. We explore these conditions in particular because they too have potentially atypical
imagery phenomenology, and this raises questions about how they might intersect with aphantasia.
Synaesthesia is a neurodevelopmental trait in which the senses intermingle (e.g., Simner, 2019; Simner & Hubbard, 2013). For
example, listening to music can trigger the experience of colours for sound-colour synaesthetes (Ward, Huckstep, & Tsakanikos, 2006) or
tastes in the mouth for sound-taste synaesthetes (Beeli, Esslen, & Jäncke, 2005), while sequence-space synaesthetes think about time units
and other sequences (letters, numbers) in spatial patterns (e.g., the synaesthete might feel that days unfold in a zigzag line across the
visual field, or that calendar months wrap around the body; e.g., Havlik, Carmichael, & Simner, 2015). Here, we focus on a variant of
synaesthesia known as grapheme-colour synaesthesia, in which colours are triggered by numbers or letters (Meier & Rothen, 2013;
Simner, Glover, & Mowat, 2006; Simner, Mulvenna, et al., 2006; Ward, Simner, & Auyeung, 2005). This variant is relatively common
(affecting 1.1–1.5% of people; Carmichael, Down, Shillcock, Eagleman, & Simner, 2015; Simner & Carmichael, 2015; Simner, Mul
venna, et al., 2006), easily diagnosed (e.g., Eagleman, Kagan, Nelson, Sagaram, & Sarma, 2007), and the best understood synaesthesia
to date (Simner, 2019). Important to our purposes here, researchers have suggested that heightened visual imagery may be required for
experiencing synaesthesia generally (Barnett & Newell, 2008; Price, 2009). This means that aphantasics, due to their absence of visual
imagery, may be less likely to experience synaesthesia – or indeed, unable to experience it at all. In our study we therefore ask whether
synaesthesia (associated with high imagery) is precluded in those with aphantasia (associated with low imagery), or if not, whether it
influences the type of synaesthesia experienced (e.g., does a less vivid synaesthesia result?). We briefly review the literature linking
synaesthesia with imagery below.
Links between synaesthesia and imagery have been found in multiple domains. Grapheme-colour synaesthetes, for example, score
significantly higher than controls on visual imagery measures such as the Vividness of Visual Imagery Questionnaire (VVIQ; Marks, 1973)
(Barnett & Newell, 2008; Chiou, Rich, Rogers, & Pearson, 2018), Verbalizer-Visualizer Questionnaire (Richardson, 1978) (Kirby, Moore,
& Schofield, 1988; see Meier & Rothen, 2013), Sussex Cognitive Styles Questionnaire (Imagery sub-scale; Mealor, Simner, Rothen, Car
michael, & Ward, 2016), and the French Questionnaire on Mental Imagery-51 (FQMI-51; Chun & Hupé, 2016). Indeed, synaesthetes
report higher imagery than controls across multiple sensory modalities, and especially for modalities involved in their synaesthesia (e.
g., higher taste imagery for people with synaesthetic tastes; Spiller et al., 2015). Chiou et al. (2018) have recently backed up these self-
reports with a binocular rivalry test. Grapheme-colour synaesthetes showed stronger priming than controls when asked to imagine a
colour that subsequently appeared in the display. The degree to which the imaged colour becomes dominant in the rivalry reflects
strength of visual imagery (Pearson, 2014; Pearson, Clifford, & Tong, 2008; Pearson, Rademaker, & Tong, 2011) and indeed,
aphantasic individuals do not show this priming effect (Keogh & Pearson, 2018). Grapheme-colour synaesthetes are also faster than
controls when making decisions about letters held in mind as a visual image (Spiller & Jansari, 2008). Some have even gone as far as to
suggest that synaesthesia may be nothing more than imagery itself: Price (2009) proposed that heightened imagery may simply allow
certain individuals to become aware of naturally occurring cross-modal associations held by all people (e.g., associations between
space and time, triggering ‘sequence-space synaesthesia’; Price, 2009). Either way, this body of research claims that vivid visual
imagery plays a pivotal role in the development of synaesthesia (see Ward, 2019 for a discussion). If true, this would suggest aphantasic
individuals may be less likely to experience synaesthesia – or may not be able to experience synaesthesia at all.
An alternative view is that heightened imagery in synaesthesia may be simply a referral bias. Simner (2013) pointed out that most
studies have tended to test self-referred synaesthetes (who have made some effort to reach out to researchers), and it may be precisely
those synaesthetes with the strongest imagery (i.e., most intense synaesthesia) who self-refer. Support comes from studies that have
failed to show superior self-reported visual imagery in some cohorts of synaesthetes (Seron, Pesenti, Nöel, Deloche, & Cornet, 1992;
Spiller & Jansari, 2008; Ward et al., 2018) and that heightened imagery seems to emerge only in synaesthetes who are most aware of
their synaesthesia (Ward et al., 2018). Simner (2013) therefore suggests that enhanced visual imagery may be a characteristic of
certain synaesthetes (e.g., those who self-refer) but not others. A recent study by Brang and Ahn (2019) sought to eliminate the bias of
self-referred synaesthetes, by screening a general population sample for synaesthesia, and using a double-blind recruitment in which
neither participant nor researcher knew who were the target group. As a consequence, their grapheme-colour synaesthetes were no
different to controls in their imagery vividness (measured by the VVIQ) although they did still differ in how often they used imagery
(measured by the Subjective Use of Imagery Scale, SUIS; Reisberg, Pearson, & Kosslyn, 2003). Another recent study also sought to
eliminate the self-referral bias, again by screening for synaesthesia in the general population (rather than asking synaesthetes to come
forward). Spiller, Harkry, McCullagh, Thoma, and Jonas (2019) found that scores in a test assumed to identify grapheme-colour
synaesthetes (or synaesthesia-like behaviour) did correlate with scores in a test assumed to tap mental imagery (’Animal Tails Test’;
Farah, Levine, & Calvanio, 1988). However, we suggest here that neither test may have met its intended goal: the test for
grapheme-colour synaesthesia was successfully passed by 24% of their sample (instead of the known synaesthesia prevalence of
1–2%), and their test for mental imagery – although widely accepted as such – can be performed just as well by aphantasics (who have
2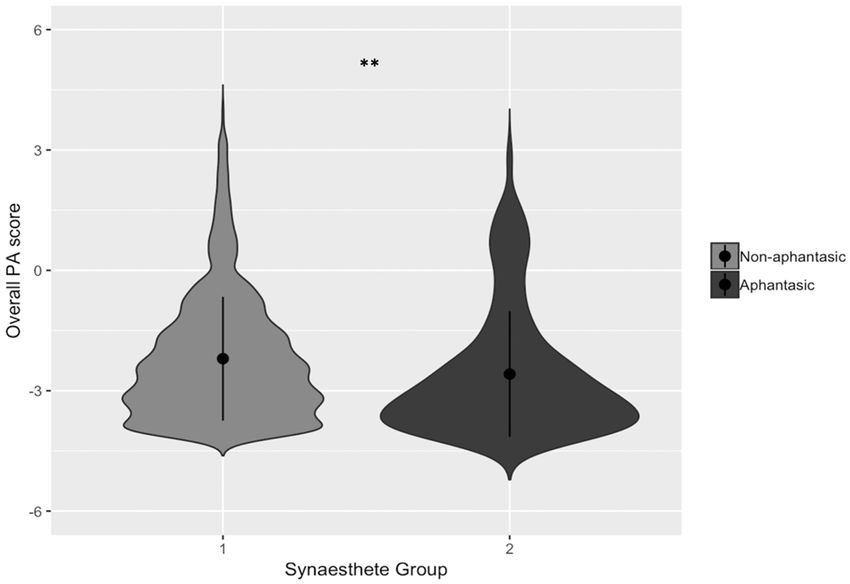
C.J. Dance et al. Consciousness and Cognition 89 (2021) 103087
no imagery) as by controls (Milton et al., 2020; Zeman et al., 2010)1. From this brief literature review it seems evident that the
relationship between visual imagery and synaesthesia is somewhat complex and remains unclear. We note here that if synaesthesia
were not causally linked to heightened imagery, we would anticipate finding cases of grapheme-colour synaesthesia in aphantasic
individuals (and vice versa). Alternatively, if high imagery is necessary for synaesthetes, we would expect synaesthesia in aphantasic
individuals to be absent.
A related hypothesis is that aphantasia might influence the type of synaesthesia experienced. This hypothesis is built on the
distinction between ‘projector synaesthetes’ and ‘associator synaesthetes’ (Dixon, Smilek, and Merikle, 2004). For projectors, syn
aesthetic colours feel like part of the outside world (e.g., projected onto the written typeface in grapheme-colour synaesthesia). For
associator synaesthetes, colours are less ‘veridical’, often feeling internal to the body (e.g., appearing in the ‘mind’s eye’) or are simply
“known” in some intrinsic way (Ward, Li, Salih, & Sagiv, 2006). The projector-associator distinction has been supported by neuro
scientific measures (projectors have greater white matter coherence in inferior temporal cortex than associators; Rouw & Scholte,
2007), and behavioural measures (i.e., projectors are faster to name synaesthetic colours when viewing coloured graphemes, while
associators are faster to name text-colour; Dixon et al., 2004; Ward, Li, et al., 2006). Simner (2013) has suggested that this projector-
associator distinction may rely on imagery differences, in that projectors may simply be synaesthetes who – aside from synaesthesia –
happen to have high mental imagery. Simner (2013) suggests their high imagery may allow synaesthesia to become ‘scene-like’ to an
extreme extent. Supporting this hypothesis, Amsel, Kutas and Coulson (2017) showed that self-reported visual imagery is higher in
projectors than associators (using the Object-Spatial Imagery and Verbal Questionnaire; Blazhenkova & Kozhevnikov, 2009) and that
projectors show neurological markers of heightened imagery (i.e., larger lateral occipital N170 responses and smaller P1 event-related
potentials to visual stimuli compared to associators; see Ganis & Schendan, 2008; Hirschfeld, Feldker, & Zwitserlood, 2012). In
summary, this body of literature proposes two ideas in parallel: that synaesthesia requires high mental imagery, and that projector
synaesthetes have higher imagery than associators. Here we directly test these ideas using people with aphantasia. We hypothesise that
having aphantasia may preclude having synaesthesia, or if it does not, it may make synaesthetes more likely to be associators than
projectors.
Our final hypothesis relates to the relationship between aphantasia and autism, another neurodevelopmental condition with links
to imagery. People with autism show a range of developmental differences, for example, in social processing, communication, sensory
sensitivity, and – importantly for us – deficits in imagination (American Psychiatric Association, 2013). For example, children with
autism engage less in imaginative behaviour such as pretend play (Baron-Cohen, 1987; Davis, Simon, Meins, & Robins, 2018; Jarrold,
Boucher, & Smith, 1996) and have deficits in imaginative drawing (Low, Goddard, & Melser, 2009; Scott & Baron-Cohen, 1996; Ten
Eycke & Müller, 2014). Although visual imagery and imagination are in many ways distinct concepts, they are often confused or seen
as inter-changeable (Arcangeli, 2020; Faw, 2009; Thomas, 1999) perhaps especially by people with high visual imagery themselves.
Nonetheless, people with aphantasia can use their imagination without having any visual imagery at all2, as evidenced by writers and
artists with aphantasia (Zeman et al., 2019). Nonetheless, there may yet be a relationship between visual imagery and imagination
more broadly. For example, González, Campos, and Pérez (1997) found a positive correlation between scores on The Torrance Tests of
Creative Thinking (in verbal and figural creative thinking; Torrance & Ball, 1992) and conventional mental imagery tasks (The Spatial
Test of Primary Mental Abilities and The Gordon Test of Visual Imagery Control; Richardson, 1969; Thurstone & Thurstone, 1989).
Similarly, when participants are asked to imagine future events, their visual imagery (in the VVIQ; Marks, 1973) predicts the amount of
sensory, spatial, and emotional information described, as well as the personal importance and significance of the event (D’Argembeau
& Van der Linden, 2006). Important for our purposes, the highly influential questionnaire for traits associated with autism (the Autism
Spectrum Quotient; AQ; Baron-Cohen, Wheelwright, Skinner, Martin, & Clubley, 2001), contains a question asking about the strength of
visual imagery within its ‘imagination’ subscale. This shows that deficits in visual imagery are directly captured by assessments of
autism (albeit under the ambiguous heading of ‘imagination’). Here, we therefore investigate whether aphantasia and autism may be
linked, through some weak visual imagery ability.
In contrast to the above research, other studies have questioned whether there is any link between autism and low visual imagery at
all. Hughes et al. (2018) found no difference between autistic participants and controls in the ‘Imagery Ability’ subscale of the Sussex
Cognitive Styles Questionnaire (SCSQ; Mealor, Simner, Rothen, Carmichael, & Ward, 2016), and indeed other research shows that people
with higher AQ scores find it easier (not harder) to judge the ‘imageability’ of words (e.g., does ‘blush’ lend itself to a visual picture
more easily than ‘hypothesis’?; Esposito, Dellantonio, Mulatti, & Job, 2016). Other research too shows the cognitive style in autism of
‘thinking in pictures’, which may point to elevated imagery in autistic individuals (e.g., Kana, Keller, Cherkassky, Minshew, & Just,
2006; Kunda & Goel, 2008, 2011; Soulières, Zeffiro, Girard, & Mottron, 2011). Overall, the relationship between visual imagery and
1
In this task (Animal Tails Test; Farah, Levine, & Calvanio, 1988), participants imagine an animal and state whether its tail is ‘short’ or ‘long’. This
was devised as a test of mental imagery although we now know it is entirely possible to perform this task without any imagery at all (aphantasics
perform well, and use instead their intact visual memory and visual semantic knowledge). We direct the reader to debates on how scientists use their
own imagery abilities to direct their science (Reisberg et al., 2003), which may have played a role in devising this test.
2
The final author of this paper has aphantasia, but reports no trouble whatsoever imagining any event, hypothetical or real. (For her, imagination
is a sense of ‘knowing’ rather than ‘seeing’). She scores highly on traits related to imagination (e.g., she is high on Openness to Experience; McCrae &
Costa, 1987) and scored highly throughout schooling on imaginative activities such as creative writing. However, when imagination is conflated
with visual imagery (e.g., in questionnaires asking about the vividness of mental images) she scores poorly. In this sense, imagery and imagination
are unrelated. However, there may yet be ‘hidden’ links between the two (e.g., it is theoretically possible that some elements of a scene might be
more difficult to imagine in the absence of mental imagery). We explore these hidden links here.
3
C.J. Dance et al.                                                                                       Consciousness and Cognition 89 (2021) 103087

autism therefore remains unclear. But if autism is driven, even in part, by a deficit in visual imagery – or if visual imagery deficits are a
consequence of autism – we might predict higher levels of autistic traits in people with aphantasia. This might be especially evident in
the imagination subscale of the AQ (even when its question about visual imagery is removed).
    We therefore present two studies investigating the relationship between aphantasia, synaesthesia and autism. Experiments 1a and
1b explore the interplay between aphantasia and synaesthesia within two separate large-scale samples: (a) members of the general
population recruited from the testing cohort Generation Scotland (www.ed.ac.uk/generation-scotland) (Smith et al., 2013), and (b) a
group of synaesthetes tested via the online platform known as the Synesthesia Battery (www.synesthete.org; Eagleman et al., 2007).
These cohorts are described further below, but we hypothesise that if high visual imagery is related to (or necessary for) synaesthesia,
aphantasia may not co-occur with synaesthesia at all. However, if synaesthesia can exist in the absence of imagery, we may find people
with synaesthesia among those with aphantasia (and vice versa), although synaesthesia might manifest differently (more associator-
traits than projector-traits within aphantasia). In a final Experiment, we investigate the relationship between aphantasia and traits
associated with autism given the possibility of low visual imagery across both aphantasia and autism. We hypothesise that autism traits
may be higher in aphantasics than controls from the general population, and perhaps particularly in the AQ subscale of imagination.

2. Experiment 1a: Can synaesthesia and aphantasia co-occur?

   In this study we screened over a thousand members of the general population for both synaesthesia and aphantasia. Both conditions
are relatively rare, so we designed our recruitment materials to attract as many cases as possible; i.e., we explicitly described both
conditions within our invitation to participate. This was designed to maximise the number of cases for us to examine, but also means
that our prevalences of synaesthesia or aphantasia cannot be taken as population-wide estimates (and indeed our study was not
designed to be a prevalence count). Importantly, however, our samples can be compared to each other, to ask whether we can find
cases of synaesthesia in a cohort of aphantasics (and vice versa).

2.1. Methods

2.1.1. Participants
    Our participants were 1285 people from the Generation Scotland Scottish Family Health Study cohort (770 female, 515 male) (Smith
et al., 2013). Generation Scotland is a large-scale resource of data available for research purposes (www.ed.ac.uk/generation-
scotland), which includes adult volunteers recruited through primary care services across Scotland (e.g., via General Practices, for
more information on the recruitment process see Smith et al., 2006). As part of the Generation Scotland project, the Scottish Family
Health Study (GS:SFHS; Smith et al., 2013) collected genetic and health data for a cohort of over 20,000 of these volunteers. Some of the
participants consented to re-contact in the event of further studies, and approximately 6000 of these also provided email addresses.
This allowed us to recruit a sample of participants from these volunteers via email to take part in the present study. Participants were
asked to complete a series of questions and tasks online to investigate ‘health, minds and bodies of the people of Scotland’. Both
imagery and synaesthesia were mentioned explicitly in recruitment.
    Four additional participants (2 female, 1 male, 1 other) were excluded because they did not complete the imagery component of our
test. In our final sample of 1285 participants, age was not specified but all were 18 years or older. As compensation for taking part,
participants were entered into a prize draw for £100.

2.1.2. Materials and procedure
    Participants were contacted via email and provided with a URL link to our online study. The study contained the following two
measures in the order shown below. These were embedded among other measures to be reported elsewhere. Individuals provided
informed consent prior to testing, and ethical approval was provided by the University of Sussex Cross-Schools Science and Technology
Ethics Board, and ethical approval for the GS:SFHS study was obtained from the Tayside Committee on Medical Research Ethics (on behalf
of the National Health Service).
    Visual Imagery Questionnaire. We measured visual imagery using an in-house task (see Fig. 1), in which we asked participants to
think about the building where they lived. Participants were asked to rate ‘how much your memory of it is like a picture’. Participants
responded with one of five responses (ranging from 0 – ‘I have no image or picture at all and I don’t know what it looks like’, to 5 – ‘I
have an image like a picture that is perfectly clear and vivid – just as if I were really standing there’; see Fig. 1 for all response options).
In line with previous research showing that aphantasic individuals rate their visual imagery as absent or vague/dim (Keogh & Pearson,
2018; Zeman et al., 2015), participants were classified as aphantasic if they responded in the range of 0–2 (i.e., rating their imagery as
‘no image at all’, or ‘vague or fleeting or dim’).3
    Grapheme-colour synaesthesia diagnostic. We tested only one variant of synaesthesia to limit the burden on our participants
(and we selected grapheme-colour synaesthesia in particular for the reasons given in the Introduction). We diagnosed grapheme-colour
synaesthesia by using the ‘gold standard’ diagnostic (Eagleman et al., 2007), which we replicated to host on our local server. This
diagnostic is the most widely used scientific assessment for grapheme-colour synaesthesia worldwide. In the first part of the test,
participants are asked to indicate whether they believe they experience grapheme-colour synaesthesia (“Do numbers or letters cause

 3
    We did not use longer imagery questionnaires (e.g., VVIQ) because our participants were time-restricted, given other measures in the same
battery. We return to this issue in Experiment 1b.

                                                                       4
C.J. Dance et al. Consciousness and Cognition 89 (2021) 103087
Fig. 1. The visual imagery question used to classify aphantasia within the Generation Scotland sample.
you to have a colour experience?”). Participants not reporting grapheme-colour synaesthesia are shown to an exit page (and can then
complete the other parts of the test). Participants reporting grapheme-colour synaesthesia are subsequently given an objective
diagnostic test to verify their self-report. In this test, participants are identified as synaesthetes if they demonstrate the known
characteristic of consistency-over-time (i.e., for genuine synaesthetes, associations tend to stay the same over time; e.g., if A is red for any
given synaesthete, it is always red when the synaesthete is repeatedly asked). Hence, in the objective test, participants were presented
with the letters A-Z and the numbers 0–9, each displayed three times in a randomised order. Participants selected their associated
colour for each grapheme using an on-screen colour palette. The test computes the variation in the colours provided for the same
grapheme (e.g., summing the distances between the colours chosen for the three ‘A’ trials). The mean colour variation is then
calculated across all graphemes (for information about the testing interface and other measurement details, see Eagleman et al., 2007).
If this mean colour distance is small, the individual’s synaesthetic colours are consistent (i.e., close in RGB colour space; Eagleman
et al., 2007), with scores lower than 1.43 indicating a diagnosis of synaesthesia (Rothen, Seth, Witzel, & Ward, 2013).
3. Results
3.1. Can aphantasia and synaesthesia co-occur?
We first divided our sample into those with and without aphantasia. Within our total cohort (N = 1285), there were 212 partic
ipants (115 female, 97 male) on the visual imagery question who scored within the aphantasic range (i.e., they scored within the range
of 0–2; M score = 1.33, SD = 0.48). This gives an overall aphantasia prevalence of 16.5%. Here our classification follows prior
literature in defining aphantasics with imagery either vague/dim/fleeting (n71), or completely absent (n141).
We then classified all our participants according to the synaesthesia diagnostic, and found 14 people with grapheme-colour syn
aesthesia (6 female, 8 male), giving an overall synaesthesia prevalence of 1.1%. There were 2 people (both male) with grapheme-
colour synaesthesia within our 212 aphantasic individuals, and 12 people (6 female, 6 male) with grapheme-colour synaesthesia
within our 1073 non-aphantasics. This provides a prevalence of grapheme-colour synaesthesia of 0.9% in aphantasics, and 1.1% in
non-aphantasics (see table 1), which was a non-significant difference (p = 1.00, Fishers Exact Test). Bayes factors (BF) were calculated
(using R version 3.5.1, R Core Team, 2018; BayesFactor version 4.2, Morey & Rouder, 2018) to better understand this null effect. A BF
of 3 is taken as evidence for the alternative hypothesis. We
calculated a BF of 0.022 which provides good evidence in favour of the null hypothesis, suggesting no difference in rates of
5C.J. Dance et al. Consciousness and Cognition 89 (2021) 103087
Table 1
Frequency of grapheme-colour synaesthetes in aphantasic and non-aphantasic groups (displayed as a percentage of each group in brackets) within the
Generation Scotland sample.
Aphantasic (n ¼ 212) Non-aphantasic (n ¼ 1073) Total (n ¼ 1285)
Synaesthete 2 (0.9%) 12 (1.1%) 14 (1.1%)
Non-synaesthete 210 (99.1%) 1061 (98.9%) 1271 (98.9%)
synaesthesia between aphantasics and non-aphantasics.
We next looked at the prevalence of aphantasia in our synaesthete and non-synaesthete groups. There were 2 aphantasics among
our 14 synaesthetes (2 male), and 210 aphantasics among our 1271 non-synaesthetes (115 female, 95 male). This gives an aphantasia
prevalence of 14.3% in the synaesthete group, and 16.5% in the non-synaesthete group – again a non-significant difference (p = 1.00,
Fishers Exact Test) with a BF of 0.022, again supporting the null hypothesis. Overall, our results suggest that high imagery is therefore
not a pre-requisite of synaesthesia, and that is possible to have synaesthesia with little or no imagery at all. Finally we found that mean
imagery scores for synaesthetes (M = 3.86; SD = 1.46) and non-synaesthetes (M = 3.84; SD = 1.30) were statistically equivalent, (t
(13.23) = − 0.047, p = .963, d = 0.01, 95% CI [− 0.86, 0.83], BF = 0.27), following others (e.g., Seron et al., 1992; Spiller & Jansari,
2008; but see also Barnett & Newell, 2008; Chiou et al., 2018; Ward et al., 2018).
4. Discussion
Our two key results were that grapheme-colour synaesthesia can indeed exist within people with aphantasia, and it is no less
prevalent in aphantasics versus non-aphantasics. Rates of grapheme-colour synaesthesia in aphantasics (0.9%) and non-aphantasics
(1.1%) were statistically equivalent, and reflective of the prevalence of grapheme-colour synaesthesia in the general population
(1.1–1.5%; Carmichael, Down, Shillcock, Eagleman, & Simner, 2015; Simner & Carmichael, 2015; Simner, Mulvenna, et al., 2006).
Rates of aphantasia were also statistically equivalent across synaesthetes (14.3%) and non-synaesthetes (16.5%), and again largely
reflective of other estimates (e.g., Betts, 1909). Importantly, our overall group-sizes were small. In other words, despite screening over
a thousand participants, our groups of synaesthetes with and without aphantasia were 2 and 12 respectively. We therefore sought to
replicate our finding in Experiment 1b, with a larger sample of synaesthetes. We also sought to improve on our methodology: in
Experiment 1a we evaluated aphantasia using a single question, while in Experiment 1b we will use the full Vividness of Visual Imagery
Questionnaire 2 (VVIQ-2; Marks, 1995). This change can allow us to have more confidence in our assessments of aphantasia. In testing
larger samples in Experiment 1b, we also asked an additional question: does aphantasia influence the type of synaesthesia experienced
(projector or associator synaesthesia; see below)?
5. Experiment 1b: Can synaesthesia and aphantasia co-occur (a replication)? Does aphantasia influence the type of
synaesthesia experienced?
In this study we recruited far larger numbers of synaesthetes by examining data from the largest international online destination for
synaesthetes: The Synesthesia Battery is a standardised collection of tests and questionnaires for assessing synaesthesia and related
phenomenology (Eagleman et al., 2007). The battery includes the gold-standard consistency test for objectively diagnosing grapheme-
colour synaesthesia cloned in Experiment 1a, as well as questionnaires to assess the type of synaesthesia experienced (e.g., the Pro
jector-Associator (PA) Questionnaire; Rouw & Scholte, 2007). The battery also includes a questionnaire to measure visual imagery
(VVIQ-2; Marks, 1995). Using these three elements of the Synesthesia Battery, we aim to replicate our results from Experiment 1a
(synaesthesia occurring equally in aphantasics, and non-aphantasics, and vice versa), but also predict that people with aphantasia may
tend to have a different variant of synaesthesia (i.e., more associator-like than people without aphantasia).
5.1. Methods
5.1.1. Participants
Our participants were 16,246 individuals who had taken the Synesthesia Battery between 2007 and 2018. Participants had a mean
age of 29.11 years (SD = 11.76), and were predominantly female (77.2%; i.e., 12,539 female; 3482 male; 225 ‘other’). This female bias
does not reflect an underlying epidemiological fact (see Simner & Carmichael, 2015; Simner, Mulvenna, et al., 2006) but likely the
well-known finding that women participate in online surveys more often than men (Smith, 2008). Participants navigated to the website
(www.synesthete.org) via various means: some located it by internet searches about synaesthesia, and others were directed by a range
of synaesthesia researchers, since this testing portal is the most widely used diagnostic tool in the field of synaesthesia.
5.1.2. Materials and procedure
Participants completed three measures: (a) the objective assessment for grapheme-colour synaesthesia, (b) the Projector-Associator
(PA) Questionnaire (Rouw & Scholte, 2007), designating any synaesthete as either an associator or projector, and (c) a visual imagery
questionnaire (VVIQ-2; Marks, 1995), which allows us to assess participants for aphantasia. Details of these tests are given below. All
participants provided informed consent prior to taking part, and ethical approval for this study came from the University of Sussex Cross-
Schools Science and Technology Ethics Committee, and the ethics board at Baylor College of Medicine.
6C.J. Dance et al. Consciousness and Cognition 89 (2021) 103087
Grapheme-colour synaesthesia diagnostic. Details of the diagnostic for grapheme-colour synaesthesia are given in Experiment
1a. Unlike Experiment 1a however, which replicated the diagnostic tool and hosted it on a server at the University of Sussex, in the
current study the site was hosted at the online international meeting place for synaesthetes: www.synesthete.org.
PA questionnaire (Rouw & Scholte, 2007). This questionnaire distinguishes projector synaesthetes from associator synaesthetes.
All participants were given this test, irrespective of how they performed in the diagnostic above (but our results will focus on scores
from those ultimately diagnosed as synaesthetic). Participants indicated the degree to which they agreed with 10 statements about
their synesthetic experiences (on a scale of 1 – ‘Strongly disagree’, to 5 – ‘Strongly agree’). Half the statements captured the experiences
of projectors (e.g., “When I look at a certain letter/number, the synesthetic colour appears somewhere outside my head (such as on the
paper)”), and half captured the experiences of associators (e.g., “When I look at a certain letter/number, the accompanying colour
appears only in my thoughts and not somewhere outside my head (such as on the paper)”). In line with standard procedure (Eagleman
et al., 2007; Rouw & Scholte, 2007), an overall PA score was generated by subtracting the mean score for the associator questions from
the mean score for the projector questions. Associators were classified by scoring below 0, and projectors by scoring above 0. The
original questionnaire also contained two additional items which we removed because they did not appear to adequately distinguish
projectors from associators (“When I look at a certain letter or number, I see a particular colour”, and “The colour has the same shape as
the letter/number”).
VVIQ-2 (Marks, 1995). Within this questionnaire, participants were asked to think of a series of eight scenarios (e.g., “A country
scene …”). Participants had to rate “the picture that comes before your mind’s eye” for four aspects per scenario (e.g., “The contours of
the landscape”). Ratings were given on a scale of 1–5 as follows: 1 – ‘No image at all, you only “know” that you are thinking of the
object’; 2 – ‘Vague and dim’; 3 – ‘Moderately clear and vivid’; 4 – ‘Clear and reasonably vivid’; and 5 – ‘Perfectly clear and as vivid as
normal vision’. The questionnaire was scored by summing responses to all 32 questions, giving possible scores in the range of 32–160.
In line with previous research showing that aphantasic individuals rate their visual imagery as absent or vague/dim (Keogh & Pearson,
2018; Zeman et al., 2015), aphantasics were classified by scoring between 32 and 64 on the VVIQ-2 (where a score of 32 indicates no
imagery at all, and a score of 64 represents rating all items as ‘vague and dim’).
6. Results
6.1. Can aphantasia and synaesthesia co-occur?
We first divided our sample into those with and without aphantasia so we could compare rates of synaesthesia across each group.
Here we classified aphantasics as those scoring ≤64 on the VVIQ-2, again in line with aphantasics rating their imagery is absent, vague
or dim within prior literature. Within the total sample (16,246), there were 196 people (M age = 28.03, SD = 11.49; 145 female, 49
male, 2 other) with a VVIQ-2 ≤ 64 (M score = 52.76, SD = 10.36), giving an overall aphantasia prevalence of 1.2%. We next considered
the synaesthesia diagnostic, and found 12,589 people with grapheme-colour synaesthesia overall (M age = 28.62, SD = 11.36; 9844
female, 2572 male, 173 other). There were 144 synaesthetes among our 196 aphantasics (M age = 27.24, SD = 11.42; 104 females, 38
males, 2 other), and there were 12,445 synaesthetes among our 16,050 non-aphantasics (M age = 28.63, SD = 11.36; 9740 females,
2534 males, 171 other). This provides a prevalence for grapheme-colour synaesthesia of 73.5% in aphantasics, and 77.5% in non-
aphantasics (see Table 2), a difference that was non-significant [χ2 (1, N = 16246) = 1.61, p = .204; chi-square test with Yates
continuity correction] (NB. the percentage of synaesthetes is high because synaesthetes are a priori attracted to this website, but our
values can be meaningfully compared to each other4). We calculated a BF of 0.018 which provides good support for the null hy
pothesis, suggesting there is no difference in rates of synaesthesia in aphantasics and non-aphantasics.
We next looked at the reverse case: i.e., the prevalence of aphantasia in our synaesthete and non-synaesthete groups. There were
144 aphantasic individuals among our 12,589 synaesthetes (M age = 27.24, SD = 11.42; 104 females, 38 males, 2 other), and 52
aphantasics among our 3657 non-synaesthetes (M age = 30.21, SD = 11.52; 41 females, 11 males). This gives an aphantasia prevalence
of 1.1% in the synaesthete group, and 1.4% in the non-synaesthete group, with no significant difference [χ2 (1, N = 16246) = 1.61, p =
.204; chi-square test with Yates continuity correction]. Again, a BF of 0.018 provides good support for the null hypotheses, providing
evidence for there being no difference in rates of aphantasia in synaesthetes and non-synaesthetes.
Our results replicate our finding from Experiment 1a, showing that high imagery is not a pre-requisite of synaesthesia, and that it is
perfectly possible to have synaesthesia with little or no imagery at all. As an added measure of conservativeness, we can also look for
synaesthesia by splitting aphantasics into those with a small amount of imagery (dim and vague; scoring 64 on the VVIQ-2) versus
4
Both groups also had high imagery, which may be unsurprising since both were self-motivated to navigate to a website to explore the possibility
they had synaesthesia (and awareness of synaesthesia grows with imagery; Ward et al., 2018). Control means were yet higher (M = 124.44; SD =
23.19) than synaesthetes (M = 121.83; SD = 22.49; t(5799.91) = 6.03, pC.J. Dance et al. Consciousness and Cognition 89 (2021) 103087
Table 2
Frequency of grapheme-colour synaesthetes in aphantasic and non-aphantasic groups (displayed as a percentage of each group in brackets) within the
Synesthesia Battery sample.
Aphantasic (n ¼ 196) Non-aphantasic (n ¼ 16,050) Total (n ¼ 16,246)
Synaesthete 144 (73.5%) 12,445 (77.5%) 12,589 (77.5%)
Non-synaesthete 52 (26.5%) 3605 (22.5%) 3657 (22.5%)
those with no imagery whatsoever (scoring 32 on the VVIQ-2). Out of the 21 individuals with ‘dim and vague’ imagery (scoring 64 on
the VVIQ-2), 15 were classified as synaesthetes, and out of the 20 individuals with no imagery at all (scoring 32 on the VVIQ-2), 12
were classified as synaesthetes. There was no difference between these proportions [χ2 (1, N = 41) = 0.195, p = .659; chi-square test
with Yates continuity correction] showing that synaesthesia occurs to the same degree whether aphantasics have little imagery or none
at all. We calculated a BF of 0.90 which provides anecdotal support for there being no difference in the rates of synaesthesia in
aphantasics with weak imagery, compared to absent visual imagery. Importantly, our results show that it is indeed possible to have
synaesthesia with no visual imagery whatsoever.
6.2. Does aphantasia influence the type of synaesthesia experienced? (i.e., are aphantasics more likely to be associators than projectors)?
Next, we examined the PA questionnaire data to categorise synaesthetes as associators or projectors. From the original dataset of
12,589 confirmed synaesthetes, we excluded 476 individuals with incomplete PA data (i.e., 346 individuals who had not attempted the
questionnaire, and 130 who had not finished it), and a further 244 individuals with an overall PA score of 0 (i.e., whose status as
projector vs. associator was unclear). Out of the remaining 11,869 (n = 130 aphantasics, n = 11,739 non-aphantasics), 1073 were
projectors (n = 14 aphantasics, n = 1059 non-aphantasics) and 10,796 were associators (n = 116 aphantasics, n = 10,680 non-
aphantasics). As such, 89.2% of aphantasic synaesthetes were associators, and 10.8% were projectors. A similar result was found in
non-aphantasics: 91.0% of synaesthetes were associators, and 9.0% were projectors. Indeed, there was no significant difference in the
occurrence of associator or projector synaesthesia across groups [χ2 (1, N = 11869) = 0.289, p = .591; chi-square test with Yates
continuity correction]. We then calculated a BF to quantify evidence for this null effect. Our calculated BF of 0.007 provides strong
evidence for there being no difference in the occurrence of projector or associator synaesthesia across aphantasic and non-aphantasic
synaesthetes.
This analysis initially suggests that people with aphantasia have the same proportions of associator/projector synaesthesia as non-
aphantasics. However, this finding required us to make categorical divisions of the PA data to form two groups (associators, pro
jectors). We therefore ask whether a link between aphantasia and associator synaesthesia might emerge by treating scores continu
ously. This is likely to be a more appropriate treatment of the data since Skelton, Ludwig, and Mohr (2009) have suggested that
projector/associator status resides on a continuum, rather than as discrete categorisations. Hence, we investigated whether aphantasic
synaesthetes have lower/more negative PA scores (indicating ‘stronger’ associator traits) than non-aphantasics. As hypothesised, we
found that overall PA scores were indeed significantly lower in aphantasic synaesthetes (i.e., more associator-like; M = − 2.58, SD =
1.57) than in non-aphantasic synaesthetes (M = − 2.20, SD = 1.54; see Fig. 2). This difference was significant in an independent
samples t-test with Welch correction (t(131.79) = 2.78, p = .006, d = 0.25, 95% CI [0.11, 0.66]).
7. Discussion
In Experiment 1b we have investigated visual imagery using the largest sample of synaesthetes to date. We have replicated our
finding from Experiment 1a that synaesthesia can co-occur with aphantasia, thereby showing that visual imagery is not a pre-requisite
for synaesthesia to arise. The prevalence of synaesthesia was again equivalent for both aphantasics and non-aphantasics (and equally,
rates of aphantasia were equivalent in synaesthetes and non-synaesthetes). As expected, rates of synaesthesia were very high in this
sample (73.5% in aphantasics, and 77.5% in non-aphantasics) and far higher than in the general population (i.e., around 1.1–1.5%;
Carmichael et al., 2015; Simner & Carmichael, 2015; Simner, Mulvenna, et al., 2006). This is simply because our testing took place at
an online destination for synaesthetes (i.e., people who visit the Synesthete Battery are already likely to be synaesthetes, by virtue of
their visit). Importantly, however, we can compare the prevalences within our aphantasic and non-aphantasic groups, and in doing so,
we replicate our finding from Experiment 1a. Our results also show that even individuals who report the most extreme experience of
aphantasia (i.e., no visual imagery whatsoever) can still have synaesthesia, indicating that high imagery (or indeed any imagery) is not
a pre-requisite. Nonetheless, we found that low imagery influences the type of synaesthesia experienced: aphantasic individuals re
ported a synaesthesia that was more associator-like (i.e., more negative scores on the PA questionnaire) compared to non-aphantasics.
We return to these issues in our General Discussion.
8. Experiment 2: What is the relationship between aphantasia and autism?
In Experiment 1 a and b, we looked at two conditions traditionally thought to differ in imagery (synaesthesia as high imagery;
aphantasia as low/absent imagery). We now turn our attention to a third neurodevelopmental condition – autism – which has been
linked to low visual imagery (related to weak imagination symptomatology). We investigate here whether aphantasia and autism may
be linked in some way, given their possible shared deficits in visual imagery.
8C.J. Dance et al. Consciousness and Cognition 89 (2021) 103087
Fig. 2. Overall PA questionnaire score distribution and means (with standard deviations) as a function of group (aphantasic synaesthetes vs non-
aphantasic synaesthetes) within the Synesthesia Battery sample. Lower scores represent more associator-like traits. Note. * p < .05, ** p < .01, *** p
< .001.
8.1. Method
8.1.1. Participants
We recruited 118 aphantasics (M age = 38.47, SD = 14.14) and 118 matched controls (M = 37.87, SD = 15.22). Groups were
matched for age (t(234) = − 0.310, p = .757) and gender (aphantasic group: 69 females, 49 males; controls: 66 females, 51 males, 1
other). Aphantasic participants were recruited from two sources: 102 were recruited from the University of Sussex’s Imagery Lab -
Aphantasia Cohort (M age = 39.94, SD = 14.27; 57 females, 45 males), and an additional 16 aphantasics were recruited from the
University of Exeter Eye’s mind database (M age = 29.06, SD = 8.88; 12 females, 4 males). Aphantasics were classified by their scores
on the 16-item VVIQ (Marks, 1973), a shorter version of the VVIQ-2 (Marks, 1995). In line with previous research showing that
aphantasic individuals rate their visual imagery as absent or vague/dim (Keogh & Pearson, 2018; Zeman et al., 2015), aphantasics (M
= 18.50, SD = 3.65) were classified by scoring between 16 and 32 on the VVIQ. The score range for classifying aphantasia is lower in
the VVIQ (16–32) compared to the VVIQ-2 (32–64) simply because the former contains fewer items.
Control participants were recruited from social media, word-of-mouth, Amazon’s MTurk, and the participant recruitment system at
the University of Sussex. Controls were confirmed as non-aphantasic again using the VVIQ (scores > 32, M = 58.49; SD = 13.07). As a
compensation for taking part, MTurk participants were compensated $2 for our 15 min test, undergraduate students received course
credits and non-students were entered for a prize draw of £25.
8.1.2. Materials and procedure
Our aphantasic participants had already completed the VVIQ prior to participating in the present study, as part of their entering our
participant databases. We presented the AQ (and VVIQ for controls) using our online in-house testing platform (www.syntoolkit.org),
and participants completed the study from their own homes. All participants provided informed consent prior to taking part, and
ethical approval was provided by the University of Sussex Cross-Schools Science and Technology Ethics Board.
Autism Quotient (AQ; Baron-Cohen et al., 2001). The AQ measures traits associated with autism. Participants rate how much they
agree with a series of 50 statements on a scale of 1 (‘Definitely agree’) to 4 (‘Definitely disagree’). The questions are divided equally
into five subscales measuring different aspects of autism symptomology: communication (e.g. “I frequently find that I don’t know how
to keep a conversation going”), imagination (e.g. “When I’m reading a story, I can easily imagine what the characters might look like”;
reversed scored), social skills (e.g. “I find it hard to make new friends”), attention switching (e.g. “I prefer to do things the same way
over and over again”) and attention-to-detail (e.g. “I tend to notice details that others do not”). Responses are scored as 0 or 1, where 1
is allocated to responses of “definitely” or “slightly” for behaviours associated with autism (good attention-to-detail, but poor
communication, imagination, social skills, and attention switching). Approximately half of the items are reversed scored. In line with
standardised scoring (Baron-Cohen et al., 2001), scores equal or greater than 32 indicate the possible presence of autism.
9C.J. Dance et al. Consciousness and Cognition 89 (2021) 103087
9. Results
Firstly, we removed an item from the imagination subscale of the AQ which asks directly about visual imagery ability (question 3:
‘If I try to imagine something, I find it very easy to create a picture in my mind’). Since aphantasics would, by definition, score low on
this question due to their lack of visual imagery, it was necessary to remove this question to avoid circularity5. We analysed overall AQ
scores for aphantasics and controls using an independent samples t-test with Welch correction. Aphantasics had higher overall AQ
scores (M = 23.84; SD = 8.57) compared to controls (M = 20.51, SD = 5.98), and this difference was significant (t(209.07) = − 3.46, p
= .001, d = 0.45, 95% CI [− 5.23, − 1.44]). Hence, aphantasic individuals reported significantly more traits associated with autism than
controls (see Fig. 3).
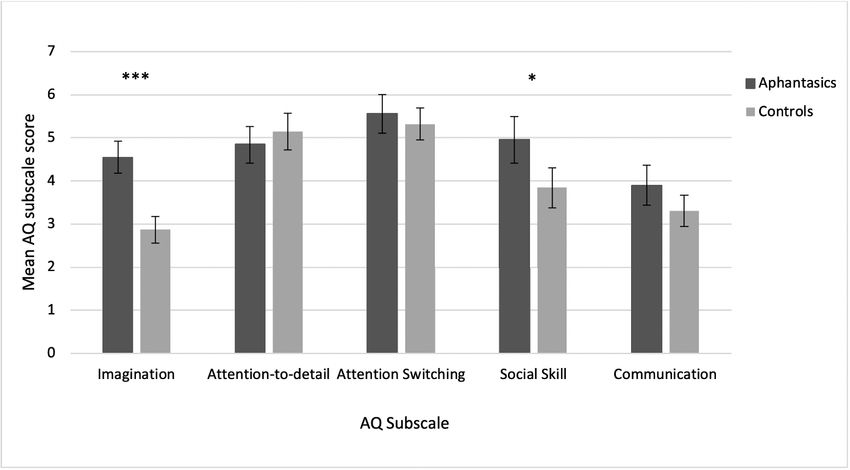
We then conducted a 5 × 2 ANOVA broken down by subscale (imagination, social skills, communication, attention-to-detail,
attention switching) and group (aphantasic, control). There was a main effect of group (F(1, 234) = 11.95, p = .001, η2p = 0.049),
and subscale (F(3.34, 782.54) = 37.15, p < .001, η2p = 0.137; with Greenhouse-Geisser correction), and an interaction between them (F
(3.34, 782.54) = 8.56, p < .001, η2p = 0.035; with Greenhouse-Geisser correction). To investigate our results further, we conducted a
series of planned independent samples t-tests with Welch correction for the AQ sub-scales, and adjusted our p values for (n5) multiple
comparisons using the Bonferroni method. After correction, aphantasics scored significantly higher on the imagination subscale
(indicating ‘less imaginative’; M = 4.55, SD = 2.05) compared to controls (M = 2.87, SD = 1.71; t(226.63) = − 6.83, pcorrected < 0.001, d
= 0.89, 95% CI [− 2.16, − 1.19]). Aphantasics also scored significantly higher on the social skill subscale (indicating poorer social
skills; M = 4.96, SD = 2.97) compared to controls (M = 3.85, SD = 2.56), (t(228.93) = − 3.08, pcorrected = 0.01, d = 0.40, 95% CI [− 1.82,
− 0.40]). There were no significant differences on the remaining three subscales: for communication (aphantasics: M = 3.90, SD =
2.53; controls: M = 3.31, SD = 1.98; t(221.43) = − 1.98, pcorrected = 0.245, d = 0.26, 95% CI [− 1.17, − 0.002]), attention-to-detail
(aphantasics: M = 4.85, SD = 2.34; controls: M = 5.14, SD = 2.32), (t(233.98) = 0.98, pcorrected = 1.65, d = 0.12, 95% CI [− 0.30,
0.89]), and attention switching (aphantasics: M = 5.56, SD = 2.47; controls: M = 5.32, SD = 2.05), (t(226.47) = − 0.80, pcorrected = 2.11,
d = 0.11, 95% CI [− 0.82, 0.34]). Our data are illustrated in Fig. 4.
Finally, since AQ scores ≥32 indicate the possible presence of autism (Baron-Cohen et al., 2001), we also investigated whether
there were more people with scores in this range in the aphantasic group, compared to our control group. There were 24 people in our
aphantasic group with an overall AQ score ≥32, and 4 people in our control group (again, overall AQ scores excluded question 3 for
reasons stated above). This difference was highly significant [χ2 (1, N = 236) = 14.63, p < .001; chi-square test with Yates continuity
correction]. A bayes factor of 802.43 provides very strong evidence for the alternative hypotheses, i.e., a difference between groups in
the number categorised as ≥32 AQ. Although we cannot draw conclusions about clinical diagnoses of autism in our sample, our results
show that aphantasic people were far more likely to report levels of autism traits suggestive of an autism spectrum condition compared
to controls.
10. Discussion
In Experiment 2 we have shown that people with aphantasia report higher AQ scores (more traits associated with autism than
controls), and fall more often within the range suggestive of autism (≥32). When examining subscales, we found AQ differences within
the social skills subscale, and also within the imagination subscale (even when removing a confounding question that asks directly
about aphantasia phenomenology). This shows that weak imagination symptomatology associated with autism may also be charac
teristic of aphantasia. Overall then, our results from Experiment 2 demonstrate a link between aphantasia and autism traits, not only in
the expected imagination subscale, but also more broadly.
11. General discussion
We investigated the relationship between aphantasia, and two other neurodevelopmental conditions: synaesthesia, and autism. In
Experiment 1a we asked whether aphantasia and synaesthesia can co-occur, an important question given the conflicting visual imagery
phenomenology assumed in aphantasia (low imagery; Zeman et al., 2015) and synaesthesia (high imagery; e.g., Spiller et al., 2015; but
see Brang & Ahn, 2019; Seron et al., 1992; Ward et al., 2018). We found that rates of synaesthesia were equal across aphantasics and
non-aphantasics, showing that synaesthesia can indeed occur within aphantasic individuals. In Experiment 1b we replicated this with a
larger sample, and a more robust measure of aphantasia. Here we also found that synaesthesia can arise even in the most extreme
aphantasia cases where there is a total absence of visual imagery (at least in terms of self-reported imagery on the VVIQ). These results
reinforce the fact that visual imagery is not necessary for the trait of synaesthesia to arise.
Our findings conflict with previous research suggesting that synaesthesia involves heightened visual imagery compared to controls
(e.g., Barnett & Newell, 2008; Chiou et al., 2018; Chun & Hupé, 2016; Meier & Rothen, 2013; Price, 2009; Spiller et al., 2015) and we
point to a hypothesis offered by Simner (2013). Simner has suggested that synaesthesia studies may sometimes exaggerate imagery
differences in synaesthetes because they often test self-referred synaesthetes (and perhaps those with the most vivid phenomenological
experience are more likely to self-refer). To our knowledge, our sample size is the largest ever used to examine imagery in synaesthetes
and this has allowed us to capture (and count) instances of low imagery synaesthetes who might otherwise be less obvious within
5
We note that the overall pattern of results remained the same overall when including question 3 of the AQ.
10You can also read