Continuous secondary-ice production initiated by updrafts through the melting layer in mountainous regions - Recent
←
→
Page content transcription
If your browser does not render page correctly, please read the page content below
Atmos. Chem. Phys., 21, 3855–3870, 2021
https://doi.org/10.5194/acp-21-3855-2021
© Author(s) 2021. This work is distributed under
the Creative Commons Attribution 4.0 License.

Continuous secondary-ice production initiated by updrafts
through the melting layer in mountainous regions
Annika Lauber1 , Jan Henneberger1 , Claudia Mignani2 , Fabiola Ramelli1 , Julie T. Pasquier1 , Jörg Wieder1 ,
Maxime Hervo3 , and Ulrike Lohmann1
1 ETH  Zurich, Institute for Atmospheric and Climate Science, Zurich, Switzerland
2 Department  of Environmental Sciences, University of Basel, Basel, Switzerland
3 Federal Office of Meteorology and Climatology MeteoSwiss, Payerne, Switzerland

Correspondence: Annika Lauber (annika.lauber@env.ethz.ch) and Jan Henneberger (jan.henneberger@env.ethz.ch)

Received: 22 September 2020 – Discussion started: 13 October 2020
Revised: 29 January 2021 – Accepted: 2 February 2021 – Published: 15 March 2021

Abstract. An accurate prediction of the ice crystal number         1   Introduction
concentration in clouds is important to determine the radia-
tion budget, the lifetime, and the precipitation formation of
clouds. Secondary-ice production is thought to be responsi-        Accurate weather forecasting in mountainous regions is more
ble for the observed discrepancies between the ice crystal         challenging than over flat topography as orography has a
number concentration and the ice-nucleating particle concen-       strong influence on the local weather; e.g., it creates local
tration in clouds. The Hallett–Mossop process is active be-        up- and downdrafts, which strongly impacts the development
tween −3 and −8 ◦ C and has been implemented into several          of clouds (Roe, 2005; Henneberg et al., 2017). Yet, orogra-
models, while all other secondary-ice processes are poorly         phy is not very well resolved in numerical weather prediction
constrained and lack a well-founded quantification. During         models because the high resolution needed requires a lot of
2 h of measurements taken on a mountain slope just above           computational power that is often not available (e.g., Fundel
the melting layer at temperatures warmer than −3 ◦ C, a con-       et al., 2010; Gowan et al., 2018). Furthermore, microphys-
tinuously high concentration of small plates identified as sec-    ical processes in clouds, which affect the development of
ondary ice was observed. The presence of drizzle drops sug-        the concentration and size of ice crystals and cloud droplets,
gests droplet fragmentation upon freezing as the responsi-         are still not completely understood (e.g., Field et al., 2017).
ble secondary-ice mechanism. The constant supply of driz-          However, the correct phase partitioning and concentration of
zle drops can be explained by a recirculation theory, sug-         cloud particles is important for the determination of the ra-
gesting that melted snowflakes, which sedimented through           diation budget, the lifetime, and the precipitation amount of
the melting layer, were reintroduced into the cloud as driz-       clouds (e.g., Lohmann, 2002; Henneberg et al., 2017). This
zle drops by orographically forced updrafts. Here we intro-        can be especially important for mixed-phase clouds (MPCs)
duce a parametrization of droplet fragmentation at slightly        consisting of ice crystals and liquid droplets since they have
sub-zero temperatures, where primary-ice nucleation is basi-       a major contribution to the total precipitation in the midlati-
cally absent, and the first ice is initiated by the collision of   tudes (Mülmenstädt et al., 2015).
drizzle drops with aged ice crystals sedimenting from higher          MPCs are thermodynamically unstable because the sat-
altitudes. Based on previous measurements, we estimate that        uration water vapor pressure over ice is lower than over
a droplet of 200 µm in diameter produces 18 secondary-ice          liquid water, allowing ice crystals to grow faster than liq-
crystals when it fragments upon freezing. The application of       uid droplets. The particle growth reduces the water va-
the parametrization to our measurements suggests that the ac-      por pressure and eventually leads to the evaporation of
tual number of splinters produced by a fragmenting droplet         cloud droplets when the water vapor pressure drops below
may be up to an order of magnitude higher.                         water vapor saturation over liquid. This process is called
                                                                   the Wegener–Bergeron–Findeisen process (Wegener, 1911;

Published by Copernicus Publications on behalf of the European Geosciences Union.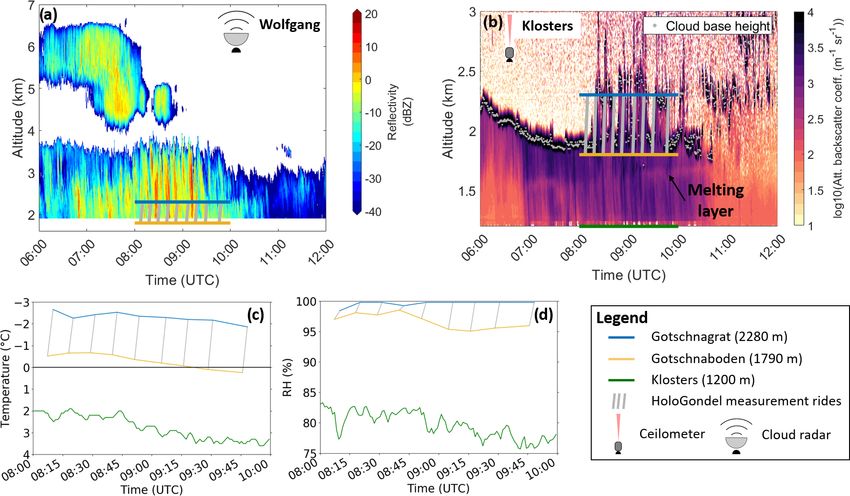
3856              A. Lauber et al.: Continuous secondary-ice production initiated by updrafts through the melting layer

Bergeron, 1935; Findeisen, 1938) and can lead to rapid             mechanism of this process is not well defined (Field et al.,
glaciation of clouds. Nevertheless, persistent MPCs have           2017). The most common explanation for SIP during rim-
been frequently observed in mountainous regions, where             ing is that droplets, which freeze on an ice crystal, build up
the local topography produces sufficiently large updrafts to       an internal pressure and break up upon freezing. In a labo-
sustain a continuous condensate production (e.g., Korolev,         ratory study, Hallett and Mossop (1974) observed that rime-
2007; Lohmann et al., 2016). An updraft velocity of about          splintering is active at temperatures between −3 and −8 ◦ C
2 m s−1 is often sufficient to maintain supersaturation with       when particles grow by riming. Dong and Hallett (1989)
respect to water, which enables a simultaneous growth of           showed that at temperatures above −3 ◦ C, droplets spread
cloud droplets and ice crystals (Korolev, 2007).                   out on the ice surface and do not build an ice shell, while
   MPCs can exist between 0 and −38 ◦ C. In this temperature       at temperatures below −8 ◦ C the ice shell of rime might be
range, ice-nucleating particles (INPs) are required for cloud      too strong to break (Griggs and Choularton, 1983). While
droplets to freeze. The resulting so-called primary ice can        several observations of secondary ice could be explained by
create additional ice crystals (secondary ice), which again        the rime-splintering process (e.g., Ono, 1971, 1972; Harris-
can fragment and produce more secondary ice by any kind of         Hobbs and Cooper, 1987; Bower et al., 1996), secondary ice
fragmentation, referred to as secondary-ice production (SIP)       was also observed in cases where these requirements were
(e.g., Field et al., 2017). Assuming only primary ice to ex-       not fulfilled (e.g., Korolev et al., 2020), or the SIP by rime-
ist, one would expect that the ice crystal number concentra-       splintering alone was expected to be too slow to explain the
tion (ICNC) equals the activated ice-nucleating-particle con-      observed rapid glaciation (e.g., Hobbs and Rangno, 1990).
centration (INPC) in clouds. This is observed for example             Collisional breakup describes the break-up of an ice crys-
in shallow stratocumulus (Mossop et al., 1972) or thin stra-       tal due to a collision with another ice crystal. This process
tus clouds but often does not hold true in more convective         was shown to be active when large ice crystals (e.g., graupel
clouds. A discrepancy between the INPC and the ICNC of up          or aggregates) are present (Korolev and Leisner, 2020). Frag-
to 4 orders of magnitude has been observed in several stud-        ments of ice crystals were observed in several field studies
ies (e.g., Koenig, 1963; Hobbs and Rangno, 1985; Crawford          (e.g., Jiusto and Weickmann, 1973; Schwarzenboeck et al.,
et al., 2012; Lasher-Trapp et al., 2016; Ladino et al., 2017;      2009). Vardiman (1978) found that significant SIP occurs
Beck et al., 2018). If surface-based processes like blowing        by collisional breakup when relatively large concentrations
snow (e.g., Beck et al., 2018) and the seeder–feeder process       of rimed ice crystals are present in convective clouds. He
(hydrometeors which formed aloft precipitate into the cloud        concluded that collisional breakup cannot explain high sec-
below; e.g., Bader and Roach, 1977; Ramelli et al., 2020a)         ondary ICNCs at warm temperatures. The laboratory study of
can be excluded as a potential ice source, this discrepancy        Takahashi et al. (1995) showed that a maximum SIP rate oc-
can only be explained by SIP.                                      curs at −16 ◦ C when ice spheres with different growth modes
   On 22 February 2019, during the RACLETS (Role of                collide.
Aerosols and CLouds Enhanced by Topography on Snow)                   Droplet fragmentation during freezing can happen when
campaign taking place in the region of Davos in the Swiss          liquid water gets trapped inside a freezing droplet after an
Alps (Mignani et al., 2021; Ramelli et al., 2020b, a; Geor-        ice shell formed around the droplet and expands. Due to
gakaki et al., 2020), a discrepancy between the INPC and           the lower density of ice than liquid water, an internal pres-
ICNC of several orders of magnitude was measured. In the           sure builds up. If the pressure reaches a critical point, differ-
following subsection different SIP mechanisms, which might         ent processes have been observed to release the pressure: a
be responsible for this high discrepancy, are described. Fur-      complete breakup in mainly two halves; opening and clos-
thermore, a recirculation theory by Korolev et al. (2020) is       ing of cracks; bubbles forming and bursting on the ice shell;
introduced in Sect. 1.2, which can explain the observations.       and streams being ejected from the shell, which may contain
                                                                   small ice fragments (Lauber et al., 2018). An average number
1.1    Secondary-ice production mechanisms                         of splinters being ejected per freezing droplet could not be
                                                                   quantified so far because many ejected splinters are expected
Six SIP mechanisms have been discussed over the past               to be too small, and the processes happen so fast that the used
decades. They are expected to be active depending on the           measurement techniques until today were not able to detect
environmental conditions like temperature, cloud particle          all splinters (Lauber et al., 2018; Keinert et al., 2020). Kein-
size distribution, and updrafts: (i) the rime-splintering or       ert et al. (2020) showed that droplets freezing in moving air
Hallett–Mossop process, (ii) collisional breakup, (iii) droplet    break up 1 order of magnitude more frequently than droplets
fragmentation upon freezing, (iv) thermal-shock fragmenta-         freezing in stagnant air. Therefore, high wind speed and tur-
tion, (v) fragmentation of sublimating or melting ice, and         bulence can be expected to increase the likelihood of droplet
(vi) activation of INPs in transient supersaturation of freezing   fragmentation. The highest fragmentation rate was observed
droplets (Korolev and Leisner, 2020).                              around −15 ◦ C. It decreases to higher and lower tempera-
   The rime-splintering process describes the production of        tures, while it seems to increase again at temperatures close
secondary ice during riming. Yet, the underlying physical          to 0 ◦ C (Keinert et al., 2020). The larger the droplet, the more

Atmos. Chem. Phys., 21, 3855–3870, 2021                                              https://doi.org/10.5194/acp-21-3855-2021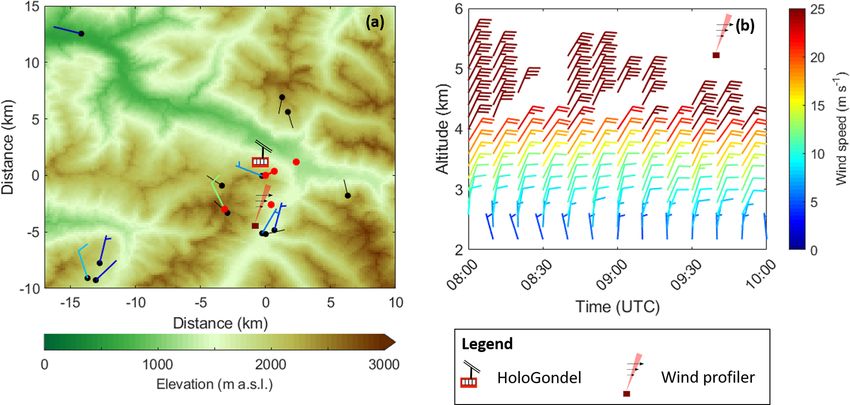
A. Lauber et al.: Continuous secondary-ice production initiated by updrafts through the melting layer                       3857

likely it will fragment and the more splinters it will likely      the seeder–feeder process can be excluded, the discrepancy
produce (Kolomeychuk et al., 1975; Lauber et al., 2018).           between the INPC and the concentration of columns shorter
Many field studies showed that large droplets are present in       than 50 to 150 µm in MPCs must emerge from SIP.
clouds before ICNCs exceed the INPCs by orders of magni-              Korolev et al. (2020) suggested a recirculation process
tude (e.g., Koenig, 1963; Braham, 1964; Mossop et al., 1970;       through the melting layer to be a possible explanation for
Hobbs and Rangno, 1990; Rangno, 2008; Lawson et al.,               the observed high concentration of small pristine ice crys-
2017; Korolev et al., 2020) and often explained these ob-          tals. Large ice crystals which fall through the melting layer
servations with SIP by droplet fragmentation. Even though          as precipitation melt into drizzle-sized droplets. If convec-
large droplets are rare in clouds, they might start a cascading    tion or turbulence causes large updrafts, these droplets can be
process of splinter production when produced splinters hit         reintroduced into the cloud. Whenever these droplets freeze
other droplets, which subsequently freeze and produce more         by the collision with ice crystals, the droplet-fragmentation-
splinters (Koenig, 1963; Chisnell and Latham, 1974; Lawson         upon-freezing process can become active and produce high
et al., 2015).                                                     numbers of secondary-ice particles.
   Thermal-shock fragmentation (King and Fletcher, 1976)
and the activation of INPs in transient supersaturation of
freezing droplets both require precipitation-sized droplets to     2     Experimental setup
be active, while the fragmentation of sublimating ice can be
important if cloud regions are affected by entrainment of dry      2.1    RACLETS campaign
air (Korolev and Leisner, 2020). Oraltay and Hallett (1989)
observed no sublimation breakup for columnar and plate-like        The measurements used in this study were collected during
crystals, while breakup during melting only took place at rel-     the RACLETS campaign, which took place in February and
ative humidities below 90 %.                                       March 2019 in the region of Davos in the Swiss Alps. The ob-
   From the six SIP mechanisms, the rime-splintering pro-          jective of this campaign was to improve the understanding of
cess is the best-constrained mechanism and has been im-            the influence of topography and aerosols on the development
plemented in some cloud microphysics schemes (e.g., Scott          of clouds. For this goal, a set of instruments were deployed at
and Hobbs, 1977; Beheng, 1987; Phillips et al., 2001). There       different locations. Figure 1 shows the locations and instru-
have been fewer attempts to include collisional breakup (e.g.,     ments which were used for the analysis of the presented case
Yano and Phillips, 2011; Phillips et al., 2017; Sotiropoulou       study.
et al., 2020a, 2021) and droplet fragmentation (e.g., Law-            Measurements of the in-cloud properties such as the cloud
son et al., 2015; Yang et al., 2020). Sullivan et al. (2018b)      particle concentration as well as their size distribution and
modeled all three ice multiplication processes and showed          shape were taken from the HoloGondel platform (Beck et al.,
that none of the three SIP mechanisms dominates the ICNC           2017) on the Gotschnabahn, which is described in more de-
enhancement. While collisional breakup is important when           tail in Sect. 2.2. As part of the MeteoSwiss observation net-
low updrafts prevail, and high nucleation rates are present,       work, a ceilometer (Vaisala, Model CL31) was installed in
droplet fragmentation and the rime-splintering process can         Klosters (1200 m) to determine the cloud base height (Hervo,
also be important in INP-limited regions. However, they            2020a) as well as a wind profiler (Vaisala, Model Lap3000,
pointed out that the processes are not very well constrained       Finland) in Wolfgang to measure the horizontal wind field
by laboratory and in situ data.                                    (Hervo, 2020b). The general wind pattern on the ground was
                                                                   determined by data from different MeteoSwiss stations, the
1.2   Persistent SIP immediately above the melting layer           Snow and Avalanche Research SLF, and the Holfuy station
                                                                   of the Grischa paragliding club. Temperature measurements
A remarkable finding of the study by Korolev et al. (2020) is      were taken from the MeteoSwiss station in Klosters (Hervo,
the observation of small pristine ice crystals persisting imme-    2019) and the snow drift station installed at Gotschnagrat
diately above the melting layer in clouds. They calculated a       (Walter and Huwald, 2019; Walter et al., 2020). For the anal-
spatial correlation time τcorr during which the environmental      ysis of the whole clouds, a vertically pointing cloud radar
changes (e.g., air temperature, humidity, and cloud particle       (Model Mira-36, METEK GmbH, Germany; Görsdorf et al.,
number concentration) are insignificant, and the shapes of         2015) was installed in Wolfgang. INPCs were measured in
the ice crystals can still be associated with the environment      the valley in Wolfgang (1630 m) and on the mountain top
they are growing in. Based on their estimation, τcorr is on the    of Weissfluhjoch (2670 m), where ambient aerosol was sam-
order of 60–120 s. Assuming water vapor saturation over liq-       pled through heated inlets using a high-flow-rate impinger
uid, an ice column at temperatures below −3 ◦ C can reach a        (Bertin Technologies, Model Coriolis µ, France). The sam-
length between 50 and 150 µm during τcorr depending on its         ples were analyzed for the INPC immediately on-site with a
aspect ratio. A relative humidity close to water saturation is a   drop-freezing technique using DRINCZ (Drop Freezing Ice
valid assumption in MPCs (Korolev and Isaac, 2006). It can         Nuclei Counter Zurich; David et al., 2019) of the Swiss Fed-
be concluded that if external processes like blowing snow or       eral Institute of Technology in Zurich (ETH) in Wolfgang

https://doi.org/10.5194/acp-21-3855-2021                                            Atmos. Chem. Phys., 21, 3855–3870, 2021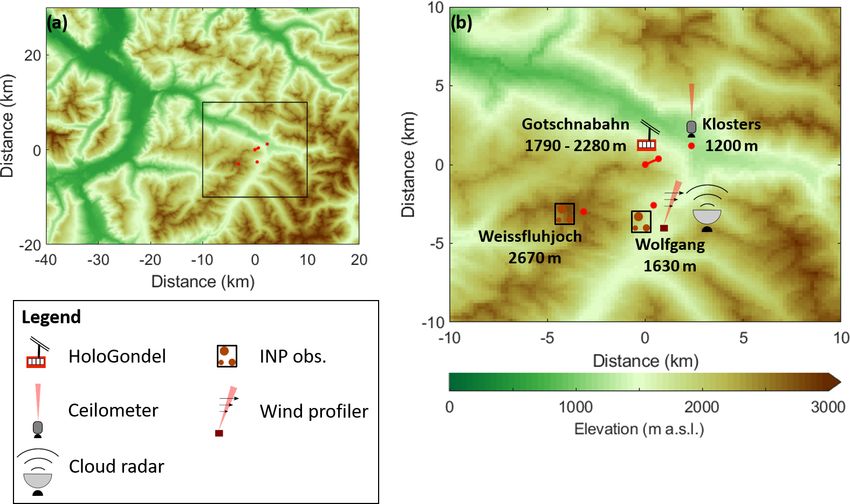
3858 A. Lauber et al.: Continuous secondary-ice production initiated by updrafts through the melting layer
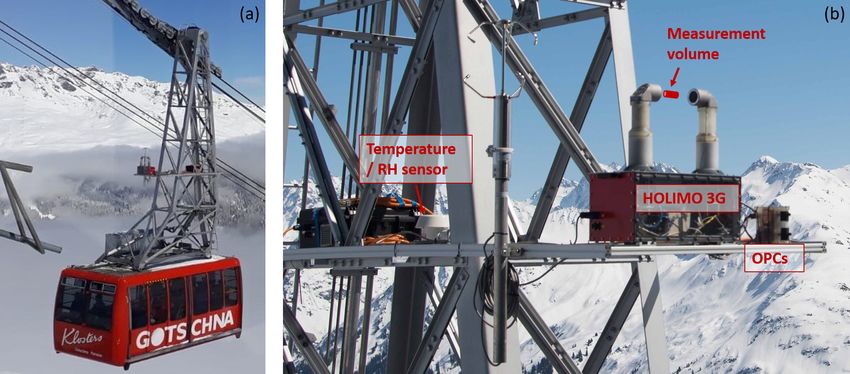
Figure 1. Overview of the measurement location and the experimental setup. The geographical location of the Gotschnabahn and the
surrounding topography is shown in (a). An enlarged section of the measurement sites (black rectangle in a) and the instrument setup
are shown in (b). The elevation data were taken from the digital height model DHM25 of the Federal Office of Topography swisstopo:
https://shop.swisstopo.admin.ch/de/products/height_models/dhm25200 (last access: 9 March 2020).
and the University of Basel’s LINDA (LED-based ice nu- when the setup was in front of the gondola in the direction of
cleation detection apparatus; Stopelli et al., 2014) at Weiss- travel.
fluhjoch as described in Mignani et al. (2021). The detection HOLIMO 3G is an open-path instrument, which uses
limit of the INPC (lowest concentration measurable) was cal- digital in-line holography. Holograms of the sample vol-
culated according to Vali (1971) considering the concentra- ume between the two towers (see Fig. 2b) are recorded, of
tion obtained if only one (first) drop froze. A detection limit which 13.7 cm3 was considered for the analysis, producing a
of 5.2 × 10⁻⁴ and 4.9 × 10⁻⁴ L−1 has been determined for 3D distribution of the cloud particles between the two towers
Wolfgang and Weissfluhjoch, respectively. and a 2D image of each cloud particle. A more detailed de-
scription of the measurement principle can be found in Beck
2.2 HoloGondel et al. (2017) and Henneberger et al. (2013). The pixel size
is 3.1 µm, which allows us to observe cloud particles larger
than 6.2 µm (Beck et al., 2017). The differentiation between
The HoloGondel platform consists of the HOLographic Im- ice and liquid is based on the shape of the particles (circu-
ager for Microscopic Objects 3G (HOLIMO 3G in Beck lar vs. non-circular). This is possible for particles larger than
et al., 2017) – which records the concentration, size distri- approximately 25 µm, depending on the shape of the ice par-
bution, and shapes of cloud particles – and a temperature and ticles (Henneberger et al., 2013).
relative-humidity sensor (HygroMet4, Rotronic) in a venti- A neural network for particles larger than 25 µm
lated housing (RS24T, Rotronic) as well as a pressure sensor (Touloupas et al., 2020) and a decision tree for particles
(Fig. 2). During the RACLETS campaign, the platform was smaller than 25 µm in their major axis were used to sepa-
installed on one of the gondolas running at the upper section rate cloud droplets from ice crystals and sort out artifacts,
between the Gotschnagrat mountain station (2280 m) and the which are falsely identified as cloud particles by the soft-
middle station at Gotschnaboden (1790 m), covering a hori- ware. All ice crystals were manually confirmed after the au-
zontal distance of about 830 m. To avoid any influence by the tomated classification. Therefore, the uncertainty in the con-
gondola stations on the measurements, data were only used centration of ice particles can be estimated with ±5 % for
if the difference between the pressure measured on the gon- ice crystals larger than about 100 µm and ±15 % for ice
dola and the pressure measured at the stations was more than crystals smaller than 100 µm (Beck, 2017). All ice parti-
1.5 hPa, corresponding to a vertical distance of more than cles were also manually classified into the habits “plates”;
15 m and a total distance of about 30 m between the gondola “columns”; “irregular”; “aged ice” (rimed particles and ag-
and the stations. The gondola runs with a maximum speed of gregates); and “unidentified”, referring to ice crystals, which
about 6 m s−1 , leading to a total measurement time of about could not be classified because they were too small or be-
140 s per ride. To avoid influences from the gondola and its cause their orientation did not allow a decision on their habit.
swing arm, only measurements of uphill rides were analyzed,
Atmos. Chem. Phys., 21, 3855–3870, 2021 https://doi.org/10.5194/acp-21-3855-2021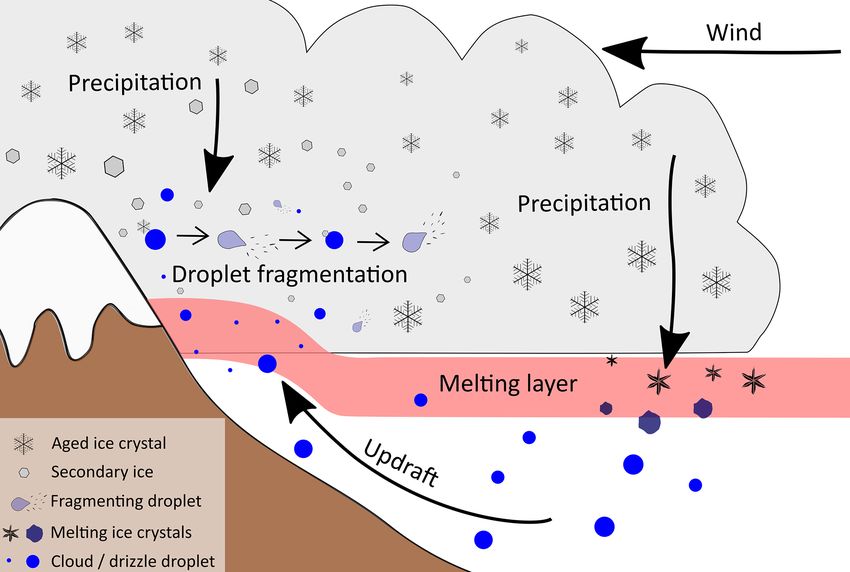
A. Lauber et al.: Continuous secondary-ice production initiated by updrafts through the melting layer                             3859

Figure 2. The HoloGondel platform installed on the Gotschnabahn in (a) and an enlarged picture of the platform in (b), showing HOLIMO 3G
with its measurement volume between the two towers, two optical particle counters (not used in this study) next to HOLIMO, and the
temperature and relative-humidity (RH) sensor. The sonic anemometer was turned off due to a limited supply of power.

Plates and columns are hexagonal prisms with the diameter             08:00 and 10:00 UTC. The rides used for the analysis are
of the hexagonal basis a and the prism height h. Plates have          shown as gray lines in Fig. 3. The temperatures and rela-
a dimension of a > h, while columns have a dimension of               tive humidities at Gotschnaboden and Gotschnagrat (Fig. 3c
a ≤ h. For the uncertainty
                  √          in the different habits, the count-      and d) are derived from measurements of the highest and
ing uncertainty ( N /V ; N: number of crystals; V : measure-          lowest point of the measurements on the gondola and are
ment volume) was added because of their relatively low num-           therefore only available when the gondola was in operation
ber compared to the measurement volume. The uncertainty               and close to one of the stations. During the measurement
in cloud droplets is estimated to be ±6 % as determined for           period, the temperature in Klosters increased from about
the classification with the neural network in Touloupas et al.        +1.5 to +3.5 ◦ C at a relative humidity of about 80 %, while
(2020). Again, for droplets larger than 40 µm the counting            the measurements on the gondola were taken mainly between
uncertainty was added due to their relatively small numbers.          0 and −2.5 ◦ C at relative humidities above 95 %. The melt-
                                                                      ing layer can be inferred from the dark band of the ceilome-
                                                                      ter data (Sassen et al., 2005) below Gotschnaboden (Fig. 3b),
3     Case study 22 February 2019                                     which was measured above Klosters and may slightly differ
                                                                      at Gotschnaboden.
3.1    Weather situation                                                 The main wind direction was from north to northeast as
                                                                      can be inferred from the wind profiler measurements taken
On 22 February 2019, a ridge was located in front of Switzer-         in Wolfgang in Fig. 4b. However, the ground measurements
land, which guided air masses from the north to the Davos re-         show that the wind direction was strongly influenced by
gion. A trough over Russia reached relatively far to the south        the orography (Fig. 4a). The valley north of the Gotschn-
supporting the rise of air masses over Germany, Austria, and          abahn forced the wind direction to the northwest as can be
eastern Switzerland, which were all covered by stratiform             seen from the wind measurements on Gotschnagrat. Thus, air
clouds. From the cloud radar measurements (Fig. 3a), it can           masses measured on Gotschnabahn were pushed up the val-
be anticipated that the cloud top height was about 4 km in the        ley coming from northwest and must have been lifted through
Davos region, referring to a cloud top temperature of around          the melting layer before reaching the measurement site.
−8 ◦ C as measured by a radiosonde launched at 10:25 UTC                 The slope inclination in the wind direction measured at
from Wolfgang. Between 05:00 and 09:00 UTC, the cloud                 Gotschnagrat is about 7◦ (averaged over Gotschnagrat and
radar showed a midlevel cloud above the stratiform cloud,             1 km northwest). Assuming that the measured horizontal
reaching from about 4.5 to about 6.5 km, that might have              wind of about 5 m s−1 (Fig. 4) was blown up the slope with-
acted as a seeder cloud in the early morning.                         out friction, the vertical wind speed reached about 0.6 m s−1 .
   As can be inferred from the ceilometer data, light pre-            The eddy dissipation rate, which is a measure for turbu-
cipitation started at around 07:00 UTC in Klosters, where             lence, was calculated from the wind profiler and cloud radar
the valley station of the Gotschnabahn is located (Fig. 3b).          measurements as described in Griesche et al. (2020) and
The cloud base was located slightly above the height of               reached values between 20 and 90 cm2 s−3 at an altitude of
the Gotschnaboden during the precipitation period, which              1800 to 2300 m between 08:00 and 10:00 UTC over Wolf-
lasted until about 10:30 UTC, when the cloud began to dissi-          gang. Such values were reported in stratiform clouds (Borque
pate. Measurements with HoloGondel were taken between

https://doi.org/10.5194/acp-21-3855-2021                                                Atmos. Chem. Phys., 21, 3855–3870, 2021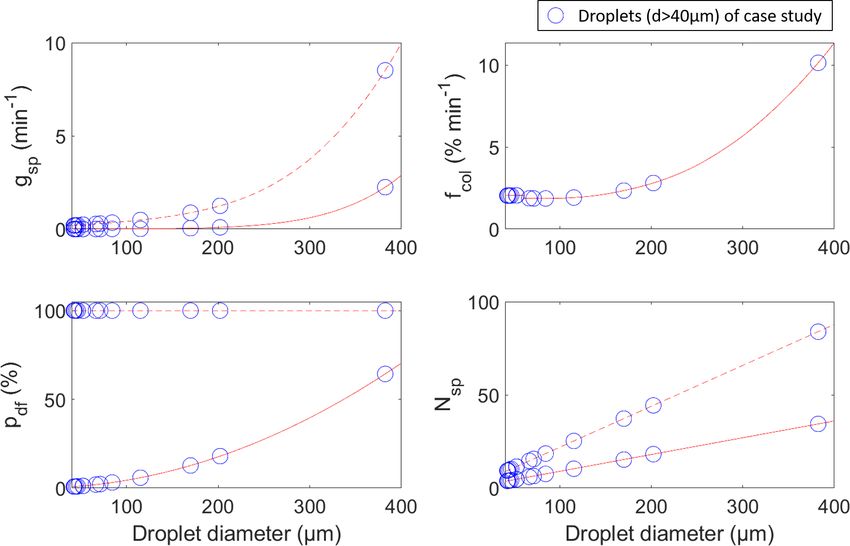
3860               A. Lauber et al.: Continuous secondary-ice production initiated by updrafts through the melting layer

Figure 3. Observations of the reflectivity measured by the cloud radar installed in Wolfgang are shown in (a). The ceilometer data in (b)
show the estimated cloud base with gray dots above Klosters. A dark band underneath the cloud base indicates the melting layer. Temperature
and relative-humidity measurements at the highest (closest to Gotschnagrat) and lowest point (closest to Gotschnaboden) of the gondola
measurements and Klosters during the time HoloGondel was measuring are shown in (c) and (d), respectively.

Figure 4. The wind direction and speed at different weather stations averaged between 08:00 and 10:00 UTC in the Davos region are shown
in (a). The colors of the wind barbs show the wind speed according to the color bar, while stations with black lines only report wind
direction. The wind profiler data, measured in Wolfgang, are shown in (b). The elevation data were taken from the digital height model
DHM25 of the Federal Office of Topography swisstopo: https://shop.swisstopo.admin.ch/de/products/height_models/dhm25200 (last access:
9 March 2020).

et al., 2016) as well as in cumulus clouds with weak updrafts           each contributing between 2.6 and 8.2 L. The difference in
(Siebert et al., 2006). Since no measurements of turbulence             the measurement volumes is due to different onsets and off-
are available over Klosters, we assume that similar turbu-              sets of the automated recording. HOLIMO observed aged ice
lence is present at the measurement site.                               crystals (here defined as aggregates and rimed particles), ir-
                                                                        regular particles, plates, and very few small columns (see
3.2    In situ measurements                                             Fig. 5). About 35 % of all ice crystals were classified as
                                                                        unidentified because they were too small, or the particle ori-
Between 08:00 and 10:00 UTC, a total volume of 43.7 L was               entation made a decision on its habit inconclusive. As dis-
measured by HOLIMO, distributed over nine uphill rides,

Atmos. Chem. Phys., 21, 3855–3870, 2021                                                    https://doi.org/10.5194/acp-21-3855-2021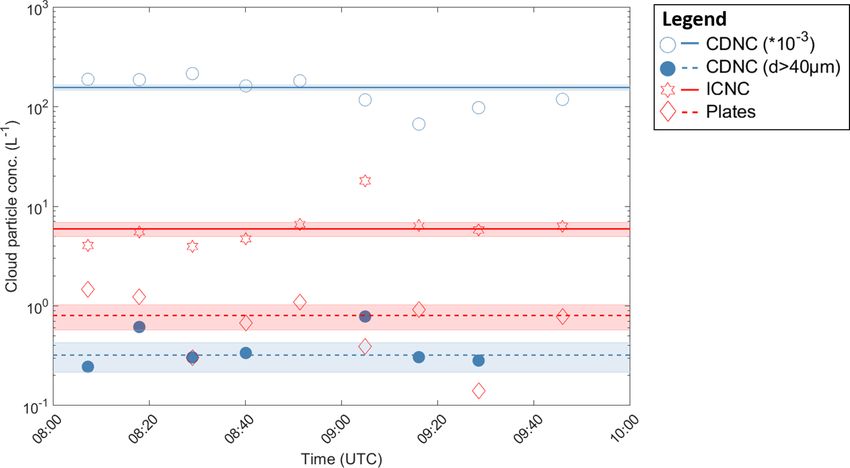
A. Lauber et al.: Continuous secondary-ice production initiated by updrafts through the melting layer                                  3861

Figure 5. The figure shows a randomly selected sample of ice crystals, which were observed in the cloud together with a stacked size
distribution of the different habits. The total concentrations together with the uncertainties in each habit are shown in the legend of the
histogram. Unidentified crystals as well as plates smaller than 93 µm in their major axis are referred to as “small plates” as discussed (see
text for more details).

Figure 6. The ICNC, CDNC, CDNC for droplets larger than 40 µm, and the concentration of plates averaged over each of the nine measure-
ment rides are shown with the four different symbols. The corresponding lines show the mean concentration of the complete measurement
volume with the shaded areas as the uncertainty in the mean concentrations.

cussed in Sect. 4.1, unidentified particles as well as plates            varied between 67 and 215 cm−3 and the ICNC between
smaller than 93 µm are referred to as small plates. They are             4 and 18 L−1 . The most commonly observed pristine ice
marked with dots in the histogram plot of the ice crystal size           particle habit was plates, with a mean concentration of
distribution in Fig. 5.                                                  0.8 L−1 ± 0.2 L−1 , varying between 0.1 and 1.5 L−1 between
   The concentrations of ice crystals and cloud droplets                 the different rides. Note that this is a lower estimate since
stayed relatively constant over the measurement period (see              the software has difficulties in detecting transparent parti-
Fig. 6). Taking the whole measurement period into ac-                    cles, and depending on the size and orientation, plates may
count, a mean cloud droplet number concentration (CDNC)                  be hard to identify. Besides the ice particle habits, a mean
of 156 cm−3 ± 9 cm−3 and a mean ICNC of 6 L−1 ± 1 L−1                    concentration of droplets larger than 40 µm in diameter of
were measured. Between the different rides the CDNC                      0.3 L−1 ± 0.1 L−1 , varying between 0 and 0.8 L−1 between

https://doi.org/10.5194/acp-21-3855-2021                                                   Atmos. Chem. Phys., 21, 3855–3870, 2021
3862               A. Lauber et al.: Continuous secondary-ice production initiated by updrafts through the melting layer

the different rides, was observed. It should be mentioned that    as columns. The few observed columns have an aspect ratio
the missing observations of plates or large droplets during       close to 1 (see Fig. 5), which is typical for columns grow-
single rides could be a stochastic effect due to the relatively   ing at temperatures just below −3 ◦ C at low supersaturation
low concentrations compared to the measurement volumes            (Libbrecht, 2005; Bailey and Hallett, 2009), and therefore
of each ride; i.e., for the smallest measurement volume of        they must have sedimented from slightly higher altitudes.
2.6 L−1 , one observed particle results in a particle concen-     This is possible because columns have a higher fall veloc-
tration of 0.4 L−1 . In the following, we consider the whole      ity than plates (a column with a length of 93 µm falls with
measurement period and site as one measurement volume,            about 0.3 m s−1 using the equations given in Pruppacher and
where the cloud particle concentrations are constant.             Klett, 2010). About 10 % of the small ice was classified as
   The INPC was measured in the valley in Wolfgang                irregular particles. These could be large secondary-ice splin-
(1630 m) and on the mountain top of Weissfluhjoch (2670 m)        ters. However, the fall velocity of irregular particles is hard to
(see Fig. 1 for the geographical positions) simultaneously at     assess, and it remains unclear if they have fallen from above
08:00 and 10:00 UTC on 22 February 2019. No INP was               or formed at the measurement site by SIP. Based on these
detected for temperatures higher than −6 ◦ C at both sites.       assumptions, the lower estimate of the secondary-ice con-
Therefore, the upper estimate of the INPC at the measure-         centration, which has formed and grown at the measurement
ment site (T > −3 ◦ C) is equal to the detection limit and on     site, is equal to the concentration of small plates as defined
the order of 5 × 10⁻⁴ L−1 for both sites, which lies several      above and is on the order of 2.6 L−1 ± 0.6 L−1 .
orders below the measured ICNC.                                      The time a plate needs to grow to 93 µm is hard to as-
                                                                  sess at temperatures close to 0 ◦ C because small variations
                                                                  in the environmental conditions, e.g., a temperature fluctua-
4     Discussion                                                  tion of only 0.5 ◦ C, can change the growth time on the order
                                                                  of several minutes. To calculate the growth time, we use the
4.1    Estimation of the secondary-ice crystal number             general equation of the ice particle growth by vapor diffusion
       concentration                                              given in Fukuta and Takahashi (1999). Using the mass–size
                                                                  relation of hexagonal plates from Mitchell et al. (1990) and
Since the INPC at the measurement location lies several or-       assuming water vapor saturation over liquid at a temperature
ders of magnitude below the ICNC, the contribution from           of −2 ◦ C, a splinter of 5 µm needs about 9 min to grow to a
primary-ice nucleation will be neglected. Therefore, the con-     size of 93 µm and about 5 min to grow to a size of 60 µm.
centration of secondary-ice crystals can be estimated from        Thus, for any given time, a plate of 93 µm is 4 min older than
the concentration of ice crystals that have newly formed and      a plate of 60 µm if the temperature is constant at −2 ◦ C, and
grown at the same location. The measurements were taken at        the water vapor is saturated over water. Therefore, plates with
temperatures warmer than −3 ◦ C. In this temperature regime,      sizes between 60 and 93 µm must have newly formed by SIP
newly formed ice crystals grow into plates (Libbrecht, 2005;      within a time span of 4 min. The same calculation can be
Bailey and Hallett, 2009). Figure 5 shows the shapes and the      done for a bigger size interval, e.g., plates between 39 and
size distribution of the ice crystals divided logarithmically     93 µm, which must have newly formed by SIP during a time
into nine size bins. The histogram plot shows that the major-     span of about 6 min. Taking temperature variations in the
ity of the classified particles smaller than 93 µm were plates    measurement volume into account, i.e., varying the temper-
(54 % if unidentified particles are excluded; Fig. 5), while      ature between −2 and −1 ◦ C, plates between 60 and 93 µm
aged crystals can only be found above that size. Hence, we        were newly formed by SIP during a time span of 4 to 6 min,
take 93 µm as a threshold to divide between newly formed          while plates between 39 and 93 µm were newly formed
ice crystals and those which sedimented from above.               by SIP during a time span of 6 to 10 min depending on
   About 70 % of the ice crystals smaller than 93 µm (from        the temperature. The observed concentration of small plates
now on referred to as “small ice”) could not be classified        with sizes between 60 and 93 µm was 0.9 L−1 ± 0.3 L−1 ,
into a certain habit because the resolution was too low. Yet,     whereas between 39 and 93 µm the concentration of small
a transparent part observed in the middle of many of these        plates was 2.1 L−1 ± 0.5 L−1 averaged over the 2 h mea-
particles (see Fig. 5) supports the assumption based on the       surement period. Thus, 0.9 L−1 ± 0.3 L−1 of secondary ice
temperature regime that these ice crystals are actual plates.     has formed within 4 to 6 min and 2.1 L−1 ± 0.5 L−1 within
In the following, small ice classified as plates including the    6 to 10 min. Taking all named uncertainties into account, the
unidentified particles is referred to as “small plates”.          rate of secondary-ice production during our case study was
   A plate with a maximum dimension of 93 µm has a fall ve-       0.24 L−1 min−1 ± 0.09 L−1 min−1 .
locity of about 0.05 m s−1 (using the equations given in Prup-
pacher and Klett, 2010), which is 1 order of magnitude lower      4.2   Contribution of different SIP mechanisms
than the estimated updraft of about 0.6 m s−1 . This supports
the assumption that small plates are unlikely to have sedi-       Droplets larger than 40 µm up to a size of 380 µm in diam-
mented from above. About 4 % of the small ice was classified      eter were observed between 0 and −2.7 ◦ C. Korolev et al.

Atmos. Chem. Phys., 21, 3855–3870, 2021                                             https://doi.org/10.5194/acp-21-3855-2021
A. Lauber et al.: Continuous secondary-ice production initiated by updrafts through the melting layer 3863
(2020) explained the occurrence of large droplets just above
the melting layer with a recirculation process (see Sect. 1.2).
Ice particles fall through the melting layer and melt into driz-
zle drops, which can be reintroduced into the cloud by suf-
ficiently high updrafts. The estimated updraft in this case
study is about 0.6 m s−1 , which is equal to the fall speed of
a 150 µm droplet (Rogers and Yau, 1989). Most of the ob-
served droplets were smaller than 150 µm and could be lifted
up in the clouds by the updraft, while the remaining ones
could have been brought into the cloud by local turbulences.
Also note that the updraft velocity is a very rough estimate;
increasing it by 0.2 m s−1 is already enough to lift 86 % in-
stead of 79 % of the observed droplets.
Droplet fragmentation requires the presence of large
droplets (>≈ 40 µm; e.g., Lawson et al., 2015; Korolev et al., Figure 7. Schematic of the recirculation process, which was intro-
2020) and has no temperature constraint towards high tem- duced by Korolev et al. (2020) and adapted for an updraft created
peratures. It is therefore a possible mechanism to explain the by a mountain slope. Aged ice crystals sediment from the cloud
observed secondary ice. Collisional breakup cannot be com- and turn into drizzle-sized drops when they fall through the melting
pletely ruled out, but it is not expected to produce high sec- layer. These drops are reintroduced into the cloud by wind forced
ondary ICNCs at warm temperatures as outlined in the intro- up the mountain slope (updraft), where they freeze when they col-
duction. Furthermore, the missing observation of fragment- lide with aged ice crystals and fragment upon freezing. The small
like ice particles (e.g., broken-off branches) is evidence that fragments grow into plates due to the environmental conditions
(T > −3 ◦ C) and may hit other droplets, which again freeze and
collisional breakup was not very active. Moreover, fragments
possibly fragment.
from collisional breakup are not necessarily small particles
and therefore could be miscounted as aged or irregular ice in
this study. mountainous regions is shown in Fig. 7. Because new
The rime-splintering process and ice fragmentation dur- droplets are continuously provided, we can assume that our
ing thermal shock can both be excluded from being active measurements reflect a steady state such that we observe
because they require lower temperatures. Additionally, INP freshly produced as well as aged particles simultaneously.
activation in transient supersaturation around freezing drops The combination of SIP above the melting layer and high
is unlikely to be active in a relatively warm environment (Ko- updrafts on the windward slope will transport the secondary-
rolev et al., 2020). As MPCs are supersaturated with respect ice crystals to higher altitudes, where they influence the cloud
to ice, the requirements for ice fragmentation during subli- microphysics.
mation are also not fulfilled (Korolev et al., 2020).
Ice crystals can partially melt and create fragments, which 4.3 Parametrization of SIP by droplet fragmentation at
can be lifted back into the cloud. However, the ice crystals warm temperatures
have to be sufficiently small to be lifted, while at the same
time, small ice crystals are likely to completely melt before Here we derive a parametrization of the SIP by droplet
re-entering the cloud. Furthermore, the breakup rates of this fragmentation at temperatures close to 0 ◦ C, when primary-
process depend on temperature and humidity and largely on ice nucleation can be neglected and droplets freeze only
the initial shape of the ice crystals (Korolev and Leisner, by the collision with ice crystals, which either sedimented
2020). Oraltay and Hallett (1989) observed no sublimation from above or formed by SIP. Like Korolev et al. (2020),
breakup for columnar and plate-like crystals and breakup we assume that only droplets larger than 40 µm are likely
during melting only at relative humidities below 90 %. The to contribute to SIP by droplet fragmentation. To cal-
shapes of ice crystals in our study are mostly solid particles culate the splinter generation rate of a droplet with di-
that have columnar and plate-like shapes (Fig. 5), and the ameter dn (gsp (dn )), the droplet freezing rate by colli-
relative humidity on the gondola never dropped below 95 % sion (fcol (dn )) has to be multiplied by the droplet fragmenta-
(Fig. 3d). Taking all these considerations into account, we as- tion probability during freezing (pdf (dn )) and the number of
sume that ice fragmentation during melting has a negligible splinters per fragmenting droplet (Nsp (dn )):
effect on the SIP. gsp (dn ) = fcol (dn ) · pdf (dn ) · Nsp (dn ) . (1)
Therefore, we expect that most of the small plates emerged
from droplet fragmentation and that the orographically in- To obtain the total splinter generation rate (Gsp ) in a vol-
duced updrafts serve as a constant supply of new droplets ume V , which contains Nd>40 µm droplets with diameters
larger than 40 µm in diameter, which originate from melted larger than 40 µm, the sum of gsp (dn ) over all droplets with
ice crystals. A schematic of this recirculation process in diameter dn (n = 1, 2, . . . , Nd>40 µm ) has to be divided by V :
https://doi.org/10.5194/acp-21-3855-2021 Atmos. Chem. Phys., 21, 3855–3870, 20213864 A. Lauber et al.: Continuous secondary-ice production initiated by updrafts through the melting layer
Nd>40
1 Xµm Nsp (dn ) ≈ 9 × 10⁴ m−1 · dn . (5)
Gsp = gsp (dn ) . (2)
V n=1 The splinter generation rate in volume V at temperatures
close to 0 ◦ C in MPCs is subsequently given by
The probability that a droplet with a fall velocity of v(dn )
collides with an ice crystal with an equivalent particle Nd>40
Xµm Nice
1 X
area diameter aj and freezes is equal to the collision effi- Gsp ≈ 9.9 × 10¹⁰ · π m−3 · dn3
E dn , aj
ciency E(dn , aj ). It needs to be multiplied by the combined V2 n=1 j =1
cross-section of the ice crystal and the droplet (0.25·π ·(dn + 2
aj )2 ) and the absolute relative velocity between those two · |v aj − v (dn ) | · dn + aj . (6)
(|v(aj ) − v(dn )|) to obtain the collection kernel. To calculate 4.3.1 Application of the parametrization to the case
the freezing rate of a droplet in volume V , the sum of the study
collection kernel between the droplet and each ice crystal in
the same volume with an equivalent particle area diameter aj In this section, the parametrization derived for SIP by droplet
(j = 1, 2, . . . , Nice ; Nice : number of ice crystals) has to be di- fragmentation for temperatures close to 0 ◦ C in the absence
vided by V : of INPs is applied to the presented case study. For simplicity,
Nice
we assume that the ICNC as well as the size and shape distri-
1X bution of the ice crystals stays constant over the whole mea-
fcol (dn ) ≈ E dn , aj · |v aj − v (dn ) |
V j =1 surement period of 2 h, meaning that any ice crystal which
2 leaves the measurement volume is immediately replaced by
π · dn + aj a new one of the same size and shape. The same is valid
· . (3)
4 for cloud droplets, which leave the measurement volume or
The probability of droplet fragmentation is size-dependent freeze and potentially produce secondary-ice splinters. Thus,
(Takahashi and Yamashita, 1969; Kolomeychuk et al., 1975; we assume a constant production of secondary ice. Further-
Lauber et al., 2018). For a fragmentation to occur, the sur- more, we expect that droplets larger than 40 µm have a colli-
face energy has to be overcome, which is proportional to dn2 . sion efficiency of E(dn , aj ) = 1 with any ice crystal.
Therefore, we expect pdf (dn ) = c · dn2 for some constant c. To calculate the fall velocities of the ice crystals, we divide
The constant c can be estimated by assuming a fragmentation them into plates and lump graupel. The former includes the
probability of 40 % for droplets with dn = 300 µm at temper- classes “plates” and “unidentified”, while the later includes
atures higher than −2.5 ◦ C, i.e., pdf (dn = 300 µm) = 0.4, as all other ice crystals (see Sect. 2.2 for a more detailed de-
measured by Keinert et al. (2020). This yields a droplet frag- scription of the classes). The fall velocity of plates was calcu-
mentation probability per freezing droplet of lated with the following equation from Pruppacher and Klett
(2010) (converted to SI base units) using the maximum di-
pdf (dn ) ≈ 4.4 × 10⁶ m−2 · dn2 , (4) mension of plates Lpla :
v Lpla ≈ 156 m0.14 s−1 · L0.86
which differs from other studies, where the probability of pla . (7)
droplet fragmentation follows a normal distribution centered
at −15 ◦ C independent of droplet size, with a probability To derive the fall speed of lump graupel with a maximum
close to 0 % for slightly sub-zero temperatures (e.g., Sulli- dimension of Lgra , we use the equation provided by Locatelli
van et al., 2018b, a; Sotiropoulou et al., 2020b). However, and Hobbs (1974) (again, converted to SI base units):
the study of Keinert et al. (2020) showed that droplet frag- v Lgra ≈ 124 m0.34 s−1 · L0.66
(8)
gra .
mentation is also likely to happen at temperatures close to
0 ◦ C. This yields a splinter generation rate of
The concentration of splinters produced per fragmentation 0.06 L−1 min−1 ± 0.02 L−1 min−1 of secondary ice, which is
event could not be quantified until now because many of the about 1 order of magnitude below the estimated production
splinters being produced during a fragmentation event might rate of secondary ice of 0.24 L−1 min−1 ± 0.09 L−1 min−1
be too small to be observed with the available measurement derived from the observations.
techniques (Lauber et al., 2018; Keinert et al., 2020). Here we The most uncertain parameter in Eq. (6) is the number
consider the maximum number of splinters observed during of splinters produced during a droplet fragmentation event.
a breakup event for different droplet sizes, which were sum- Taking the uncertainties into account and assuming that the
marized by Lauber et al. (2018) from different studies, to be proportionality of the number of splinters and the droplet di-
the best estimate available. The data points suggest a linear ameter is correct, Nsp has to be on the order of Nsp (dn ) =
correlation between the number of splinters being produced (4.9×10⁵ ±3.1×10⁵ ) m−1 ·dn to produce the measured con-
per droplet Nsp (dn ) and the droplet diameter dn . Applying a centrations of small secondary-ice particles. This is equiva-
linear regression, Nsp can be estimated as lent to 99 ± 62 splinters produced by a fragmenting droplet
Atmos. Chem. Phys., 21, 3855–3870, 2021 https://doi.org/10.5194/acp-21-3855-2021A. Lauber et al.: Continuous secondary-ice production initiated by updrafts through the melting layer 3865
Figure 8. The plots show the different parameters of the splinter generation rate gsp (dn ) (Eq. 1) for the first assumptions (Eqs. 3–5; solid
lines) and for the tuned version of Nsp in turbulent conditions that can explain the observations (Eqs. 9 and 10; dashed lines).
of 200 µm in diameter and is 2 to 9 times higher than the first observation of SIP by droplet fragmentation is basically im-
assumption of Nsp . possible as the process happens on a millisecond timescale
Apart from the average number of splinters produced, also (Lauber et al., 2018), and the secondary-ice splinters can be
the probability that a droplet fragments when it freezes might smaller than 10 µm (Korolev et al., 2020). Therefore, the lab-
be different in the atmosphere from what has been measured oratory measurements are the best estimate available.
in the laboratory. Keinert et al. (2020) showed that droplet The second main caveat is the parametrization of Nsp .
fragmentation is significantly higher in moving air than in The proportionality of Nsp to d was based on only four data
stagnant air. Therefore, it may be reasonable to assume that points, which were derived from three different studies using
pdf is even higher in turbulent conditions, and we expect here different measurement techniques and only show the maxi-
that every droplet fragments when it freezes: mum number of observed fragments as discussed in Lauber
et al. (2018). Apart from this, there is no physical basis for
pdf (dn ) = 1. (9) this correlation. There are so far no reliable measurements of
the average number of fragments being produced per frag-
To explain the observed splinter generation rate of the mea-
mentation, and recent work by Kleinheins et al. (2020) pro-
surements when turbulent conditions are expected, Nsp needs
vides an indication that a majority of possible fragment ejec-
to be on the order of
tions during freezing could not be observed by the applied
Nsp (dn ) = 2.2 × 10⁵ ± 1.3 × 10⁵ m−1 · dn . (10) measurement techniques. The application to the case study
suggests that the number of splinters may be up to 9 times
This is equivalent to 44±26 splinters produced per fragment- higher than assumed in Eq. (5) but critically depends on
ing droplet of 200 µm in diameter and is only 1 to 4 times the largest observed droplet. Until further measurements can
higher than the first assumption of Nsp . constrain the concentration of fragments produced per frag-
The calculated values for each parameter of Eq. (1) are mentation, Nsp remains highly uncertain.
shown in Fig. 8 as a function of droplet size and for Thirdly, the contribution of the different droplets is highly
each measured droplet individually for the first assumptions unbalanced, which can be seen in Fig. 8. For example, the
(Eqs. 3–5) as well as for the tuned version of Nsp in turbulent largest droplet (∼ 380 µm) in the present case study con-
conditions that can explain the observations (Eqs. 9 and 10). tributes 97 % to the total amount of the produced concen-
tration of secondary ice when using the first assumptions of
4.3.2 Caveats of the parametrization and its pdf (Eq. 4) and Nsp (Eq. 5) and 77 % when expecting turbu-
application to the case study lent conditions (Eq. 9) with a tuned version of Nsp that can
explain the observations (Eq. 10). This imbalance might be a
The first main caveat is that the parametrization was derived real possibility, and very few large droplets may be enough
solely from laboratory measurements. However, the direct
https://doi.org/10.5194/acp-21-3855-2021 Atmos. Chem. Phys., 21, 3855–3870, 20213866 A. Lauber et al.: Continuous secondary-ice production initiated by updrafts through the melting layer
to explain high concentrations of secondary ice, while the 5 Summary
contribution of droplets smaller than about 100 µm may be
negligible. However, the observation of a single droplet with On 22 February 2019, wind from the northwest pushed
a certain size is statistically insignificant, and more observa- air masses up a mountain slope, where measurements were
tions are needed to determine the real size distribution of the taken just above the melting layer on a gondola (see Fig. 3).
cloud droplets. The measurements showed relatively constant conditions
As a fourth caveat, we assume a continuous flow over 2 h during the measurement period of 2 h (Fig. 6), with a CDNC
without any vertical gradient for the application to the case of about 160 cm−3 and an ICNC of about 6 L−1 , which ex-
study. Since the secondary-ice splinters are expected to be ceeded the measured INPC by several orders of magnitude.
very small, they will be lifted up with the updraft faster than The majority of the observed small ice crystals (L < 93 µm)
the drizzle drops while they are growing to an observable were identified as plates (Fig. 5). As this is the preferred ice
size. The moment they leave the measurement volume, be- crystal habit at the temperatures in the measurement volume
fore they reach a size of 93 µm, they will not be counted (T > −3 ◦ C), ice crystals smaller than 93 µm are assumed
as secondary-ice splinters anymore even though they were to have newly formed in the same environmental conditions.
produced inside the measurement volume. Therefore, we ex- At such warm temperatures, primary-ice nucleation can be
pect that the secondary-ice concentration is slightly underes- neglected, and the concentration of small plates most likely
timated. Drizzle drops can also produce secondary ice when emerged from SIP.
they are outside the measurement volume, but the secondary- Remarkable was the observation of relatively large
ice particles can be lifted into the measurement volume. droplets between 40 and 380 µm at a concentration of
However, this is not very likely because measurements were 0.3 L−1 ± 0.1 L−1 above the melting layer. The appearance
taken very close to 0 ◦ C, and droplets are thus unlikely to of cloud droplets larger than about 40 µm is often connected
freeze before they reach the measurement volume. to SIP by droplet fragmentation (Korolev et al., 2020). The
Lastly, the determination of the concentration of secondary rime-splintering process and other SIP processes are not ex-
ice was based on rather rough assumptions; e.g., small ice pected to be active and are thus excluded from considera-
crystals, which could not be classified, were expected to be tion, and only a small contribution by collisional breakup
plates, and the growth time was determined for specific envi- is assumed, leaving droplet fragmentation as the mainly re-
ronmental conditions, which in reality changed with time and sponsible secondary-ice process. A recirculation theory pro-
position inside the measurement volume. Apart from this, posed by Korolev et al. (2020) can explain these observa-
splinters were assumed to have a specific size, while they tions and can in general be applied to mountainous regions
could vary in reality. Moreover, only splinters which were when a melting layer is present, and sufficiently large up-
small enough to grow into plates were considered to be sec- drafts are produced on the windward side by the local topog-
ondary ice in this study. raphy. Aged ice crystals fall through the melting layer as pre-
cipitation and melt into drizzle drops. If sufficiently large up-
4.4 Other case studies with similar observations drafts are present, these drops are blown up a mountain slope
and lifted through the melting layer, and they refreeze if they
Several other studies observed an increase in the concentra- collide with aged ice crystals. Due to the pressure build-up
tion of small ice crystals in the presence of large supercooled during freezing, they will fragment and create secondary-ice
drops in clouds (e.g., Stith et al., 2004; Lawson et al., 2015; crystals, which again can initiate the freezing of another driz-
Keppas et al., 2017; Korolev et al., 2020; Lloyd et al., 2020). zle drop (see schematic in Fig. 7). The secondary-ice crystals
Updrafts were made responsible for the origin of these large will be transported to higher altitudes, where they influence
droplets in all of the studies. The measurements were taken the cloud microphysics and subsequently the radiation bud-
mostly at temperatures lower than during our case study, get, the lifetime, and the precipitation pattern of the cloud.
where newly formed ice crystals grow into columns. The re- A parametrization was introduced in Sect. 4.3 for the gen-
circulation process through the melting layer described above eration of secondary-ice particles by droplet fragmentation
(Fig. 7) is therefore also expected to play a role for droplet at temperatures close to 0 ◦ C, when primary-ice nucleation
fragmentation in higher regions of the cloud if the updrafts is basically absent (Eq. 6). Based on limited available mea-
are strong enough to lift drizzle drops high enough until they surements of previous laboratory studies, it is assumed that
freeze. Besides droplet fragmentation, the rime-splintering the number of splinters produced per droplet is linearly cor-
process is expected to be active in the temperature regime related with their diameter and that a droplet of 200 µm pro-
between −3 and −8 ◦ C, which makes the assignment of the duces 18 splinters on average when it fragments. Applying
observed secondary ICNC to a specific process more diffi- the presented parametrization to our measurements could not
cult. However, images of deformed frozen drops in all of explain the estimated concentration of secondary ice, and
the abovementioned studies are strong evidence that droplet the number of splinters produced per fragmenting droplet
fragmentation was active and should be accounted for be- has to be higher; i.e., a droplet of 200 µm in diameter has
sides the rime-splintering process. to produce 99 ± 62 splinters upon fragmentation. This num-
Atmos. Chem. Phys., 21, 3855–3870, 2021 https://doi.org/10.5194/acp-21-3855-2021A. Lauber et al.: Continuous secondary-ice production initiated by updrafts through the melting layer 3867
ber can be reduced to 44 ± 26 if we assume that all droplets surements from their Holfuy station at Gotschnagrat. We would like
larger than 40 µm fragment when they freeze. This assump- to thank Hannes Griesche for supplying us with turbulence data,
tion may be reasonable when strong wind speeds or turbu- Patric Seifert (TROPOS, Germany) for discussing their measure-
lence are present. In either case, the application shows that ments, and Benjamin Walter for providing us with data from the
droplets smaller than about 100 µm are negligible for SIP snow drift station at Gotschnagrat, and we would like to thank
Pila Bossmann (https://wetterboss.com/, last access: 22 Septem-
by droplet fragmentation. However, these results critically
ber 2020) for discussing the general weather situation. We would
depend on a single large droplet next to other rather crude also like to thank our reviewers Alexei Korolev and Andrew Heyms-
assumptions and should be considered with caution. There- field for their constructive and helpful feedback.
fore, the parametrization should be implemented in a model
and tested on other case studies, which observed high con-
centrations of small ice crystals in clouds with temperatures Financial support. This research has been supported by the
close to 0 ◦ C. The implementation can improve the predic- Swiss National Science Foundation (grant nos. 200021_175824
tion of the ICNC in mountainous regions, where orographi- and 200021_169620).
cally forced updrafts through a melting layer are observed. A
better prediction of the ICNC can improve the determination
of the optical properties and the lifetime of clouds as well Review statement. This paper was edited by Daniel Knopf and re-
as precipitation formation from clouds containing ice (e.g., viewed by Alexei Korolev and Andrew Heymsfield.
Lohmann, 2002; Henneberg et al., 2017).
Code and data availability. The data used in this study are avail-
able at https://doi.org/10.5281/zenodo.4534382 (Lauber et al., References
2021a) or referenced herein. The software to reproduce the fig-
ures and for calculations done for this study is available at Bader, M. J. and Roach, W. T.: Orographic rainfall in warm sec-
https://doi.org/10.5281/zenodo.4534536 (Lauber et al., 2021b). tors of depressions, Q. J. Roy. Meteorol. Soc., 103, 269–280,
https://doi.org/10.1002/qj.49710343605, 1977.
Bailey, M. P. and Hallett, J.: A Comprehensive Habit Diagram for
Author contributions. AL analyzed and interpreted the data, cre- Atmospheric Ice Crystals: Confirmation from the Laboratory,
ated the figures, and wrote the manuscript with contributions AIRS II, and Other Field Studies, J. Atmos. Sci., 66, 2888–2899,
from JH, CM, FR, JTP, JW, MH, and UL. AL, JH, CM, FR, JTP, and https://doi.org/10.1175/2009JAS2883.1, 2009.
JW performed the measurements on the Gotschnabahn. MH oper- Beck, A.: Observing the Microstructure of Orographic
ated the radar wind profiler and the ceilometer and processed the Clouds with HoloGondel, PhD thesis, ETH Zurich, Zurich,
data. https://doi.org/10.3929/ethz-b-000250847, 2017.
Beck, A., Henneberger, J., Schöpfer, S., Fugal, J., and Lohmann,
U.: HoloGondel: in situ cloud observations on a cable car in the
Competing interests. The authors declare that they have no conflict Swiss Alps using a holographic imager, Atmos. Meas. Tech., 10,
of interest. 459–476, https://doi.org/10.5194/amt-10-459-2017, 2017.
Beck, A., Henneberger, J., Fugal, J. P., David, R. O., Lacher,
L., and Lohmann, U.: Impact of surface and near-surface pro-
Acknowledgements. The authors would like to thank the whole cesses on ice crystal concentrations measured at mountain-
RACLETS team for the installation and maintenance of the mea- top research stations, Atmos. Chem. Phys., 18, 8909–8927,
surement setup as well as many fruitful scientific discussions. We https://doi.org/10.5194/acp-18-8909-2018, 2018.
would especially like to thank Michael Lehning (WSL/SLF, EPFL) Beheng, K. D.: Microphysical Properties of Glaciating Cumu-
and his whole team for their effort in supporting and realizing lus Clouds: Comparison of Measurements With A Numeri-
the RACLETS campaign. A special thanks also goes to the Davos cal Simulation, Q. J. Roy. Meteorol. Soc., 113, 1377–1382,
Klosters Bergbahnen AG and the staff of the Gotschnabahn, espe- https://doi.org/10.1002/qj.49711347815, 1987.
cially the technical managers Andrea Margadant and the managing Bergeron, T.: On the physics of clouds and precipitation, in:
director Markus Good, for the permission to take measurements on roc. 5th Assembly UGGI, Lisbon, Portugal, 156–180, 1935.
one of their gondolas as well as the on-site support. We would also Borque, P., Luke, E., and Kollias, P.: On the unified esti-
like thank Paul Fopp for providing his land for the remote-sensing mation of turbulence eddy dissipation rate using Doppler
measurements. We would like to thank Alexander Beck for his sup- cloud radars and lidars: Radar and Lidar Turbulence
port in the organization of the RACLETS campaign. We thank the Estimation, J. Geophys. Res.-Atmos., 121, 5972–5989,
Swiss Federal Office of Meteorology and Climatology MeteoSwiss https://doi.org/10.1002/qj.49712253605, 2016.
for providing us with meteorological measurements and installing Bower, K. N., Moss, S. J., Johnson, D. W., Choularton, T. W.,
the ceilometer and the weather station in Klosters as well as the Latham, J., Brown, P. R. A., Blyth, A. M., and Cardwell, J.: A
radar wind profiler in Wolfgang. We would also like to thank the parametrization of the ice water content observed in frontal and
Grischa paragliding club for providing us with meteorological mea- convective clouds, Q. J. Roy. Meteorol. Soc., 122, 1815–1844,
https://doi.org/10.1002/qj.49712253605, 1996.
https://doi.org/10.5194/acp-21-3855-2021 Atmos. Chem. Phys., 21, 3855–3870, 2021You can also read