The structure based cancer related single amino acid variation prediction - Nature
←
→
Page content transcription
If your browser does not render page correctly, please read the page content below
www.nature.com/scientificreports
OPEN The structure‑based cancer‑related
single amino acid variation
prediction
Jia‑Jun Liu1, Chin‑Sheng Yu2,3, Hsiao‑Wei Wu4, Yu‑Jen Chang1, Chih‑Peng Lin5 &
Chih‑Hao Lu1,4,6*
Single amino acid variation (SAV) is an amino acid substitution of the protein sequence that
can potentially influence the entire protein structure or function, as well as its binding affinity.
Protein destabilization is related to diseases, including several cancers, although using traditional
experiments to clarify the relationship between SAVs and cancer uses much time and resources. Some
SAV prediction methods use computational approaches, with most predicting SAV-induced changes
in protein stability. In this investigation, all SAV characteristics generated from protein sequences,
structures and the microenvironment were converted into feature vectors and fed into an integrated
predicting system using a support vector machine and genetic algorithm. Critical features were used
to estimate the relationship between their properties and cancers caused by SAVs. We describe
how we developed a prediction system based on protein sequences and structure that is capable of
distinguishing if the SAV is related to cancer or not. The five-fold cross-validation performance of our
system is 89.73% for the accuracy, 0.74 for the Matthews correlation coefficient, and 0.81 for the F1
score. We have built an online prediction server, CanSavPre (http://bioinfo.cmu.edu.tw/CanSavPre/),
which is expected to become a useful, practical tool for cancer research and precision medicine.
Single amino acid variation (SAV) refers to one amino acid substitution resulting from genetic polymorphisms.
Nonsynonymous encoding variants alter the protein sequence. In extreme cases, this alteration affects the entire
protein structure or function. The unique physicochemical properties of each type of amino acid means that the
occurrence of the mutation in different positions of the sequence affects protein conformation and its function
to different extents. It is vital to understand how the SAV influences protein and to clarify the links between
genetic variations and human diseases. Most disease-related SAVs occur in structurally or functionally essential
positions1–3. Previous research that mapped nonsynonymous SNPs to the structural surfaces of encoded proteins
found that about 88% of disease mutations are located in the voids or p ockets4. These mutation residues may
affect the protein structure or the aggregation of the complex. Importantly, protein destabilization is a primary
factor in many Mendelian diseases. Two-thirds of disease-related mutations adversely influence protein–protein
interactions via loss of interactions, misfolding, or impaired e xpression5,6.
Structural dynamics are correlated to protein function, with evidence of missense-folding structures resulting
in protein d ysfunction7,8. If missense variants occur at the functional sites, the resulting changes in protein activ-
ity and binding affinity cause disease. SAVs located in the protein surfaces are also related to diseases, because
these SAVs can destroy protein–protein i nteractions9,10. Increasing evidence indicates that SAVs are associated
with several different cancers. Proteins containing harmful amino acid substitutions can affect pathways in
different cancers11–13. Much evidence has revealed substantial changes in genomic sequences in patients with
cancer. Ovarian cancer samples from The Cancer Genome Atlas (TCGA) project, for example, have revealed as
many as 4,128 mutations at 575 genes in a cohort of 590 cases14. The TCGA project has also identified approxi-
mately 9,000 mutations at 575 genes among 564 patients with lung adenocarcinoma15. Recent research has sug-
gested that somatic mutation accumulation is critical in t umorigenesis16. Moreover, while some variations may
appear to be neutral, they may actually be driver mutations that contribute to cancer p rogression17. In the era of
precision medicine, it is still difficult to precisely identify which genetic mutation serves as the trigger point of
1
The Ph.D. Program of Biotechnology and Biomedical Industry, China Medical University, Taichung,
Taiwan. 2Department of Information Engineering and Computer Science, Feng Chia University, Taichung,
Taiwan. 3Master’s Program in Biomedical Informatics and Biomedical Engineering, Feng Chia University, Taichung,
Taiwan. 4Graduate Institute of Biomedical Sciences, China Medical University, Taichung, Taiwan. 5Yourgene Health,
New Taipei City, Taiwan. 6Department of Medical Laboratory Science and Biotechnology, China Medical University,
Taichung, Taiwan. *email: chlu@mail.cmu.edu.tw
Scientific Reports | (2021) 11:13599 | https://doi.org/10.1038/s41598-021-92793-w 1
Vol.:(0123456789)
www.nature.com/scientificreports/
tumorigenesis without a systems network biology framework18,19. At the proteome level, amino acid substitutions
caused by genetic codon transitions may explain the basis of human c ancer20. Amino acid alterations appear to
follow certain rules. For example, arginine has a positive charge that is important for balancing protein and DNA
binding; however, arginine is highly mutated in various cancer types. The loss of arginine frequently influences
the function of cancer-associated proteins, whereas gaining cysteine, an active and reducing agent, may enhance
the capacity of a protein to neutralize reactive oxygen species (ROS) in the tumor environment21–23. Proteomic
changes caused by proteins carrying missense mutations may help cancer cells adapt to environmental pressure24.
While different types of cancers have unique properties that are not shared among all cancers, these different
cancers may share some substitution patterns25. For instance, the amino acid substitution spectrum is similar in
breast and digestive tract cancers, and is dominated by the alteration of glutamic acid to lysine25. Clarification
of the relationship between SAVs and cancers using traditional experiments necessitates much time and many
resources, so computational prediction methods are sorely needed in cancer biology research.
Machine learning has become a favored tool for data analysis, as this offers the capacity for leveraging big
data and for analyzing the content of complex problems, clarifying information and c ontent26,27. Many predic-
tors have emerged that use machine learning as algorithms for SAVs. The two most important and commonly
used categories of development strategies are the genetic-based and protein-based prediction systems. Several
large-scale sequencing projects such as the TCGA project are widely utilized for genetic analysis28,29, some of
which follow the American College of Medical Genetics and Genomics (ACMG) guideline30. The multifactorial
variant prediction (MVP) is a genetic-specific multifactorial model that integrates 16 in silico predictors with
the available clinical e vidence31. However, while the genetic-based system has established a causal relationship
between genes and cancer, this relationship is limited to cause and outcome. A comprehensive assessment of can-
cer driver mutation prediction models evaluated 33 commonly used prediction t ools32, the top three (CHASM,
CTAT-cancer and DEOGEN2) of which are cancer- or protein-based s ystems33–35; CHASM and CTAT-cancer
are designed to incorporate the cancer protein, while DEOGEN2 predicts the deleteriousness of SAV by training
the mutations in human inherited disease. Since the protein molecule is intimately involved in cellular processes,
using the protein-based system to build a prediction system might be more informative for complex diseases
such as cancer. However, although numerous prediction models have been developed, we lack the expertise for
constructing accurate prediction tools for cancer and knowing which SAV descriptors to i ncorporate36.
We describe our development of a prediction model, which is capable of recognizing whether a particular SAV
is cancer-related or is neutral. This model is not only able to discriminate physical changes for each SAV regarding
protein function and structure, but it can also estimate how these changes contribute to cancer progression. We
hypothesized that accounting for every kind of SAV might be a vital feature for cancer, so we designed a system
that incorporates multiple prediction models and enables the user to extract critical features from cancer-related
proteins. Our model provides a novel way forward for cancer research, not only for clinical outcomes but also
for recognizing prognostic biomarkers, which we contend is a breakthrough for precision medicine.
Materials and methods
Dataset of SAVs. All SAV data were collected from CanProVar 2.037,38, a human Cancer Proteome Variation
database that stores both germline and somatic amino acid variations, including those related to the genesis or
development of human cancers based on six sources, including the public databases HPI39, COSMIC40, OMIM41,
and TCGA42, as well as two large-scale cancer genome resequencing studies43,44. CanProVar 2.0 contains 156,671
cancer-related SAVs from mutations that have been reported in cancer samples and 967,017 neutral SAVs from
validated coding SNPs in the dbSNP database. In order to determine the exact protein structure of the SAV
sequence, CanProVar 2.0 data were mapped to the proteins identified by B LAST45 from the Protein Data Bank.
The search used six criteria, as follows: 1. The e-value of alignment results should be smaller than 1e−50; 2. The
sequence identity of alignment results should be greater than 80%; 3. The alignment coverage of the protein
structure should exceed 95%; 4. The organism of the aligned target protein should be Homo sapiens; 5. The
experimental method ideally uses X-ray diffraction to extract the protein structure for aligning the target protein
structures; and 6. The SAV position should be equidistant between the wild-type in the SAV sequence and the
aligned target protein. After matching a protein with a 3-dimensional structure, CD-HIT46 was used to filter out
homologous proteins. The CD-HIT cluster algorithm generates sets of protein families and uses the sequence
identity cut-off of 0.3 to purify redundant proteins. Subsequently, the remaining 2,867 cancer-related SAVs and
7,562 neutral SAVs were our main training set, which were separated into 20 groups by using the representative
wild-type amino acid of SAV. The numbers of cancer-related and neutral SAVs for each wild-type amino acid
in the training set are listed in Table 1; δ is the cancer:neutral SAV ratio, which ranges from 0.2245 to 0.6693.
Two independent sets were built, independent sets 30 and 40, which collected the proteins filtered out by CD-
HIT in the previous step. Any proteins in the independent sets sharing more than 30 or 40% sequence identity
with another protein in the same wild-type amino acid group of a training set were filtered out. The final analysis
included 154 cancer-related SAVs and 2,240 neutral SAVs in the independent set 30, and 322 cancer-related
SAVs and 3,127 neutral SAVs in the independent set 40. Table 1 lists the numbers of cancer-related and neutral
SAVs for each wild-type amino acid in the independent sets 30 and 40. Typically, the 30% sequence identity
was usually used as the criteria to remove homologous proteins. However, due to few cancer-related SAVs were
collected in the independent set 30, we provide the extra independent set 40 for comparison.
Prediction systems. We used the machine learning method to build two cancer-related SAV prediction
systems. The first system, CanSavPrew, contained 20 individual prediction models constructed from 20 groups
according to the SAV wild-type amino acid. Subsequently, the second prediction system, CanSavPrewm, divided
the 20 groups into several subgroups by SAV mutated type. Those subgroups containing fewer than 30 SAVs
Scientific Reports | (2021) 11:13599 | https://doi.org/10.1038/s41598-021-92793-w 2
Vol:.(1234567890)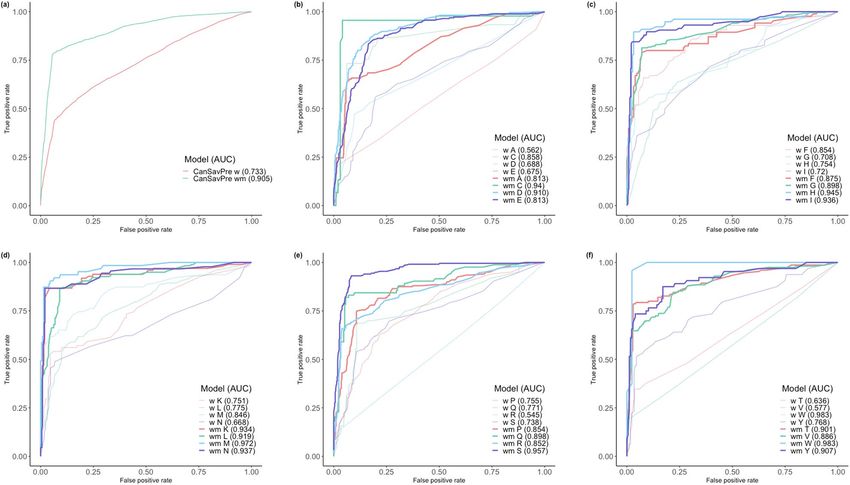
www.nature.com/scientificreports/
Training set Independent set 30 Independent set 40
WT Cancer Neutral Total Ratio (δ) Cancer Neutral Cancer Neutral
ALA 187 657 844 0.2846 12 191 26 268
CYS 45 97 142 0.4639 6 21 9 36
ASP 216 412 628 0.5243 14 121 26 167
GLU 254 408 662 0.6225 11 114 27 174
PHE 85 127 212 0.6693 9 46 14 58
GLY 236 437 673 0.5400 11 129 21 171
HIS 77 188 265 0.4096 6 63 9 85
ILE 116 437 553 0.2654 5 113 9 178
LYS 98 263 361 0.3726 6 98 12 131
LEU 178 321 499 0.5545 6 99 17 141
MET 63 202 265 0.3119 2 56 12 83
ASN 90 340 430 0.2647 5 107 8 153
PRO 200 363 563 0.5510 9 100 24 134
GLN 83 212 295 0.3915 7 55 14 78
ARG 328 1,248 1,576 0.2628 14 335 30 459
SER 217 432 649 0.5023 12 131 25 176
THR 150 505 655 0.2970 7 146 13 203
VAL 156 695 851 0.2245 7 236 16 315
TRP 24 42 66 0.5714 1 14 3 22
TYR 64 176 240 0.3636 4 65 7 95
TOTAL 2,867 7,562 10,429 0.3791 154 2,240 322 3,127
Table 1. The numbers of cancer-related and neutral SAVs for each wild-type (WT) residue and the total
(bolded) in our training and independent datasets.
were combined with other subgroups that had substitution scores exceeding zero based on BLOSUM62. Any
subgroups that did not fit these criteria were omitted from the C anSavPrewm, construction and were instead
included in the C anSavPrew prediction models. The dataset was split into subgroups to determine the character-
istics of specific wild-type amino acid alterations in each of the sequence-based, structure-based and microen-
vironment-based feature sets. As an illustration, a glycine would be built into prediction models containing for
example acidic (e.g., aspartic or glutamic acid) and basic (e.g., arginine) mutated amino acids with distinct SAV
features. Thus, our feature selection process effectively detects essential features. The second prediction system
ultimately yielded 100 prediction models (see Supplementary Table S1).
Each prediction model was a two-level Support Vector Machine (SVM) classifier module. The SVM machine
learning method is widely used for classifying protein structure or function in computational b iology47–52. All
SVM calculations were performed using LIBSVM (version 3.24)53,54, with the radial basis function (RBF) ker-
nel. The first-level SVM comprised 12 SVM classifiers based on four repeats for three feature sets, which are
described in the next section. All SAV descriptors in each feature set were fed into the SVM, and a five-fold
cross-validation was performed during model training. The parameters (penalty and gamma values of the RBF
kernel) were both trained by exponentially increasing the grid search from 2–15 to 215 incorporating best values
of informative measures.
The genetic algorithm (GA)55,56 was used to select features and optimize performance. The basic GA pro-
cedures are as follows: N solutions (Si , i = 1, . . . , N
) are randomly generated as the starting population. Each
solution Si is represented as a set of vectors Si = i . The feature vector i is an m-dimensional vector, indicating
the binary representations of m features: If fji = 1, the jth feature is kept; if fji = 0, the feature jth is eliminated.
In order to avoid any imbalance between positives and negatives in performance, four informative measures
(Eqs. 1–4) for prediction performance were used as the fitness functions, consisting of accuracy (Acc), the Mat-
thews correlation coefficient (MCC), the F1 score (F1), and summation of sensitivity and weighted specificity
(Hybrid). They were calculated as follows:
TP + TN
Acc = , (1)
TP + TN + FP + FN
TP × TN − FP × FN
MCC = √ , (2)
(TP + FP)(TP + FN)(TN + FP)(TN + FN)
2 × Precision × Sensitivity
F1 = , (3)
Precision + Sensitivity
Scientific Reports | (2021) 11:13599 | https://doi.org/10.1038/s41598-021-92793-w 3
Vol.:(0123456789)
www.nature.com/scientificreports/
Hybrid = Sensitivity + δ × Specificity , (4)
where Precision = TP+FP , Sensitivity TP+FN , Specificity TN+FP , TP represents true-positives, TN represents
TP TP TN
= =
true-negatives, FP represents false-positives, FN represents false-negatives and δ is the ratio of the number of
cancer-related SAVs to neutral SAVs, which are listed in Table 1.
In the initial population, N solutions are randomly divided into two halves. α and β have
the best fitness
in
each half, and they are defined as α = (�α ) = max S1 , . . . , SN/2 and β = �β = max S N +1 , . . . , SN . In
2
general, the three basic mechanisms driving the evolutionary processes in one generation consist of the selection,
mutation and crossover processes.
Selection operator. In the τ th generation, the selection operators are defined as:
α τ = max S1τ −1 , . . . , SN/2
τ −1 τ −1
,α ,
β τ = max SτN−1
+1
, . . . , SN
τ −1 τ −1
, β .
2
Note that for the special case of τ = 0, α 0 and β 0 are defined as 0. A new solution, Siτ , is equal to α τ if i is odd,
while Siτ is equal to β τ if i is even.
Mutation operator. We apply two types of mutation to the N solutions Si s. In the case of i = 1, . . . , N/2, every
b bit of the vectors is subject to mutation: b =∼ b, if the mutation rate is less than a mutation threshold µ0 = 0.1.
In the case of i = N2 + 1, . . . , N , we randomly choose a bit from the vectors. These bits are then subject to muta-
tion without any mutation thresholds.
Crossover operators. The crossover operations are carried out between S2p−1 and S2p, where p = 1, . . . , N/2
and proceed as follows: one-point crossover is performed between 2p−1 and 2p if the crossover rate is less than
the crossover threshold µ1 = 0.5.
The second level of SVM classifiers is used to process the prediction results generated from 12 classifiers in
the first level, to produce the final probability distribution of the relationship with cancer-related SAVs or neutral
SAVs. The relationship with the largest probability is used as the final prediction. The two-level SVM system is
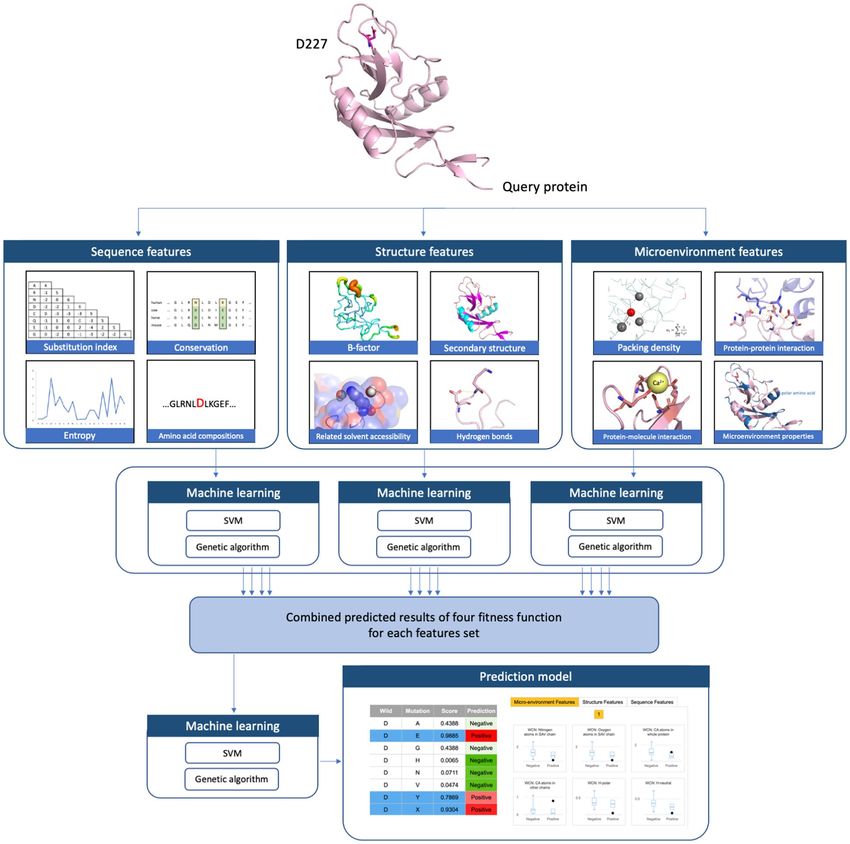
shown schematically in Fig. 1.
Classification of feature sets. SAV descriptors for machine learning were classified into three classes:
sequence-based, structure-based, and microenvironment-based feature sets. For the sequence-based feature set,
44 descriptors were extracted from the protein sequence and approximately partitioned into three categories.
The first category contained the most commonly used substitution index of wild-type SAV residues to muta-
tions. Three kinds of substitution indices were used; the BLOSUM6257,58, PAM25059, and the position-specific
scoring matrix (PSSM), which was derived from PSI-BLAST60. The second category represented the conserva-
tion for each residue compared with homologs. The 15 evolutional entropy values derived from PSI-BLAST were
used to denote a sliding window containing 7 amino acids on either side of the SAV. The model also calculated
average entropy values for window lengths 5 and 15, centered on the SAV, representing local- and wide-ranging
sequence conservation, respectively. In the third category, an amino acid composition (AAC)61, a 15-residue
peptide (with 7 amino acids on either side of the SAV), represented the composition of the neighboring residues.
According to the physicochemical properties of residues, we used the following classification schemes62 of amino
acid compositions: H for polar (RKEDQN), neutral (GASTPHY), and hydrophobic (CVLIMFW); V for small
(GASCTPD), medium (NVEQIL), and large (MHKFRYW); Z for low (GASDT), medium (CPNVEQIL), and
high polarizability (KMHFRYW); P for low (LIFWCMVY), neutral (PATGS), and high polarity (HQRKNED); F
for acidic (DE), basic (HKR), polar (CGNQSTY), and nonpolar (AFILMPVW); E for acidic (DE), basic (HKR),
aromatic (FWY), amide (NQ), small hydroxyl (ST), sulfur-containing (CM), aliphatic 1 (AGP), and aliphatic 2
(ILV). For clarity, these sequence-based descriptors are summarized in Table 2.
The structure-based feature sets contained 13 descriptors extracted from PDB and DSSP63,64. The first struc-
ture-based descriptor used the B-factor value of the SAV Cα atom; the B-factor value represents those atoms
displaced from their mean positions in a crystal structure diminishes the scattered X-ray intensity. This dis-
placement may be the result of temperature-dependent atomic vibrations, or static disorder in a crystal lattice.
Our model also uses critical DSSP information regarding solvent accessibility and includes eight DSSP-defined
elements in the secondary structure (i.e., H, B, E, G, I, T, S, and others), energy from the acceptor and donor
backbone hydrogen bonds, and determines whether or not disulfide bonding exists. These structure-based
descriptors are summarized in Table 3.
In the third feature set, the weighted contact number (WCN) m odel65 was used to describe the microenviron-
ment properties of SAVs. This weighted contact number model has a local packing density profile, and research
has reported a high correlation between the WCN profile and the sequence conservation profile66. The WCN
N
value of atom i was calculated by WCNi =
1 2 , where rij was the distance between the atom i and atom j ,
rij
j�=i
while N was the number of calculated atoms. In this work, atom i was defined as the Cα atom of SAV, and the
different microenvironment properties were represented by calculated different atom types, or the source of atom
Scientific Reports | (2021) 11:13599 | https://doi.org/10.1038/s41598-021-92793-w 4
Vol:.(1234567890)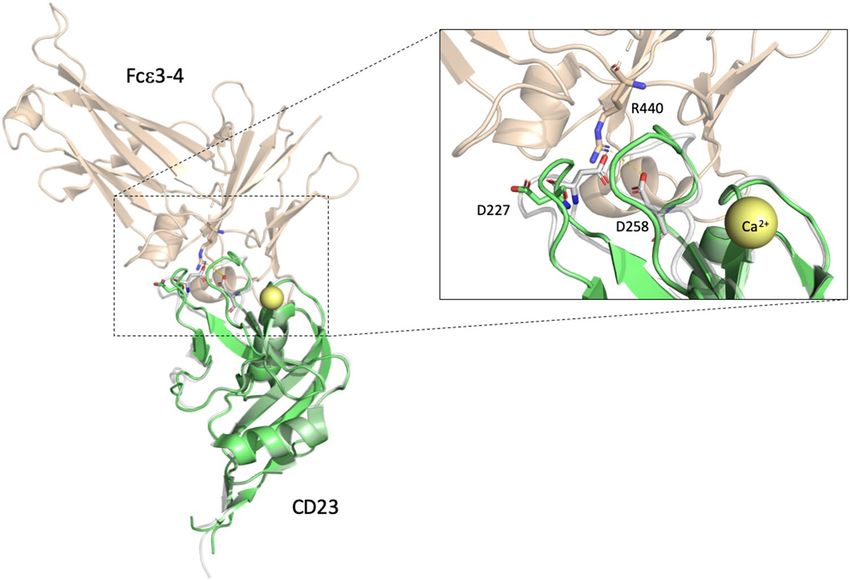
www.nature.com/scientificreports/

                                  Figure 1.  The workflow diagram represents the two-level SVM prediction system.

                                  j. The atom type of j could be Cα atoms, nitrogen atoms or oxygen atoms of an amino acid. Moreover, the source
                                  of atom j could be located within the same protein chain as SAV or the whole protein, representative of SAV
                                  packing density. Alternatively, the source could be derived from another protein chain or molecules such as
                                  DNA, RNA, ligands, or metal ions representing protein–protein or protein-molecule interactions. The packing
                                  density of SAV may be divided into different classifications representing the microenvironment properties
                                  wherein the SAV is located, such as polar, hydrophobic, acidic or basic, according to the physicochemical proper-
                                  ties of residues containing the Cα atom j. The same classification schemes were used as described in the sequence-
                                  based feature set. The microenvironment-based descriptors are listed in Table 4.

                                  Results
                                  Performance evaluation. Table 5 compares the five-fold cross-validation performances of two prediction
                                  systems based on three different feature sets with the prediction performance of the second-level SVM, all of
                                  which are optimized by using MCC as the fitness function in GA. In our experiment, the individual prediction
                                  model using the sequence-based feature scheme outperformed the other two, while the performance of the
                                  model using the microenvironment-based feature was superior to that of the structure-based feature scheme.
                                  The outstanding performance of the combined model obtained in the second-level SVM procedure demon-
                                  strates that further information is very helpful for understanding and determining cancer-related factors.

Scientific Reports |   (2021) 11:13599 |               https://doi.org/10.1038/s41598-021-92793-w                                                 5

                                                                                                                                             Vol.:(0123456789)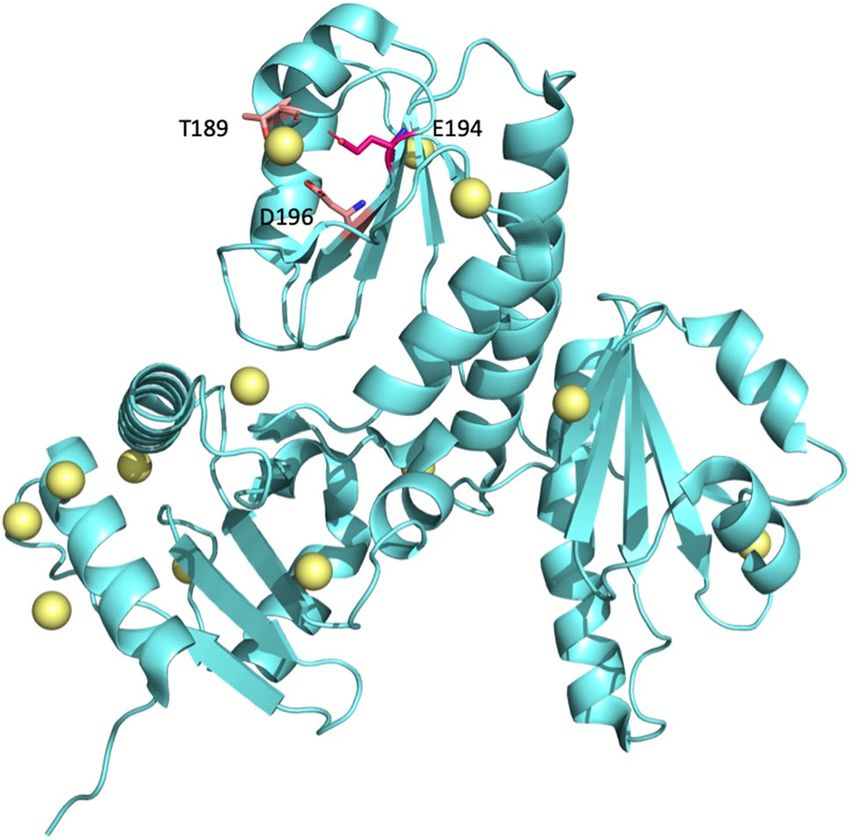
www.nature.com/scientificreports/
# Feature name # Feature name
1 Substitution index: BLOSUM62 23 AAC: H-hydrophobic (CVLIMFW)
2 Substitution index: PAM250 24 AAC: V-small (GASCTPD)
3 Substitution index: PSSM 25 AAC: V-medium (NVEQIL)
4 Entropy: 7th residue before SAV 26 AAC: V-large (MHKFRYW)
5 Entropy: 6th residue before SAV 27 AAC: Z-low polarizability (GASDT)
6 Entropy: 5th residue before SAV 28 AAC: Z-neutral (PATGS)
7 Entropy: 4th residue before SAV 29 AAC: Z-high polarizability (KMHFRYW)
8 Entropy: 3rd residue before SAV 30 AAC: P-low polarity (LIFWCMVY)
9 Entropy: 2nd residue before SAV 31 AAC: P-neutral polarity (PATGS)
10 Entropy: 1st residue before SAV 32 AAC: P-high polarity (HQRKNED)
11 Entropy: SAV 33 AAC: F-acidic (DE)
12 Entropy: 1st residue after SAV 34 AAC: F-basic (HKR)
13 Entropy: 2nd residue after SAV 35 AAC: F-polar (CGNQSTY)
14 Entropy: 3rd residue after SAV 36 AAC: F-nonpolar (AFILMPVW)
15 Entropy: 4th residue after SAV 37 AAC: E-acidic (DE)
16 Entropy: 5th residue after SAV 38 AAC: E-basic (HKR)
17 Entropy: 6th residue after SAV 39 AAC: E-aromatic (FWY)
18 Entropy: 7th residue after SAV 40 AAC: E-amide (NQ)
19 Entropy: Average of 15 residues 41 AAC: E-small hydroxyl (ST)
20 Entropy: Average of 5 residues 42 AAC: E-sulfur-containing (CM)
21 AAC: H-polar (RKEDQN) 43 AAC: E-aliphatic 1 (AGP)
22 AAC: H-neutral (GASTPHY) 44 AAC: E-aliphatic 2 (ILV)
Table 2. List of descriptors in the sequence-based feature set.
# Feature name # Feature name
1 B-factor 8 Secondary structure: T
2 Related solvent accessibility 9 Secondary structure: S
3 Secondary structure: H 10 Secondary structure: Others
4 Secondary structure: B 11 Energy of backbone H-bond: acceptor
5 Secondary structure: E 12 Energy of Backbone H-bond: donor
6 Secondary structure: G 13 Disulfide bond
7 Secondary structure: I
Table 3. List of descriptors in the structure-based feature set.
Critically, CanSavPrewm performed better than CanSavPrew in all three individual feature sets and also in the
combined set. Specific training and predicting models were built from the specific subgroups according to the
wild-type and mutated types of SAV. Using a two-level SVM combining sequence-, structure- and microenvi-
ronment-based features, C anSavPrew distinguished between SAVs that were or were not related to cancer, with
an accuracy of 79.83%, a Matthews correlation coefficient of 0.45, and F1 score of 0.54. C anSavPrewm is more
effective, with an accuracy of 89.73%, a Matthews correlation coefficient of 0.74, and F1 score of 0.81. The fivefold
cross-validation performance for each wild-type SAV of the C anSavPrewm system is illustrated in Table 6. Figure 2
illustrates the ROC curve and compares the AUC values of each wild-type SAV in two systems.
Case study: PI3K. The phosphatidylinositol-3-kinase (PI3K) signaling pathway contributes to several cellu-
lar processes, including metabolism, proliferation, differentiation and activation. Notably, the PI3K/AKT/mam-
malian target of rapamycin (mTOR) signaling pathway is one of the most important intracellular pathways and
is also one of the most frequently dysregulated pathways in human cancers67–70. Several catalysis subunits exist
for PI3K. Those that are encoded by PIK3cδ have been found to induce cell proliferation in colorectal cancer and
other types of cancers71,72. The amino acid mutation of PI3Kcδ is closely related to oncogenic transformation,
and numerous SAVs have been recorded as cancer-related in the COSMIC database, including P57S, Q75K,
K111E, P134L, S361F, N380H, L634F, H677R, E713K, A723V, I776T, G890R, and L977I. Figure 3 illustrates the
protein structures of PI3K and the p85 α complex (PDB ID: 5DXU)73; 14 amino acids, including one neutral and
13 cancer-related SAVs, are drawn as spheres. All SAVs, except H677R, are correctly predicted by our prediction
system. It should be noted that another SAV, R104C, has been marked as a neutral SAV and is also predicted
correctly. The predicted results of PI3K are listed in Table 7.
Scientific Reports | (2021) 11:13599 | https://doi.org/10.1038/s41598-021-92793-w 6
Vol:.(1234567890)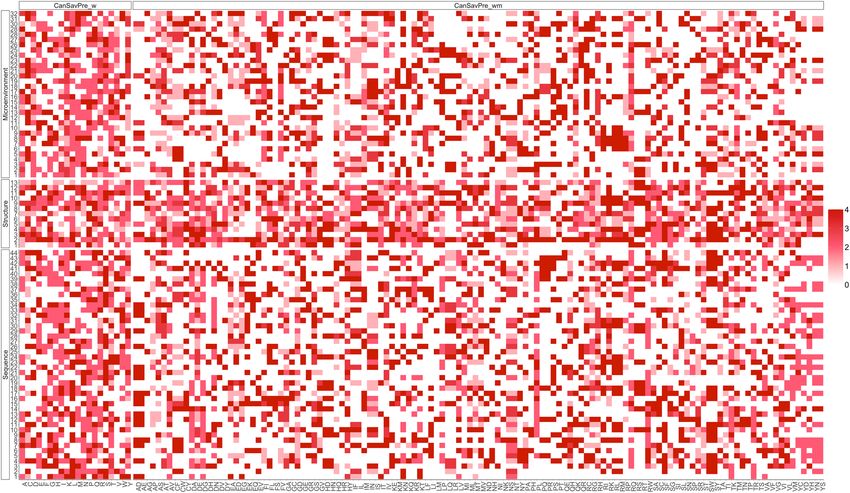
www.nature.com/scientificreports/
# Feature name # Feature name
1 WCN: Cα atoms in SAV chain 17 WCN: Z-high polarizability (KMHFRYW)
2 WCN: Nitrogen atoms in SAV chain 18 WCN: P-low polarity (LIFWCMVY)
3 WCN: Oxygen atoms in SAV chain 19 WCN: P-neutral polarity (PATGS)
4 WCN: Cα atoms in whole protein 20 WCN: P-high polarity (HQRKNED)
5 WCN: Nitrogen in whole protein 21 WCN: F-acidic (DE)
6 WCN: Oxygens in whole protein 22 WCN: F-basic (HKR)
7 WCN: Cα atoms in other chains 23 WCN: F-polar (CGNQSTY)
8 WCN: Atoms in other molecules 24 WCN: F-nonpolar (AFILMPVW)
9 WCN: H-polar (RKEDQN) 25 WCN: E-acidic (DE)
10 WCN: H-neutral (GASTPHY) 26 WCN: E-basic (HKR)
11 WCN: H-hydrophobic (CVLIMFW) 27 WCN: E-aromatic (FWY)
12 WCN: V-small (GASCTPD) 28 WCN: E-amide (NQ)
13 WCN: V-medium (NVEQIL) 29 WCN: E-small hydroxyl (ST)
14 WCN: V-large (MHKFRYW) 30 WCN: E-sulfur-containing (CM)
15 WCN: Z-low polarizability (GASDT) 31 WCN: E-aliphatic 1 (AGP)
16 WCN: Z-neutral (PATGS) 32 WCN: E-aliphatic 2 (ILV)
Table 4. List of descriptors in the microenvironment-based feature set.
System Feature set Accuracy Sensitivity Specificity MCC Precision F1 score
Sequence 0.7450 0.4350 0.8620 0.3202 0.5434 0.4832
Structure 0.6995 0.3946 0.8146 0.2176 0.4454 0.4185
CanSavPrew
Microenvironment 0.7184 0.3988 0.8391 0.2536 0.4832 0.4370
Combined 0.7983 0.4356 0.9357 0.4452 0.7199 0.5428
Sequence 0.8471 0.6292 0.9293 0.5978 0.7706 0.6928
Structure 0.8022 0.4737 0.9262 0.4609 0.7078 0.5676
CanSavPrewm
Microenvironment 0.8311 0.5774 0.9268 0.5509 0.7487 0.6520
Combined 0.8973 0.7837 0.9404 0.7382 0.8328 0.8075
Table 5. Comparisons of the five-fold cross-validation performance values in the training set of two
prediction systems based on three feature sets, combined by second-layer SVM. All predictions were optimized
using MCC as the fitness function.
Case study: D227Y of CD23. CD23 is the low-affinity receptor for IgE and is expressed on the surface of
several hematopoietic cells74, such as l ymphocytes75, monocytes76, follicular dendritic cells77,78, and bone marrow
stromal cells79. Several stimuli regulate the expression of CD23, a critical factor for B-cell activation, growth, and
IgE production (OMIM#151445). The D227Y mutation arising from an alteration of the FCER2 gene has been
reported in head and neck squamous cell carcinoma (HNSCC)80 and the colorectal neuroendocrine carcinoma
mutational analyses project81. D227 is located in one of the conserved double-loops; the interface between CD23
and the carbohydrate protein, Fcε 3–4. Importantly, calcium (Ca2+) is a regulated ligand for CD23 binding affin-
ity and Ca2+ binding enables loop1 and loop4 to change the conformation and increase the binding affinity.
D227 (loop1) and D258 (loop4) form additional salt bridges between CD23 and Fcε 3–482,83. Other bounds are
involved in CD23 and Fcε 3–4 binding, while D227Y affects the binding affinity and IgE antitumor functioning
(Fig. 4).
The boxplots of microenvironment descriptors in Fig. 4 depict the subgroup with the ASP to the TYR muta-
tion. In several descriptors in Fig. 5, the distribution of cancer-related SAVs differs significantly from that of the
neutral SAVs, with a 95% confidence interval by two sample z-test (z score > 1.96, p < 0.05). The z score is defined
by z = (x1 −x
2 )−(µ1 −µ2 ), where (x1 − x2 ) and (µ1 − µ2 ) are the observed and expected differences between cancer-
2 2
σ1 σ
n1 − n2
2
related and neutral SAVs, respectively. σ1 and n1 are the standard error and amount for the cancer-related SAVs
group, and σ2 and n2 are for the neutral SAVs group. The cancer-related SAVs are located in the relatively low
packing density region, encompassing Cα atoms, nitrogen, or oxygen located in a single SAV chain, or in whole
protein. D227Y in CD23 has a low WCN value in a single SAV chain but a relatively high WCN value in whole
protein or other chains (Fig. 5a–c), because D227 is located in the interface of CD23 and Fcε 3–4, and is involved
in their binding. Subsequently, the cancer-related SAVs have lower distributions of H-neutral (AGPHY), V-small
(GASCTPD), V-large (MHKFRYW), Z-low polarizability (GASDT), Z-high polarizability (KMHFRYW), P-neu-
tral polarity (PATGS), F-basic (HKR), F-nonpolar (AFILMPVW), E-basic (HKR), E-aromatic (FWY) and
E-aliphatic1 (AGP) with the surrounding amino acids. This unique surrounding pattern is also found in the case
of D227Y in CD23 (Fig. 5d–i).
Scientific Reports | (2021) 11:13599 | https://doi.org/10.1038/s41598-021-92793-w 7
Vol.:(0123456789)www.nature.com/scientificreports/
WT TP TN FP FN Accuracy Sensitivity Specificity MCC Precision F1 score
ALA 119 616 41 68 0.8709 0.6364 0.9376 0.6081 0.7438 0.6859
CYS 43 93 4 2 0.9577 0.9556 0.9588 0.9040 0.9149 0.9348
ASP 160 375 37 56 0.8519 0.7407 0.9102 0.6664 0.8122 0.7748
GLU 212 341 67 42 0.8353 0.8346 0.8358 0.6602 0.7599 0.7955
PHE 67 118 9 18 0.8726 0.7882 0.9291 0.7331 0.8816 0.8323
GLY 192 406 31 44 0.8886 0.8136 0.9291 0.7528 0.8610 0.8366
HIS 69 182 6 8 0.9472 0.8961 0.9681 0.8710 0.9200 0.9079
ILE 97 428 9 19 0.9494 0.8362 0.9794 0.8436 0.9151 0.8739
LYS 80 258 5 18 0.9363 0.8163 0.9810 0.8357 0.9412 0.8743
LEU 154 292 29 24 0.8938 0.8652 0.9097 0.7702 0.8415 0.8532
MET 55 199 3 8 0.9585 0.8730 0.9851 0.8835 0.9483 0.9091
ASN 78 333 7 12 0.9558 0.8667 0.9794 0.8643 0.9176 0.8914
PRO 150 324 39 50 0.8419 0.7500 0.8926 0.6512 0.7937 0.7712
GLN 68 200 12 15 0.9085 0.8193 0.9434 0.7714 0.8500 0.8344
ARG 216 1,189 59 112 0.8915 0.6585 0.9527 0.6538 0.7855 0.7164
SER 202 376 56 15 0.8906 0.9309 0.8704 0.7724 0.7829 0.8505
THR 118 490 15 32 0.9282 0.7867 0.9703 0.7907 0.8872 0.8339
VAL 97 681 14 59 0.9142 0.6218 0.9799 0.6912 0.8739 0.7266
TRP 23 41 1 1 0.9697 0.9583 0.9762 0.9345 0.9583 0.9583
TYR 47 169 7 17 0.9000 0.7344 0.9602 0.7356 0.8704 0.7966
TOTAL 2,247 7,111 451 620 0.8973 0.7837 0.9404 0.7382 0.8328 0.8075
Table 6. The five-fold cross-validation performance values in the training set of the C
anSavPrewm system for
each wild-type (WT) residue and the total (bolded).
Figure 2. Training set ROC curves in two prediction systems. (a) Total groups in the two systems; (b) A, C, D,
E groups; (c) F, G, H, I groups; (d) K, L, M, N groups; (e) P, Q, R, S groups; (f) T, V, W, Y groups.
Scientific Reports | (2021) 11:13599 | https://doi.org/10.1038/s41598-021-92793-w 8
Vol:.(1234567890)www.nature.com/scientificreports/
Figure 3. Protein structures of the PI3K/p85 α complex. The PI3K (wheat color) and p85 α (gray color)
complex (PDB ID: 5DXU) in the cartoon is drawn by P yMOL100. ARG104 (illustrated by the green spheres) is a
neutral SAV that mutates to CYS. The other residues shown in the pink spheres are all cancer-related SAVs.
SAV Type Score Predicted results
P57S Cancer-related 0.8590 TP
Q75K Cancer-related 0.9973 TP
R104C Neutral 0.1016 TN
K111E Cancer-related 0.6590 TP
P134L Cancer-related 0.7545 TP
S361F Cancer-related 0.9408 TP
N380H Cancer-related 0.9521 TP
L634F Cancer-related 0.8879 TP
H677R Cancer-related 0.0507 FN
E713K Cancer-related 0.8438 TP
A723V Cancer-related 0.8595 TP
I776T Cancer-related 0.9656 TP
G890R Cancer-related 0.9350 TP
L977I Cancer-related 0.8000 TP
Table 7. Predicted results for the 14 SAVs of the PI3K.
Case study: E194G of CASQ. The calsequestrin (CASQ) is a C a2+ buffering protein, capable of storing
large amounts of C a2+ in cardiac and skeletal muscles. C a2+ is an essential molecule that can regulate diverse
cellular processes, such as gene transcription, cell proliferation and m igration84–86. Although most research into
the CASQ has focused on cardiac muscle, CASQ in the Ca2+ signaling pathway is also vital in cancer research87,
as this pathway is highly correlated with tumor growth and metastasis88. Importantly, T189, E194 and D196 can
form a pack in the CASQ that harbors C a2+89; this C
a2+ binding can be destroyed by the substitution E194G,
causing the protein to lose its functionality (Fig. 6).
In the subgroup in which GLU mutates to GLY, none of the microenvironment descriptors of cancer-related
or neutral SAVs reveal significant differences at the 95% confidence interval, although several relevant descrip-
tors are found in the case of E194G in the CASQ. That is, E194 exhibits higher WCN values of oxygen in a
single SAV chain, as well as higher WCN values of atoms in other molecules, due to the fact that the CASQ is
Scientific Reports | (2021) 11:13599 | https://doi.org/10.1038/s41598-021-92793-w 9
Vol.:(0123456789)www.nature.com/scientificreports/
Figure 4. The superimposed structure containing CD23 apo and holo forms is obtained from the CD23
complex binding with Ca2+ and Fcε 3–4. The green cartoon represents the structure of the Ca2+-free wild-type
CD23 lectin domain (PDB ID: 4G96)83. The structure of the CD23 holo form bound to Ca2+ complexed with
Fcε 3–4 (PDB ID: 4GKO)83 is drawn in gray- and wheat-colored cartoons. C a2+ is shown in a yellow bubble;
the magnified view shows the interface of CD23 and Fcε 3–4. The D227 of the CD23 apo form is shown in the
green stick. The salt bridges forming residues in the CD23 holo form and Fcε 3–4 complex are highlighted with
sticks.
GLU- and ASP-rich, as well as a C a2+ buffering protein (Fig. 7a,b). Furthermore, higher WCN values were found
in the microenvironment around E194 than in the third quartile of cancer-related SAVs in H-polar (RKEDQN),
V-medium (NVEQIL), Z-low polarizability (GASDT), P-high polarity (HQRKNED), F-acidic (DE), and E-basic
(HKR) descriptors and were lower than WCN values in the first quartile in E-sulfur-containing (CM) amino
acid. Figure 7 depicts the microenvironment descriptor boxplots in the subgroup in which GLU mutates to GLY.
Discussion
Many cancer-related tools are based on genetic or protein sequence information, because of limited protein
structure information. Next-generation sequencing technology has led to the large-scale application of genomic
information in cancer research and human health90–93. The crucial limitation of this information is that while the
technology may determine tumor risk or recurrence, cause and effect remain undetermined. The launch of the
Human Proteome Project (HPP) has enriched our understanding of the human proteome blueprint responsible
for complex diseases, including cancer. Approximately 20,000 human cancer-related proteome studies have
been recorded in PubMed since 201194. However, it remains very difficult to construct a 3-dimensional protein
structure from these proteins, which explains why the widely used cancer prediction tools incorporate sequences
of genetic information or sequence information of proteins. Importantly, the spatial conformation of protein
forms the functional unit.
In this study, we describe how we developed a protein structure-based system, CanSavPre, to predict cancer-
related single amino acid variations. Protein sequence and structure descriptors are used in the model train-
ing process. Our prediction system displays excellent performance, and its structural and microenvironmental
properties enable us to observe mutating amino acids that generate malfunctioning proteins. Critical descriptors
emerge through use of the feature selection procedure. Figure 8 shows the heatmap of selected features in each
training group of two prediction systems. For each descriptor, the color represents how many times were selected
during four training repeats with different fitness functions. Mutated residues and their functional impact can
be characterized by analyzing the selected feature sets. Although further study is needed to reveal the cancer
mechanism in most selected features, our results indicate that it is possible to reliably predict cancer-related SAVs.
We also found that it is essential to divide the training data into proper subsets, according to the wild-type
and mutated SAVs. Each amino acid with its unique characteristics plays a different role in protein construction.
The heatmap in Fig. 8 also indicates that the profiles of selected features in CanSavPrewm are more legible than
those in C anSavPrew. The resulting discrepancies influence changes in protein conformation activity, to differ-
ent degrees. The data from our two-level prediction system optimize the outcomes from a system that uses only
Scientific Reports | (2021) 11:13599 | https://doi.org/10.1038/s41598-021-92793-w 10
Vol:.(1234567890)www.nature.com/scientificreports/
Figure 5. Boxplots of the microenvironment descriptors in the ASP that are altered to the TYR subgroup.
All microenvironment descriptors are divided into nine groups: (a) atoms in the SAV chain; (b) atoms in
whole protein; (c) atoms in other chains or molecules; (d) H-group; (e) V-group; (f) Z-group; (g) P-group; (h)
F-group; and (i) E-group. The white and grey boxes represent the distribution of cancer-related and neutral
SAVs. Red-framed boxes indicate that two sample z-testing revealed a significant difference between cancer-
related and neutral SAVs, with a 95% confidence interval (z score > 1.96, p < 0.05). Labels of descriptors selected
by the genetic algorithm are bolded in the x-axis. Star symbols denote the D227Y cases in CD23.
one level. However, the complexities of protein function in the extensive cellular networks necessitate critical
information that identifies cancer-related SAVs.
The SAVs in the independent sets 30 and 40 were predicted using the CanSavPrewm system and the prediction
performance is illustrated in Table 8. Although a difference in prediction performance is evident between the
independent sets and the training set, this is largely because the performance is optimized by a genetic algorithm
in the training set. Our purpose was to extract significant features using an optimization procedure. Thus, per-
formance in the training set is the upper bound of prediction. Another reason for the difference in prediction
performance between sets might be too few cancer-related SAVs in the training and independent sets. In the
training set, the average amount of cancer-related SAVs in the 100 subgroups of the CanSavPrewm system is less
Scientific Reports | (2021) 11:13599 | https://doi.org/10.1038/s41598-021-92793-w 11
Vol.:(0123456789)www.nature.com/scientificreports/
Figure 6. Protein structure of the human skeletal calsequestrin. The structure of CASQ (PDB ID: 3UOM)89 in
the cyan-colored cartoon is drawn by PyMOL. All of the yellow bubbles are C a2+ in CASQ. Three Ca2+ binding
residues are highlighted with sticks in deep pink. E194G is a cancer-related SAV.
than 30; the average amount is much smaller in the independent sets. The performance of independent sets
might therefore be distorted, necessitating a greater number of cancer-related SAVs. Nevertheless, compared
with DEOGEN2, which is mainly developed for deleterious amino acid variant prediction and publicly available,
our prediction system performs better than DEOGEN2 in both two independent sets (Table 8).
Proteins are dynamic molecules with distinct, flexible structures that facilitate allosteric interactions between
small molecules or proteins. For our prediction system, we focused on these interactions, i.e., physical contacts
between proteins and molecules. A limitation of the crystal-protein structure is that it is capable of revealing
only one condition of the protein–protein interaction. The critical purpose of a protein complex is to reflect
interactions between single chain proteins. These interactions typically represent functional properties and are
expected to be maintained through the genetic algorithm for feature selection. Importantly, technical limitations
of the crystal structure prevent the formation of a protein complex in some conditions. Thus, some protein struc-
tures only include a part of the complex. These single chain proteins might restrict the range of our prediction
system, because their conformations may differ from those of the protein complex. Our research seeks to define
the phenomenon underlying cancer-related variations and how differences in conformations influence protein
interactions, despite the limited available data on the protein complex.
Our case studies have used several different proteins to illustrate our protein structure-based system. In the
first example, the PI3K protein family is well recognized for its association with cancer. The strict rule for our data
extraction means that CD-HIT, the cluster database, filters out the homologous proteins and avoids weighting
the mutation residues for the training model. Thus, the isoform PI3Kcδ is selected as the representative isoform,
even though PI3Kca is one of the most readily recognized isoforms in cancer r esearch95,96. The most frequent and
pathogenic mutation residues recorded in the TCGA, E542K and E545K, are predicted correctly in our system
(see Supplementary Fig. S1). The evidence suggests that these two hotspot mutations induce glycolysis in cervical
cancer cells via the β-catenin/SIRT3 signaling p athway97. Both glutamic acid mutations (E542K and E545K) are
located in the helical domain. Biochemical studies have demonstrated that these mutated residues interact with
85a98.
p85a, so the alteration may affect the inhibitory activity of p
Our prediction system also provides observations of the microenvironment for the SAV residues. The other
case studies discussed in our results illustrate how the feature processes cope with the descriptors such as, for
example, how the feature selection process manages ASP alteration patterns. This process also yields critical detail
regarding ASP alterations (Fig. 4). ASP is a polar amino acid with a negative charge and the carboxyl group in
the side chain of aspartic acid allows it to accept hydrogen atoms. Our model calculates the area surrounding
the ASP. When the area surrounding the cancer-related ASP is unoccupied space, our model observes fewer
basic amino acids compared with neutral ASP environments. This implies that, in this situation, the ASP might
assume an interaction role with protein, whereby an ASP mutation can lead to an abnormal protein and different
binding activity. This might explain how cellular changes result in tumor activity, as is illustrated in our second
case study. In contrast, GLU is an amino acid with high polar residues and a negative charge that is also involved
in the hydrogen atom acceptor role, with a distinctly different pattern to that of ASP (Fig. 6). Cancer-related
GLUs are located in a denser region within a hydrophobic environment. Although ASP and GLU share similar
characteristics, their different microenvironments justify construction of the prediction modules.
Scientific Reports | (2021) 11:13599 | https://doi.org/10.1038/s41598-021-92793-w 12
Vol:.(1234567890)www.nature.com/scientificreports/
Figure 7. Boxplots of the microenvironment descriptors in the GLU that are altered to the GLY subgroup. All
microenvironment descriptors are divided into nine groups: (a) atoms in SAV chain, (b) atoms in whole protein,
(c) atoms in other chains or molecules, (d) H-group, (e) V-group, (f) Z-group, (g) P-group, (h) F-groups, and (i)
E-groups. The white and grey boxes represented the distribution of cancer-related and neutral SAVs. The label
of selected descriptors by the genetic algorithm are bold in the x-axis. The symbol stars denote the values of each
feature in the case of E194G located at CASQ.
We suggest that protein structure and microenvironment features are the cornerstones of cancer research.
Slight alterations in protein conformation properties may change the functional activity of molecular interactions.
Clarifying protein structure is critical to understanding how a protein mutation can lead to cancer. However,
the critical necessity for the protein structures is also the limitation of our prediction systems. Many emerging
computational methods are attempting to clarify protein structure. For those proteins that only have sequence
information, scientists can use a homology modeling method or an artificial intelligence system to extract the
details needed for structural information. Notably, AlphaFold2 is considered to be an excellent solution to the
problematic issue of protein folding99. As more protein structures become available over time, our model will
benefit from the enriched databases, regardless of whether the data are sourced from experimental or predicted
methods.
Scientific Reports | (2021) 11:13599 | https://doi.org/10.1038/s41598-021-92793-w 13
Vol.:(0123456789)www.nature.com/scientificreports/
Figure 8. The heatmap of selected features in each training group of two prediction systems.
Method Dataset Accuracy Sensitivity Specificity MCC Precision F1 score
CanSavPre Independent set 30 0.8743 0.5844 0.8942 0.3419 0.2752 0.3742
CanSavPre Independent set 40 0.8550 0.5839 0.8830 0.3699 0.3394 0.4292
DEOGEN2 Independent set 30 0.7222 0.5517 0.7337 0.1539 0.1225 0.2005
DEOGEN2 Independent set 40 0.6927 0.4693 0.7156 0.1170 0.1447 0.2212
Table 8. Comparison of prediction performance values with DEOGEN2 in the independent sets.
In conclusion, we have developed a structure-based cancer-related single amino acid variation prediction
system. This system not only displays excellent performance, but it also observes how the amino acid substitu-
tion influences protein activities. The descriptors provided by our system may offer targets for further research.
Moreover, performance is markedly enhanced by the fact that the model includes conformation properties and
details of the microenvironments surrounding SAVs. Furthermore, our algorithm detects the best combination of
feature vectors for examining specific amino acid variations. Importantly, our model is a user-friendly web-based
tool that scientists will find extremely useful when performing cancer research and precision medicine, particu-
larly when investigating rare tumor mutations. The many genetic mutations in human cancers offer us numerous
targets and possibilities that may be incorporated into our model, emphasizing its importance in cancer research.
Received: 18 March 2021; Accepted: 16 June 2021
References
1. Sunyaev, S., Ramensky, V. & Bork, P. Towards a structural basis of human non-synonymous single nucleotide polymorphisms.
Trends Genet. 16, 198–200 (2000).
2. Yue, P., Li, Z. & Moult, J. Loss of protein structure stability as a major causative factor in monogenic disease. J. Mol. Biol. 353,
459–473. https://doi.org/10.1016/j.jmb.2005.08.020 (2005).
3. Juritz, E. et al. On the effect of protein conformation diversity in discriminating among neutral and disease related single amino
acid substitutions. BMC Genom. 13(Suppl 4), S5. https://doi.org/10.1186/1471-2164-13-S4-S5 (2012).
4. Stitziel, N. O. et al. Structural location of disease-associated single-nucleotide polymorphisms. J. Mol. Biol. 327, 1021–1030.
https://doi.org/10.1016/s0022-2836(03)00240-7 (2003).
5. Teng, S., Srivastava, A. K., Schwartz, C. E., Alexov, E. & Wang, L. Structural assessment of the effects of amino acid substitutions
on protein stability and protein protein interaction. Int. J. Comput. Biol. Drug Des. 3, 334–349. https://doi.org/10.1504/IJCBDD.
2010.038396 (2010).
6. Redler, R. L., Das, J., Diaz, J. R. & Dokholyan, N. V. Protein destabilization as a common factor in diverse inherited disorders.
J. Mol. Evol. 82, 11–16. https://doi.org/10.1007/s00239-015-9717-5 (2016).
7. Ponzoni, L. & Bahar, I. Structural dynamics is a determinant of the functional significance of missense variants. Proc. Natl. Acad.
Sci. U S A 115, 4164–4169. https://doi.org/10.1073/pnas.1715896115 (2018).
Scientific Reports | (2021) 11:13599 | https://doi.org/10.1038/s41598-021-92793-w 14
Vol:.(1234567890)www.nature.com/scientificreports/
8. Bromberg, Y. & Rost, B. Correlating protein function and stability through the analysis of single amino acid substitutions. BMC
Bioinform. 10, S8. https://doi.org/10.1186/1471-2105-10-S8-S8 (2009).
9. David, A., Razali, R., Wass, M. N. & Sternberg, M. J. Protein-protein interaction sites are hot spots for disease-associated non-
synonymous SNPs. Hum. Mutat. 33, 359–363. https://doi.org/10.1002/humu.21656 (2012).
10. Yates, C. M. & Sternberg, M. J. Proteins and domains vary in their tolerance of non-synonymous single nucleotide polymorphisms
(nsSNPs). J. Mol. Biol. 425, 1274–1286. https://doi.org/10.1016/j.jmb.2013.01.026 (2013).
11. Niroula, A. & Vihinen, M. Harmful somatic amino acid substitutions affect key pathways in cancers. BMC Med Genom. 8, 53.
https://doi.org/10.1186/s12920-015-0125-x (2015).
12. Lori, C. et al. Effect of single amino acid substitution observed in cancer on Pim-1 kinase thermodynamic stability and structure.
PLoS ONE 8, e64824. https://doi.org/10.1371/journal.pone.0064824 (2013).
13. Song, C. et al. Large-scale quantification of single amino-acid variations by a variation-associated database search strategy. J.
Proteome Res. 13, 241–248. https://doi.org/10.1021/pr400544j (2014).
14. Cancer Genome Atlas Research, N. Integrated genomic analyses of ovarian carcinoma. Nature 474, 609–615. https://doi.org/
10.1038/nature10166 (2011).
15. Cancer Genome Atlas Research, N. Comprehensive molecular profiling of lung adenocarcinoma. Nature 511, 543–550. https://
doi.org/10.1038/nature13385 (2014).
16. Balmain, A. The critical roles of somatic mutations and environmental tumor-promoting agents in cancer risk. Nat. Genet. 52,
1139–1143. https://doi.org/10.1038/s41588-020-00727-5 (2020).
17. McFarland, C. D. et al. The damaging effect of passenger mutations on cancer progression. Cancer Res. 77, 4763–4772. https://
doi.org/10.1158/0008-5472.CAN-15-3283-T (2017).
18. Chen, J. et al. Genetic regulatory subnetworks and key regulating genes in rat hippocampus perturbed by prenatal malnutrition:
Implications for major brain disorders. Aging (Albany NY) 12, 8434–8458. https://doi.org/10.18632/aging.103150 (2020).
19. Li, H. et al. Co-expression network analysis identified hub genes critical to triglyceride and free fatty acid metabolism as key
regulators of age-related vascular dysfunction in mice. Aging (Albany NY) 11, 7620–7638. https://d oi.o
rg/1 0.1 8632/a ging.1 02275
(2019).
20. Son, H., Kang, H., Kim, H. S. & Kim, S. Somatic mutation driven codon transition bias in human cancer. Sci. Rep. 7, 14204.
https://doi.org/10.1038/s41598-017-14543-1 (2017).
21. Tsuber, V., Kadamov, Y., Brautigam, L., Berglund, U. W. & Helleday, T. Mutations in cancer cause gain of cysteine, histidine, and
tryptophan at the expense of a net loss of arginine on the proteome level. Biomolecules https://doi.org/10.3390/biom7030049
(2017).
22. Anoosha, P., Sakthivel, R. & Michael Gromiha, M. Exploring preferred amino acid mutations in cancer genes: Applications to
identify potential drug targets. Biochim. Biophys. Acta 1862, 155–165. https://doi.org/10.1016/j.bbadis.2015.11.006 (2016).
23. Halasi, M. et al. ROS inhibitor N-acetyl-L-cysteine antagonizes the activity of proteasome inhibitors. Biochem. J. 454, 201–208.
https://doi.org/10.1042/BJ20130282 (2013).
24. Szpiech, Z. A. et al. Prominent features of the amino acid mutation landscape in cancer. PLoS ONE 12, e0183273. https://doi.
org/10.1371/journal.pone.0183273 (2017).
25. Tan, H., Bao, J. & Zhou, X. Genome-wide mutational spectra analysis reveals significant cancer-specific heterogeneity. Sci. Rep.
5, 12566. https://doi.org/10.1038/srep12566 (2015).
26. Yu, H. et al. LEPR hypomethylation is significantly associated with gastric cancer in males. Exp. Mol. Pathol. 116, 104493. https://
doi.org/10.1016/j.yexmp.2020.104493 (2020).
27. Liu, M. et al. A multi-model deep convolutional neural network for automatic hippocampus segmentation and classification in
Alzheimer’s disease. Neuroimage 208, 116459. https://doi.org/10.1016/j.neuroimage.2019.116459 (2020).
28. Mularoni, L., Sabarinathan, R., Deu-Pons, J., Gonzalez-Perez, A. & Lopez-Bigas, N. OncodriveFML: A general framework to
identify coding and non-coding regions with cancer driver mutations. Genome Biol. 17, 128. https://doi.org/10.1186/s13059-
016-0994-0 (2016).
29. Wang, Z. et al. Cancer driver mutation prediction through Bayesian integration of multi-omic data. PLoS ONE 13, e0196939.
https://doi.org/10.1371/journal.pone.0196939 (2018).
30. Richards, S. et al. Standards and guidelines for the interpretation of sequence variants: A joint consensus recommendation of the
American College of Medical Genetics and Genomics and the Association for Molecular Pathology. Genet. Med. 17, 405–424.
https://doi.org/10.1038/gim.2015.30 (2015).
31. Qian, D. et al. A Bayesian framework for efficient and accurate variant prediction. PLoS ONE 13, e0203553. https://doi.org/10.
1371/journal.pone.0203553 (2018).
32. Chen, H. et al. Comprehensive assessment of computational algorithms in predicting cancer driver mutations. Genome Biol.
21, 43. https://doi.org/10.1186/s13059-020-01954-z (2020).
33. Carter, H. et al. Cancer-specific high-throughput annotation of somatic mutations: Computational prediction of driver missense
mutations. Cancer Res. 69, 6660–6667. https://doi.org/10.1158/0008-5472.CAN-09-1133 (2009).
34. Raimondi, D. et al. DEOGEN2: Prediction and interactive visualization of single amino acid variant deleteriousness in human
proteins. Nucleic Acids Res. 45, W201–W206. https://doi.org/10.1093/nar/gkx390 (2017).
35. Bailey, M. H. et al. Comprehensive characterization of cancer driver genes and mutations. Cell 174, 1034–1035. https://doi.org/
10.1016/j.cell.2018.07.034 (2018).
36. Care, M. A., Needham, C. J., Bulpitt, A. J. & Westhead, D. R. Deleterious SNP prediction: Be mindful of your training data!.
Bioinformatics 23, 664–672. https://doi.org/10.1093/bioinformatics/btl649 (2007).
37. Li, J. et al. A bioinformatics workflow for variant peptide detection in shotgun proteomics. Mol. Cell Proteom. 10, M110006536.
https://doi.org/10.1074/mcp.M110.006536 (2011).
38. Zhang, M. et al. CanProVar 2.0: An updated database of human cancer proteome variation. J. Proteome Res. 16, 421–432. https://
doi.org/10.1021/acs.jproteome.6b00505 (2017).
39. O’Donovan, C., Apweiler, R. & Bairoch, A. The human proteomics initiative (HPI). Trends Biotechnol. 19, 178–181. https://doi.
org/10.1016/s0167-7799(01)01598-0 (2001).
40. Bamford, S. et al. The COSMIC (Catalogue of Somatic Mutations in Cancer) database and website. Br. J. Cancer 91, 355–358.
https://doi.org/10.1038/sj.bjc.6601894 (2004).
41. Hamosh, A., Scott, A. F., Amberger, J. S., Bocchini, C. A. & McKusick, V. A. Online Mendelian Inheritance in Man (OMIM),
a knowledgebase of human genes and genetic disorders. Nucleic Acids Res. 33, D514-517. https://doi.org/10.1093/nar/gki033
(2005).
42. Cancer Genome Atlas Research, N. Comprehensive genomic characterization defines human glioblastoma genes and core
pathways. Nature 455, 1061–1068. https://doi.org/10.1038/nature07385 (2008).
43. Greenman, C. et al. Patterns of somatic mutation in human cancer genomes. Nature 446, 153–158. https://d oi.o rg/1 0.1 038/n
atur
e05610 (2007).
44. Sjoblom, T. et al. The consensus coding sequences of human breast and colorectal cancers. Science 314, 268–274. https://doi.
org/10.1126/science.1133427 (2006).
45. Altschul, S. F., Gish, W., Miller, W., Myers, E. W. & Lipman, D. J. Basic local alignment search tool. J. Mol. Biol. 215, 403–410.
https://doi.org/10.1016/S0022-2836(05)80360-2 (1990).
Scientific Reports | (2021) 11:13599 | https://doi.org/10.1038/s41598-021-92793-w 15
Vol.:(0123456789)You can also read