Iron derived from autophagy-mediated ferritin degradation induces cardiomyocyte death and heart failure in mice - eLife
←
→
Page content transcription
If your browser does not render page correctly, please read the page content below
RESEARCH ARTICLE

                                        Iron derived from autophagy-mediated
                                        ferritin degradation induces
                                        cardiomyocyte death and heart failure in
                                        mice
                                        Jumpei Ito1,2, Shigemiki Omiya1, Mara-Camelia Rusu1, Hiromichi Ueda3,
                                        Tomokazu Murakawa1, Yohei Tanada1, Hajime Abe1, Kazuki Nakahara1,
                                        Michio Asahi2, Manabu Taneike1,3, Kazuhiko Nishida1, Ajay M Shah1, Kinya Otsu1*
                                        1
                                          The School of Cardiovascular Medicine and Sciences, King’s College London British
                                        Heart Foundation Centre of Excellence, London, United Kingdom; 2Department of
                                        Pharmacology, Faculty of Medicine, Osaka Medical College, Osaka, Japan;
                                        3
                                          Department of Cardiovascular Medicine, Graduate School of Medicine, Osaka
                                        University, Osaka, Japan

                                        Abstract Heart failure is a major public health problem, and abnormal iron metabolism is
                                        common in patients with heart failure. Although iron is necessary for metabolic homeostasis, it
                                        induces a programmed necrosis. Iron release from ferritin storage is through nuclear receptor
                                        coactivator 4 (NCOA4)-mediated autophagic degradation, known as ferritinophagy. However, the
                                        role of ferritinophagy in the stressed heart remains unclear. Deletion of Ncoa4 in mouse hearts
                                        reduced left ventricular chamber size and improved cardiac function along with the attenuation of
                                        the upregulation of ferritinophagy-mediated ferritin degradation 4 weeks after pressure overload.
                                        Free ferrous iron overload and increased lipid peroxidation were suppressed in NCOA4-deficient
                                        hearts. A potent inhibitor of lipid peroxidation, ferrostatin-1, significantly mitigated the
                                        development of pressure overload-induced dilated cardiomyopathy in wild-type mice. Thus, the
*For correspondence:                    activation of ferritinophagy results in the development of heart failure, whereas inhibition of this
kinya.otsu@kcl.ac.uk                    process protects the heart against hemodynamic stress.

Competing interests: The
authors declare that no
competing interests exist.
                                        Introduction
Funding: See page 20                    Heart failure is the leading cause of death in developed countries (Ponikowski et al., 2016). There is
Received: 16 August 2020                substantial evidence to suggest the involvement of oxidative stress and cardiomyocyte death in the
Accepted: 08 January 2021               pathogenesis of heart failure (Whelan et al., 2010). Iron metabolism in heart failure patients is dysre-
Published: 02 February 2021             gulated (Lavoie, 2020), but it remains unclear whether these changes are pathogenetic and detri-
                                        mental or adaptative and protective for the heart. While iron is essential for oxidative
Reviewing editor: Noriaki
Emoto, Kobe Pharmaceutical
                                        phosphorylation, metabolite synthesis, and oxygen transport (Andrews and Schmidt, 2007), it can
University, Japan                       generate toxic reactive hydroxyl radicals through the Fenton reaction (Papanikolaou and Pantopou-
                                        los, 2005). Iron-dependent necrotic cell death is characterized by iron overload and an increased
    Copyright Ito et al. This article
                                        level of lipid reactive oxygen species (ROS) such as lipid hydroperoxides, leading to phospholipid
is distributed under the terms of
                                        damage, plasma membrane disruption, and caspase- and necrosome-independent cell death
the Creative Commons
Attribution License, which              (Dixon et al., 2012). Ferroptosis is a form of iron-dependent necrosis. Multiple molecular compo-
permits unrestricted use and            nents contribute to the execution of ferroptosis, such as transferrin–iron, cystine–glutathione, and
redistribution provided that the        glutamine pathways (Gao et al., 2015). Glutathione peroxidase 4 (GPX4) is a phospholipid hydroper-
original author and source are          oxide-reducing enzyme that uses glutathione as a substrate. The failure of GPX4 to clear lipid ROS
credited.                               leads to lipid peroxidation and ferroptosis (Yang et al., 2014). Glutamate through the glutamine-

Ito et al. eLife 2021;10:e62174. DOI: https://doi.org/10.7554/eLife.62174                                                                1 of 23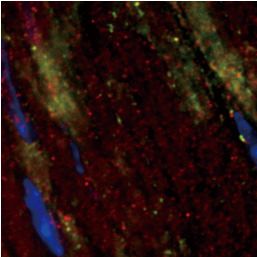
Research article                                                                        Biochemistry and Chemical Biology Medicine

                                    fueled intracellular metabolic process glutaminolysis induces ferroptosis (Gao et al., 2015). Ferrop-
                                    tosis has been implicated in the pathological process associated with ROS-induced tissue injury,
                                    such as ischemia/reperfusion in the brain, kidney, and heart (Fang et al., 2019; Linkermann et al.,
                                    2014; Tuo et al., 2017).
                                       Iron is stored in ferritin protein complexes in the cell to prevent an increase in the size of the
                                    labile iron pool that normally follows iron overload. Ferritin is a ubiquitously expressed cytosolic het-
                                    eropolymer composed of H-chains (FTH1) and L-chains (FTL) (Arosio et al., 2009). FTH1 has ferroxi-
                                    dase activity and sequestrates ferrous iron (Fe2 ) from the Fenton reaction in which the spontaneous
                                    oxidation to ferric iron (Fe3 ) donates single electrons to transform innocuous hydrogen peroxide to
                                    highly toxic hydroxyl free radicals. In the case of iron overload, ferritin subunits are induced by inacti-
                                    vating the iron regulatory protein (IREB)/iron-responsive element pathway. By contrast, under condi-
                                    tions of iron deficiency or increased iron requirement, ferritin is degraded and mediated through a
                                    selective form of autophagy, called ferritinophagy. Nuclear receptor coactivator 4 (NCOA4) is a
                                    cargo receptor for ferritinophagy that interacts with FTH1 and promotes the transport of ferritin to
                                    the autophagosome for degradation (Dowdle et al., 2014; Mancias et al., 2014). NCOA4-depen-
                                    dent iron release from ferritin storage is necessary for erythropoiesis (Bellelli et al., 2016).

                                    Results
                                    Generation and characterization of cardiomyocyte-specific NCOA4-
                                    deficient mice
                                    To examine the in vivo role of NCOA4-dependent ferritin degradation in the heart, cardiomyocyte-
                                    specific NCOA4-deficient mice were generated (Figure 1—figure supplement 1A and B). The
                                    homozygous floxed Ncoa4 mice (Ncoa4flox/flox) appeared normal and were externally indistinguish-
                                    able from littermates of other genotypes. The Ncoa4flox/flox mice were crossed with transgenic mice
                                    expressing a-myosin heavy chain (Myh6) promoter-driven Cre recombinase (Myh6-Cre)
                                    (Nishida et al., 2004) to generate cardiomyocyte-specific NCOA4-deficient mice (Ncoa4–/–), Ncoa4-
                                    flox/flox
                                              ;Myh6-Cre+. The Ncoa4flox/flox;Myh6-Cre– littermates were used as controls (Ncoa4+/+). The
                                    Ncoa4+/+ and Ncoa4–/– mice were born at the expected Mendelian ratio (54 and 51 mice, respec-
                                    tively), and they grew to adulthood and were fertile. The protein and mRNA levels of NCOA4 were
                                    significantly decreased in Ncoa4–/– hearts by 84% and 81% compared to control, respectively (Fig-
                                    ure 1—figure supplement 1C and D). No differences in any physiological or echocardiographic
                                    parameters were observed between the Ncoa4–/– and Ncoa4+/+ mice (Figure 1—source data 2).

                                    Attenuation of pressure overload-induced cardiac remodeling in
                                    NCOA4-deficient mice
                                    To examine whether NCOA4 is related to cardiac remodeling in vivo, Ncoa4+/+ and Ncoa4–/– mice
                                    were subjected to pressure overload employing transverse aortic constriction (TAC) and evaluated 4
                                    weeks after the operation. Pressure overload increased the left ventricular (LV) chamber size, indi-
                                    cated by the end-diastolic and end-systolic LV internal dimensions, and reduced fractional shorten-
                                    ing (an index of contractility) in Ncoa4+/+ mice compared to sham-operated controls (Figure 1A
                                    and B). These pressure overload-induced changes in heart size and function were suppressed in
                                    Ncoa4–/– mice. The calculated LV mass, LV weight-to-tibia length ratio, and the cross-sectional area
                                    of cardiomyocytes, which are parameters for cardiac hypertrophy, were elevated by pressure over-
                                    load in both Ncoa4+/+ and Ncoa4–/– mice, but those were significantly lower in TAC-operated
                                    Ncoa4–/– mice than in TAC-operated controls (Figure 1B,C and D). TAC-operated Ncoa4+/+ mice
                                    displayed higher mRNA expression levels of the cardiac remodeling markers, Nppa, Nppb, and
                                    Myh7 than TAC-operated Ncoa4–/– mice (Figure 1—figure supplement 2). Furthermore, the lung
                                    weight-to-tibia length ratio, an index of lung congestion, was significantly elevated in TAC-operated
                                    Ncoa4+/+ mice compared to both sham-operated Ncoa4+/+ and TAC-operated Ncoa4–/– mice
                                    (Figure 1C). The extent of pressure overload-induced fibrosis in heart sections and the mRNA levels
                                    of Col1a2 and Col3a1, markers for fibrosis, in Ncoa4–/– mice were lower than in Ncoa4+/+ mice
                                    (Figure 1D and Figure 1—figure supplement 2). There were no differences in echocardiographic
                                    parameters between TAC-operated Myh6-Cre+ and Myh6-Cre– mice 4 weeks after TAC (Figure 1—
                                    figure supplement 3). Thus, the overexpression of Cre recombinase in the heart has no effect on

Ito et al. eLife 2021;10:e62174. DOI: https://doi.org/10.7554/eLife.62174                                                               2 of 23
Research article Biochemistry and Chemical Biology Medicine
A B
NS NS NS
NS NS NS
5 5 60
LVIDd (mm)
LVIDs (mm)
4 4
FS (%)
3 3 40
Sham 2 2 20
1 1
0 0 0
Ncoa4+/+ Ncoa4–/– Ncoa4+/+ Ncoa4–/– Ncoa4+/+ Ncoa4–/–
NS NS
NS NS NS
1.5 1.5 200
LV mass (mg)
LVPWd (mm)
TAC
IVSd (mm)
1.0 1.0 150
100
0.5 0.5 50
Ncoa4+/+ Ncoa4–/–
0.0 0.0 0
Ncoa4+/+ Ncoa4–/– Ncoa4+/+ Ncoa4–/– Ncoa4+/+ Ncoa4–/–
C D
NS NS
LV/Tibia (mg/mm)
Fibrotic area (%)
NS
Wheat germ Masson's Hematoxylin
15 15
agglutinin trichrome and eosin
10 10
5 5
0 0
Ncoa4+/+ Ncoa4–/– Ncoa4+/+ Ncoa4–/–
cross-sectional area (Pm2)
Lung/Tibia (mg/mm)
NS NS
Cardiomyocyte
NS
40 800
30 600
20 400
10 200
0 Sham TAC Sham TAC 0
Ncoa4+/+ Ncoa4–/– Ncoa4+/+ Ncoa4–/–
Ncoa4+/+ Ncoa4–/–
Sham TAC
Figure 1. Cardiomyocyte-specific Ncoa4 ablation attenuated the development of pressure overload-induced heart failure. The Ncoa4+/+ and Ncoa4–/–
mice were subjected to pressure overload by transverse aortic constriction (TAC) and analyzed 4 weeks after the operation. (A) Representative images
of transthoracic M-mode echocardiographic tracing. Scale bars, 0.1 s and 2 mm, respectively. (B) Echocardiographic parameters of the mice (n = 10
biologically independent samples). LVIDd and LVIDs, end-diastolic and end-systolic left ventricular (LV) internal dimensions; IVSd, end-diastolic
interventricular septum thickness; LVPWd, end-diastolic LV posterior wall thickness; FS, fractional shortening. (C) Physiological parameters of the mice
(n = 10 biologically independent samples). (D) Representative images of the hematoxylin-eosin-stained (upper), Masson’s trichrome-stained (middle),
and wheat germ agglutinin-stained (lower) heart sections. Scale bar, 50 mm. The upper and lower right graphs show the ratio of the fibrotic area to
whole heart section and the cross-sectional area of cardiomyocytes, respectively (n = 5 biologically independent samples). The data were evaluated by
one-way analysis of variance (ANOVA), followed by Tukey–Kramer’s post hoc test. *pResearch article Biochemistry and Chemical Biology Medicine
Attenuation of upregulation of ferritinophagy in pressure-overloaded
NCOA4-deficient hearts
The level of ferritinophagy in pressure-overloaded hearts was then evaluated 4 weeks after TAC. The
protein level of FTH1 was decreased in Ncoa4+/+ hearts compared to both sham-operated Ncoa4+/+
A B F
Number of LC3B-FTH1
NS
NS
dots (/10 Pm )
NS
2.5 1.5
FTH1/GAPDH
3
2
Fth1/Gapdh
FTH1 20 kDa 2.0
1.0 2
3
1.5
37 kDa 1.0 0.5 1
NS
GAPDH 0.5
Sham TAC Sham TAC 0.0 0.0 0
Ncoa4+/+ Ncoa4–/– Ncoa4+/+ Ncoa4–/–
5 ay s
7 ay s
ys
3 am
w
da
4
+/+ –/–
Ncoa4 Ncoa4
Sh
d
d
Sham TAC
C D H TAC
Number of LAMP2a-FTH1
dots (/103 Pm2)
NS
FTH1/GAPDH
1.5 2.5 6
Fth1/Gapdh
2.0 NS NS
FTH1 20 kDa 1.0 1.5 4 NS NS
0.5 1.0 2
GAPDH 37 kDa 0.5
0.0 0.0 0
5 ays
7 ays
ys
5 ays
7 ays
ys
w
3 am
3 am
w
5 ays
7 ays
ys
3 am
w
Sham 3 days 5 days7 days 4 w
da
da
4
4
da
4
Sh
Sh
Sh
d
d
d
d
d
d
TAC
TAC TAC TAC
E Merge G Merge
(lower magnification) LC3 FTH1 Merge (lower magnification) LAMP2a FTH1 Merge
Sham
Sham
3 days
3 days
5 days
5 days
TAC
TAC
7 days
7 days
4w
4w
Figure 2. The time course of ferritinophagy in the heart after transverse aortic constriction (TAC). (A) Western blot analysis of FTH1 in Ncoa4+/+ and
Ncoa4–/– hearts 4 weeks after TAC. GAPDH was used as the loading control. The right-hand graphs show the densitometric analysis. The average value
for sham-operated Ncoa4+/+ hearts was set to 1 (biologically independent samples: n = 6). (B) mRNA expression of Fth1 in the heart 4 weeks after
TAC. Gapdh mRNA was used as the loading control. The average value for sham-operated Ncoa4+/+ hearts was set to 1 (biologically independent
samples: n = 8). (C–H) The Ncoa4+/+ mice were subjected to TAC and analyzed 3 days after sham operation and 3, 5, and 7 days and 4 weeks after the
operation. (C) Heart homogenates after TAC were subjected to western blot analysis using anti-FTH1 antibody (n = 5 biologically independent samples
for each group). GAPDH was used as the loading control. (D) Cardiac Fth1 mRNA levels after TAC (n = 5 biologically independent samples). Gapdh
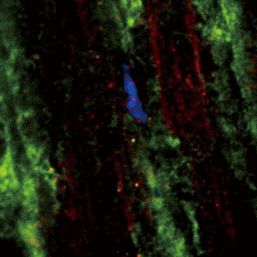
mRNA was used as the loading control. (E and F) Immunofluorescence analysis of LC3B (green) and FTH1 (red) in the heart after TAC (n = 5 biologically
independent samples). (G and H) Immunofluorescence analysis of LAMP2a (green) and FTH1 (red) in the heart after TAC (n = 5 biologically
independent samples). Scale bar, 5 mm in (E) and (G). Arrows indicate double-positive dots. The values are presented as the mean ± SEM. The data
were evaluated by one-way analysis of variance (ANOVA), followed by Tukey–Kramer’s post hoc test. *pResearch article Biochemistry and Chemical Biology Medicine
and TAC-operated Ncoa4–/– hearts (Figure 2A). However, the mRNA level of FTH1 was also
decreased in Ncoa4+/+ hearts (Figure 2B). To clarify the ferritinophagic activity, we evaluated the car-
diac phenotypes during an earlier time course after pressure overload when the secondary effect to
cardiac remodeling was minimal. Cardiac dysfunction and LV chamber dilation were observed in wild-
type Ncoa4+/+ hearts (Figure 2—figure supplement 1). Both TAC-operated Ncoa4+/+ and Ncoa4–/–
mice showed decreased fractional shortening 3 days after surgery compared to the corresponding
sham-operated group. However, there was no significant difference in fractional shortening between
TAC-operated Ncoa4+/+ and Ncoa4–/– mice, suggesting mild cardiac dysfunction observed in both
Number of LAMP2a-FTH1 Number of LC3B-FTH1
A NS
D NS
dots (/103 Pm2)
NS NS
2.0 3
FTH1/GAPDH
1.5 2
1.0
20 kDa 0.5 1
FTH1
0.0 0
GAPDH 37 kDa Ncoa4+/+ Ncoa4–/– Ncoa4+/+ Ncoa4–/–
Sham TAC Sham TAC B F
Ncoa4+/+ Ncoa4–/– NS NS
NS NS
dots (/10 Pm )
2.0 6
2
Fth1/Gapdh
1.5 4
3
Sham TAC 1.0
0.5 2
0.0 0
Ncoa4+/+ Ncoa4–/– Ncoa4+/+ Ncoa4–/–
C E
Merge Merge
(lower magnification) LC3B FTH1 Merge (lower magnification) LAMP2a FTH1 Merge
Ncoa4+/+
Ncoa4+/+
Sham-
Sham-
Ncoa4+/+
Ncoa4+/+
TAC-
TAC-
Ncoa4–/–
Ncoa4–/–
Sham-
Sham-
Ncoa4–/–
Ncoa4–/–
TAC-
TAC-
Figure 3. Ablation of Ncoa4 in cardiomyocytes showed defective ferritinophagy. (A) Western blot analysis of FTH1
in Ncoa4+/+ and Ncoa4–/– hearts 1 week after transverse aortic constriction (TAC). GAPDH was used as the
loading control. The right-hand graphs show the densitometric analysis. The average value for sham-operated
Ncoa4+/+ hearts was set to 1 (biologically independent samples: n = 5). (B) mRNA expression of Fth1 in the heart
1 week after TAC. Gapdh mRNA was used as the loading control. The average value for sham-operated Ncoa4+/+
hearts was set to 1 (biologically independent samples: n = 5). (C and D) Immunofluorescence analysis of LC3B
(green) and FTH1 (red) in the heart 1 week after TAC. The number of LC3B- and FTH1-positive dots is shown in
(D). (E and F) Immunofluorescence analysis of LAMP2a (green) and FTH1 (red) in the heart 1 week after TAC. The
number of LAPM2a- and FTH1-positive dots is shown in (F). In (C) and (E), images of the square in the merged
images are shown at higher magnification in the right three columns. Scale bar, 5 mm. Arrows indicate double-
positive dots. The data were evaluated by one-way analysis of variance (ANOVA), followed by Tukey–Kramer’s
post hoc test. *pResearch article Biochemistry and Chemical Biology Medicine
groups 3 days after TAC was due to acute response to pressure overload. The protein level of FTH1
decreased from postoperative day 5 compared to sham-operated hearts, while the level of Fth1
mRNA increased 5 and 7 days after TAC and decreased 4 weeks after TAC (Figure 2C and D). NCOA4
is responsible for the selective targeting of the ferritin complex to autophagosomes. In the TAC-oper-
ated hearts, the number of LC3B (a marker of an autophagosome)- and FTH1-positive dots increased
after postoperative day 5 and then declined 4 weeks after TAC (day 7 versus 4 weeks, pResearch article Biochemistry and Chemical Biology Medicine
A B
Fe2+ (Pg/g wet tissues)
Fe3+ (Pg/g wet tissues)
NS
Total non-heme iron
NS NS NS NS NS
( Pg/g wet tissues)
MDA (nmol/mg)
NS NS NS
100 100 20 250 2.0
Fe /FTH1
80 80 15 200 1.5
60 60 150 1.0
10
40 40 100
2+
20 20 5 50 0.5
0 0 0 0 0.0
Ncoa4+/+ Ncoa4–/– Ncoa4+/+ Ncoa4–/– Ncoa4+/+ Ncoa4–/– Ncoa4+/+ Ncoa4–/– Ncoa4+/+ Ncoa4–/–
C D E
Serum TnT (pg/mL)
NS NS NS
NS NS
GPX4/GAPDH
6 200 5
Ptgs2/Gapdh
150 GPX4 20 kDa 4
4 3
100 GAPDH 37 kDa
2 2
50 Sham TAC Sham TAC 1
0 0 Ncoa4+/+ Ncoa4–/– 0
Ncoa4+/+ Ncoa4–/– Ncoa4+/+ Ncoa4–/– Ncoa4+/+ Ncoa4–/–
GSSG (nmol/mg protein)
F NS NS G
NS NS NS NS NS
(nmol/mg protein)
(nmol/mg protein)
Total glutathione
(GSH + GSSG)
NS NS NS NS NS
Glutamine (PM)
50 50 2.5 60 400
GSH/GSSG
40 40 2.0 300
40
GSH
30 30 1.5
200
20 20 1.0 20
10 10 0.5 100
0 0 0.0 0 0
Ncoa4+/+ Ncoa4–/– Ncoa4+/+ Ncoa4–/– Ncoa4+/+ Ncoa4–/– Ncoa4+/+ Ncoa4–/– Ncoa4+/+ Ncoa4–/–
Sham TAC
Figure 4. The effect of Ncoa4 ablation on the pathways to iron-dependent cell death. (A) Tissue levels of total non-heme, ferrous, and ferric iron in
Ncoa4+/+ and Ncoa4–/– hearts 4 weeks after transverse aortic constriction (TAC) (n = 6 biologically independent samples). The ratio of the ferrous iron
level to the FTH1 protein level is shown in the right-most panel. The FTH1 protein level for sham-operated Ncoa4+/+ estimated as Western blot analysis
in hearts was set to 1. (B) Malondialdehyde (MDA) levels in heart homogenates (n = 5 biologically independent samples). (C) Ptgs2 mRNA levels in the
heart (n = 8 biologically independent samples). (D) Serum troponin T (TnT) levels (n = 8 biologically independent samples). (E) Glutathione peroxidase 4
(GPX4) levels in the heart homogenates. The right panel shows the ratio of GPX4 to GAPDH (n = 6 biologically independent samples). (F) The levels of
total glutathione (GSH+GSSG), reduced (GSH) and oxidized (GSSG) glutathione and the ratio of GSH to GSSG in heart homogenates (n = 5 biologically
independent samples). GSH levels were calculated by subtracting GSSG from total glutathione. (G) Cardiac glutamine levels (n = 5 biologically
independent samples). The data were evaluated by one-way analysis of variance (ANOVA), followed by Tukey–Kramer’s post hoc test. *pResearch article Biochemistry and Chemical Biology Medicine
together, these results show that iron-dependent necrosis plays an important role in the develop-
ment of pressure overload-induced heart failure.
Glutathione and glutamine metabolism in pressure-overloaded NCOA4-
deficient hearts
The GPX4 protein level was upregulated in TAC-operated Ncoa4+/+ hearts compared to the corre-
sponding controls, while ablation of Ncoa4 suppressed the pressure overload-induced induction of
GPX4 (Figure 4E). The levels of total and reduced glutathione (GSH) decreased and oxidized gluta-
thione (GSSG) increased in TAC-operated Ncoa4+/+ hearts, resulting in a decreased GSH to GSSG
ratio in Ncoa4 / hearts (Figure 4F). Ncoa4 ablation normalized the ratio to the sham control level.
The cysteine-glutamate antiporter (system Xc–, also known as solute carrier family 7 member 11;
SLC7A11) is a key regulator for cystine uptake in cell survival against ferroptosis (Gao et al., 2015).
There was no significant difference in the level of Slc7a11 mRNA or cardiac cystine between TAC-
operated Ncoa4+/+ and Ncoa4–/– mice (Figure 4—figure supplement 4A and B). The level of gluta-
mate in TAC-operated Ncoa4+/+ hearts was lower than that in sham-operated Ncoa4+/+ or TAC-
operated Ncoa4–/– mice (Figure 4—figure supplement 4C). L-glutamine uptake is mainly depen-
dent on the receptors SLC38A1, SLC1A5, and SLC7A5 (McGivan and Bungard, 2007), and L-gluta-
mine is converted into glutamate by glutaminase (GLS1 and GLS2). The cardiac glutamine level
decreased in TAC-operated Ncoa4+/+ hearts compared to the corresponding sham-operated mice
and was lower than that in TAC-operated Ncoa4–/– hearts (Figure 4G). There were no significant dif-
ferences in the mRNA levels of the glutamine transporters or glutaminases between TAC-operated
groups (Figure 4—figure supplement 4D). The changes in glutathione metabolism and glutaminoly-
sis in TAC-operated Ncoa4+/+ hearts were not as seen in typical ferroptosis.
Isoproterenol-induced cell death in isolated adult cardiomyocytes
The lipid ROS and labile iron pool during iron-dependent necrosis were further estimated using
adult cardiomyocytes isolated from Ncoa4+/+ and Ncoa4–/– hearts. The activation of neurohumoral
factors such as catecholamine plays an important role in the pathogenesis of heart failure (Shah and
Mann, 2011). The synthetic small-molecule compound erastin inhibits the activity of cysteine–gluta-
mate antiporter, leading to the depletion of GSH (Dixon et al., 2012). High-throughput screening
has identified ferrostatin-1 as a potent inhibitor of the accumulation of lipid ROS (Dixon et al.,
2012; Friedmann Angeli et al., 2014; Skouta et al., 2014). Erastin or isoproterenol induced cell
death in Ncoa4+/+ cardiomyocytes, while this occurred to a lesser extent in Ncoa4–/– cardiomyo-
cytes (Figure 5A and Figure 5—figure supplement 1A). Ferrostatin-1 inhibited both erastin- and
isoproterenol-induced cardiomyocyte cell death. Treatment of Ncoa4+/+ cardiomyocytes with either
erastin or isoproterenol resulted in an increase in the cellular and lipid ROS levels, as estimated using
the fluorescent probes H2DCFDA and C11-BODIPY, respectively (Dixon et al., 2012; Figure 5B and
C and Figure 5—figure supplement 1B and C). The application of either ferrostatin-1 or Ncoa4
ablation prevented the generation of erastin- or isoproterenol-induced cellular and lipid ROS, which
is in agreement with a previous report that used HT-1080 cells (Dixon et al., 2012). The labile iron
pool level was measured using calcein-acetoxymethyl ester (Yoshida et al., 2019). Erastin and iso-
proterenol could both increase the level of the labile iron pool in Ncoa4+/+ cardiomyocytes, which
was attenuated by treatment with ferrostatin-1 (Miotto et al., 2020; Figure 5D and Figure 5—fig-
ure supplement 1D). Ncoa4 ablation was effective in reducing the erastin- or isoproterenol-induced
upregulation of the labile iron pool. Isoproterenol decreased the protein level of FTH1 in an
NCOA4-dependent manner (Figure 5E). A small molecule, RSL3, is another ferroptosis inducer,
which binds and inhibits GPX4 (Yang et al., 2014). RSL3 induced cardiomyocyte death, which was
attenuated by Ncoa4 ablation or ferrostatin-1 treatment (Figure 5—figure supplement 2).
Attenuation of the development of cardiac remodeling by ferrostatin-1
To examine the involvement of iron-dependent necrosis in the pathogenesis of heart failure and
whether iron-dependent necrosis is a therapeutic target for the disease, wild-type C57BL/6J mice
received an intraperitoneal daily injection of ferrostatin-1. Four weeks after TAC, saline-administered
mice exhibited LV chamber dilation and cardiac dysfunction (Figure 6A and B). Ferrostatin-1 admin-
istration significantly reduced the LV chamber size and improved cardiac function in TAC-operated
Ito et al. eLife 2021;10:e62174. DOI: https://doi.org/10.7554/eLife.62174 8 of 23Research article Biochemistry and Chemical Biology Medicine
A B
Cell death (%)
(fold change)
Cellular ROS
60 2.5
production
†† 2.0 ††† ‡
‡‡‡
40 ‡‡‡ †
1.5
Vehicle
† ‡
20 1.0
0.5
0 0.0
Iso (PM): 0 10 100 0 10 100 Iso (PM): 0 10 100 0 10 100
Fer-1: – + – + – + – + – + – + Fer-1: – + – + – + – + – + – +
10 PM
Ncoa4+/+ Ncoa4–/– Ncoa4+/+ Ncoa4–/–
Isoproterenol
C D
Labile iron pool
(fold change)
2.0 3
(fold change)
production
Lipid ROS
††† ‡‡
1.5 2 †††
‡‡‡
100 PM
1.0
0.5 1
0.0 0
Fer-1: - + - + Iso (PM): 0 10 100 0 10 100 Iso (PM): 0 10 100 0 10 100
Fer-1: – + – + – + – + – + – + Fer-1: – + – + – + – + – + – +
Ncoa4+/+ Ncoa4–/–
E Ncoa4+/+ Ncoa4–/– Ncoa4+/+ Ncoa4–/–
FTH1/GAPDH
FTH1 20 kDa 2.0 ‡‡‡ ‡‡‡
1.5
1.0
GAPDH 37 kDa 0.5
0.0
Iso (PM): 0 10 100 0 10 100 Iso (PM): 0 10 100 0 10 100
Ncoa4+/+ Ncoa4–/– Ncoa4+/+ Ncoa4–/–
Figure 5. Isoproterenol induces iron-dependent cell death in isolated cardiomyocytes. (A) Cell death assay. Cell death was estimated using a Live/
Dead Viability/Cytotoxicity Assay Kit. Isolated mouse cardiomyocytes from Ncoa4+/+ and Ncoa4–/– hearts were treated with the indicated
concentrations of isoproterenol (Iso) with or without ferrostatin-1 (Fer-1) for 4 hr. Calcein-AM (green) is retained in live cells, while ethidium homodimer
produces red fluorescence in dead cells. Scale bar, 100 mm. The percentage of dead cells is shown in the middle left-hand graphs (n = 5 biologically
independent samples). (B and C) The accumulation of cellular (B) and lipid (C) reactive oxygen species (ROS) were assessed by H2DCFDA and C11-
BODIPY, respectively (n = 5 biologically independent samples). (D) The labile iron pool was measured using the calcein-AM method in isolated mouse
cardiomyocytes (n = 5 biologically independent samples). (E) Western blot analysis of FTH1 in isolated mouse cardiomyocytes from Ncoa4+/+ and
Ncoa4–/– hearts. GAPDH was used as the loading control. The right-hand graphs show the densitometric analysis (n = 5 biologically independent
samples). The average value for vehicle-treated without ferrostatin-1 Ncoa4+/+ cardiomyocytes was set to 1. The values are presented as the mean ±
SEM. Two-way analysis of variance (ANOVA) followed by Tukey’s multiple comparisons test was used. *pResearch article Biochemistry and Chemical Biology Medicine
A D
NS
Wheat germ Masson's Hematoxylin
cross-sectional area (Pm2) Fibrotic area (%)
NS
agglutinin trichrome and eosin
15
10
5
Sham
0
Saline Fer-1
NS
Cardiomyocyte
TAC 1000
800
600
400
Saline Fer-1
200
0
Sham TAC Sham TAC Saline Fer-1
Sham TAC Saline Fer-1
B C E
NS NS NS NS NS
Lung/Tibia (mg/mm) LV/Tibia (mg/mm)
NS
MDA (nmol/mg)
6 6 60 15 1.5
LVIDd (mm)
LVIDs (mm)
FS (%)
4 4 40 10 1.0
2 2 20 5 0.5
0 0 0 0 0.0
Saline Fer-1 Saline Fer-1 Saline Fer-1 Saline Fer-1 Saline Fer-1
NS
NS NS NS NS
F NS
NS NS NS
1.5 1.5 250 20 20
LV mass (mg)
LVPWd (mm)
Ptgs2/Gapdh
IVSd (mm)
200 15 15
1.0 1.0 150 10 10
0.5 0.5 100
50 5 5
0.0 0.0 0 0 0
Saline Fer-1 Saline Fer-1 Saline Fer-1 Saline Fer-1 Saline Fer-1
Figure 6. Inhibition of lipid peroxidation protects hearts from pressure overload. Wild-type C57BL/6J mice were subjected to transverse
aortic constriction (TAC) and analyzed 4 weeks after the operation. Ferrostatin-1 (Fer-1) or saline was intraperitoneally administered daily starting 1 day
before TAC. (A) Representative images of transthoracic M-mode echocardiographic tracing. Scale bars, 0.1 s and 2 mm, respectively. (B)
Echocardiographic parameters of the mice (n = 10 biologically independent samples). (C) Physiological parameters of the mice (n = 10 biologically
independent samples). (D) Histological analysis of the heart. Scale bar, 50 mm. The upper and lower right graphs show the ratio of the fibrotic area to
whole heart section and the cross-sectional area of cardiomyocytes, respectively (n = 5 biologically independent samples). (E) Cardiac MDA levels
(n = 5 biologically independent samples). (F) Ptgs2 mRNA levels in the hearts (n = 8 biologically independent samples). The data were evaluated by
one-way analysis of variance (ANOVA) followed by Tukey–Kramer’s post hoc test. *pResearch article Biochemistry and Chemical Biology Medicine
FTH1 decreased along with an increase in the level of Fth1 mRNA, suggesting that the downregula-
tion of FTH1 is due to its degradation. In the TAC-operated hearts, FTH1 was recruited in autopha-
gosomes or autolysosomes and this recruitment was NCOA4-dependent. These findings confirmed
that pressure overload induces the activation of NCOA4-mediated ferritinophagy, which is detrimen-
tal to the heart. The labile iron pool and oxidative stress are known to increase Fth1 mRNA
(Arosio et al., 2009), which may explain the increased level of Fth1 mRNA at the early time points
after pressure overload. The detrimental effect of FTH1 downregulation on cardiac function is sup-
ported by a recent report showing that mice lacking FTH1 in cardiomyocytes increased oxidative
stress, resulting in mild cardiac dysfunction upon aging (Fang et al., 2020).
Iron is essential for the survival of the cells, as it serves as a cofactor in the biochemical processes
such as oxygen storage, oxidative phosphorylation, and enzymatic reaction (Andrews and Schmidt,
2007). Intracellular iron levels are maintained by NCOA4-dependent ferritin degradation
(Mancias et al., 2014). While ferritin supplies iron for mitochondrial function (Fujimaki et al., 2019),
it protects the cell against free radical generation via the Fenton reaction (Papanikolaou and Panto-
poulos, 2005). These suggest the importance of NCOA4 in intracellular iron homeostasis and a dou-
ble-edged sword role of ferritinophagy. Our study presented here indicate that NCOA4-mediated
ferritinophagy is pathologic for the heart in response to pressure overload by activating iron-depen-
dent cell death. In addition, Ncoa4–/– mice showed normal cardiac function at baseline as well as
under hemodynamic stress, suggesting that iron derived from ferritin degradation is not necessary
for cardiac homeostasis or some other transit pools of iron such as low-molecular-weight chelates
including citrate, ATP, AMP, or pyrophosphate may compensate the loss of NCOA4 in the heart
(Papanikolaou and Pantopoulos, 2005). Why does the maladaptive hyperactivation of ferritinoph-
agy occur in pressure overloaded hearts? NCOA4-dependent ferritinophagy is regulated by intracel-
lular iron (Dowdle et al., 2014; Mancias et al., 2014). However, the precise activation mechanism of
ferritinophagy–cell death pathway in response to hemodynamic stress remains to be elucidated. We
found that b1-adrenergic agonist, isoproterenol, induced cardiomyocyte death in which the NCOA4-
dependent pathway, the generation of lipid ROS, and increased labile iron pool are involved. In
addition, we showed that isoproterenol induces ferritinophagy. Thus, the downstream signaling
pathways of b1-adrenergic receptors activate ferritinophagy and resultant cell death. Another possi-
bility is that isoproterenol induces intracellular iron deficiency in cardiomyocytes to lead to ferriti-
nophagy. However, the expression level of FTH1 was maintained in cardiomyocyte-specific IREB1/2-
deficient hearts with iron deficiency (Haddad et al., 2016), suggesting that iron deficiency may not
directly induce FTH1 degradation in cardiomyocytes. It is also possible that NCOA4 may associate
with NRF2/HO-1 and VDACs-induced mitochondrial dysfunction pathways in ferroptosis-induced car-
diomyocytes death and heart failure (Li et al., 2020). It has been reported that NCOA4 has associa-
tion with mitochondria iron-overload in cardiomyocyte hypertrophy pathophysiology (Tang et al.,
2019). Although NCOA4-mediated ferritin degradation contributes to maintain mitochondrial func-
tion through iron supply (Fujimaki et al., 2019), excessive ferritinophagy may induce cardiomyocyte
hypertrophy and cell death. Further studies are necessary to elucidate molecular mechanism underly-
ing NCOA4-mediated cardiomyocyte death and heart failure.
Although pressure overload decreased the level of ferrous iron in the heart, the level of ferrous
iron in Ncoa4+/+ hearts was higher than that in Ncoa4–/– hearts. The calculated non-binding fraction
of ferrous iron to FTH1 was higher in TAC-operated Ncoa4+/+ hearts. To confirm the increased level
of ferrous iron in pressure overloaded Ncoa4+/+ hearts, we measured the labile iron pool in isolated
cardiomyocytes. Erastin and isoproterenol could both increase the level of the labile iron pool in
Ncoa4+/+ cardiomyocytes, which was attenuated by Ncoa4 ablation. These suggest labile iron over-
load induced by activation of ferritinophagy in stressed cardiomyocytes, even though the pressure-
overloaded Ncoa4+/+ mice exhibited decreased total cardiac iron.
Deregulation of programmed cardiomyocyte death has been reported to play an important role
in the pathogenesis of heart failure (Whelan et al., 2010). While apoptosis is the best-studied form
of programmed cell death, there are also non-apoptotic programmed cell death. Necroptosis and
iron-dependent necrosis are two distinct regulated necrotic cell death. We observed increases in
lipid peroxidation in TAC-operated Ncoa4+/+ hearts but not in Ncoa4–/– hearts. In addition, ferrosta-
tin-1 attenuated the development of pressure overload-induced cardiac remodeling. Taken
together, these results show that iron-dependent necrosis plays an important role in the develop-
ment of pressure overload-induced heart failure. Ferrostatin-1 did not provide additional protection
Ito et al. eLife 2021;10:e62174. DOI: https://doi.org/10.7554/eLife.62174 11 of 23Research article Biochemistry and Chemical Biology Medicine
from pressure overload-induced cardiac remodeling in Ncoa4–/– mice, suggesting that iron-depen-
dent cardiomyocyte death is downstream of NCOA4-mediated ferritinophagy. GPX4 inhibits the for-
mation of lipid peroxidation and ferroptosis (Yang et al., 2014), while glutaminolyis is required for
the execution of ferroptosis. We found that Ptgs2 mRNA, a putative marker for ferroptosis, was
upregulated TAC-operated Ncoa4+/+ hearts; however, the GPX4 protein level was upregulated,
while glutamate and glutamine were downregulated in TAC-operated Ncoa4+/+ hearts. The mRNA
of Slc7a11 in system Xc– and cystine showed no difference between TAC-operated Ncoa4+/+ and
Ncoa4–/– hearts. These results suggest that the pressure overload-induced increase in GPX4 was
compensatory to prevent iron-dependent necrosis, and insufficient induction of GPX4 may lead to
the increase in lipid ROS and the downregulation of glutamine or glutamate was also a compensa-
tory mechanism to inhibit iron-dependent necrosis. ROS have a variety of physiological and patho-
logical functions depending on their source, species and local concentration, local antioxidant
environment, and possibly the disease stage (Papaharalambus and Griendling, 2007). Intensive
studies have implicated ROS in the development of cardiovascular pathology including cardiac
remodeling (Ponikowski et al., 2016). However, the failure of clinical trials using antioxidants
requests more precise understanding of the sources and contribution of ROS in heart failure. Our
study indicates that lipid ROS derived from ferritinophagy and the Fenton reaction plays an impor-
tant role in the pathogenesis of heart failure. Thus, our study supports the notion that inhibiting lipid
peroxidation is cardioprotective during pressure overload.
Iron deficiency is a common condition affecting approximately 50% of patients with heart failure
(Lavoie, 2020). Clinical trials have demonstrated the symptomatic benefit of treating iron-deficient
heart failure patients with intravenous iron supplementation (Anker et al., 2009; Ghafourian et al.,
2020). However, heart failure patients may have underlying myocardial iron overload
(Ghafourian et al., 2020; Sawicki et al., 2015). In addition, a high-iron diet caused severe cardiac
dysfunction in cardiomyocyte-specific FTH1-deficient mice (Fang et al., 2020). These raises concerns
about the safety of the prolonged use of iron supplementation in heart failure patients. The long-
term safety of iron supplementation in heart failure patients must be determined. Our results do not
contradict the clinical trials but rather imply a potential role for reducing iron-dependent cell death
in patients with heart failure.
In summary, the data presented here reveal a novel mechanism underlying the pathogenesis of
heart failure. Iron-dependent cardiomyocyte death plays an important role in the development of
pressure overload-induced heart failure. The inhibition of iron-dependent cardiomyocyte death can
be a novel therapeutic mechanism for patients with heart failure.
Materials and methods
Key resources table
Reagent type
(species) or resource Designation Source or reference Identifiers Additional information
Strain, strain C57BL/6J Envigo C57BL/6OlaHsd
background UK
(male Mus musculus)
Strain, strain Ncoa4flox/flox;Myh6-Cre+ This paper See Materials and methods
background
(male Mus musculus)
Strain, strain Ncoa4flox/flox;Myh6-Cre– This paper See Materials and methods
background
(male Mus musculus)
Strain, strain Myh6-Cre+ Nishida et al., 2004 See Materials and methods
background
(male Mus musculus)
Antibody Mouse monoclonal Sigma-Aldrich SAB1404569, Lot: (1:1000)
antibody to NCOA4 HC071-1F11,
RRID:AB_10759525
Continued on next page
Ito et al. eLife 2021;10:e62174. DOI: https://doi.org/10.7554/eLife.62174 12 of 23Research article Biochemistry and Chemical Biology Medicine
Continued
Reagent type
(species) or resource Designation Source or reference Identifiers Additional information
Antibody Rabbit polyclonal Cell Signaling Technology 3998, Lot: 2, for western blots,
antibody to FTH1 RRID:AB_1903974 (1:1000); for
immunofluorescence,
(1:100)
Antibody Mouse monoclonal Cell Signaling Technology 83506, Lot: (1:100)
antibody to LC3B 1, RRID:AB_2800018
Antibody Rat monoclonal Abcam ab13524, Lot: GR3317907-1, (1:100)
antibody to LAMP2a RRID:AB_2134736
Antibody Rat monoclonal Millipore MABS1274, Lot: Q2633070, (1:1000)
antibody to GPX4 RRID:AB_2885039
Antibody Rabbit polyclonal Millipore 393207, Lot: 3167038, (1:500)
antibody to 4-HNE RRID:AB_566310
Antibody Rabbit polyclonal Thermo Fisher Scientific PA1-16543, Lot: TK2666362A, (1:250)
antibody to IREB2 RRID:AB_2126583
Antibody Rabbit polyclonal Alpha Diagnostic International MTP11-A, Lot: 1169899A3-L, (1:1000)
antibody to SLC40A1 RRID:AB_1619475
Antibody Mouse monoclonal Thermo Fisher Scientific 13–6800, Lot: TI275369, (1:1000)
antibody to TFRC RRID:AB_2533029
Antibody Rabbit polyclonal antibody Abcam ab13534, Lot: GR33618-66, (1:1000)
to SOD2 RRID:AB_2191667
Antibody Rabbit polyclonal antibody Enzo Life Sciences ADI-SPA-895, Lot: 03301708, (1:1000)
to HO-1 RRID:AB_10618757
Antibody Mouse monoclonal antibody Sigma-Aldrich G8795, Lot: 056M4856V, (1:10000)
to GAPDH RRID:AB_1078991
Antibody Mouse immunoglobulin Santa Cruz biochemistry sc-2025,
RRID:AB_737182
Antibody Rabbit IgG Abcam ab37415,
RRID:AB_2631996
Antibody Fluorescein isothiocyanate- Sigma-Aldrich L4895
conjugated lectin
Antibody Alexa Fluor 488 Thermo Fisher Scientific A21202, (1:500)
donkey-anti-mouse RRID:AB_141607
Antibody Alexa Fluor 568 Thermo Fisher Scientific A10042, (1:500)
donkey-anti-rabbit RRID:AB_2534017
Antibody Alexa Fluor 488 Thermo Fisher Scientific A11006, (1:500)
goat-anti-rat RRID:AB_2534074
Antibody IRDye 680LT Donkey LI-COR Biosciences 926–68020, (1:10,000)
anti-Mouse IgG Secondary RRID:AB_10706161
Antibody
Antibody IRDye 680LT Donkey LI-COR Biosciences 926–68023, (1:10,000)
anti-Rabbit IgG Secondary RRID:AB_10706167
Antibody
Antibody IRDye 680LT Goat anti-Rat LI-COR Biosciences 926–68029, RRID:AB_10715073 (1:10,000)
IgG Secondary Antibody
Commercial assay or kit Pierce Protein G Thermo Scientific 88848
Magnetic Beads
Commercial assay or kit RNeasy Fibrous QIAGEN 74704
Tissue Mini Kit
Commercial assay or kit SuperScript IV Thermo Fisher Scientific 18091050
First-Strand Synthesis System
Commercial assay or kit PowerUp SYBR Green Thermo Fisher Scientific A25742
Master Mix
Commercial assay or kit Masson’s Trichrome Stain Kit Polysciences, Inc 25088–1
Continued on next page
Ito et al. eLife 2021;10:e62174. DOI: https://doi.org/10.7554/eLife.62174 13 of 23Research article Biochemistry and Chemical Biology Medicine
Continued
Reagent type
(species) or resource Designation Source or reference Identifiers Additional information
Commercial assay or kit VECTASTAIN Elite ABC-HRP Vector Laboratories Inc PK-6101
Kit, Peroxidase (Rabbit IgG)
Commercial assay or kit DAB Substrate Kit, Peroxidase Vector Laboratories Inc SK-4100
(HRP), with Nickel,
(3,3’-diaminobenzidine)
Commercial assay or kit normal donkey serum Abcam ab7475, RRID:AB_2885042
Commercial assay or kit normal goat serum Abcam ab7481, RRID:AB_2716553
Commercial assay or kit ProLong Gold Antifade Life Technologies P36935
Reagent with DAPI
Commercial assay or kit Mouse Ferritin ELISA Kit (FTL) Abcam ab157713
Commercial assay or kit Pointe Scientific Pointe Scientific 23-666-320
Iron/TIBC Reagents
Commercial assay or kit ELISA Kit for Troponin T Cloud-Clone SED232Mu
Type 2, Cardiac (TNNT2)
Commercial assay or kit Mouse IL-6 Quantikine R and D Systems M6000B
ELISA Kit
Commercial assay or kit Iron Assay Kit Abcam ab83366
Commercial assay or kit Lipid Peroxidation (MDA) Abcam ab118970
Assay Kit
Commercial assay or kit GSSG/GSH Quantification Kit Dojindo G257
Commercial assay or kit Glutamine Assay Kit Abcam ab197011
Commercial assay or kit Glutamate Assay Kit Abcam ab83389
Commercial assay or kit Electrophoretic Mobility-Shift Invitrogen E33075
Assay (EMSA) Kit
Commercial assay or kit Zero Blunt TOPO Invitrogen 451245
PCR Cloning Kit
Commercial assay or kit HiScribe T7 Quick High New England Biolabs E2050S
Yield RNA Synthesis Kit
Chemical compound, drug Ferrostatin-1 Sigma Aldrich SML0583
Chemical compound, drug Isoprenaline hydrochloride Sigma Aldrich I5627
Chemical compound, drug Erastin Sigma Aldrich E7781
Chemical compound, drug 1S,3R-RSL 3 Sigma Aldrich SML2234
Chemical compound, drug calcein-AM Invitrogen C1430
Chemical compound, drug ethidium homodimer-1 Invitrogen E1169
Chemical compound, drug 2’, 7’-dichlorodihy Invitrogen D399
drofluorescein diacetate
(H2DCFDA)
Chemical compound, drug C11-BODIPY Invitrogen D3861
Chemical compound, drug pyridoxal isonicotinoyl Abcam ab145871
hydrazine (PIH)
Software, algorithm ImageJ National Institutes of Health Version 1.51 r,
RRID:SCR_003070
Software, algorithm GraphPad Prism 8 GraphPad Software RRID:SCR_002798
Software, algorithm EZChrom Elite Agilent Technologies Version 3.3.2.
Animal studies
All procedures were carried out in accordance with the King’s College London Ethical Review Pro-
cess Committee and the UK Home Office (Project License No. PPL70/8889) and were performed in
accordance with the Guidance on the Operation of the Animals (Scientific Procedures) Act, 1986 (UK
Home Office).
Ito et al. eLife 2021;10:e62174. DOI: https://doi.org/10.7554/eLife.62174 14 of 23Research article Biochemistry and Chemical Biology Medicine
Antibodies
The following antibodies were used in this study: monoclonal mouse antibody to NCOA4 (Sigma-
Aldrich, SAB1404569, Lot: HC071-1F11, 1/1000), polyclonal rabbit antibody to FTH1 (Cell Signaling
Technology, 3998, Lot: 2, for western blots, 1/1000; for immunofluorescence, 1/100), monoclonal
mouse antibody to LC3B (Cell Signaling Technology: 83506, Lot: 1, 1/100), monoclonal rat antibody
to LAMP2a (Abcam: ab13524, Lot: GR3317907-1, 1/100), monoclonal rat antibody to GPX4 (Milli-
pore: MABS1274, Lot: Q2633070, 1/1000), polyclonal rabbit antibody to 4-HNE (Millipore: 393207,
Lot: 3167038, 1/500), polyclonal rabbit antibody to IREB2 (Thermo Fisher Scientific: PA1-16543, Lot:
TK2666362A, 1/250), polyclonal rabbit antibody to SLC40A1 (Alpha Diagnostic International:
MTP11-A, Lot: 1169899A3-L, 1/1000), monoclonal mouse antibody to TFRC (Thermo Fisher Scien-
tific: 13–6800, Lot: TI275369, 1/1000), polyclonal rabbit antibody to SOD2 (Abcam: ab13534, Lot:
GR33618-66, 1/1000), polyclonal rabbit antibody to HO-1 (Enzo Life Sciences: ADI-SPA-895, Lot:
03301708, 1/1000), monoclonal mouse antibody to GAPDH (Sigma-Aldrich: G8795, Lot:
056M4856V, 1/10,000).
Generation of cardiomyocyte-specific NCOA4-deficient mice
The Ncoa4 gene-targeting vector was constructed using mouse C57BL/6J genomic DNA
(Misaka et al., 2018). The targeting vector was electroporated into ES cells (F1; SVJ129 and C57BL/
6J), and the transfected ES clones were selected for neomycin resistance according to standard pro-
tocols. The neomycin-resistant ES clones with targeted homologous recombination were screened
by PCR and further confirmed by Southern blotting. Circular pCAG-Flpe plasmid and pPGK-Puro
plasmid were electroporated into the selected ES clones, and the transfected ES clones were
selected for puromycin resistance according to standard protocols. The neomycin cassette-excised
ES clones were screened by PCR. Southern blotting and karyotyping analyses were performed to
obtain ES clones exhibiting the desired homologous recombination and normal karyotype. These
targeted ES clones were injected into blastocyst C57BL/6J mouse embryos to generate chimeric
mice. The chimeric mice were crossed with C57BL/6J mice to validate germ line transmission. We
generated mice with the floxed Ncoa4 allele and crossed them with transgenic mice expressing a-
myosin heavy chain promoter-driven Cre recombinase (Myh6-Cre) to obtain cardiomyocyte-specific
NCOA4-deficient mice (Ncoa4flox/flox;Myh6-Cre+) (Nishida et al., 2004). Ncoa4flox/flox;Myh6-Cre– lit-
termates were used as controls. The mice had access to food and water ad libitum.
Immunoprecipitation and western blot analysis
To evaluate NCOA4 protein expression level in hearts, the protein was immunoprecipitated with an
anti-NCOA4 antibody, followed by immunoblot with the antibody. One hundred micrograms protein
homogenates with lysis buffer (50 mmol/L Tris-HCl, 50 mmol/L NaCl, 1 mmol/L EDTA, 1% NP-40, a
protease inhibitor cocktail, pH 7.4) were precleared with 20 mL of magnetic beads-coupled protein
G (Thermo Fisher Scientific, 1004D). Precleared homogenates were subjected to immunoprecipita-
tion using 1 mg of the anti-NCOA4 antibody (Sigma-Aldrich, SAB1404569) or mouse immunoglobulin
G (IgG; Santa Cruz biochemistry, sc-2025) and 40 mL of magnetic beads-coupled protein G at 4 ˚C
for 2 hr. The precipitated complexes were washed three times with lysis buffer. Protein homoge-
nates with lysis buffer were extracted from the left ventricles. The precipitated complexes or 5–15
mg of total protein homogenates were subjected to western blot analysis. After incubation with sec-
ondary antibody, the blot was developed with an infrared imaging system (ODYSSEY CLx; LI-COR
Biosciences). Image Studio software (LI-COR Biosciences) was used for quantitative analysis to evalu-
ate protein expression levels.
Real-time quantitative reverse transcription PCR
Total RNA was isolated from the left ventricles using RNeasy Fibrous Tissue Mini Kit (QIAGEN). The
mRNA expression levels were determined by quantitative reverse transcription polymerase chain
reaction (PCR) using SuperScript IV reverse transcriptase (Thermo Fisher Scientific Inc) for reverse
transcription and a PowerUp SYBR Green PCR Master Mix (Thermo Fisher Scientific) for the quantita-
tive PCR reaction with the following PCR primers: forward 5’-CTATATCCAGGTGCCAGAGCAG-3’
and reverse 5’-TTGCTTACAAGAAGCCACTCAC-3’ for Ncoa4, forward 5’-TGGAGTTGTATGCCTCC
TACG-3’ and reverse 5’-TGGAGAAAGTATTTGGCAAAGTT-3’ for Fth1, forward 5’-CAGACAACA
Ito et al. eLife 2021;10:e62174. DOI: https://doi.org/10.7554/eLife.62174 15 of 23Research article Biochemistry and Chemical Biology Medicine
TAAACTGCGCCTT-3’ and reverse 5’-GATACACCTCTCCACCAATGACC-3’ for Ptgs2, forward 5’-
TGGCCAGCAAGATTGTGGAGAT-3’ and reverse 5’-TTTGCGGGTGAAGAGGAAGT-3’ for Slc1a5,
forward 5’-ATGGAGTGTGGCATTGGCTT-3’ and reverse 5’-TGCATCAGCTTCTGGCAGAGCA-3’ for
Slc7a5, forward 5’-TCTACAGGATTGCGAACATCT-3’ and reverse 5’-CTTTGTCTAGCATGACACCA
TCT-3’ for Gls1, forward 5’-AGCGTATCCCTATCCACAAGTTCA-3’ and reverse 5’-GCAGTCCAG
TGGCCTTCAGAG-3’ for Gls2, forward 5’-TCGTCTTGGCCTTTTGGCT–3’ and reverse 5’-TCCAGG
TGGTCTAGCAGGTTCT-3’ for Nppa, forward 5’-AAGTCCTAGCCAGTCTCCAGA-3’ and reverse 5’-
GAGCTGTCTCTGGGCCATTTC-3’ for Nppb, forward 5’-ATGTGCCGGACCTTGGAAG-3’ and
reverse 5’-CCTCGGGTTAGCTGAGAGATCA-3’ for Myh7, forward 5’-ACGCGGACTCTGTTGCTGCT-
3’ and reverse 5’-GCGGGACCCCTTTGTCCACG-3’ for Col1a2, forward 5’-CCCGGGTGCTCCTGGA-
CAGA-3’ and reverse 5’-CACCCTGAGGACCAGGCGGA-3’ for Col3a1, forward 5’-TGCAATCTGCA
TCTCCATGGCT-3’ and reverse 5’-AAGCAGGAGAGGGCAACAAA-3’ for Slc7a11, forward 5’-
TGGAATCCCAGCAGTTTCTT-3’ and reverse 5’-GCTGCTGTACGAACCATTTG-3’ for Tfrc, forward
5’-GGCTTTCTTATGAGCATTGCCTA-3’ and reverse 5’-GGAGCACCCAGAGCAGCTTA-3’ for
Slc11a2, forward 5’-TGGACCTCTGAACTTGGCAAT-3’ and reverse 5’-AGATGACGGCATAAGCACC
TAT-3’ for Cdc14a, forward 5’-TTTCCACCTAAGCGCAAGACT-3’ and reverse 5’-ATGACATGA-
GAACCCACAGA-3’ for Cdc42bpa, and forward 5’-ATGACAACTTTGTCAAGCTCATTT-3’ and
reverse 5’-GGTCCACCACCCTGTTGCT-3’ for Gapdh. PCR standard curves were constructed using
the corresponding cDNA and all data were normalized to the Gapdh mRNA content and are
expressed as the fold increase over the control group.
Transverse aortic constriction (TAC) and echocardiography
The 8– to 12 week-old male mice were subjected to TAC using a 26-gauge needle or to a sham sur-
gery, as previously reported (Omiya et al., 2020). In TAC, a small piece of 6–0 silk suture was placed
between the innominate and left carotid arteries. Three loose knots were tied around the transverse
aorta, and a 26-gauge needle was placed parallel to the transverse aorta. The knots were tied
quickly against the needle and the needle was removed promptly to yield a 26-gauge stenosis.
Sham surgeries were identical except for the aortic constriction. Echocardiography was conducted
with a Vevo 2100 system (Visual Sonics) on conscious mice (Omiya et al., 2020). Noninvasive mea-
surement of the tail blood pressure was also performed on conscious mice using a NP-NIBP Monitor
for mice and rats (Muromachi Kikai), as previously described (Omiya et al., 2020).
Histological analysis
Left ventricle samples were embedded in OCT compound (Thermo Fisher Scientific Inc) and then
immediately frozen in liquid nitrogen. The samples were sectioned into 5 mm thick sections. The sec-
tions were fixed with acetone for hematoxylin–eosin staining and Masson’s trichrome staining, with
4% paraformaldehyde for wheat germ agglutinin staining and with Bouin’s solution for 4-HNE stain-
ing. Hematoxylin–eosin staining and Masson’s trichrome staining (Masson’s Trichrome Stain Kit, Poly-
sciences Inc) were performed on serial sections. For wheat germ agglutinin staining, heart samples
were stained with fluorescein isothiocyanate-conjugated lectin (Sigma, L4895) to measure the cross-
sectional area of cardiomyocytes. For 4-HNE staining, rabbit anti-4-HNE antibody or control rabbit
IgG (Abcam, ab37415) were used as primary antibody, and avidin-peroxidase (Vectastain Elite ABC
Kit; Vector Laboratories Inc) and the DAB Peroxidase Substrate Kit (Vector Laboratories Inc) were
applied, followed by counterstaining with hematoxylin as described previously (Omiya et al., 2020).
Images were captured by an All-in-one fluorescence microscope (BZ-X700, Keyence). Quantitative
analyses of the fibrosis fraction and 4-HNE positive area were examined in whole left ventricles and
cardiomyocyte cross-sectional areas we examined in five different areas per section and measured
using ImageJ (National Institutes of Health; Version 1.51 r).
Immunofluorescence microscopy
The OCT-compound embedded frozen left ventricle samples were used to detect LC3B-FTH1 and
LAMP2a-FTH1 co-localization dots. The samples were sectioned into 5 mm thick sections and fixed
with 4% paraformaldehyde for immunohistochemical fluorescence staining. The samples were
blocked with 10% normal donkey serum (Abcam, ab7475) to detect LC3B-FTH1 co-localization and
with 10% normal donkey serum and 10% normal goat serum (Abcam, ab7481) to detect LAMP2a-
Ito et al. eLife 2021;10:e62174. DOI: https://doi.org/10.7554/eLife.62174 16 of 23Research article Biochemistry and Chemical Biology Medicine
FTH1 co-localization. The primary antibodies were rabbit anti-FTH1, mouse anti-LC3B, and rat anti-
LAMP2a. The secondary antibodies were Alexa Fluor 488 donkey-anti-mouse (Thermo Fisher Scien-
tific: A21202, 1/500), Alexa Fluor 568 donkey-anti-rabbit (Thermo Fisher Scientific: A10042, 1/500),
and Alexa Fluor 488 goat-anti-rat (Thermo Fisher Scientific: A11006, 1/500). DAPI (ProLong Gold
Antifade Reagent with DAPI; Life Technologies: P36935) was used to detect nuclei. Micrographs
were acquired using a Nikon Eclipse Ti inverted microscope (Nikon) equipped with a Yokogawa
CSU-X1 spinning disk unit (Yokagawa) and an Andor EMMCD camera (Andor Technology) using a
100x oil immersion objective lens. The co-localization dots were quantified by counting the number
of LC3B-FTH1- or LAMP2a-FTH1-positive dots in 10 different areas (magnification 1000x) per
section.
Measurement of hematological parameters, serum ferritin, serum iron,
transferrin saturation, serum troponin T, and serum IL-6
Blood samples were obtained from the inferior vena cava in anesthetized mice. Full blood count and
reticulocyte count were measured at Pinmoore Animal Laboratory Services Limited. Blood samples
were centrifuged for 30 min at 850 x g to isolate serum fraction. Serum ferritin levels were measured
using a Mouse Ferritin ELISA Kit (FTL) (Abcam, ab157713) according to the manufacturer’s protocols.
Serum iron levels and transferrin saturation were measured using Pointe Scientific Iron/TIBC
Reagents (Pointe Scientific, 23-666-320) according to the manufacturer’s protocols. Serum troponin
T levels were measured using the ELISA Kit for Troponin T Type 2, Cardiac (TNNT2) (Cloud-Clone,
SED232Mu) according to the manufacturer’s protocols. Serum IL-6 levels were measured using the
ELISA Kit for Mouse IL-6 (R and D Systems, M6000B) according to the manufacturer’s protocols.
Measurement of total non-heme, ferrous, and ferric iron levels in hearts
Total non-heme, ferrous, and ferric iron in hearts or liver were analyzed using an Iron Assay Kit
(Abcam, ab83366) according to the manufacturer’s protocols. Briefly, the whole heart was perfused
with saline and 10–20 mg of left ventricle tissue was homogenized in Iron Assay Buffer. The superna-
tant without the insoluble fraction was separated by centrifugation and used for analysis. A micro-
plate reader was used to measure the absorbance at OD 593 nm. The level of ferric iron was
calculated by subtracting ferrous iron from total non-heme iron. The ratio of the ferrous iron level to
the FTH1 protein level was calculated to estimate non-binding fraction of ferrous iron to FTH1. The
FTH1 protein level for sham-operated Ncoa4+/+ estimated as Western blot analysis in hearts was
set to 1.
Measurement of malondialdehyde (MDA) in hearts
The amount of MDA in the hearts was measured using a Lipid Peroxidation (MDA) Assay Kit (Abcam,
ab118970) according to the manufacturer’s protocols. Briefly, 10–20 mg of fresh left ventricle tissue
was homogenized in Lysis Solution containing butylated hydroxytoluene. The insoluble fraction was
removed by centrifugation, and the supernatant was used for analysis. The supernatants were mixed
with thiobarbituric acid (TBA) solution reconstituted in glacial acetic acid and then incubated at 95˚C
for 60 min. The supernatants containing MDA-TBA adduct were added into a 96-well microplate for
analysis. A microplate reader was used to measure the absorbance at OD 532 nm.
Glutathione quantification
Oxidized glutathione (GSSG) and total glutathione in hearts were analyzed using a GSSG/GSH
Quantification Kit (Dojindo, G257) according to the manufacturer’s protocols. Briefly, 20–30 mg of
fresh left ventricle tissue was homogenized in 5% 5-sulfosalicylic acid (SSA), and the insoluble frac-
tion was removed by centrifugation. The resultant supernatant was added to double-deionized H2O
(ddH2O) to reduce the SSA concentration to 0.5% for the assay. A microplate reader was used to
measure absorbance at OD 415 nm. The concentration of reduced glutathione (GSH) was calculated
by subtracting 2x GSSG from the total glutathione concentration.
Measurement of glutamine and glutamate concentration in hearts
The glutamine concentration in hearts was analyzed using a Glutamine Assay Kit (Abcam, ab197011)
according to the manufacturer’s protocols. Briefly, 10–20 mg of fresh left ventricle tissue was
Ito et al. eLife 2021;10:e62174. DOI: https://doi.org/10.7554/eLife.62174 17 of 23You can also read