Cellular labelling favours unfolded proteins - bioRxiv
←
→
Page content transcription
If your browser does not render page correctly, please read the page content below
bioRxiv preprint first posted online Jul. 23, 2018; doi: http://dx.doi.org/10.1101/274761. The copyright holder for this preprint
(which was not peer-reviewed) is the author/funder, who has granted bioRxiv a license to display the preprint in perpetuity.
                                  It is made available under a CC-BY 4.0 International license.

     Cellular labelling favours unfolded proteins
     David-Paul Minde1*^, Manasa Ramakrishna2^, Kathryn S. Lilley1*
     1. Cambridge Centre for Proteomics, University of Cambridge, Department of
     Biochemistry, Tennis Court Road, Cambridge CB2 1QR, UK
     2. Medical Research Council Toxicology Unit, University of Cambridge, Lancaster Rd, Leicester, LE1 9HN, UK

     ^These authors contributed equally

     *To whom correspondence may be addressed: Prof. Kathryn Lilley k.s.lilley@bioc.cam.ac.uk and David-Paul
     Minde dpm43@cam.ac.uk

     Abstract
     Folded enzymes are essential for life, but there is limited in vivo information about how locally
     unfolded protein regions contribute to biological functions. Intrinsically Disordered Regions (IDRs) are
     enriched in disease-linked and multiply post-translationally modified proteins. The extent of foldability
     of predicted IDRs is difficult to measure due to significant technical challenges to survey in vivo protein
     conformations on a proteome-wide scale. We reasoned that IDRs should be more accessible to
     targeted in vivo biotinylation than more ordered protein regions, if they retain their flexibility in vivo.
     Indeed, we observed a positive correlation of predicted IDRs and biotinylation density across four
     independent large-scale proximity proteomics studies that together report >20 000 biotinylation sites.
     We show that biotin ‘painting’ is a promising approach to fill gaps in knowledge between static in vitro
     protein structures, in silico disorder predictions and in vivo condition-dependent subcellular plasticity
     using the 80S ribosome as an example.

     Introduction
     Cellular complexity often arises from structurally disordered proteins1-4. Intrinsically disordered
     regions (IDRs) within proteins often overlap with sites of alternative splicing and post-translational
     modifications (PTMs). Both splicing and PTMs together are estimated to expand the number of
     proteoforms into the millions despite a relatively compact (~20,000 large) protein-coding human
     genome5-7. Proteins rich in IDRs, Intrinsically Disordered Proteins (IDPs), are often linked to diseases
     such as cancer, neurodegeneration and heart diseases8-13. Interest in IDPs is thus increasing within the
     biomedical research community.

     Despite increasing community interest, it has remained challenging to define the phenomenon of
     “intrinsic disorder” as clearly as the ordered complement of the structural proteome. Rigidly folded
     proteins can be solved in high-resolution crystal, cryo-EM or NMR structures that can be described by
     a simplified hierarchy of elements of increasing length from primary structure (sequence of single
     amino acid) over secondary structure elements (α-helices and β strands of ~10 residues) to tertiary
     structure (folded domains of ~100 residues) and quaternary structures (i.e. assemblies of several
     folded proteins). IDPs cannot be as straightforwardly classified in a simple hierarchy of modules of
     increasing length because the “minimal unit”, a single IDR, can vary in length from a few residues to
     thousands. Accordingly, IDRs can vary significantly in their properties and functions and the need for
     further differentiation of sub-classes of disorder was recognized early in the development of the field14.
bioRxiv preprint first posted online Jul. 23, 2018; doi: http://dx.doi.org/10.1101/274761. The copyright holder for this preprint
(which was not peer-reviewed) is the author/funder, who has granted bioRxiv a license to display the preprint in perpetuity.
                                  It is made available under a CC-BY 4.0 International license.

     While the structure-function paradigm is fully established and has been highly successful, a
     complementary “disorder-function” paradigm is still emerging15.

     Co-evolutionary inference suggests that many predicted disordered regions have the capacity to fold
     and are selected in evolution by contact constraints imposed by their folded conformation in presence
     of cellular binding partners16. In other words, such binding-coupled folding IDPs look similar to folded
     proteins as determined by (co)evolution statistical analysis. Interfaces of foldable IDRs tend to be
     larger than contacts between two ordered proteins and the exposed hydrophobic surface area is often
     larger, which in some cases limits solubility of IDPs and requires tighter subcellular regulation of IDPs
     compared to ordered proteins17-19.

     One of the least characterized aspects in IDR research is in vivo malleability leading to multiple
     structural forms that disordered regions can adopt in a given compartment in a given cellular state.
     According to in vitro experiments, it can be expected that subtle variations in pH, salt concentrations,
     and PTMs can have very significant effects on the conformational ensembles of IDPs. For instance,
     nuclear pore proteins can form extremely tight complexes (dissociation constant (Kd ) in low pM range)
     near physiological salt concentration (~100 mM) which becomes very weak (Kd in mM range) at 200
     mM salt concentration20. Indeed, a recent large-scale multidimensional proteomics study that
     investigated temperature-dependent solubility and abundance changes across cell cycle phases,
     demonstrated that large subsets of the human proteome dramatically change their solubility, stability,
     subcellular organization and protein partners in patterns resembling differential phosphorylation
     during the cell cycle21.

     Early reports suggested that phosphorylation predictions can become significantly more accurate if
     local intrinsic disorder tendency is taken into consideration22. Many single-protein examples illustrate
     that IDRs can be phosphorylated or hyper-phosphorylated within disordered residues, often at highly
     soluble and intrinsically disorder-promoting serine and threonine residues10,11,23-25. The correlations of
     IDRs with acetylation, ubiquitination and sumoylations at lysines, and phosphorylations at residues
     such as tyrosine and histidine are more challenging to detect, however, and hence frequently under-
     reported in scientific studies26-30. Finally, there are very few studies reporting possible interactions
     between IDRs and multiple types of PTMs.

     Biotinylation-based proximity proteomics methods are traditionally used to map transient
     interactions and subcellular neighbours31-35. The common principle of various proximity proteomics
     approaches is that biotinylation is highest in proximity to the biotin-activating enzyme that is fused to
     protein of interest. This localised biotinylation enhances the biotin incorporation in protein interactors
     and/or subcellular neighbours of biotin activating enzyme fused targets, which can be quantified in
     mass spectrometric experiments combined with stringent statistical filtering of background proteins
     to remove endogenously and non-specifically biotinylated proteins. Several recent technological
     improvements enable the direct detection of thousands of biotin sites in hundreds of proteins in a
     single study36-39. We therefore reasoned that these novel large-scale in vivo biotin site data could be
     repurposed to gain insights into possible cellular conformations of proteins.

     The most frequently used enzymes in proximity proteomics are variants of BirA biotin-protein ligase
     and Ascorbate Peroxidase (APX)33,34,40,41. A promiscuous mutant of BirA (“BioID”) as well as a
     thermophilic homologue (BioID2) biotinylate nearby lysines through the formation of activated
     biotinoyl-5’-AMP which forms a covalent attachment to the nucleophilic ε-amino side chain group of
     lysine (K). APX or accelerated versions like APEX2 can convert biotin-phenol to activated radicals that
     can readily react for a short period of time with nearby tyrosines (Y). Interestingly, these two amino

                                                                                                                                    2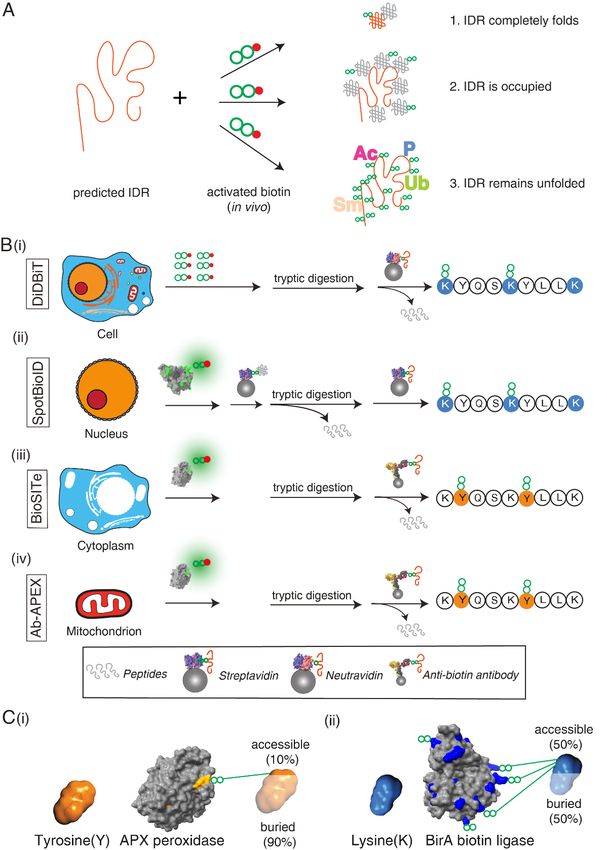
bioRxiv preprint first posted online Jul. 23, 2018; doi: http://dx.doi.org/10.1101/274761. The copyright holder for this preprint
(which was not peer-reviewed) is the author/funder, who has granted bioRxiv a license to display the preprint in perpetuity.
                                  It is made available under a CC-BY 4.0 International license.

     acid types are on opposite ends of the disorder-promoting amino acid scale — Lysine promotes
     disorder while tyrosine is on average depleted in IDRs42.

     We hypothesize that sites of cellular biotinylations in proximity labelling studies could favour
     biotinylation within predicted IDRs if these can retain greater accessibility in their cellular context
     compared to predicted ordered regions. We perform a comprehensive analysis using representative
     data from multiple, independent and orthogonal large-scale proximity tagging datasets as well as
     diverse IDR predictions to test our hypothesis. We demonstrate the enrichment of cellular
     biotinylation events in predicted IDRs and show that these regions show higher biochemical reactivity
     compared to ordered regions in all targeted cellular niches and especially in the nucleus of HEK293
     cells.

     Results:
     Concept of the study
     Predicted IDRs can be reshaped by interactions in cells (Fig. 1A). Often, specific functions of IDRs are
     linked to their potential to fold upon interacting with specific native partner proteins or ligands 43.
     Alternatively, short “linear motifs” within IDRs could mediate a multitude of local interactions of other
     folded proteins that could constrain and compact IDRs in specific partially folded or ordered
     conformations44. In the most extreme scenario, IDRs could remain entirely unfolded and fully
     accessible20,45. We expected to observe more in vivo biotinylations within predicted IDRs if they remain
     at least transiently and locally unfolded and accessible in their cellular context. If present, such a
     correlation can be used for in vivo structural proteomics studies.

     Brief introduction to selected proximity proteomics studies
     To test our hypothesis of possible links between structural features of proteins and biotinylation, we
     selected four recent, independent and orthogonal, large-scale studies by the following criteria (1)
     large number of directly identified biotinylation sites (2) orthogonality in targeted subcellular niches
     and (3) independence of biotin-peptide enrichment strategies (Fig. 1B). “DiDBiT” targeted the whole
     cell and is therefore agnostic of subcellular localisation. It identified ~20 000 biotinylation sites on
     lysine sites upon extensive biotinylation by applying 1mM NHS-biotin, a chemically activated form of
     biotin, to cultured HEK293 cells, complete digestion by trypsin and streptavidin-affinity purification of
     biotinylated peptides38. “SpotBioID” targeted rapamycin-dependent interactions of the human mTOR
     kinase using its FK506-rapamycin binding (FRB) domain fused to BioID39. Immunofluorescence data
     within SpotBioID and previous literature conflict concerning the main subcellular localisation of FRB-
     BioID that appears to be cytoplasmic in fluorescence experiments and nuclear in previous literature
     and biotin-protein enrichments39, with most evidence suggesting mainly nuclear localisation of the
     FRB-BioID fusion. The remaining two data sets come from recent, tyrosine-targeting APEX2 studies.
     Both successfully explored an alternative enrichment strategy based on polyclonal biotin-antibody
     from goat and rabbit that facilitated gentle elution while retaining explicit biotin site information
     unlike other strategies involving gentle elution of cleavable biotin derivatives36,37,46. They comprise an
     antibody-based APEX2 study (within this paper termed “Ab-APEX”) targeted the mitochondrial matrix
     using mito-APEX237, and a study called BioSITe36 which uses a cytoplasmic APEX2 fusion construct to
     Nestin (NES) protein.

     Orthogonality of tyrosine and lysine as molecular targets of proximity proteomics
     How different are tyrosine and lysine residues, the most frequent molecular targets in proximity
     proteomics? Tyrosine is a partly hydrophobic and bulky amino acid and predominantly partitions to
     the hydrophobic core of proteins and near the interface of intrinsic membrane proteins. Its solvent

                                                                                                                                    3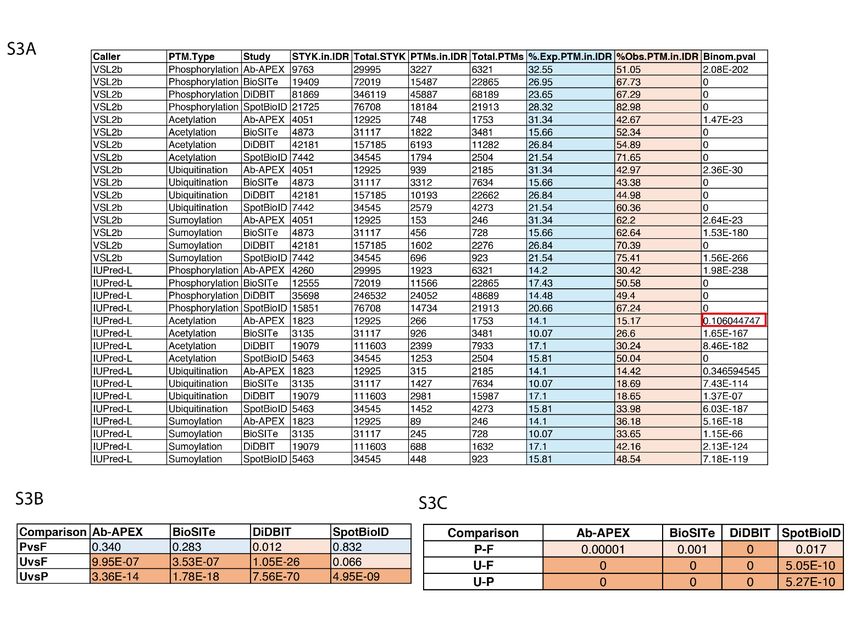
bioRxiv preprint first posted online Jul. 23, 2018; doi: http://dx.doi.org/10.1101/274761. The copyright holder for this preprint
(which was not peer-reviewed) is the author/funder, who has granted bioRxiv a license to display the preprint in perpetuity.
It is made available under a CC-BY 4.0 International license.
accessible surface area (SASA) shrinks by some 90% during folding reactions (Fig. 1Ci)47. Lysine
residues, by contrast, tend to orient to the surface of folded proteins and stay in contact with
surrounding water molecules, i.e. retain a large fraction of their SASA (Fig. 1Cii). Nevertheless, through
their intramolecular and intermolecular contacts, for instance, in protein-protein interactions, lysine
residues have a large spectrum of accessibilities with an average near 50% of remaining SASA in folded
proteins47.
Proximity proteomics studies can specifically target subcellular locations
As expected, as the four studies targeted different subcellular niches there was a very small overlap
in proteins across the 4 studies with only 29 proteins being in common (Fig. S1A). Of these 29, many
of them had multiple cellular locations predominating in the nucleus (Fig. S1B, blue), cytosol (Fig. S1B,
red) and the extracellular region (Fig. S1B, yellow). Given the small size of this subset of the whole
dataset, these locations are not statistically enriched for despite being frequently seen. However, we
could confirm the location for each of the studies above (n > 500) using a functional enrichment
analysis against a set of Gene Ontology (GO) terms aimed at describing cellular location (GO:CC; Fig.
S1C). Our data shows that as expected, Ab-APEX proteins strongly target the mitochondrion with high
fold enrichment for the mitochondrial matrix and the mitochondrial inner membrane (Fig. S1C, first
column). Then, we checked the BioSITe data which also as expected based on the NES-APEX fusion,
enriched GO terms of the cytoplasm and the cytosol (Fig. S1C, second column). The DiDBiT study,
which lacks specific targets seems enriched for nuclear, mitochondrial and cytosolic proteins (Fig. S1C,
column 3). Finally, SpotBioID, where the authors state that FRB-BioID is cytoplasmic, are enriched for
mostly nuclear and some cytoskeletal proteins39. Briefly, all four studies showed expected
enrichments consistent with the targeted cellular compartment and previous literature.
Illustrative examples of proteins that are biotinylated across all four independent studies
We started by exploring our datasets combining all biotinylation sites and PTMs by initially focusing
on structural features of the limited subset of 29 proteins that were common in all studies. While not
statistically significant, we noticed that the list contained many RNA binding proteins. Elevated IDR
content among these proteins is consistent with previous reports of high IDR content among
nucleotide-binding proteins48 but a larger set will have to be explored for firmly establish a statistical
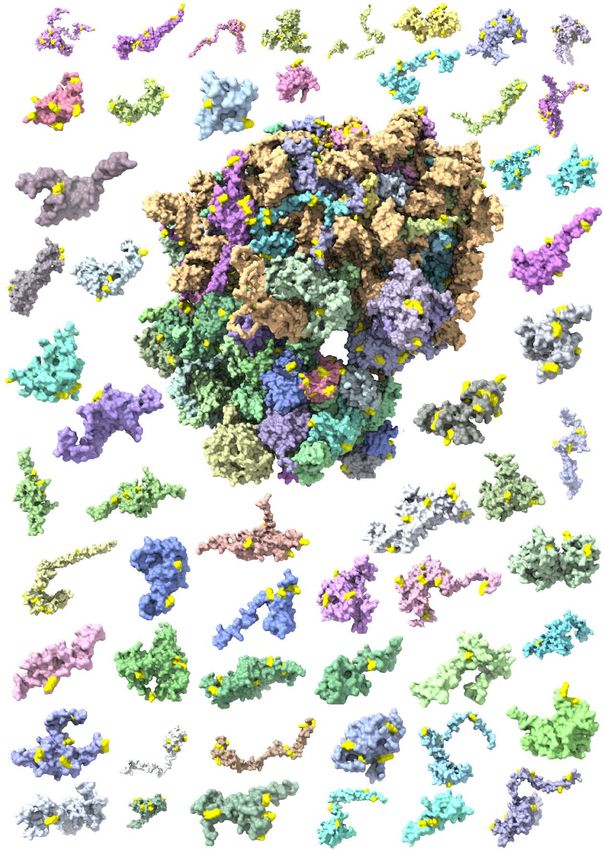
correlation. The first example, Emerin, is an integral membrane protein that is often found at the inner
nuclear membrane or at adherens junctions. Emerin mutations cause X-linked recessive Emery–
Dreifuss muscular dystrophy. Biotinylation sites from all four studies cluster in a large predicted IDR in
the first half of the protein sequence, avoid the transmembrane-spanning domain (Fig. 2Ai-iv)
consistent with our hypothesis that predicted IDRs might are more biotinylated in vivo if they remain
highly accessible. A very large number of other PTMs in this IDR further illustrates that this membrane
protein is indeed often subjected to intracellular modifications. Surprisingly, Emerin is found in all four
studies despite the fact that some targeted different subcellular locations. Emerin is one of ~400
identified integral membrane proteins, suggesting that detailed intracellular structural insights can be
gleaned from re-purposed proximity proteomics studies.
Next, we analysed the predicted fully disordered RNA-interacting plasminogen activator inhibitor
protein SERBP1 (Fig. 2Bi). Four sites of biotinylation, across the four studies, cluster around the central
region of this protein (residues 200-260) where previously reported unique PTM sites also cluster (Fig.
2Bii). DiDBiT identifies many additional sites scattered over the entire protein sequence, five of which
are common with the nuclear targeted SpotBioID study. SERBP1 was previously found in multiple
subcellular locations consistent with its identification in four studies. Ribosomal proteins are typically
predicted to be disordered or non-globular49. We see SERBP1 attaching at the periphery of the 80S
ribosome RNA-protein complex and mostly lack (in ~80% of its sequence) unique electron density (Fig.
4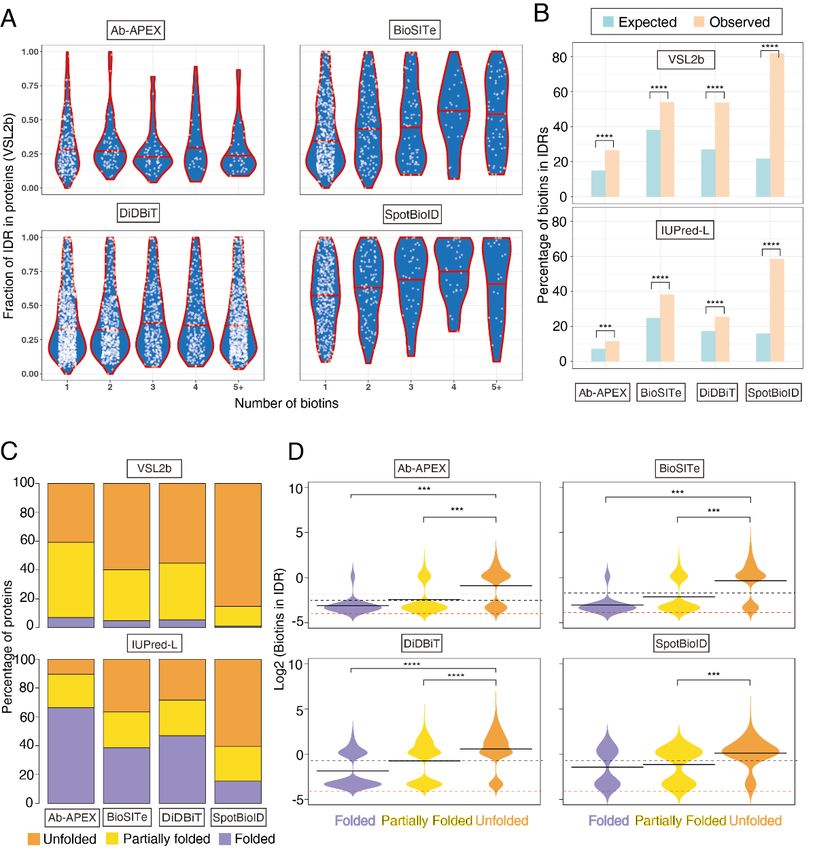
bioRxiv preprint first posted online Jul. 23, 2018; doi: http://dx.doi.org/10.1101/274761. The copyright holder for this preprint
(which was not peer-reviewed) is the author/funder, who has granted bioRxiv a license to display the preprint in perpetuity.
                                  It is made available under a CC-BY 4.0 International license.

     2Biii); remaining small visible fractions form elongated structures that are detected in random coil or
     α-helical conformations.

     Finally, we selected FKBP3 as a protein of average (predicted) disorder content for the human
     proteome around 40% according to VSL2b2. FKBP3 is a cis-trans prolyl isomerase that is involved in
     cellular protein folding and tightly binds to the immunosuppressant rapamycin. Biotinylations are
     enriched in its predicted IDRs (72%) or localise to local coil structure and short, highly accessible α-
     helical segments in the NMR structure. FKBP3 was previously annotated as nuclear protein. We
     conclude that detailed inspection of common examples across four studies suggests an enrichment of
     biotinylations in IDRs and regions lacking defined secondary structure in otherwise folded proteins.

     Predicted IDRs are more frequently and densely biotinylated in vivo
     Encouraged by observing enhanced biotinylation in predicted IDRs in the small pool of proteins
     common to all four studies, we next wondered whether this trend might still hold globally for the
     biotinylated proteome (referred to as “biotinome” hereafter) comprising nearly 4000 proteins. We
     first checked if proteins with higher predicted fraction of IDRs contain higher numbers of unique sites
     of biotinylation by comparing the predicted IDR fraction for proteins in each biotinome to the number
     of biotinylated sites they contained (Fig. 3A). Within each dataset, there were only a small number of
     proteins with 5 or more biotinylation sites and hence these have been collectively binned into the “5+”
     category (Fig. 3A, last violin). For both the SpotBioID and the BioSITe studies, we observed an increase
     in the frequency of sites of in vivo biotinylations per protein from 1 to 4 with increasing IDR fractions,
     while DiDBiT and Ab-APEX did not show this trend (Fig. 3A, left panels). Both the cytosol and the
     nucleus, which are target compartments in BioSITe and SpotBioID have been previously suggested to
     contain many IDRs48. Mitochondria, by contrast, are predicted low in IDRs especially their subset of
     proteins with bacterial homologues50. DiDBiT, lacking compartmental preference, contains both highly
     disordered and fully folded proteins which might mask any possible weak correlation. We conclude
     that in vivo observed biotinylation frequency per protein and predicted IDR fractions can be correlated
     in IDR-rich compartments such as the nucleus and cytosol in HEK293 cells (Suppl. Table “Biotins”).

     To overcome limitations of averaging over IDRs and ordered regions that might have masked
     structural trends in the DiDBiT and Ab-APEX studies, we next refined our analysis by distinguishing
     between biotinylations inside and outside of IDRs while accounting for the density of potentially
     modifiable residues. To establish an “expected” rate of biotins, we calculated the number of lysine
     residues (K; for SpotBioID and DiDBiT) or tyrosine residues (Y; Ab-APEX and BioSITe) - both within the
     predicted regions of IDR (as determined by VSL2b) and across the entire protein body. The ratio of all
     K/Y residues within IDR regions to all K/Y residues across the protein body gave us an expected rate
     of biotinylation in IDRs. We then performed a similar calculation using the numbers of biotins we
     actually observed within IDRs and across the whole protein for each of our 4 studies (Fig. 3B).
     Consistent across all 4 studies, irrespective of the prediction algorithms used, we observed a
     significantly greater number of biotins within IDR regions (orange bars; Fig. 3B) than expected (blue
     bars; Fig. 3B). Once again, this observation was more significant in the nuclear proteins (SpotBioID)
     than in the mitochondrial proteins (Ab-APEX) (Fig. S2A).

     Convinced that we are seeing a true positive correlation between local predicted IDRs and
     biotinylation density, we sought to see if similar trends can also be observed on protein level after
     sorting all proteins in classes ranging from most to least folded. To this end, we labelled a protein as
     Folded (F) if it had predictions of 30% IDR in its protein body similar to a strategy in Gsponer et. al.18. We then looked at the
     overall distribution of proteins in these IDR classes for each of our 4 studies (Fig. 3C). We display the
     results for just VSL2b and IUPred-L algorithms as “VSL2b_IUPred-L” mimics the trend of VSL2b alone
     while the “D2P2 consensus” mimics IUPred-L. We observed that all studies contain proteins that can

                                                                                                                                    5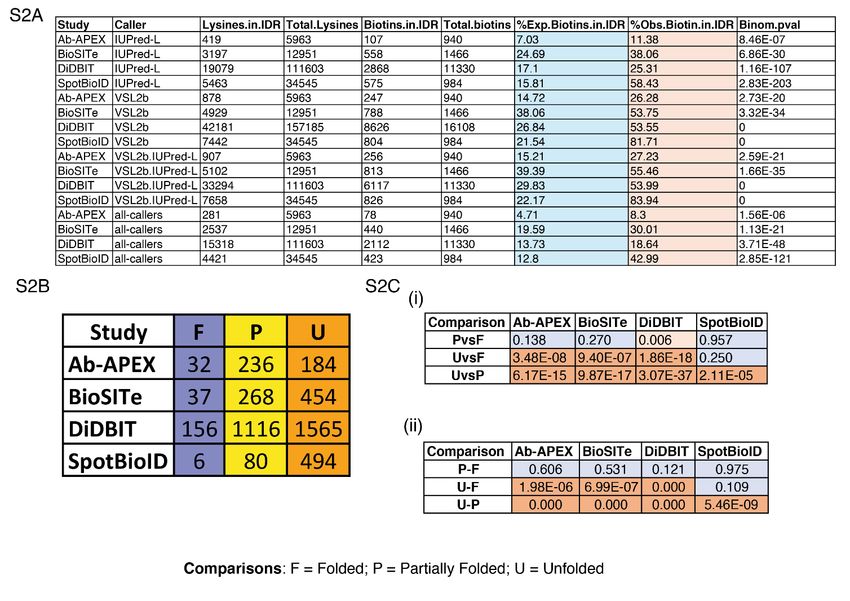
bioRxiv preprint first posted online Jul. 23, 2018; doi: http://dx.doi.org/10.1101/274761. The copyright holder for this preprint
(which was not peer-reviewed) is the author/funder, who has granted bioRxiv a license to display the preprint in perpetuity.
                                  It is made available under a CC-BY 4.0 International license.

     be classified as F, P and U thus enabling pairwise comparisons. The predictors that are better at
     predicting long IDRs or the absence of folded domains, IUPred-L and D2P2 consensus predictors51,52 ,
     classified more proteins as F than VSL2b that has a wider definition of IDRs that also includes short
     IDRs. Consistent with our previous observations and claims in literature20,48, the nuclear protein
     enriched SpotBioID dataset shows the highest proportion of U proteins while the mitochondria
     targeting Ab-APEX study shows the highest proportion of F proteins (Fig. 3C, S2B).

     Given these three categories of proteins, we wondered whether there would be an association
     between IDR-associated-biotins and the various categories of IDPs. To assess this, we performed both
     pairwise t-tests between the groups (F-P, U-P, U-F; S2Ci) and an ANOVA across all groups followed by
     a Tukey’s Honestly Significant Differences post-hoc test (Fig. S2Cii). In all studies except SpotBioID,
     there were significant differences between biotin numbers in the F and U group with more
     biotinylation events occurring in the U group. Additionally, the differences were significant for all
     studies between U and P groups, once again showing higher number of biotins in the U group (Fig. 3D;
     S2C).
     Post Translational Modifications (PTMs) enriched in biotinome-IDRs
     Having discovered a strong correlation between IDRs and increased biotinylation, we wondered
     whether an up-to-date comparison with ~305,000 PTMs in PhosphoSitePlus comprising the small
     phosphorylation, acetylation as well as the larger protein-sized sumoylations and ubiquitinations,
     would parallel these trends or show enrichment in other proteins that do not overlap with the
     biotinome. To this end we downloaded all experimentally reported phosphorylation, acetylation,
     ubiquitination and sumoylation data from PhosphoSitePlus and mapped them to two datasets (1) the
     “biotinome” for HEK293 which is the collection of all proteins across our 4 studies and (2) the HEK293
     proteome which was published by Geiger et. al. in 2012 and contains 7650 proteins53. Additionally, we
     also mapped IDRs to the Geiger et. al. proteome using the VSL2b algorithm.

     As a simple starting point, we looked at the direct correlation between the number of IDRs and the
     number of PTMs in both datasets (Fig. 4A, Suppl. Table “PTM list”). In both cases, there is a modest
     positive correlation of 0.37 which was supported by a highly significant p-value (p = 2.2e-16) indicating
     that the probability of seeing this correlation by chance is extremely low. We thus conclude that there
     is a small but significant correlation between IDRs and PTMs in the overall proteome as well as the
     “biotinome”.

     Despite the similarity in correlation, we wanted to know if there was an overall enrichment of PTMs
     in the HEK293 biotinome relative to the HEK293 proteome. We looked for a difference in the mean
     number of PTMs in the two groups of proteins, across each of the 4 post-translational marks. Median
     frequencies followed the expected higher rates for frequently reported phosphorylations and less
     frequently studied and likely under-published ubiquitinations, acetylations, and sumolyations. (Fig.
     4B). Furthermore, on average, there are significantly more phosophorylation, acetylation and
     ubiquitination marks in the HEK293 biotinome relative to the HEK293 proteome (p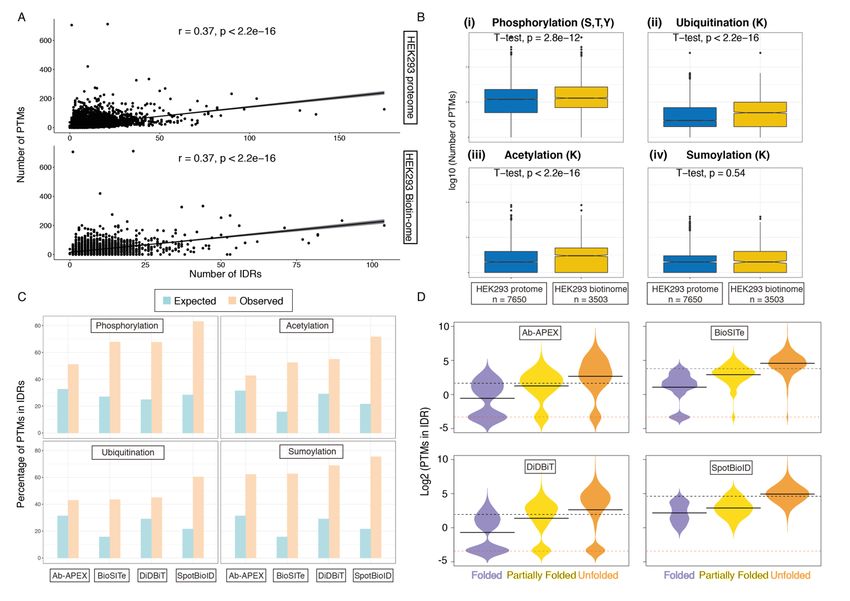
bioRxiv preprint first posted online Jul. 23, 2018; doi: http://dx.doi.org/10.1101/274761. The copyright holder for this preprint
(which was not peer-reviewed) is the author/funder, who has granted bioRxiv a license to display the preprint in perpetuity.
                                  It is made available under a CC-BY 4.0 International license.

     even more remarkable than those seen in the biotin context with all 4 marks being significantly
     enhanced within regions of intrinsic disorder more than expected (IDRs predicted by VSL2b; Fig. 4C,
     Fig. S3A).

     Knowing that there was a significant enhancement of PTMs in regions of IDR, we sought to determine
     if this would be even stronger if we looked at the proteins in the 3 previously discussed categories of
     Folded (F), Partially Folded (P) and Unfolded (U). We confirmed that in all 4 studies, PTMs occurred at
     a significantly higher rate in U proteins than in F or P proteins (Fig. 4D, S3B, S3C). This analysis also
     showed that all proteins in the nuclear SpotBioID study (Fig. 4D (ii)) and most of the proteins in the
     cytoplasmic BioSITe study (Fig. 4D (iv)) contain one or more PTMs (y-axis > -3) while this was not true
     for the Ab-APEX and DiDBIT studies. Given our previous observations that IDRs are more frequent in
     cytosol and nucleus, this provides another line of evidence that PTMs, like biotins, prefer IDR rich
     proteins.

     Application of biotin ‘painting’ to investigate the in vivo plasticity of the 80S ribosome

     To investigate whether large structured complexes can also be analysed with this method, we filtered
     the DiDBiT dataset for ribosomal proteins and visualised all biotinylated subunits in an “exploded”
     version of the 80S ribosome (Fig. 5). Virtually all biotinylated subunits are non-spherical and multiply
     biotinylated as evident from large fractions of yellow marked biotinylation sites, many of which are
     inaccessible to water or larger molecules such as biotin in the fully assembled 80S ribosomal complex
     as they are contacting ribosomal RNA (supplementary video). We observed a high density of
     biotinylation sites in this ~3 megadalton large complex which suggests that biotin ‘painting’ has no
     fundamental size limitation. High biotinylation density in the 80S ribosome is consistent with an
     earlier suggestion that eukaryotic ribosomes are rich in predicted IDRs that can be functionally
     essential49.

     Conclusions
     We have shown using several orthogonal analyses that in vivo biotinylation occurs at a greater rate
     within predicted IDRs and following on from this observation, highly disordered proteins are more
     likely to be biotinylated than those that are mostly folded. Furthermore, this trend of increased
     biotinylation in IDRs is not dependent on the algorithm we use to predict IDRs. However, the greater
     sensitivity of VSL2b enables the establishment of the trend also in short regions of local disorder and
     leads to a greater IDR fraction and more biotinylations assigned to IDRs. Finally, we have consistently
     observed that the SpotBioID study has more proteins that are highly disordered than the other 3
     studies thereby validating previous predictions of large fractions of IDRs in nuclear proteins in vivo48.

     Moreover, we have interrogated the frequency of post translational modification within IDRs, and
     have provided an up-to-date analysis of the relationship between in vivo observed PTMs across ~2000
     independent experimental studies and predicted IDRs confirming that PTMs are enriched in predicted
     IDRs. Furthermore, we have shown that the biotinome we have analysed in our study is enriched for
     PTMs relative to the whole HEK293 proteome despite both groups showing a similar positive
     correlation between the number of PTMs and number of IDRs. Finally, similar to biotinylation, we find
     that PTMs too are enriched in nuclear and cytosolic proteins relative to mitochondrial proteins.

     Discussion

                                                                                                                                    7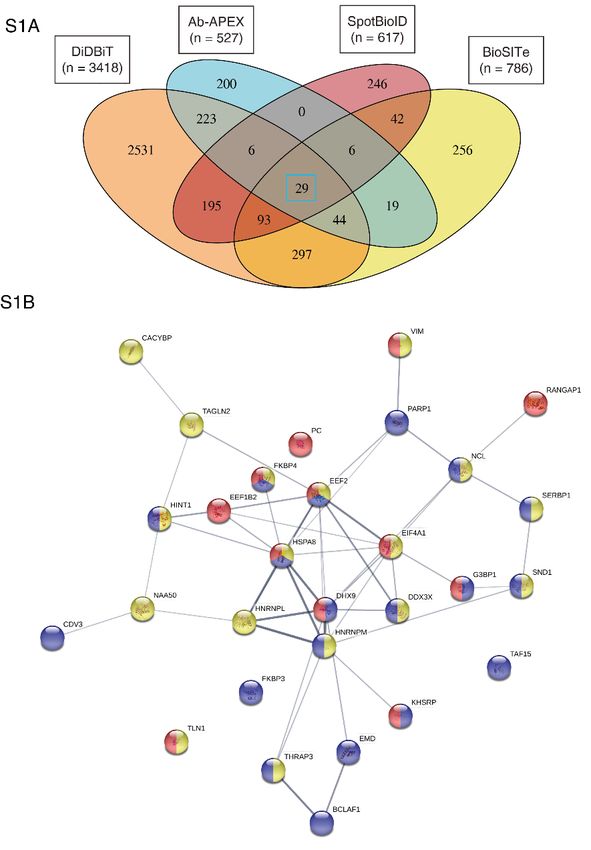
bioRxiv preprint first posted online Jul. 23, 2018; doi: http://dx.doi.org/10.1101/274761. The copyright holder for this preprint
(which was not peer-reviewed) is the author/funder, who has granted bioRxiv a license to display the preprint in perpetuity.
                                  It is made available under a CC-BY 4.0 International license.

     We describe here the first in vivo evidence for preferential biotinylation of predicted IDRs across four
     independent proximity proteomics studies. This adds a new type of (exogenous) PTM to a list of other
     PTMs (phosphorylation, ubiquitination and acetylation) that have previously been suggested to be
     enriched in IDRs22,30 and is validated by our comprehensive analysis. Ubiquitination and acetylation
     that shares the same target amino acid (i.e. lysine) with most proximity proteomics studies show
     higher median numbers of modification sites per protein than the deep proteome reference (Fig 3C).

     We envisage many possible benefits from re-purposing proximity proteomics data for in vivo
     structure-functional questions:

     (i) To complement very detailed kinetic in vitro studies that can resolve conformational dynamics at
     high spatial and temporal resolution using hydrogen deuterium exchange (HDX). Biotin ‘painting’
     could enable complementary in vivo comparisons of the same target proteins and thereby increase
     the scope of HDX or related protein surface accessibility-based structural proteomics techniques54,55.

     (ii) To acquire dynamic snapshots of biological pathways and determine by which mechanism these
     rewire biomolecular interaction networks and modulate subcellular conformations of proteins. Recent
     technological advances both in biotinylation enzymes and multiplexed mass analysis will accelerate
     sampling of more biological timepoints56-58.

     (iii) To study dynamic in vivo drug effects. Many new drug candidates are failing in the later stages of
     development due to our incomplete understanding of cellular biology. If we can re-purpose BioID or
     other biotinylation methods for elucidating subcellular protein interactions, we might achieve earlier
     insights into drug (in)efficiency in relevant biological contexts.

     Structural biotin analysis requires identification of the precise sites of biotinylation, which are typically
     not captured in more widely used protein-level enrichment in BioID experiments. We therefore briefly
     summarize here possible limitations and benefits for the biotin-peptide enrichment.

     An obvious limitation of peptide-level enrichment is that non-biotinylated peptides cannot contribute
     to the mass spectrometric signal, which can mean that more biological input material may be required
     in some cases. While peptide-level enrichment increases the specificity and analytical efficiency for
     detecting biotinylated peptides36-39, it comes at the expense of not being able to detect very short
     proteins that lack lysines or detectable peptides with one missed cleavage (due to a modified lysine).
     Sequence coverage might be improved by including additional proteases in future biotin-based
     proximity experiments59.

     How does biotin painting compare to other recently established proteome-wide structural assays?
     Similar to (in vitro/ex vivo) Limited Proteolysis (LiP)-MS, biotin painting can reveal local structural
     features of proteins and additionally enables in vivo and in vitro comparisons while being intrinsically
     limited by the need for biotin-peptide enrichment60,61. (LiP)-MS might, however, be less sensitive for
     conformational transitions that occur in IDRs that are depleted in hydrophobic amino acids and
     therefore lack the molecular targets of common LiP enzymes. Thermal proteome profiling (TPP) using
     quantitative comparisons of soluble fractions upon heating, is also compatible with in vivo structural
     comparisons but lacks local resolution while adding complementary information on protein-protein
     interactions based on co-precipitation of tightly interacting complex partner proteins at increasing
     temperatures21. Multi-span integral membrane proteins are under-represented in published TPP
     experiments, and biotin ‘painting’ might have useful complementary applications to biomedically
     relevant multi-span membrane proteins such as GPCRs. In summary, subcellular biotin painting can
     complement the already very powerful toolbox of structural proteomics.

                                                                                                                                    8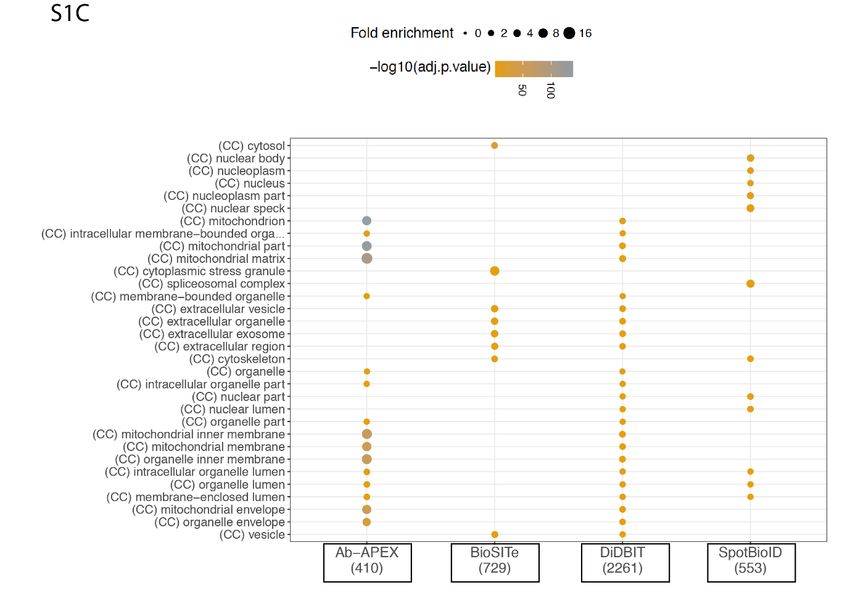
bioRxiv preprint first posted online Jul. 23, 2018; doi: http://dx.doi.org/10.1101/274761. The copyright holder for this preprint
(which was not peer-reviewed) is the author/funder, who has granted bioRxiv a license to display the preprint in perpetuity.
                                  It is made available under a CC-BY 4.0 International license.

     Are short IDRs functionally relevant? Several lines of recent independent experimental evidence
     suggest so. Local flexibility has been identified as crucial factor for the evolution of novel enzymatic
     functions62, and for tuning the activity of enzymes to enable efficient catalysis at low temperatures in
     biological niches of psychrophilic organisms63. Local unfolding, incomplete folding or delayed folding
     can be helpful for cellular transport of proteins that must not fold prematurely before reaching their
     cellular destinations64,65. High-density biotin painting appears to be useful to characterize the in vivo
     reactivity of both predicted long IDRs (using the IDR predictor IUPred-L) and local or transiently
     unfolded or disordered IDRs (i.e. IDRs uniquely predicted by VSL2b).

     How can we use the insights gleaned from this study to design novel, potentially better, proximity
     proteomics experiments? A key assumption in classical proximity proteomics studies is that
     biotinylation is enhanced near the biotin-activating enzyme. Our study shows that unfolded regions
     can be more readily biotinylated compared to folded regions. This could mean that proteins that in
     reality never change their cellular distribution can be perceived as farther away or closer to a birA-
     fusion due to condition-dependent local folding or unfolding, respectively. We do not currently have
     definitive answers on how to unambiguously dissect condition-dependent local (un)folding and
     subcellular redistributions. It appears worthwhile to envisage the possibility that transient changes in
     protein folding can be important modulators of cellular dynamics that should be more broadly
     factored into experimental designs of proteomics studies (Fig. 6).

     In conclusion, we believe that biotin ‘painting’ adds new layers of insight to proximity proteomics
     approaches by providing in vivo validation for computational IDR predictions, highlighting multi-
     modification hotspots that are often disease-linked30 and by enabling condition and compartment-
     specific in vivo structural comparisons.

     Material and methods
     Source data description:
     Four independent in vivo biotinylation studies have been used for our exploration of structural
     specificity of biotinylation sites. Their details are provided in Table 1 and they can be accessed as input
     files on the Github repository https://github.com/ComputationalProteomicsUnit/biotinIDR.

        Study            Ref   Target    Chemistry      Data Source                       PRIDE ID
        BioSITe           36
                               Tyrosine APEX2           SI file 2, supplementary Table 8 PXD007862
        Ab-APEX         37     Tyrosine APEX2           SI Table 6                             -
        DiDBiT          38
                               Lysine    NHS-Biotin SI file 2, Table S27                       -
        SpotBioID       39
                               Lysine    BirA           SI file 2, sheets 2-5                  -
                      Table 1: Sources of data used in this study, Supplementary Information (SI)

     Assigning disorder predictions
     Some 60 published disorder prediction algorithms feature balanced accuracies of around 70% to 80%;
     some being designed and validated to predict short IDRs (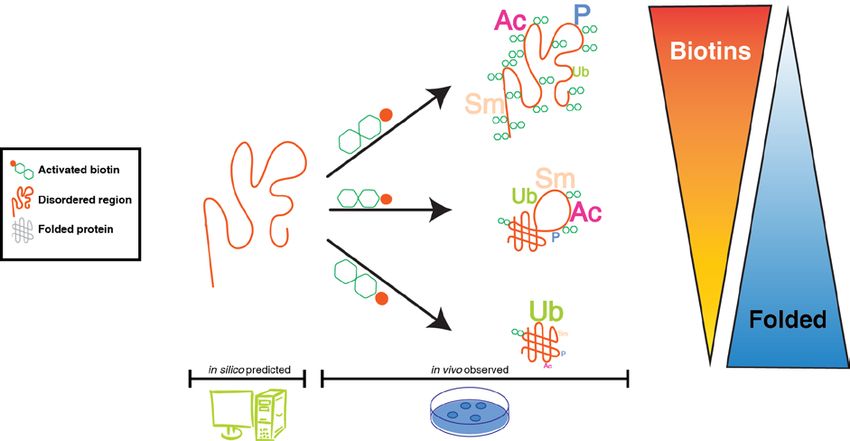
bioRxiv preprint first posted online Jul. 23, 2018; doi: http://dx.doi.org/10.1101/274761. The copyright holder for this preprint
(which was not peer-reviewed) is the author/funder, who has granted bioRxiv a license to display the preprint in perpetuity.
                                  It is made available under a CC-BY 4.0 International license.

     a given protein that is predicted by most of the 9 different compound predictors. Of the 9 callers
     included in D2P2, we focused our interest initially on the 2 most orthogonal callers (1) VSL2b which
     has high sensitivity for calling IDRs in both short and long regions of IDR68, and (2) IUPRed-L which has
     been trained to predict long disorders with high confidence52. As additional comparisons, we also
     predicted IDRs using (3) a combination of VSL2b and IUPRed-L where an IDR was accepted if called by
     one or both predictors (4) Consensus of (at least 75% of) 9 predictors included in D2P2.

     For all versions of IDR calling, we did not set any restrictions on the length of IDR. This means that an
     IDR can be called on a residue of length 1. While this might yield a lot of false positives, we wanted
     to ensure sensitivity rather than specificity of IDR calling. Having tested the 4 different versions of
     IDR calling with D2P2, we realised consistent trends between all predictions approaches while higher
     local sensitivity of VSL2b enabled more insights on local disorder. We therefore performed more
     detailed biotin site and PTM analyses using VSL2b. The IDR assignment uses an Application
     Programming Interface (API) to the D2P2 website and code to use this API was kindly provided by Dr.
     Tom Smith. The scripts ‘d2p2.py’ and ‘protinfo.py’ are necessary for the final analysis and can be
     accessed through the github repository
     https://github.com/TomSmithCGAT/CamProt/tree/master/camprot/proteomics . The python script
     for the final IDR analysis and output is called “Get_IDRs-DM-v2.py” and can be accessed via the
     repository https://github.com/ComputationalProteomicsUnit/biotinIDR.

     Mapping post-Translational Modifications (PTMs)
     A full repertoire of PTMs was downloaded on 10th April, 2018 from the “Downloads” section of the
     PhosphositePlus website (https://www.phosphosite.org/homeAction.action), particularly sites for
     phosphorylation, acetylation, ubiquitination and sumoylation (Suppl. Tables “PhosphositePlus”).
     These were then mapped onto the proteins for each of our 4 studies and used for generating protein-
     wise images.

     Protein sequence modification or proteoform images
     Images summarising the location of IDRs and PTMs were produced using Protter
     (http://wlab.ethz.ch/protter/) and protein structure images were generated using Pymol. For Protter
     images, scripts were written to generate an appropriate URL and then batch download it from the
     server. These scripts ‘printUrl.py’ and ‘runUrl.sh’ are also available via the Github repository
     https://github.com/ComputationalProteomicsUnit/biotinIDR (Suppl. Table “Protter-List”)

     Code availability for Statistical analysis of PTMs and biotinylations in IDRs
     Once IDR and PTM information were mapped, data were analysed for correlations and plots were
     generated using the R statistical framework (https://cran.r-project.org/ ) and several Bioconductor
     packages (https://bioconductor.org/). All code and input data can be accessed via the Github
     respository https://github.com/ComputationalProteomicsUnit/biotinIDR with the main files being
     ‘biopep.pub.Rmd’ and ‘biopepFunctions.R’. An extension to GO mapping, ‘GO.R’ was also kindly
     provided by Dr Tom Smith and can be obtained here https://github.com/TomSmithCGAT/CamProt_R .

     Statistical tests used
     To compare expected rates of biotin/PTMs and observed counts, we used a standard binomial test in
     R (binom.test). For estimating the background rate of biotins, we counted all the lysines (K; BirA
     based studies) or tyrosines (Y; APX based studies) in the protein sequence and within predicted IDR
     regions. For estimating the background rate of PTMs, we counted all the lysines (K; ubiquitination,
     acetylation, sumoylation) or serines, threonines and tyrosines (S, T, Y; phosphorylation) in the

                                                                                                                                    10
bioRxiv preprint first posted online Jul. 23, 2018; doi: http://dx.doi.org/10.1101/274761. The copyright holder for this preprint
(which was not peer-reviewed) is the author/funder, who has granted bioRxiv a license to display the preprint in perpetuity.
It is made available under a CC-BY 4.0 International license.
protein sequence and within predicted IDR regions. We defined the “probability of success” as the
number of residues in IDRs/Total number of residues, a “success” as a biotin or PTM within an IDR
and “number of trials” is the number of Biotins or PTMs observed in that study.
To look for differences in PTMs and biotins in the three protein groups – Folded, Partially Folded and
Unfolded, we used pairwise t-tests or ANOVA followed by a post-hoc correction of family-wise error
rates using a Tukey’s Honestly Significant Differences test. The former yields a p-value while the
latter yields a confidence interval for the effect size as well as a p-value. To compare number of
biotins and IDRs, we used a standard Pearson’s correlation test. To compare mean PTMs between
the HEK293 biotinome and HEK293 proteome we used a standard t-test for means.
To perform a GO enrichment analysis, we used the package ‘goseq’69 which is based on a
Hypergeometric test with a Wallenius’ correction which accounts for any biases in the data such as
gene length, protein expression etc. In our study, we used protein expression from Geiger et al. 53, as
the bias factor prior to calculating GO enrichment.
Biomolecular structure visualisation
The Cryo-EM structure of the human 80S ribosome (PDB ID 4v6x70) was visualised using ChimeraX71 .
SERBP1 and its biotinylated sites were highlighted using the sel function in its command line interface.
RNA was coloured purple and protein subunits (except SERBP1) blue. All ribosomal macromolecules
were visualised in surface representation. The FKBP3 NMR structure (PDB ID 2mph) was visualised in
cartoon model of the first low energy model; surfaces were kept 90% transparent except around
biotinylation sites that were highlighted in yellow.
Code availability
Code to process biotinylation datasets and reproduce the analysis has been deposited in the Github
repository https://github.com/ComputationalProteomicsUnit/biotinIDR. Please request access to
the code by emailing the corresponding authors as it will be made public following journal
acceptance.
References
1 Yruela, I., Oldfield, C. J., Niklas, K. J. & Dunker, A. K. Evidence for a Strong Correlation Between
Transcription Factor Protein Disorder and Organismic Complexity. Genome Biol Evol 9, 1248-
1265, doi:10.1093/gbe/evx073 (2017).
2 Xue, B., Dunker, A. K. & Uversky, V. N. Orderly order in protein intrinsic disorder distribution:
disorder in 3500 proteomes from viruses and the three domains of life. J Biomol Struct Dyn 30,
137-149, doi:10.1080/07391102.2012.675145 (2012).
3 Romero, P. R. et al. Alternative splicing in concert with protein intrinsic disorder enables
increased functional diversity in multicellular organisms. Proc Natl Acad Sci U S A 103, 8390-
8395, doi:10.1073/pnas.0507916103 (2006).
4 Dunker, A. K., Bondos, S. E., Huang, F. & Oldfield, C. J. Intrinsically disordered proteins and
multicellular organisms. Semin Cell Dev Biol 37, 44-55, doi:10.1016/j.semcdb.2014.09.025
(2015).
5 Minde, D. P., Dunker, A. K. & Lilley, K. S. Time, space and disorder in the expanding proteome
universe. Proteomics, doi:10.1002/pmic.201600399 (2017).
6 Tompa, P., Davey, N. E., Gibson, T. J. & Babu, M. M. A million peptide motifs for the molecular
biologist. Mol Cell 55, 161-169, doi:10.1016/j.molcel.2014.05.032 (2014).
11bioRxiv preprint first posted online Jul. 23, 2018; doi: http://dx.doi.org/10.1101/274761. The copyright holder for this preprint
(which was not peer-reviewed) is the author/funder, who has granted bioRxiv a license to display the preprint in perpetuity.
It is made available under a CC-BY 4.0 International license.
7 Smith, L. M., Kelleher, N. L. & Consortium for Top Down, P. Proteoform: a single term
describing protein complexity. Nat Methods 10, 186-187, doi:10.1038/nmeth.2369 (2013).
8 Uversky, V. N., Oldfield, C. J. & Dunker, A. K. Intrinsically disordered proteins in human
diseases: introducing the D2 concept. Annu Rev Biophys 37, 215-246,
doi:10.1146/annurev.biophys.37.032807.125924 (2008).
9 Minde, D. P., Anvarian, Z., Rudiger, S. G. D. & Maurice, M. M. Messing up disorder: how do
missense mutations in the tumor suppressor protein APC lead to cancer? Molecular Cancer
10, doi:10.1186/1476-4598-10-101 (2011).
10 Noutsou, M. et al. Critical Scaffolding Regions of the Tumor Suppressor Axin1 Are Natively
Unfolded. Journal of Molecular Biology 405, 773-786, doi:10.1016/j.jmb.2010.11.013 (2011).
11 Minde, D. P., Radli, M., Forneris, F., Maurice, M. M. & Ruediger, S. G. D. Large Extent of
Disorder in Adenomatous Polyposis Coli Offers a Strategy to Guard Wnt Signalling against
Point Mutations. Plos One 8, doi:10.1371/journal.pone.0077257 (2013).
12 Carulla, N. et al. Experimental characterization of disordered and ordered aggregates
populated during the process of amyloid fibril formation. Proc Natl Acad Sci U S A 106, 7828-
7833, doi:10.1073/pnas.0812227106 (2009).
13 Folkers, P. J. et al. Solution structure of recombinant hirudin and the Lys-47----Glu mutant: a
nuclear magnetic resonance and hybrid distance geometry-dynamical simulated annealing
study. Biochemistry 28, 2601-2617 (1989).
14 Vucetic, S., Brown, C. J., Dunker, A. K. & Obradovic, Z. Flavors of protein disorder. Proteins 52,
573-584, doi:10.1002/prot.10437 (2003).
15 Babu, M. M. The contribution of intrinsically disordered regions to protein function, cellular
complexity, and human disease. Biochem Soc Trans 44, 1185-1200, doi:10.1042/BST20160172
(2016).
16 Toth-Petroczy, A. et al. Structured States of Disordered Proteins from Genomic Sequences.
Cell 167, 158-170 e112, doi:10.1016/j.cell.2016.09.010 (2016).
17 Gunasekaran, K., Tsai, C. J. & Nussinov, R. Analysis of ordered and disordered protein
complexes reveals structural features discriminating between stable and unstable monomers.
J Mol Biol 341, 1327-1341, doi:10.1016/j.jmb.2004.07.002 (2004).
18 Gsponer, J., Futschik, M. E., Teichmann, S. A. & Babu, M. M. Tight regulation of unstructured
proteins: from transcript synthesis to protein degradation. Science 322, 1365-1368,
doi:10.1126/science.1163581 (2008).
19 Dyson, H. J. & Wright, P. E. Intrinsically unstructured proteins and their functions. Nat Rev Mol
Cell Biol 6, 197-208, doi:10.1038/nrm1589 (2005).
20 Borgia, A. et al. Extreme disorder in an ultrahigh-affinity protein complex. Nature 555, 61-66,
doi:10.1038/nature25762 (2018).
21 Becher, I. et al. Pervasive Protein Thermal Stability Variation during the Cell Cycle. Cell 173,
1495-1507 e1418, doi:10.1016/j.cell.2018.03.053 (2018).
22 Iakoucheva, L. M. et al. The importance of intrinsic disorder for protein phosphorylation.
Nucleic Acids Res 32, 1037-1049, doi:10.1093/nar/gkh253 (2004).
23 Zhu, S. et al. Hyperphosphorylation of intrinsically disordered tau protein induces an
amyloidogenic shift in its conformational ensemble. PLoS One 10, e0120416,
doi:10.1371/journal.pone.0120416 (2015).
24 Uversky, V. N. The intrinsic disorder alphabet. III. Dual personality of serine. Intrinsically Disord
Proteins 3, e1027032, doi:10.1080/21690707.2015.1027032 (2015).
25 Kulkarni, P. et al. Phosphorylation-induced conformational dynamics in an intrinsically
disordered protein and potential role in phenotypic heterogeneity. Proc Natl Acad Sci U S A
114, E2644-E2653, doi:10.1073/pnas.1700082114 (2017).
26 Potel, C. M., Lin, M. H., Heck, A. J. R. & Lemeer, S. Widespread bacterial protein histidine
phosphorylation revealed by mass spectrometry-based proteomics. Nat Methods 15, 187-190,
doi:10.1038/nmeth.4580 (2018).
12bioRxiv preprint first posted online Jul. 23, 2018; doi: http://dx.doi.org/10.1101/274761. The copyright holder for this preprint
(which was not peer-reviewed) is the author/funder, who has granted bioRxiv a license to display the preprint in perpetuity.
It is made available under a CC-BY 4.0 International license.
27 Rosenlow, J., Isaksson, L., Mayzel, M., Lengqvist, J. & Orekhov, V. Y. Tyrosine phosphorylation
within the intrinsically disordered cytosolic domains of the B-cell receptor: an NMR-based
structural analysis. PLoS One 9, e96199, doi:10.1371/journal.pone.0096199 (2014).
28 Guharoy, M., Bhowmick, P. & Tompa, P. Design Principles Involving Protein Disorder Facilitate
Specific Substrate Selection and Degradation by the Ubiquitin-Proteasome System. J Biol
Chem 291, 6723-6731, doi:10.1074/jbc.R115.692665 (2016).
29 Kim, S. C. et al. Substrate and functional diversity of lysine acetylation revealed by a
proteomics survey. Mol Cell 23, 607-618, doi:10.1016/j.molcel.2006.06.026 (2006).
30 Huang, Q. et al. Human proteins with target sites of multiple post-translational modification
types are more prone to be involved in disease. J Proteome Res 13, 2735-2748,
doi:10.1021/pr401019d (2014).
31 Han, S. et al. Proximity Biotinylation as a Method for Mapping Proteins Associated with mtDNA
in Living Cells. Cell Chem Biol 24, 404-414, doi:10.1016/j.chembiol.2017.02.002 (2017).
32 Rees, J. S., Li, X. W., Perrett, S., Lilley, K. S. & Jackson, A. P. Protein Neighbors and Proximity
Proteomics. Mol Cell Proteomics 14, 2848-2856, doi:10.1074/mcp.R115.052902 (2015).
33 Kim, D. I. et al. An improved smaller biotin ligase for BioID proximity labeling. Mol Biol Cell 27,
1188-1196, doi:10.1091/mbc.E15-12-0844 (2016).
34 Tron, C. M. et al. Structural and functional studies of the biotin protein ligase from Aquifex
aeolicus reveal a critical role for a conserved residue in target specificity. J Mol Biol 387, 129-
146 (2009).
35 Youn, J. Y. et al. High-Density Proximity Mapping Reveals the Subcellular Organization of
mRNA-Associated Granules and Bodies. Mol Cell 69, 517-532 e511,
doi:10.1016/j.molcel.2017.12.020 (2018).
36 Kim, D. I. et al. BioSITe: A Method for Direct Detection and Quantitation of Site-Specific
Biotinylation. J Proteome Res 17, 759-769, doi:10.1021/acs.jproteome.7b00775 (2018).
37 Udeshi, N. D. et al. Antibodies to biotin enable large-scale detection of biotinylation sites on
proteins. Nat Methods 14, 1167-1170, doi:10.1038/nmeth.4465 (2017).
38 Schiapparelli, L. M. et al. Direct detection of biotinylated proteins by mass spectrometry. J
Proteome Res 13, 3966-3978, doi:10.1021/pr5002862 (2014).
39 Lee, S. Y. et al. Proximity-Directed Labeling Reveals a New Rapamycin-Induced Heterodimer
of FKBP25 and FRB in Live Cells. ACS Cent Sci 2, 506-516, doi:10.1021/acscentsci.6b00137
(2016).
40 Lam, S. S. et al. Directed evolution of APEX2 for electron microscopy and proximity labeling.
Nat Methods 12, 51-54, doi:10.1038/nmeth.3179 (2015).
41 Roux, K. J., Kim, D. I. & Burke, B. BioID: a screen for protein-protein interactions. Curr Protoc
Protein Sci 74, Unit 19 23, doi:10.1002/0471140864.ps1923s74 (2013).
42 Campen, A. et al. TOP-IDP-scale: a new amino acid scale measuring propensity for intrinsic
disorder. Protein Pept Lett 15, 956-963 (2008).
43 Sugase, K., Dyson, H. J. & Wright, P. E. Mechanism of coupled folding and binding of an
intrinsically disordered protein. Nature 447, 1021, doi:10.1038/nature05858 (2007).
44 Davey, N. E. et al. Attributes of short linear motifs. Mol Biosyst 8, 268-281,
doi:10.1039/c1mb05231d (2012).
45 Miskei, M., Antal, C. & Fuxreiter, M. FuzDB: database of fuzzy complexes, a tool to develop
stochastic structure-function relationships for protein complexes and higher-order assemblies.
Nucleic Acids Res 45, D228-D235, doi:10.1093/nar/gkw1019 (2017).
46 Monteiro, R. et al. Differential biotin labelling of the cell envelope proteins in
lipopolysaccharidic diderm bacteria: Exploring the proteosurfaceome of Escherichia coli using
sulfo-NHS-SS-biotin and sulfo-NHS-PEG4-bismannose-SS-biotin. J Proteomics,
doi:10.1016/j.jprot.2018.03.026 (2018).
47 Lins, L., Thomas, A. & Brasseur, R. Analysis of accessible surface of residues in proteins. Protein
Sci 12, 1406-1417, doi:10.1110/ps.0304803 (2003).
13bioRxiv preprint first posted online Jul. 23, 2018; doi: http://dx.doi.org/10.1101/274761. The copyright holder for this preprint
(which was not peer-reviewed) is the author/funder, who has granted bioRxiv a license to display the preprint in perpetuity.
It is made available under a CC-BY 4.0 International license.
48 Frege, T. & Uversky, V. N. Intrinsically disordered proteins in the nucleus of human cells.
Biochem Biophys Rep 1, 33-51, doi:10.1016/j.bbrep.2015.03.003 (2015).
49 Peng, Z. et al. A creature with a hundred waggly tails: intrinsically disordered proteins in the
ribosome. Cell Mol Life Sci 71, 1477-1504, doi:10.1007/s00018-013-1446-6 (2014).
50 Ito, M. et al. Intrinsically disordered proteins in human mitochondria. Genes Cells 17, 817-825,
doi:10.1111/gtc.12000 (2012).
51 Oates, M. E. et al. D(2)P(2): database of disordered protein predictions. Nucleic Acids Res 41,
D508-516, doi:10.1093/nar/gks1226 (2013).
52 Dosztanyi, Z., Csizmok, V., Tompa, P. & Simon, I. IUPred: web server for the prediction of
intrinsically unstructured regions of proteins based on estimated energy content.
Bioinformatics 21, 3433-3434, doi:10.1093/bioinformatics/bti541 (2005).
53 Geiger, T., Wehner, A., Schaab, C., Cox, J. & Mann, M. Comparative proteomic analysis of
eleven common cell lines reveals ubiquitous but varying expression of most proteins. Mol Cell
Proteomics 11, M111 014050, doi:10.1074/mcp.M111.014050 (2012).
54 Gustavsson, M. et al. Structural basis of ligand interaction with atypical chemokine receptor
3. Nat Commun 8, 14135, doi:10.1038/ncomms14135 (2017).
55 Gladkova, C., Maslen, S., Skehel, J. M. & Komander, D. Mechanism of parkin activation by
PINK1. Nature, doi:10.1038/s41586-018-0224-x (2018).
56 Ramanathan, M. et al. RNA–protein interaction detection in living cells. Nature Methods 15,
207, doi:10.1038/nmeth.4601 (2018).
57 Virreira Winter, S. et al. EASI-tag enables accurate multiplexed and interference-free MS2-
based proteome quantification. Nat Methods, doi:10.1038/s41592-018-0037-8 (2018).
58 Kelstrup, C. D. et al. Performance Evaluation of the Q Exactive HF-X for Shotgun Proteomics. J
Proteome Res 17, 727-738, doi:10.1021/acs.jproteome.7b00602 (2018).
59 Meyer, J. G. et al. Expanding proteome coverage with orthogonal-specificity alpha-lytic
proteases. Mol Cell Proteomics 13, 823-835, doi:10.1074/mcp.M113.034710 (2014).
60 Feng, Y. et al. Global analysis of protein structural changes in complex proteomes. Nature
Biotechnology 32, 1036, doi:10.1038/nbt.2999 (2014).
61 Piazza, I. et al. A Map of Protein-Metabolite Interactions Reveals Principles of Chemical
Communication. Cell 172, 358-372 e323, doi:10.1016/j.cell.2017.12.006 (2018).
62 Campbell, E. et al. The role of protein dynamics in the evolution of new enzyme function.
Nature Chemical Biology 12, 944, doi:10.1038/nchembio.2175 (2016).
63 Saavedra, H. G., Wrabl, J. O., Anderson, J. A., Li, J. & Hilser, V. J. Dynamic allostery can drive
cold adaptation in enzymes. Nature 558, 324-328, doi:10.1038/s41586-018-0183-2 (2018).
64 Zhou, J. & Dunker, A. K. Regulating Protein Function by Delayed Folding. Structure 26, 679-681,
doi:10.1016/j.str.2018.04.011 (2018).
65 Tsirigotaki, A. et al. Long-Lived folding intermediates predominate the Targeting-Competent
secretome. Structure 26, 695-707. e695 (2018).
66 Peng, Z. L. & Kurgan, L. Comprehensive comparative assessment of in-silico predictors of
disordered regions. Curr Protein Pept Sci 13, 6-18 (2012).
67 Piovesan, D. et al. DisProt 7.0: a major update of the database of disordered proteins. Nucleic
Acids Research, gkw1056 (2016).
68 Peng, K., Radivojac, P., Vucetic, S., Dunker, A. K. & Obradovic, Z. Length-dependent prediction
of protein intrinsic disorder. BMC Bioinformatics 7, 208, doi:10.1186/1471-2105-7-208 (2006).
69 Young, M. D., Wakefield, M. J., Smyth, G. K. & Oshlack, A. Gene ontology analysis for RNA-seq:
accounting for selection bias. Genome Biology 11, R14, doi:10.1186/gb-2010-11-2-r14 (2010).
70 Anger, A. M. et al. Structures of the human and Drosophila 80S ribosome. Nature 497, 80-85,
doi:10.1038/nature12104 (2013).
71 Goddard, T. D. et al. UCSF ChimeraX: Meeting modern challenges in visualization and analysis.
Protein Sci 27, 14-25, doi:10.1002/pro.3235 (2018).
14You can also read