Single-cell genomics to understand disease pathogenesis - Nature
←
→
Page content transcription
If your browser does not render page correctly, please read the page content below
Journal of Human Genetics
                                    https://doi.org/10.1038/s10038-020-00844-3

                                        REVIEW ARTICLE

                                    Single-cell genomics to understand disease pathogenesis
                                    Seitaro Nomura1

                                    Received: 1 July 2020 / Revised: 1 September 2020 / Accepted: 1 September 2020
                                    © The Author(s) 2020. This article is published with open access

                                    Abstract
                                    Cells are minimal functional units in biological phenomena, and therefore single-cell analysis is needed to understand the
                                    molecular behavior leading to cellular function in organisms. In addition, omics analysis technology can be used to identify
                                    essential molecular mechanisms in an unbiased manner. Recently, single-cell genomics has unveiled hidden molecular
                                    systems leading to disease pathogenesis in patients. In this review, I summarize the recent advances in single-cell genomics
                                    for the understanding of disease pathogenesis and discuss future perspectives.
1234567890();,:
                  1234567890();,:

                                    Single-cell genomics to dissect the biology                             transcriptomes of cardiomyocytes isolated during the pro-
                                    of heart failure                                                        gression of heart failure [4]. Weighted gene co-expression
                                                                                                            network analysis, which extracts gene modules co-
                                    The heart constantly responds to hemodynamic overload.                  expressed across cells [5], identified nine gene modules
                                    Cardiomyocytes, which are the principal components of the               and, using the expression profiles of these gene modules,
                                    pump function of the heart, are required to maintain cardiac            we classified cardiomyocytes into seven cell states. Pseu-
                                    homeostasis by adapting appropriately to this stress. How-              dotime analysis with the machine learning algorithm
                                    ever, sustained exposure to pathological stress disrupts the            Monocle [6] identified two distinct trajectories for adaptive
                                    adaptive mechanisms of cardiomyocytes, leading to heart                 and failing cardiomyocytes. Chromatin immunoprecipita-
                                    failure. Understanding how each cardiomyocyte responds to               tion using an anti-H3K27ac antibody followed by sequen-
                                    various stimuli at the single-cell level will help to elucidate         cing revealed the regulatory elements of the gene modules
                                    the pathogenesis of heart failure.                                      and inferred the upstream transcription factors associated
                                        Cardiomyocytes are cylindrically shaped, around 120-μm              with cardiomyocyte hypertrophy and failure. Through these
                                    long and 30-μm wide. Because of this large size, See et al.             analyses, we revealed that DNA damage and p53 signaling
                                    decided to isolate nuclei from cardiomyocytes using a                   are activated at the branch point for failing cardiomyocytes,
                                    microfluidics system and conducted single-nucleus RNA-                   and this enabled us to generate cardiomyocyte-specific p53
                                    sequencing (RNA-seq) to reveal the activation of cell-cycle             knockout mice and show that p53 is essential for the
                                    regulators and novel long noncoding RNAs in diseased                    induction of failing cardiomyocytes.
                                    cardiomyocytes [1]. To obtain expression profiles from                      To recover the spatial information lost in single-cell
                                    single cardiomyocytes, we modified the Smart-seq2 proto-                 RNA-seq analysis, we established a single-molecule RNA
                                    col [2, 3], which amplifies full-length cDNA for single-cell             in situ hybridization assay, which enables quantification of
                                    transcriptome analysis and established a system to quanti-              each mRNA at the single-cell level [7], and revealed the
                                    tatively analyze the transcriptomes of manually picked live             spatial heterogeneity of failing cardiomyocytes induced by
                                    single cardiomyocytes [4].                                              pressure overload [8]. Furthermore, the single-cell RNA-seq
                                        We applied this system to a mouse model of pressure                 profiles of cardiomyocytes isolated from patients with heart
                                    overload-induced heart failure and obtained single-cell                 failure also validated the presence of failing cardiomyo-
                                                                                                            cytes, characterized by the activation of DNA damage
                                                                                                            response genes, only in patients showing poor prognosis
                                                                                                            [4]. We also performed molecular pathology analysis using
                                    * Seitaro Nomura                                                        cardiac biopsy samples from patients with heart failure
                                      senomura-cib@umin.ac.jp
                                                                                                            before treatment to demonstrate that the level of DNA
                                    1
                                         Department of Cardiovascular Medicine, Graduate School of          damage in cardiomyocytes determines clinical prognosis
                                         Medicine, University of Tokyo, Tokyo, Japan                        and treatment response [9]. Recent single-cell RNA-seq
S. Nomura
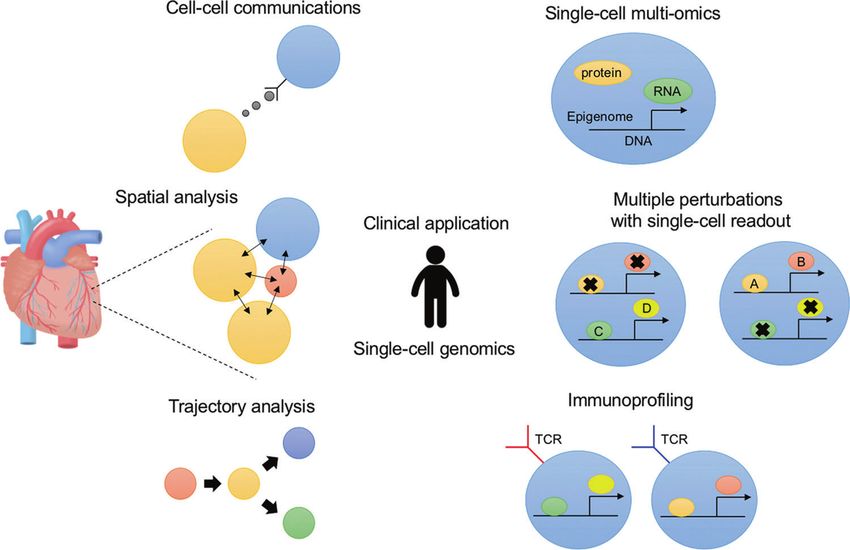
Fig. 1 Overview of single-cell genomics to understand disease pathogenesis.
analysis in heart failure biology has also revealed the environment in the lung. Vento-Tormo et al. leveraged the
involvement of inflammatory cells [10] and the anatomical expression profiles of ~70,000 single cells from first-
expression profiles of disease-causing genes [11, 12]. trimester placentas with matched maternal blood and
We and others have applied single-cell genomics and decidual cells, revealing the cellular organization of the
used cell-type classification, trajectory inference, marker decidua and placenta and the interactions that are critical for
identification, spatial analysis, and clinical assessment to placentation and reproductive success [14]. They identified
further our understanding of disease pathogenesis. How- three types of decidual natural killer (dNK) cells:
ever, conventional single-cell RNA-seq analysis is not dNK1 cells secrete CSF1 to transduce signals to extravillous
sufficient for obtaining the information necessary for a trophoblasts and macrophages; dNK2 cells secrete XCL1 to
deeper understanding of molecular behavior. Recently, transduce signals to extravillous trophoblasts and dendritic
several studies have opened new avenues by focusing on cells; and dNK3 cells secrete CCL5 to transduce signals to
cell–cell communications, spatial single-cell omics, barcode extravillous trophoblasts and macrophages. They also
lineage tracing, single-cell multi-omics, multiple perturba- developed CellPhoneDB, an algorithm implemented by
tions with single-cell readout, immunoprofiling, and clinical Python, to enable cell–cell communication analysis that
application (Fig. 1). In this review, I discuss the recent considers the structural composition of ligands and recep-
advances and future perspectives of single-cell genomics in tors [15].
our efforts to understand development, physiology, and Giladi et al. reported an approach for sequencing phy-
pathophysiology. sically interacting cells (PIC-seq), which integrates cell
sorting of physically interacting cells (PICs) with single-cell
RNA-seq data, to comprehensively investigate the func-
Cell–cell communications tional nature of PICs and identify the signaling molecules
associated with these interactions [16]. In the developing
Several types of cells interact with each other via a variety lung, PICs of regulatory T cells and dendritic cells speci-
of signaling molecules to generate organ-level functions. By fically express IL12b, whereas PICs of regulatory T cells
integrating the single-cell expression profiles of ligands and and monocytes express CCL6. However, this method needs
receptors in developing lung tissue with a ligand and detailed consideration of the conditions used and validation
receptor interaction database, Cohen et al. generated a of the identified signaling molecules by alternative
cell–cell communication map and identified eosinophils as approaches.
essential signal mediators in the lung [13]. Eosinophils Cell–cell communications also occur at the level of the
express IL1RL1, which binds to IL-33 secreted from organism. Ma et al. obtained ~210,000 single-cell tran-
alveolar epithelial type II cells, and secrete IL-6 or IL-13 to scriptomes from several organs (adipose tissue, aorta, kid-
activate macrophages and maintain the immune ney, liver, skin, bone marrow, brain, and skeletal muscle)Single-cell genomics to understand disease pathogenesis
from young and aged rats with or without calorie restriction tumor microenvironment in colorectal cancer [24]. Jackson
and analyzed the changes in cellular distribution and cell- et al. used mass cytometry imaging analysis, which allows
type-specific expression profiles [17]. They revealed an labeling of all target proteins with heavy-metal-conjugated
increase of cell types associated with immunity and antibodies and quantification by point-by-point ablation of
inflammation during aging across whole organs, which was the samples coupled to mass spectrometry, and simulta-
alleviated by calorie restriction. Using SCENIC, an algo- neously quantified 35 biomarkers in ~170,000 cells on tis-
rithm for inferring transcriptional networks [18], they also sue specimens from nearly 350 patients with breast cancer
identified a decrease in the activity of specific transcription [25]. Spatial single-cell analysis identified the phenotypes
factors such as Cebpd and Cebpb during aging, which was of tumor and stromal cells and their interaction patterns;
also alleviated by calorie restriction. Cell–cell communica- using them, they stratified the patients into 20 subtypes,
tion analysis uncovered an increase in the interactions which were critically associated with clinical course.
associated with endothelial cells during aging, which was Rodriques et al. developed Slide-seq, a method for
also rescued by calorie restriction. transferring tissue sections onto a surface covered with
DNA-barcoded beads in known positions [26]. Using this
Spatial analysis method, they revealed the spatial localization of several
types of cells in the cerebellum and hippocampus and cell-
Cell–cell communications can be assessed more accurately type-specific spatial responses in the cerebral cortex. At 3 h
by in situ analysis with preservation of spatial information after injury, early response genes such as Fos and ribosomal
in tissues. Individual mRNA molecules can be detected RNAs are activated at the injured position; at 3 days after
accurately in cells with single-molecule fluorescence in situ injury, cell-cycle-related genes are activated in microglia
hybridization (FISH) [19]. Eng et al. developed sequential and macrophages in remote regions; at 2 weeks after injury,
FISH and quantitatively analyzed the mRNAs of 10,000 these cells are replaced to fill the injured position. These
genes in the cortex, subventricular zone, and olfactory bulb cells also showed the activation of genes involved in the
of the mouse brain at the single-cell level [20]. This method development of oligodendrocytes.
not only allows unbiased identification of cell classes and Lundeberg et al. developed spatial transcriptomics, an
their spatial organization but also reveals subcellular mRNA approach similar to Slide-seq [27], and performed spatial
localization patterns and ligand receptor pairs across gene expression analysis of human heart development [28].
neighboring cells. By using the FISH method, Su et al. This method is now accessible as Visium from 10× Geno-
demonstrated simultaneous imaging of more than 1000 mics. They revealed the distinct behavior of cardiac neural
genomic loci and nascent transcripts of more than 1000 crest cells, marked by ISL1 and STMN2, and Schwann cell
genes together with landmark nuclear structures, revealing precursors, marked by ALDH1A1. Both cells emerge in the
that transcription activity correlates with the local enrich- outflow tract, but only the latter localizes in the sub-
ment of active chromatin, which consists of long-range epicardial interstitium during heart development. Even in
chromatin interactions [21]. the outflow tract, the former emerges only in the early
Multiplexed proteome approaches also enable quantita- phase, whereas the latter is found only in the late phase.
tive analysis of protein expression levels in situ at the Recently, a variety of tissue clearing methods have been
single-cell level [22]. Goltsev et al. developed a highly developed that can be applied to single-cell protein
multiplexed cytometric imaging approach, termed co- expression analysis in several organs [29]. Although most
detection by indexing (CODEX), in which all target pro- protein expression analyses are based on immunostaining,
teins are labeled simultaneously using DNA-conjugated clearing-enhanced 3D imaging combines tissue clearing
antibodies and antibody identity is revealed by iterative with single-molecule RNA in situ hybridization [7] to
exchange of fluorophore-conjugated DNA [23]. By ana- enable RNA localization analysis in transparent organs [30].
lyzing the effect of the cellular neighborhood on the These tissue clearing methods need careful consideration,
expression of receptors in splenic immune cells, they such as how the clearing reagents should be selected and
revealed the emergence of erythroblasts and disease-specific whether the antibodies or probes are well distributed
regulatory T cells and identified their interactions with throughout the tissue.
dendritic cells. Schürch et al. re-engineered the CODEX
method to be compatible with formalin-fixed paraffin- Trajectory analysis
embedded tissue, conducted simultaneous profiling using
56 protein markers in 140 tissue regions from 35 patients Trapnell et al. developed Monocle, an algorithm-based
with advanced-stage colorectal cancer, and identified 9 application for pseudotime analysis and inference of the
conserved, distinct cellular neighborhoods, which are a linear or bifurcating trajectories of an individual cell’s
collection of components characteristic of the immune progress through differentiation [6, 31]; to the currentS. Nomura version is Monocle 3 [32, 33]. The algorithm reduces developed the PolyloxExpress mouse line, which shows Cre dimensions by using uniform manifold approximation and recombinase-dependent DNA barcoding that allows the projection (UMAP) [34], clusters neighboring cells into parallel readout of barcodes and transcriptomes in single groups with the Leiden method, and extracts the trajectories cells, revealed the molecular signature of differentiation- connecting groups. They applied this algorithm to single- inactive hematopoietic stem cells, and demonstrated that cell transcriptomes of over 200,000 cells isolated from these cells can undergo symmetric self-renewal [42]. developing mouse embryos and identified more than 500 Frieda et al. established a synthetic system, termed memory cell types and 56 developmental trajectories [32]. They also by engineered mutagenesis with optical in situ readout, used the single-cell expression profiles of 86,000 cells which is based on a set of barcoded recording elements isolated from developing Caenorhabditis elegans and (scratchpad). The scratchpad altered by CRISPR/Cas9- identified 502 cell types and 1068 developmental trajec- based mutagenesis can be read out through multiplexed tories [33]. They further showed that the integration of single-molecule RNA FISH, enabling the simultaneous UMAP and Louvain clustering enables the identification of detection of lineages and gene expression profiles gene groups that correspond to protein complexes and in situ [48]. pathways [35]. Additional information, such as the ratio of reads map- Single-cell multi-omics analysis ped to introns and exons, RNA metabolism, and protein expression profiles, enables trajectories to be inferred more The simultaneous detection of DNA sequences and RNA accurately. On the basis of the concept that transcriptionally expression profiles enables the identification of disease- active cells have more unspliced mRNAs, La Manno et al. causing variants and their association with gene expression. developed Velocyto, an algorithm for inferring trajectories There are novel methods to simultaneously extract infor- using the ratio of reads mapped to introns and exons [36]. mation from DNA and RNA [49–51]. By physically They applied this algorithm to single-cell RNA-seq data separating mRNA from genomic DNA using oligo-dT bead from the mouse hippocampus and identified several trajec- capture and performing whole-transcriptome and whole- tories from neuroblasts to the subiculum and astrocytes. genome amplifications, Macaulay et al. developed a method They also revealed the kinetics of transcription during that can detect thousands of transcripts in parallel with the human embryonic glutamatergic neurogenesis. genetic variants captured by DNA-seq data from single cells Because Monocle and Velocyto infer cellular trajectories [49, 50]. Dey et al. reported a quasilinear amplification by using single-cell information derived only from strategy to quantify genomic DNA and mRNA from single RNA molecules, these algorithms cannot accurately recon- cells without physical separation and showed that genes struct trajectories in cell-state transitions such as with high cell-to-cell variability in transcript numbers gen- endothelial–mesenchymal transition. Recently, on the basis erally have lower genomic copy numbers, suggesting that of the concept that daughter cells generally have the same copy number variation may drive variability in gene genome, lineage tracing analysis using DNA barcode expression among individual cells [51]. technology, a method of lineage identification that uses a The detection of single nucleotide variants using abun- short section of re-writable DNA, has been advancing [37]. dant single-cell RNA-seq data is an applicable and cost- Approaches for generating DNA barcodes include effective method for identifying expressed variants, infer- retrovirus-induced genome insertion [38, 39], Cre/loxP- ring sub-clones, and deciphering genotype-phenotype rela- mediated recombination [40–42], and CRISPR/Cas9-medi- tionships [52]. Enge et al. simultaneously analyzed single ated DNA double-strand breaks [43–46]. Several approa- nucleotide variants and gene expression profiles from 2544 ches can read out barcode information as mRNA molecules, pancreatic cells from 8 donors and found that islet endo- enabling the simultaneous detection of gene expression and crine cells from older donors show increased levels of lineage information [42, 45, 46]. Alemany et al. performed transcriptional noise and potential fate drift, which was the simultaneous analysis of gene expression and lineage considered to be induced by oxidative stress. By deter- tracing in zebrafish and revealed that epidermal and mining the mutational history of individual cells, they mesenchymal cells in the caudal fin arise from the same revealed a novel mutational signature in healthy aging progenitors and that osteoblast-restricted precursors can endocrine cells [53]. Nam et al. developed genotyping of produce mesenchymal cells during regeneration after injury transcriptomes, a method to integrate genotyping with [45, 47]. They also identified resident immune cells in the droplet-based single-cell transcriptomes, and used it to fin with a distinct clonal origin from other blood cell types. profile ~40,000 CD34+ cells from patients with CALR- Bowling et al. established the CRISPR array repair lineage mutated myeloproliferative neoplasms, identifying an tracing mouse line and uncovered a clonal bottleneck in the association between the activation of the unfolded protein response of hematopoietic stem cells to injury [46]. Pei et al. response and NF-κB pathway with CALR mutations [54].
Single-cell genomics to understand disease pathogenesis

   Given that gene expression is regulated by the epigen-        ~50% is sufficient to induce a near maximal transcriptional
ome, simultaneous analysis of the transcriptome and epi-         response and growth defect, whereas a larger reduction of
genome leads to a deeper understanding of gene regulation.       other genes is required for a similar effect, suggesting the
There are methods to simultaneously detect combinations of       sharp transition in cellular behavior at gene-specific expres-
RNA expression and DNA methylation [55], chrom-                  sion thresholds [72]. Replogle et al. reported direct capture
atin accessibility, DNA methylation, and RNA expre-              Perturb-seq, a method in which expressed sgRNAs are
ssion [56–58], chromatin accessibility and RNA expression        sequenced together with single-cell transcriptomes, and
[59–61], protein–DNA interactions and RNA expression             allowed pooled single-cell CRISPR screens to be paired
[62, 63], and high-order chromatin structure and RNA             easily with combinatorial perturbation libraries, improving
expression [64]. Argelaguet et al. performed single-cell         the efficacy of CRISPRi and CRISPRa [73].
nucleosome, methylation, and transcriptome sequencing of            Multiple perturbations with single-cell readout has
1105 cells from the onset of gastrulation in mouse embryos       been developed to analyze epigenetic regulation [74],
[58]. Cells committed to the mesoderm and endoderm               enhancer–promoter interactions [75], protein expression
undergo widespread coordinated epigenetic rearrangements         [76], and morphological and phenotypical assessments [77].
at enhancers, which are driven by 10–11 translocation-           Rubin et al. developed the Perturb-assay for transposase-
mediated demethylation and an accompanying increase of           accessible chromatin (ATAC) to detect gRNA information
chromatin accessibility. By contrast, the DNA methylation        and chromatin accessibility simultaneously, using it to
and chromatin accessibility landscape of ectodermal cells is     assess the synergistic effects of various transcription factors
already established in the early epiblast. Mateo et al.          and epigenomic regulators on epigenomic regulation [74].
established optical reconstruction of chromatin architecture     Gasperini et al. generated a gRNA library targeting 5920
(ORCA), a method that can accurately detect the positions        enhancer regions in K562 cells, performed CRISPR/Cas9-
of DNA and RNA using array-derived oligonucleotide               mediated perturbations followed by single-cell RNA-seq,
probes in the nucleus [64]. ORCA analysis of Drosophila          and identified 664 enhancer–promoter interaction pairs [75].
embryos identified cell-type-specific physical borders             By using targeted in situ sequencing of perturbations,
between active and Polycomb-repressed DNA, and                   Feldman et al. integrated CRISPRi with optical assessment
Polycomb-independent borders. Deletion of the Polycomb-          [77]. By screening a set of 952 genes for involvement in
independent borders leads to ectopic contacts between            NF-κB signaling by imaging the nuclear translocation of
enhancers and promoters, resulting in aberrant gene              RelA (p65), they identified the importance of Mediator
expression and developmental defects. Katzenelenbogen            complex subunits such as MED12 and MED24 in regula-
et al. developed intracellular staining and sequencing (i.e.,    tion of the duration of p65 nuclear retention.
INs-seq) that enables simultaneous detection of the intra-
cellular signaling and protein state as well as the cellular     Immunoprofiling
transcriptional profiles, and identified Arg1+ Trem2+ reg-
ulatory myeloid cells, which control tumor growth [65].          The diversity of the vertebrate adaptive immune system is
                                                                 based on somatic rearrangements of V(D)J genes encoding
                                                                 the T-cell receptor (TCR) α and β chains; therefore,
Multiple perturbations with single-cell                          simultaneous analysis of TCR sequence (clonality) and
readout                                                          gene expression from individual cells provides a deeper
                                                                 understanding of molecular behavior in the adaptive
A combination of CRISPR/Cas9-based genetic screening and         immune system. By integrating single-cell transcriptomes
single-cell omics analysis enables comprehensive and             with clonal information during the development of the
detailed functional analyses [66–70]. Norman et al. integrated   human thymus, Park et al. identified a strong bias in V(D)J
not only CRISPR interference (CRISPRi) but also CRISPR           usage shaped by recombination and multiple rounds of
activation (CRISPRa) with single-cell RNA-seq to present an      selection, including a TCRα V-J bias for CD8+ T cells [78].
analytical framework for interpreting high-dimensional           Through performing single-cell RNA and TCR sequencing
landscapes of cell states, and enabled the ordering of reg-      of tumor and normal tissues and peripheral blood in patients
ulatory pathways, classification of genetic interactions, and     with different types of cancer, Wu et al. found that patients
mechanistic elucidation of synergistic interactions, including   who show clonal expansion of effector-like T cells in tumor
the cooperative function of CBL and CNN1 for driving ery-        tissue as well as in peripheral blood respond well to anti-
throid differentiation [71]. By titrating expression using       PDL1 therapy [79]. Gate et al. integrated single-cell RNA-
CRISPRi and a series of single-guide RNAs (sgRNAs) in            seq with TCR-seq of peripheral blood mononuclear cells
human myeloid leukemia K562 cells, Jost et al. showed that       and cerebrospinal fluid from patients with Alzheimer’s
a reduction in the mRNA levels of HSPA5 and GATA1 by             disease and identified an association between clonally
S. Nomura
expanded CD8+ T effector memory CD45RA+ cells and and systemic symptoms and identified JAK-STAT pathway
disease severity [80]. The machine learning algorithm activation in memory CD4+ cells in which DNA from
grouping of lymphocyte interactions by paratope hotspots human herpesvirus 6b is detected [91]. They also demon-
[81] and cloning and peptide screens demonstrated the strated that tofacitinib, a JAK-STAT pathway inhibitor,
specificity of clonally expanded TCRs to two separate suppresses T-cell proliferation. Reyes et al. conducted
Epstein–Barr virus antigens. Oh et al. conducted single-cell single-cell RNA-seq to profile peripheral blood mononuclear
RNA and paired TCR sequencing of 30,604 T cells from cells and dendritic cells from patients with sepsis and
seven patients with bladder cancer and found multiple identified a unique subset of CD14+ cells in which FOS-Jun,
cytotoxic CD4+ T cell states that are clonally expanded PU.1, and CEBP are activated to regulate immune-related
[82]. These CD4+ T cells can kill autologous tumors in an gene expression [92]. Smillie et al. generated a single-cell
MHC class II-dependent manner and are suppressed by atlas of the colonic mucosa from patients with ulcerative
regulatory T cells. A gene signature of cytotoxic CD4+ colitis, identified IL13RA2+ IL11+ inflammatory fibroblasts
T cells predicted the clinical response of patients with as being associated with resistance to anti-TNF treatment,
metastatic bladder cancer treated with anti-PD-L1. and deployed single-cell co-expression analysis to highlight
Stoeckius et al. developed cellular indexing of tran- putative causal genes for inflammatory bowel disease [93].
scriptomes and epitopes by sequencing (CITE-seq), a By combining single-cell RNA sequencing with spatial
method in which oligonucleotide-labeled antibodies are used transcriptomics and single-cell pathology analysis, Ji et al.
to measure the expression levels of surface proteins, which is defined the cellular composition and architecture of cuta-
essential for immunoprofiling [83]. Granja et al. integrated neous squamous cell carcinoma and identified a tumor-
CITE-seq with single-cell ATAC-seq of leukemia cells from specific keratinocyte population that localized to a fibro-
patients with mixed-phenotype acute leukemia and showed vascular niche [94]. They also used in vivo CRISPR screens
that CD69 activation, regulated by RUNX1, is associated to identify essential roles for specific tumor subpopulation-
with poor prognosis [84]. Mimitou et al. established enriched gene networks in tumorigenesis.
expanded CRISPR-compatible CITE-seq, in which CITE- Further utilization of single-cell genomics analysis using
seq was combined with a cell hashing method for multi- clinical samples to dissect pathology is advancing, but the
plexing and double detection [85], 5′ capture-based cDNA importance of bulk sample analysis, which does not require
library generation for clonal analysis, and a system for the specialized equipment and rigorous cell isolation and
direct and robust capture of sgRNAs, enabling the simulta- enables the processing of many samples, will be main-
neous analysis of RNA expression, protein expression, tained. There are algorithms to characterize cell-type com-
clonality, perturbation, and cell labeling [86]. position across subjects from bulk RNA-seq data using
single-cell RNA-seq profiles as references [95–97]. Wang
Clinical application and future perspectives et al. developed multi-subject single-cell deconvolution to
characterize cell-type composition from bulk RNA-seq data
Single-cell genomics has been utilized for delineating the of the kidney and revealed that the proportion of distal
molecular behavior of rare clinical samples and their rela- convoluted tubule cells increases with disease progression
tionship with patients’ phenotypes [87]. Velmeshev et al. [95]. By using single-cell RNA-seq profiles to deconvolute
used single-nucleus RNA-seq of cortical tissue from expression data from the Genotype-Tissue Expression
patients with autism and found that the synaptic signaling of (GTEx) project, Donovan et al. discovered cell-type-
upper-layer excitatory neurons is affected in autism and that specific expression quantitative trait loci [97].
dysregulation of specific groups of genes in cortico-cortical The batch effect, which is caused by differences in the
projection neurons correlates with clinical severity [88]. The conditions of sample collection and preservation, the effi-
causality of these genes was validated by large-scale exome ciency of cDNA library synthesis, or the number of
sequencing [89]. Mathys et al. analyzed single-nucleus sequencing reads, should be reduced as much as possible to
transcriptomes from the prefrontal cortex of patients with integrate multiple datasets for large-scale single-cell geno-
varying degrees of Alzheimer’s disease pathology, high- mics analysis. Data integration algorithms such as LIGER
lighting myelination-related genes as pathogenic, and [98], Seurat v3 [99], Scanorama [100], and Harmony [101]
revealed that the disease-associated changes emerge early in have been developed and widely used to integrate not only
pathological progression and are highly cell-type-specific, multiple single-cell RNA-seq datasets but also single-cell
whereas genes upregulated at the late phase are common RNA-seq datasets and single-cell epigenomic datasets (e.g.,
across cell types and involved in the global stress response ATAC and DNA methylation) or spatial omics datasets.
[90]. Kim et al. performed single-cell RNA-seq on skin and In the near future, the number of studies integrating
blood samples from a patient with refractory drug-induced single-cell genomics with deep phenotyping [102] or
hypersensitivity syndrome/drug reaction with eosinophilia assessing/predicting drug responses with single-cellSingle-cell genomics to understand disease pathogenesis
genomics will increase [103–105]. After confirming the pathophysiology. In the near future, the integration of
conservation of the myeloid subsets in human and mouse multidimensional datasets obtained through single-cell
colorectal cancer, Zhang et al. used single-cell RNA-seq to genomics approaches will have a major impact on biolo-
show that anti-CSF1R treatment preferentially depletes gical research and clinical pathology. I fully expect that the
macrophages with an inflammatory signature, but spares implementation and expansion of single-cell genomics will
macrophage populations that express pro-angiogenic/ lead to vast improvements in the diagnosis, stratification,
tumorigenic genes, and that CD40 agonist treatment pre- and treatment of patients worldwide.
ferentially activates a specific dendritic cell population and
expands Th1-like and CD8+ memory T cells [106]. Sri- Acknowledgements This work was supported by a Grant-in-Aid for
Scientific Research (B) and grants from the Japan Foundation for
vatsan et al. used a sample labeling (hashing) strategy that
Applied Enzymology, SENSHIN Medical Research Foundation,
relies on labeling nuclei with unmodified single strand DNA KANAE Foundation for the Promotion of Medical Science, MSD Life
oligonucleotides to develop single-cell combinatorial Science Foundation, Tokyo Biomedical Research Foundation, Astellas
indexing and applied it to high-throughput screens on three Foundation for Research on Metabolic Disorders, Novartis Foundation
(Japan) for the Promotion of Science, the Japanese Circulation Society,
cancer cell lines [107]. They profiled 649,340 single-cell
Takeda Science Foundation, and AMED (JP20gm0810013,
transcriptomes across 4608 independent samples in one JP20ek0109440, JP20ek0109487, JP20ek0109406, JP20km0405209,
experiment and identified histone deacetylase inhibitors as JP20bm0704026, JP20gm6210010, JP20ek0210141, JP19bm0804010).
inducers of an acetyl-CoA-deprived state.
Histone modifications and alternative splicing are critical Compliance with ethical standards
for transcriptional regulation; therefore, the development of
methods to analyze them quantitatively at single-cell reso- Conflict of interest The author declare no conflict of interets.
lution will lead to a deeper understanding of the molecular
Publisher’s note Springer Nature remains neutral with regard to
mechanisms underlying transcriptional regulation in clinical jurisdictional claims in published maps and institutional affiliations.
samples. Henikoff and colleagues developed cleavage under
targets and release using nuclease, which is an epigenomic Open Access This article is licensed under a Creative Commons
profiling strategy in which antibody-targeted controlled Attribution 4.0 International License, which permits use, sharing,
cleavage by micrococcal nuclease releases specific adaptation, distribution and reproduction in any medium or format, as
long as you give appropriate credit to the original author(s) and the
protein–DNA complexes into the supernatant for sequen- source, provide a link to the Creative Commons license, and indicate if
cing, and reduced the number of cells required for epige- changes were made. The images or other third party material in this
nomic analysis [108, 109]. Hainer et al. applied this method article are included in the article’s Creative Commons license, unless
to nuclear samples and performed genome-wide analyses of indicated otherwise in a credit line to the material. If material is not
included in the article’s Creative Commons license and your intended
histone modifications and transcription factor binding at use is not permitted by statutory regulation or exceeds the permitted
single-cell resolution [110]. By using a protein A-Tn5 use, you will need to obtain permission directly from the copyright
transposase fusion protein, Henikoff and colleagues devel- holder. To view a copy of this license, visit http://creativecommons.
oped cleavage under targets and tagmentation, in which org/licenses/by/4.0/.
antibody-targeted controlled tethering of transposase is used
to generate fragment libraries, and enabled epigenomic
profiling of single cells [111]. Recently, Hagemann-Jensen References
et al. developed Smart-seq3, which combines full-length
1. See K, Tan WLW, Lim EH, et al. Single cardiomyocyte nuclear
transcriptome coverage with a 5′ unique molecular identifier transcriptomes reveal a lincRNA-regulated de-differentiation and
RNA counting strategy, enabling the reconstruction of cell cycle stress-response in vivo. Nat Commun. 2017;8:225.
thousands of RNA molecules per cell in silico [112]. Smart- https://doi.org/10.1038/s41467-017-00319-8.
seq3 has greatly increased sensitivity compared to Smart- 2. Picelli S, Björklund ÅK, Faridani OR, Sagasser S, Winberg G,
Sandberg R. Smart-seq2 for sensitive full-length transcriptome
seq2 and reconstructed isoform-specific RNA molecules, profiling in single cells. Nat Methods. 2013;10:1096–8. https://
providing the opportunity to investigate isoform-level RNA doi.org/10.1038/nmeth.2639.
quantification at the single-cell level. 3. Picelli S, Faridani OR, Björklund AK, Winberg G, Sagasser S,
Sandberg R. Full-length RNA-seq from single cells using Smart-
seq2. Nat Protoc. 2014;9:171–81. https://doi.org/10.1038/nprot.
2014.006.
Conclusion 4. Nomura S, Satoh M, Fujita T, et al. Cardiomyocyte gene pro-
grams encoding morphological and functional signatures in
As I have summarized in this review, single-cell genomics cardiac hypertrophy and failure. Nat Commun. 2018;9:4435.
https://doi.org/10.1038/s41467-018-06639-7.
has been combined with a variety of technologies and has 5. Langfelder P, Horvath S. WGCNA: an R package for weighted
uncovered hidden molecular mechanisms in several biolo- correlation network analysis. BMC Bioinforma. 2008;9:559.
gical phenomena, including development, physiology, and https://doi.org/10.1186/1471-2105-9-559.S. Nomura
6. Qiu X, Mao Q, Tang Y, et al. Reversed graph embedding imaging. Cell. 2018;174:968–81.e15. https://doi.org/10.1016/j.
resolves complex single-cell trajectories. Nat Methods. cell.2018.07.010.
2017;14:979–82. https://doi.org/10.1038/nmeth.4402. 24. Schürch CM, Bhate SS, Barlow GL, et al. Coordinated cellular
7. Wang F, Flanagan J, Su N, et al. RNAscope: a novel in situ RNA neighborhoods orchestrate antitumoral immunity at the colorectal
analysis platform for formalin-fixed, paraffin-embedded tissues. J cancer invasive front. Cell. 2020;S0092-8674:30870–9. https://
Mol Diagn 2012;14:22–9. https://doi.org/10.1016/j.jmoldx.2011. doi.org/10.1016/j.cell.2020.07.005.
08.002. 25. Jackson HW, Fischer JR, Zanotelli VRT, et al. The single-cell
8. Satoh M, Nomura S, Harada M, et al. High-throughput single- pathology landscape of breast cancer. Nature. 2020;578:615–20.
molecule RNA imaging analysis reveals heterogeneous responses https://doi.org/10.1038/s41586-019-1876-x.
of cardiomyocytes to hemodynamic overload. J Mol Cell Cardiol. 26. Rodriques SG, Stickels RR, Goeva A, et al. Slide-seq: a scalable
2019;128:77–89. https://doi.org/10.1016/j.yjmcc.2018.12.018. technology for measuring genome-wide expression at high spa-
9. Ko T, Fujita K, Nomura S, et al. Quantification of DNA damage tial resolution. Science. 2019;363:1463–7. https://doi.org/10.
in heart tissue as a novel prediction tool for therapeutic prognosis 1126/science.aaw1219.
of patients with dilated cardiomyopathy. JACC Basic Transl Sci. 27. Ståhl PL, Salmén F, Vickovic S, et al. Visualization and analysis
2019;4:670–80. https://doi.org/10.1016/j.jacbts.2019.05.010. of gene expression in tissue sections by spatial transcriptomics.
10. Martini E, Kunderfranco P, Peano C, et al. Single-cell Science. 2016;353:78–82. https://doi.org/10.1126/science.aa
sequencing of mouse heart immune infiltrate in pressure f2403.
overload-driven heart failure reveals extent of immune activa- 28. Asp M, Giacomello S, Larsson L, et al. A spatiotemporal organ-
tion. Circulation. 2019;140:2089–107. https://doi.org/10.1161/ wide gene expression and cell atlas of the developing human
CIRCULATIONAHA.119.041694. heart. Cell. 2019;179:1647–60.e19. https://doi.org/10.1016/j.cell.
11. Tucker NR, Chaffin M, Fleming SJ, et al. Transcriptional and 2019.11.025.
Cellular Diversity of the Human Heart. Circulation. 2020. https:// 29. Ueda HR, Ertürk A, Chung K, et al. Tissue clearing and its
doi.org/10.1161/CIRCULATIONAHA.119.045401. applications in neuroscience. Nat Rev Neurosci. 2020;21:61–79.
12. Wang L, Yu P, Zhou B, et al. Single-cell reconstruction of the https://doi.org/10.1038/s41583-019-0250-1.
adult human heart during heart failure and recovery reveals the 30. Li W, Germain RN, Gerner MY. High-dimensional cell-level
cellular landscape underlying cardiac function. Nat Cell Biol. analysis of tissues with Ce3D multiplex volume imaging. Nat
2020;22:108–19. https://doi.org/10.1038/s41556-019-0446-7. Protoc. 2019;14:1708–33. https://doi.org/10.1038/s41596-019-
13. Cohen M, Giladi A, Gorki AD, et al. Lung single-cell signaling 0156-4.
interaction map reveals basophil role in macrophage imprinting. 31. Trapnell C, Cacchiarelli D, Grimsby J, et al. The dynamics and
Cell. 2018;175:1031–44.e18. https://doi.org/10.1016/j.cell.2018. regulators of cell fate decisions are revealed by pseudotemporal
09.009. ordering of single cells. Nat Biotechnol. 2014;32:381–6. https://
14. Vento-Tormo R, Efremova M, Botting RA, et al. Single-cell doi.org/10.1038/nbt.2859.
reconstruction of the early maternal-fetal interface in humans. 32. Cao J, Spielmann M, Qiu X, et al. The single-cell transcriptional
Nature. 2018;563:347–53. https://doi.org/10.1038/s41586-018- landscape of mammalian organogenesis. Nature.
0698-6. 2019;566:496–502. https://doi.org/10.1038/s41586-019-0969-x.
15. Efremova M, Vento-Tormo M, Teichmann SA, Vento-Tormo R. 33. Packer JS, Zhu Q, Huynh C, et al. A lineage-resolved molecular
CellPhoneDB: inferring cell-cell communication from combined atlas of C. elegans embryogenesis at single-cell resolution. Sci-
expression of multi-subunit ligand-receptor complexes. Nat Protoc. ence. 2019;365:eaax1971. https://doi.org/10.1126/science.aa
2020;15:1484–506. https://doi.org/10.1038/s41596-020-0292-x. x1971.
16. Giladi A, Cohen M, Medaglia C, et al. Dissecting cellular 34. McInnes, L, Healy, J & Melville, J UMAP: Uniform manifold
crosstalk by sequencing physically interacting cells. Nat Bio- approximation and projection for dimension reduction. Stat.
technol. 2020;38:629–37. https://doi.org/10.1038/s41587-020- Mach. Learn. arXiv preprint arXiv:1802.03426. 2018.
0442-2. 35. Dorrity MW, Saunders LM, Queitsch C, Fields S, Trapnell C.
17. Ma S, Sun S, Geng L, et al. Caloric restriction reprograms the Dimensionality reduction by UMAP to visualize physical and
single-cell transcriptional landscape of rattus norvegicus aging. genetic interactions. Nat Commun. 2020;11:1537. https://doi.
Cell. 2020;180:984–1001.e22. https://doi.org/10.1016/j.cell. org/10.1038/s41467-020-15351-4.
2020.02.008. 36. La Manno G, Soldatov R, Zeisel A, et al. RNA velocity of single
18. Aibar S, González-Blas CB, Moerman T, et al. SCENIC: single- cells. Nature 2018;560:494–8. https://doi.org/10.1038/s41586-
cell regulatory network inference and clustering. Nat Methods. 018-0414-6.
2017;14:1083–6. https://doi.org/10.1038/nmeth.4463. 37. Wagner DE, Klein AM. Lineage tracing meets single-cell omics:
19. Femino AM, Fay FS, Fogarty K, Singer RH. Visualization of opportunities and challenges. Nat Rev Genet. 2020;10. https://
single RNA transcripts in situ. Science. 1998;280:585–90. doi.org/10.1038/s41576-020-0223-2.
https://doi.org/10.1126/science.280.5363.585. 38. Biddy BA, Kong W, Kamimoto K, et al. Single-cell mapping of
20. Eng CL, Lawson M, Zhu Q, et al. Transcriptome-scale super- lineage and identity in direct reprogramming. Nature.
resolved imaging in tissues by RNA seqFISH. Nature. 2018;564:219–24. https://doi.org/10.1038/s41586-018-0744-4.
2019;568:235–9. https://doi.org/10.1038/s41586-019-1049-y. 39. Weinreb C, Rodriguez-Fraticelli A, Camargo FD, Klein AM.
21. Su JH, Zheng P, Kinrot SS, Bintu B, Zhuang X. Genome-scale Lineage tracing on transcriptional landscapes links state to fate
imaging of the 3D organization and transcriptional activity of during differentiation. Science. 2020;367:eaaw3381. https://doi.
chromatin. Cell. 2020;S0092-8674:30940–5. https://doi.org/10. org/10.1126/science.aaw3381.
1016/j.cell.2020.07.032. 40. Pei W, Feyerabend TB, Rössler J, et al. Polylox barcoding
22. Mayr U, Serra D, Liberali P. Exploring single cells in space and reveals haematopoietic stem cell fates realized in vivo. Nature.
time during tissue development, homeostasis and regeneration. 2017;548:456–60. https://doi.org/10.1038/nature23653.
Development. 2019;146:dev176727. https://doi.org/10.1242/dev. 41. Pei W, Wang X, Rössler J, Feyerabend TB, Höfer T, Rodewald
176727. HR. Using Cre-recombinase-driven Polylox barcoding for
23. Goltsev Y, Samusik N, Kennedy-Darling J, et al. Deep profiling in vivo fate mapping in mice. Nat Protoc. 2019;14:1820–40.
of mouse splenic architecture with CODEX multiplexed https://doi.org/10.1038/s41596-019-0163-5.Single-cell genomics to understand disease pathogenesis
42. Pei W, Shang F, Wang X, et al. Resolving fate and transcriptome 61. Chen S, Lake BB, Zhang K. High-throughput sequencing of the
of hematopoietic stem cell clones. bioRxiv. 2020. https://doi.org/ transcriptome and chromatin accessibility in the same cell. Nat
10.1101/2020.03.25.008433. Biotechnol. 2019;37:1452–7. https://doi.org/10.1038/s41587-
43. Chan MM, Smith ZD, Grosswendt S, et al. Molecular recording 019-0290-0.
of mammalian embryogenesis. Nature. 2019;570:77–82. https:// 62. Rooijers K, Markodimitraki CM, Rang FJ, et al. Simultaneous
doi.org/10.1038/s41586-019-1184-5. quantification of protein-DNA contacts and transcriptomes in
44. Kalhor R, Kalhor K, Mejia L, et al. Developmental barcoding of single cells. Nat Biotechnol. 2019;37:766–72. https://doi.org/10.
whole mouse via homing CRISPR. Science. 2018;361:eaat9804. 1038/s41587-019-0150-y.
https://doi.org/10.1126/science.aat9804. 63. Markodimitraki CM, Rang FJ, Rooijers K, et al. Simultaneous
45. Alemany A, Florescu M, Baron CS, Peterson-Maduro J, van quantification of protein-DNA interactions and transcriptomes in
Oudenaarden A. Whole-organism clone tracing using single-cell single cells with scDam&T-seq. Nat Protoc. 2020;15:1922–53.
sequencing. Nature. 2018;556:108–12. https://doi.org/10.1038/ https://doi.org/10.1038/s41596-020-0314-8.
nature25969. 64. Mateo LJ, Murphy SE, Hafner A, Cinquini IS, Walker CA,
46. Bowling S, Sritharan D, Osorio FG, et al. An engineered Boettiger AN. Visualizing DNA folding and RNA in embryos at
CRISPR-Cas9 mouse line for simultaneous readout of lineage single-cell resolution. Nature. 2019;568:49–54. https://doi.org/
histories and gene expression profiles in single cells. Cell. 2020; 10.1038/s41586-019-1035-4.
S0092-8674:30554–7. https://doi.org/10.1016/j.cell.2020.04.048. 65. Katzenelenbogen Y, Sheban F, Yalin A, et al. Coupled scRNA-
47. Baron CS, van Oudenaarden A. Unravelling cellular relation- Seq and intracellular protein activity reveal an immunosuppres-
ships during development and regeneration using genetic lineage sive role of TREM2 in cancer. Cell. 2020;182:872–85.e19.
tracing. Nat Rev Mol Cell Biol. 2019;20:753–65. https://doi.org/ https://doi.org/10.1016/j.cell.2020.06.032.
10.1038/s41580-019-0186-3. 66. Dixit A, Parnas O, Li B, et al. Perturb-seq: dissecting molecular
48. Frieda KL, Linton JM, Hormoz S, et al. Synthetic recording and circuits with scalable single-cell rna profiling of pooled genetic
in situ readout of lineage information in single cells. Nature. screens. Cell. 2016;167:1853–66.e17. https://doi.org/10.1016/j.
2017;541:107–11. https://doi.org/10.1038/nature20777. cell.2016.11.038.
49. Macaulay IC, Haerty W, Kumar P, et al. G&T-seq: parallel 67. Adamson B, Norman TM, Jost M, et al. A multiplexed single-
sequencing of single-cell genomes and transcriptomes. Nat cell CRISPR screening platform enables systematic dissection of
Methods. 2015;12:519–22. https://doi.org/10.1038/nmeth.3370. the unfolded protein response. Cell. 2016;167:1867–82.e21.
50. Macaulay IC, Teng MJ, Haerty W, Kumar P, Ponting CP, Voet https://doi.org/10.1016/j.cell.2016.11.048.
T. Separation and parallel sequencing of the genomes and tran- 68. Jaitin DA, Weiner A, Yofe I, et al. Dissecting immune circuits by
scriptomes of single cells using G&T-seq. Nat Protoc. linking CRISPR-pooled screens with single-cell RNA-seq. Cell.
2016;11:2081–103. https://doi.org/10.1038/nprot.2016.138. 2016;167:1883–96.e15. https://doi.org/10.1016/j.cell.2016.11.039.
51. Dey SS, Kester L, Spanjaard B, Bienko M, van Oudenaarden A. 69. Datlinger P, Rendeiro AF, Schmidl C, et al. Pooled CRISPR
Integrated genome and transcriptome sequencing of the same screening with single-cell transcriptome readout. Nat Methods.
cell. Nat Biotechnol. 2015;33:285–9. https://doi.org/10.1038/nbt. 2017;14:297–301. https://doi.org/10.1038/nmeth.4177.
3129. 70. Hill AJ, McFaline-Figueroa JL, Starita LM, et al. On the design
52. Liu F, Zhang Y, Zhang L, et al. Systematic comparative analysis of CRISPR-based single-cell molecular screens. Nat Methods.
of single-nucleotide variant detection methods from single-cell 2018;15:271–4. https://doi.org/10.1038/nmeth.4604.
RNA sequencing data. Genome Biol. 2019;20:242. https://doi. 71. Norman TM, Horlbeck MA, Replogle JM, et al. Exploring
org/10.1186/s13059-019-1863-4. genetic interaction manifolds constructed from rich single-cell
53. Enge M, Arda HE, Mignardi M, et al. Single-cell analysis of phenotypes. Science. 2019;365:786–93. https://doi.org/10.1126/
human pancreas reveals transcriptional signatures of aging and science.aax4438.
somatic mutation patterns. Cell. 2017;171:321–30.e14. https:// 72. Jost M, Santos DA, Saunders RA, et al. Titrating gene expression
doi.org/10.1016/j.cell.2017.09.004. using libraries of systematically attenuated CRISPR guide
54. Nam AS, Kim KT, Chaligne R, et al. Somatic mutations and cell RNAs. Nat Biotechnol. 2020;38:355–64. https://doi.org/10.
identity linked by genotyping of transcriptomes. Nature. 1038/s41587-019-0387-5.
2019;571:355–60. https://doi.org/10.1038/s41586-019-1367-0. 73. Replogle JM, Norman TM, Xu A, et al. Combinatorial single-
55. Angermueller C, Clark SJ, Lee HJ, et al. Parallel single-cell cell CRISPR screens by direct guide RNA capture and targeted
sequencing links transcriptional and epigenetic heterogeneity. Nat sequencing. Nat Biotechnol. 2020. https://doi.org/10.1038/
Methods. 2016;13:229–32. https://doi.org/10.1038/nmeth.3728. s41587-020-0470-y.
56. Pott S. Simultaneous measurement of chromatin accessibility, 74. Rubin AJ, Parker KR, Satpathy AT, et al. Coupled single-cell
DNA methylation, and nucleosome phasing in single cells. Elife. CRISPR screening and epigenomic profiling reveals causal gene
2017;6:e23203. https://doi.org/10.7554/eLife.23203. regulatory networks. Cell. 2019;176:361–76.e17. https://doi.org/
57. Clark SJ, Argelaguet R, Kapourani CA, et al. scNMT-seq 10.1016/j.cell.2018.11.022.
enables joint profiling of chromatin accessibility DNA methy- 75. Gasperini M, Hill AJ, McFaline-Figueroa JL, et al. A genome-
lation and transcription in single cells. Nat Commun. wide framework for mapping gene regulation via cellular genetic
2018;9:781. https://doi.org/10.1038/s41467-018-03149-4. screens. Cell. 2019;176:377–90.e19. https://doi.org/10.1016/j.
58. Argelaguet R, Clark SJ, Mohammed H, et al. Multi-omics pro- cell.2018.11.029.
filing of mouse gastrulation at single-cell resolution. Nature. 76. Wroblewska A, Dhainaut M, Ben-Zvi B, et al. Protein barcodes
2019;576:487–91. https://doi.org/10.1038/s41586-019-1825-8. enable high-dimensional single-cell CRISPR screens. Cell.
59. Liu L, Liu C, Quintero A, et al. Deconvolution of single-cell 2018;175:1141–55.e16. https://doi.org/10.1016/j.cell.2018.09.
multi-omics layers reveals regulatory heterogeneity. Nat Com- 022.
mun. 2019;10:470. https://doi.org/10.1038/s41467-018-08205-7. 77. Feldman D, Singh A, Schmid-Burgk JL, et al. Optical pooled
60. Zhu C, Yu M, Huang H, et al. An ultra high-throughput method screens in human cells. Cell. 2019;179:787–99.e17. https://doi.
for single-cell joint analysis of open chromatin and tran- org/10.1016/j.cell.2019.09.016.
scriptome. Nat Struct Mol Biol. 2019;26:1063–70. https://doi. 78. Park JE, Botting RA, Domínguez Conde C, et al. A cell atlas of
org/10.1038/s41594-019-0323-x. human thymic development defines T cell repertoire formation.S. Nomura
Science. 2020;367:eaay3224. https://doi.org/10.1126/science.aa 96. Frishberg A, Peshes-Yaloz N, Cohn O, et al. Cell composition
y3224. analysis of bulk genomics using single-cell data. Nat Methods.
79. Wu TD, Madireddi S, de Almeida PE, et al. Peripheral T cell 2019;16:327–32. https://doi.org/10.1038/s41592-019-0355-5.
expansion predicts tumour infiltration and clinical response. Nat- 97. Donovan MKR, D’Antonio-Chronowska A, D’Antonio M,
ure. 2020;579:274–8. https://doi.org/10.1038/s41586-020-2056-8. Frazer KA. Cellular deconvolution of GTEx tissues powers
80. Gate D, Saligrama N, Leventhal O, et al. Clonally expanded CD8 discovery of disease and cell-type associated regulatory variants.
T cells patrol the cerebrospinal fluid in Alzheimer’s disease. Nat Commun 2020;11:955. https://doi.org/10.1038/s41467-020-
Nature. 2020;577:399–404. https://doi.org/10.1038/s41586-019- 14561-0.
1895-7. 98. Welch JD, Kozareva V, Ferreira A, Vanderburg C, Martin C,
81. Glanville J, Huang H, Nau A, et al. Identifying specificity groups Macosko EZ. Single-cell multi-omic integration compares and
in the T cell receptor repertoire. Nature. 2017;547:94–8. https:// contrasts features of brain cell identity. Cell. 2019;177:1873–87.
doi.org/10.1038/nature22976. e17. https://doi.org/10.1016/j.cell.2019.05.006.
82. Oh DY, Kwek SS, Raju SS, et al. Intratumoral CD4+ T cells 99. Stuart T, Butler A, Hoffman P, et al. Comprehensive integration
mediate anti-tumor cytotoxicity in human bladder cancer. Cell. of single-cell data. Cell. 2019;177:1888–902.e21. https://doi.org/
2020;S0092-8674:30612–7. https://doi.org/10.1016/j.cell.2020. 10.1016/j.cell.2019.05.031.
05.017. 100. Hie B, Bryson B, Berger B. Efficient integration of heterogeneous
83. Stoeckius M, Hafemeister C, Stephenson W, et al. Simultaneous single-cell transcriptomes using Scanorama. Nat Biotechnol.
epitope and transcriptome measurement in single cells. Nat 2019;37:685–91. https://doi.org/10.1038/s41587-019-0113-3.
Methods. 2017;14:865–8. https://doi.org/10.1038/nmeth.4380. 101. Korsunsky I, Millard N, Fan J, et al. Fast, sensitive and accurate
84. Granja JM, Klemm S, McGinnis LM, et al. Single-cell multiomic integration of single-cell data with Harmony. Nat Methods.
analysis identifies regulatory programs in mixed-phenotype acute 2019;16:1289–96. https://doi.org/10.1038/s41592-019-0619-0.
leukemia. Nat Biotechnol. 2019;37:1458–65. https://doi.org/10. 102. Bycroft C, Freeman C, Petkova D, Band G, Elliott LT, Sharp K,
1038/s41587-019-0332-7. et al. The UK Biobank resource with deep phenotyping and
85. Stoeckius M, Zheng S, Houck-Loomis B, et al. Cell Hashing genomic data. Nature. 2018;562:203–9.
with barcoded antibodies enables multiplexing and doublet 103. Yofe I, Dahan R, Amit I. Single-cell genomic approaches for
detection for single cell genomics. Genome Biol. 2018;19:224. developing the next generation of immunotherapies. Nat Med.
https://doi.org/10.1186/s13059-018-1603-1. 2020;26:171–7.
86. Mimitou EP, Cheng A, Montalbano A, et al. Multiplexed 104. Efremova M, Vento-Tormo R, Park JE, Teichmann SA, James
detection of proteins, transcriptomes, clonotypes and CRISPR KR. Immunology in the era of single-cell technologies. Annu
perturbations in single cells. Nat Methods. 2019;16:409–12. Rev Immunol. 2020. https://doi.org/10.1146/annurev-immunol-
https://doi.org/10.1038/s41592-019-0392-0. 090419-020340.
87. Lim B, Lin Y, Navin N. Advancing cancer research and medi- 105. Rozenblatt-Rosen O, Regev A, Oberdoerffer P, et al. The human
cine with single-cell genomics. Cancer Cell. 2020;37:456–70. tumor atlas network: charting tumor transitions across space and
https://doi.org/10.1016/j.ccell.2020.03.008. time at single-cell resolution. Cell. 2020;181:236–49. https://doi.
88. Velmeshev D, Schirmer L, Jung D, et al. Single-cell genomics org/10.1016/j.cell.2020.03.053.
identifies cell type-specific molecular changes in autism. Science. 106. Zhang L, Li Z, Skrzypczynska KM, et al. Single-cell analyses
2019;364:685–9. https://doi.org/10.1126/science.aav8130. inform mechanisms of myeloid-targeted therapies in colon can-
89. Satterstrom FK, Kosmicki JA, Wang J, et al. Large-scale exome cer. Cell. 2020;181:442–59.e29. https://doi.org/10.1016/j.cell.
sequencing study implicates both developmental and functional 2020.03.048.
changes in the neurobiology of autism. Cell. 2020;180:568–84. 107. Srivatsan SR, McFaline-Figueroa JL, Ramani V, et al. Massively
e23. https://doi.org/10.1016/j.cell.2019.12.036. multiplex chemical transcriptomics at single-cell resolution.
90. Mathys H, Davila-Velderrain J, Peng Z, et al. Single-cell tran- Science. 2020;367:45–51. https://doi.org/10.1126/science.aa
scriptomic analysis of Alzheimer’s disease. Nature. x6234.
2019;570:332–7. https://doi.org/10.1038/s41586-019-1195-2. 108. Skene PJ, Henikoff S. An efficient targeted nuclease strategy for
91. Kim D, Kobayashi T, Voisin B, et al. Targeted therapy guided by high-resolution mapping of DNA binding sites. Elife. 2017;6:
single-cell transcriptomic analysis in drug-induced hypersensi- e21856. https://doi.org/10.7554/eLife.21856.
tivity syndrome: a case report. Nat Med. 2020;26:236–43. 109. Skene PJ, Henikoff JG, Henikoff S. Targeted in situ genome-
https://doi.org/10.1038/s41591-019-0733-7. wide profiling with high efficiency for low cell numbers. Nat
92. Reyes M, Filbin MR, Bhattacharyya RP, et al. An immune-cell Protoc. 2018;13:1006–19. https://doi.org/10.1038/nprot.2018.
signature of bacterial sepsis. Nat Med. 2020;26:333–40. https:// 015.
doi.org/10.1038/s41591-020-0752-4. 110. Hainer SJ, Bošković A, McCannell KN, Rando OJ, Fazzio TG.
93. Smillie CS, Biton M, Ordovas-Montanes J, et al. Intra- and inter- Profiling of pluripotency factors in single cells and early
cellular rewiring of the human colon during ulcerative colitis. Cell. embryos. Cell. 2019;177:1319–29.e11. https://doi.org/10.1016/j.
2019;178:714–30.e22. https://doi.org/10.1016/j.cell.2019.06.029. cell.2019.03.014.
94. Ji AL, Rubin AJ, Thrane K, et al. Multimodal analysis of com- 111. Kaya-Okur HS, Wu SJ, Codomo CA, et al. CUT&Tag for effi-
position and spatial architecture in human squamous cell carci- cient epigenomic profiling of small samples and single cells. Nat
noma. Cell. 2020;182:497–514.e22. https://doi.org/10.1016/j. Commun. 2019;10:1930. https://doi.org/10.1038/s41467-019-
cell.2020.05.039. 09982-5.
95. Wang X, Park J, Susztak K, Zhang NR, Li M. Bulk tissue cell 112. Hagemann-Jensen M, Ziegenhain C, Chen P, et al. Single-
type deconvolution with multi-subject single-cell expression cell RNA counting at allele and isoform resolution using Smart-
reference. Nat Commun. 2019;10:380. https://doi.org/10.1038/ seq3. Nat Biotechnol. 2020;38:708–14. https://doi.org/10.1038/
s41467-018-08023-x. s41587-020-0497-0.You can also read