Particle number concentrations and size distribution in a polluted megacity: the Delhi Aerosol Supersite study
←
→
Page content transcription
If your browser does not render page correctly, please read the page content below
Atmos. Chem. Phys., 20, 8533–8549, 2020
https://doi.org/10.5194/acp-20-8533-2020
© Author(s) 2020. This work is distributed under
the Creative Commons Attribution 4.0 License.

Particle number concentrations and size distribution in a polluted
megacity: the Delhi Aerosol Supersite study
Shahzad Gani1 , Sahil Bhandari2 , Kanan Patel2 , Sarah Seraj1 , Prashant Soni3 , Zainab Arub3 , Gazala Habib3 ,
Lea Hildebrandt Ruiz2 , and Joshua S. Apte1
1 Department of Civil, Architectural and Environmental Engineering, The University of Texas at Austin, Austin, Texas, USA
2 McKetta Department of Chemical Engineering, The University of Texas at Austin, Austin, Texas, USA
3 Department of Civil Engineering, Indian Institute of Technology Delhi, New Delhi, India

Correspondence: Joshua S. Apte (jsapte@utexas.edu) and Lea Hildebrandt Ruiz (lhr@che.utexas.edu)

Received: 2 January 2020 – Discussion started: 17 February 2020
Revised: 25 May 2020 – Accepted: 8 June 2020 – Published: 22 July 2020

Abstract. The Indian national capital, Delhi, routinely expe-      that a reduction in mass concentration, especially in winter,
riences some of the world’s highest urban particulate matter       may not produce a proportional reduction in PN concentra-
concentrations. While fine particulate matter (PM2.5 ) mass        tions. Strategies that only target accumulation mode particles
concentrations in Delhi are at least an order of magnitude         (which constitute much of the fine PM2.5 mass) may even
higher than in many western cities, the particle number (PN)       lead to an increase in the UFP concentrations as the coagula-
concentrations are not similarly elevated. Here we report on       tion sink decreases.
1.25 years of highly time-resolved particle size distribution
(PSD) data in the size range of 12–560 nm. We observed that
the large number of accumulation mode particles – that con-
stitute most of the PM2.5 mass – also contributed substan-         1   Introduction
tially to the PN concentrations. The ultrafine particle (UFP;
Dp < 100 nm) fraction of PNs was higher during the traf-           Outdoor air pollution has detrimental health effects (Pope
fic rush hours and for daytimes of warmer seasons, which           and Dockery, 2006; Schraufnagel et al., 2019a) and is re-
is consistent with traffic and nucleation events being major       sponsible for more than 4 million deaths globally every year
sources of urban UFPs. UFP concentrations were found to            (Cohen et al., 2017), resulting in substantial global and re-
be relatively lower during periods with some of the highest        gional decrements in life expectancy (Apte et al., 2018).
mass concentrations. Calculations based on measured PSDs           There has been a continued growth in megacities (population
and coagulation theory suggest UFP concentrations are sup-         > 10 million), and as of 2018 there are 47 megacities (United
pressed by a rapid coagulation sink during polluted peri-          Nations, 2018). Many of the lower-income megacities expe-
ods when large concentrations of particles in the accumu-          rience persistently severe air pollution problems, and Delhi
lation mode result in high surface area concentrations. A          (population: 28 million) routinely experiences the highest an-
smaller accumulation mode for warmer months results in             nual average fine particle mass (PM2.5 ) concentrations of any
an increased UFP fraction, likely owing to a comparatively         megacity in the world (World Health Organization, 2018).
smaller coagulation sink. We also see evidence suggestive of       In addition to aerosol mass, there is now growing evidence
nucleation which may also contribute to the increased UFP          of potential health risks associated with ultrafine particles
proportions during the warmer seasons. Even though coagu-          (UFP; Dp < 100 nm). These particles can penetrate and de-
lation does not affect mass concentrations, it can significantly   posit deep within the lungs, may enter the bloodstream, and
govern PN levels with important health and policy implica-         can reach sensitive internal organs (Yeh and Schum, 1980;
tions. Implications of a strong accumulation mode coagula-         Oberdörster et al., 2005; Salma et al., 2015; Schraufnagel
tion sink for future air quality control efforts in Delhi are      et al., 2019b). While UFPs scarcely contribute to aerosol
                                                                   mass (PM), they have been observed to dominate particle

Published by Copernicus Publications on behalf of the European Geosciences Union.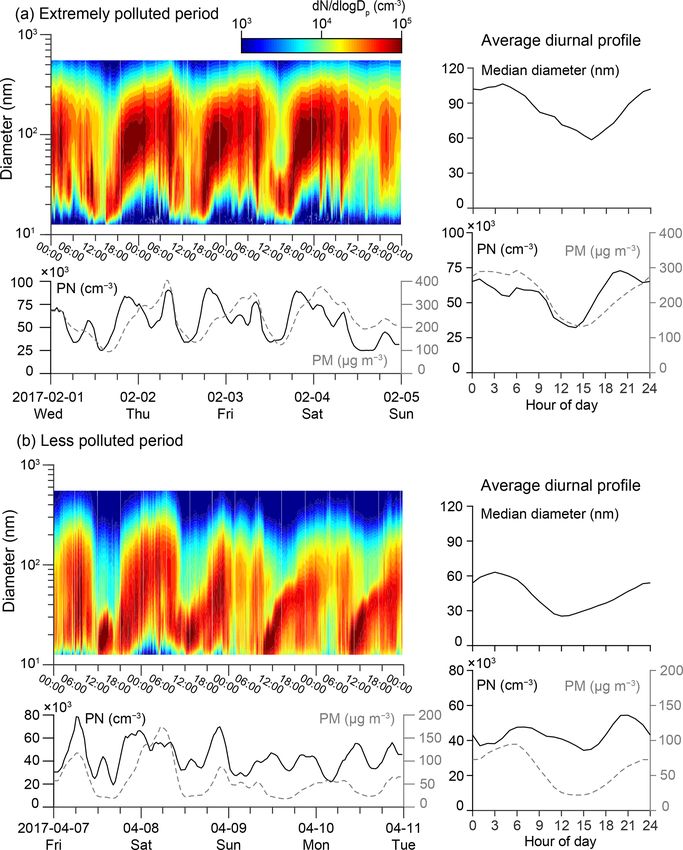
8534                            S. Gani et al.: Particle number concentrations and size distribution in a polluted megacity

number (PN) concentrations observed in urban environments
(Hussein et al., 2004; Rodríguez et al., 2007; Wu et al., 2008).
   Atmospheric particle size distributions (PSDs) are of-
ten categorized by the nucleation mode (3–25 nm), the
Aitken mode (25–100 nm), and the accumulation mode
(100–1000 nm). UFPs include both the nucleation and the
Aitken modes. Most of the PM2.5 mass is usually contributed
by the accumulation mode particles, whereas UFPs consti-
tute most of the PNs (Seinfeld and Pandis, 2006). Given
that different modes of the PSDs contribute disproportion-
ately to aerosol mass (accumulation mode for PM2.5 ) and
aerosol number (UFPs for PNs) concentrations, PN concen-
trations do not necessarily share the same spatial or tem-
poral dynamics as PM (Johansson et al., 2007; Puustinen
et al., 2007; Reche et al., 2011). The accumulation mode            Figure 1. Diurnal profiles of meteorological parameters (temper-
particles in urban environments result from a wide range of         ature, relative humidity, wind speed, wind direction, planetary
anthropogenic sources (traffic, industrial, biomass burning,        boundary layer height (PBLH), and ventilation coefficient) by sea-
etc.), natural sources (wildfires, volcanoes, deserts, etc.), and   son. Average values by season and hour of day are presented for all
chemical processing of gases and aerosol (Robinson et al.,          parameters except wind direction. The median value is presented for
2007; Zhang et al., 2007; Jimenez et al., 2009; Calvo et al.,       wind direction. Ventilation coefficient (VC) = PBLH × wind speed.
2013). However, traffic (Zhu et al., 2002; Charron and Har-
rison, 2003; Fruin et al., 2008; Wehner et al., 2009), cooking
(Saha et al., 2019; Abernethy et al., 2013), and new parti-         cities with similar sources and meteorology across the Indo-
cle formation (Brines et al., 2015; Hofman et al., 2016) are        Gangetic Plain (Kumar et al., 2017; Singh et al., 2015) and is
generally considered the only major sources of urban UFPs.          relevant for other highly polluted urban environments.
   In cities with high aerosol mass loadings (e.g., Beijing
and Delhi), coagulation scavenging can be a major sink of
                                                                    2     Methods
UFPs – the numerous but smaller UFPs are “lost” to the
fewer but larger particles that contribute most to the aerosol      2.1    Sampling site
mass (Kerminen et al., 2001; Zhang and Wexler, 2002; Kul-
mala, 2003; Kulmala and Kerminen, 2008). Specifically, co-          We installed a suite of high-time-resolution online aerosol
agulation plays a crucial role in the rapid removal of freshly      measurement instrumentation at the Indian Institute of Tech-
nucleated particles onto preexisting, larger particles (Kermi-      nology Delhi (IIT Delhi) campus in South Delhi. The instru-
nen et al., 2001; Kulmala, 2003). Short-term studies from           ments were located on the top floor of a four-story building,
Delhi have observed coagulation as a major sink for UFPs            and the nearest source of local emissions is an arterial road
(Mönkkönen et al., 2004a, 2005), similar to observations            located 150 m away from the building. Delhi experiences
from polluted cities in the USA in the 1970s (Husar et al.,         a wide range of meteorological conditions with large diur-
1972; Whitby et al., 1972; Willeke and Whitby, 1975) and            nal and seasonal variations in temperature, relative humidity
contemporary polluted cities in China (Cai and Jiang, 2017;         (RH), and wind speed, among other parameters (Fig. 1). Fur-
Peng et al., 2014; Wu et al., 2008). Polluted megacities such       thermore, shallow inversion layers also occur frequently, es-
as Delhi often experience aerosol mass concentrations that          pecially for cooler periods. The prevailing wind direction in
are an order of magnitude higher than those experienced in          Delhi is from the northwest, implying that the air we sampled
cities in high-income countries (Pant et al., 2015; Jaiprakash      would have traversed through ∼ 20 km of industrial, com-
et al., 2017; Gani et al., 2019), yet PN concentrations are not     mercial, and residential areas in Delhi before reaching our
high in similar proportions (Mönkkönen et al., 2004b; Apte          site. We discussed the meteorology of Delhi in further detail
et al., 2011).                                                      in an earlier publication (Gani et al., 2019).
   As part of the Delhi Aerosol Supersite (DAS) study, we
investigated Delhi's aerosol chemical composition and its           2.2    Instrumentation and setup
sources (Gani et al., 2019; Bhandari et al., 2020). Here we
use long-term observations from Delhi to present seasonal           We measured PSDs using a scanning mobility particle
and diurnal profiles of PSDs in this polluted megacity. We          sizer (SMPS; TSI, Shoreview, Minnesota, USA) consist-
also provide insights into the phenomena – such as coagu-           ing of an electrostatic classifier (model 3080; TSI, Shore-
lation – that influence PSDs in Delhi and interpret their im-       view, Minnesota, USA), a differential mobility analyzer
plications for future policy measures. This study has the po-       (DMA; model 3081; TSI, Shoreview, Minnesota, USA),
tential to help understand processes that drive PSDs in other       an x-ray aerosol neutralizer (model 3088; TSI, Shoreview,

Atmos. Chem. Phys., 20, 8533–8549, 2020                                               https://doi.org/10.5194/acp-20-8533-2020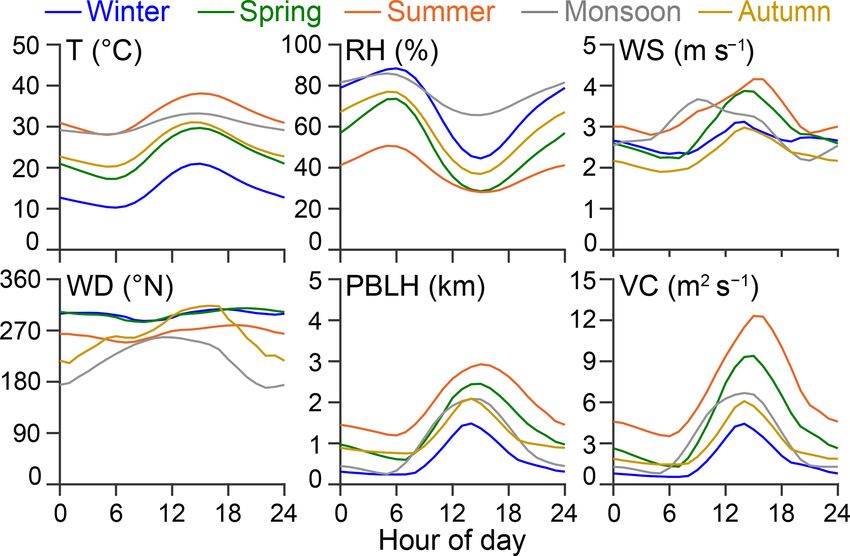
S. Gani et al.: Particle number concentrations and size distribution in a polluted megacity                                   8535

Minnesota, USA), and a water-based condensation parti-               cles of any size greater than that particle using the technique
cle counter (CPC; model 3785; TSI, Shoreview, Minnesota,             of Westerdahl et al. (2009). We calculate condensation sink
USA). Chemical composition of nonrefractory PM1 (NR–                 (CS) for vapor condensing on the aerosol distribution fol-
PM1 ) was obtained using an aerosol chemical speciation              lowing Kulmala et al. (2001, 1998) and the growth rate (GR)
monitor (ACSM; Aerodyne Research, Inc., Billerica, Mas-              following Kulmala et al. (2012).
sachusetts, USA), and black carbon (BC) was measured us-
                                                                                     1
ing a multichannel Aethalometer (model AE33; Magee Sci-              τcoag,i = P            ,                                   (1)
entific, Berkeley, California, USA). The inlet had a PM2.5 cy-                      Ki,j Nj
                                                                              i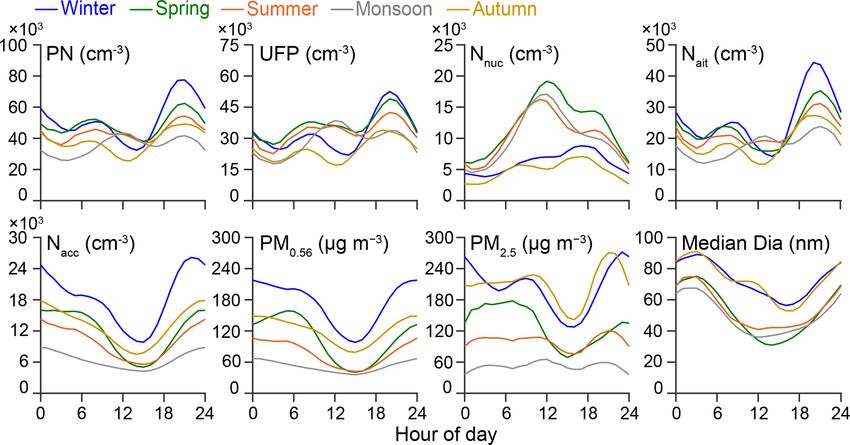
8536 S. Gani et al.: Particle number concentrations and size distribution in a polluted megacity
Figure 3. Average diurnal and seasonal variations for PNs, UFPs
(Dp < 100 nm), Nnuc (Dp < 25 nm), Nait (25 < Dp < 100 nm),
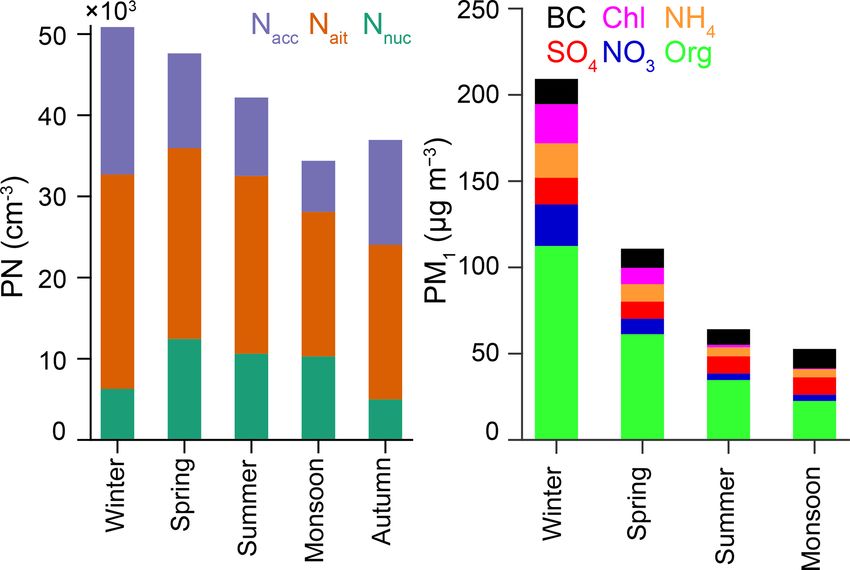
Figure 2. Average particle number (PN) levels for each sea- Nacc (Dp > 100 nm), and median particle diameter. These averages
son by mode. The modes are based on scanning mobility par- are based on the observed SMPS data (12 < Dp < 560 nm). Also
ticle sizer (SMPS) observations, namely nucleation (12 < Dp < included are the average diurnal and seasonal variations of the mass
25 nm), Aitken (25 < Dp < 100 nm), and accumulation (100 < concentrations estimated from the observed SMPS data (PM0.56 )
Dp < 560 nm) modes. The PM1 plot is reproduced from Gani et al. and the PM2.5 concentrations from a regulatory monitor (Delhi Pol-
(2019) to illustrate seasonal variation in aerosol mass loadings. The lution Control Committee – DPCC; Rama Krishna Puram, 3 km
PM1 species are organics (Org), chloride (Chl), ammonium (NH4 ), from our site), which were accessed from the OpenAQ Platform
nitrate (NO3 ), sulfate (SO4 ), and black carbon (BC). While we had (http://openaq.org, last access: 1 August 2019).
SMPS data for all seasons, we did not collect PM composition data
during autumn due to instrumentation (aerosol chemical speciation
monitor – ACSM) downtime. tions ranged between 32 400 and 77 500 cm−3 . The hourly
averaged winter PN levels had a morning (08:00) peak, fol-
lowed by lowest concentrations during the afternoon (14:00)
spatial variability within Delhi. UFP concentrations can be and highest concentrations during the evening (21:00).
quite variable even within a small spatial domain (Saha et al., The spring hourly averaged concentrations ranged between
2019; Puustinen et al., 2007), so it is likely that a megacity 38 100 and 62 400 cm−3 . The hourly averaged spring levels
like Delhi with diverse local sources will have strong spatial also had the morning (08:00) and evening (21:00) peaks, and
variability in PSD and PN concentrations. Future studies can the PN concentrations were lowest around 15:00. Summer
quantify this spatial variability by measuring PSDs at multi- hourly averaged concentrations ranged between 35 900 and
ple fixed sites and using techniques such as mobile monitor- 54 200 cm−3 . The hourly averaged summer levels also had
ing (e.g., Apte et al., 2017). the morning (08:00) and evening (21:00) peaks; there was
also a small peak during the midday (11:00), and the PN con-
3 Results and discussion centrations were lowest around 03:00. The monsoon hourly
PN concentrations ranged between 25 800 and 43 500 cm−3 .
3.1 Particle number and mass concentrations The monsoon PNs hourly average concentrations were low-
est during early morning (04:00) and highest during the mid-
Delhi experiences large seasonal and diurnal variations in day (12:00), followed by another peak in the evening (21:00).
aerosol mass concentrations. In Gani et al. (2019), we Autumn hourly average PN concentrations ranged between
showed that the wintertime submicron aerosol concentra- 25 500 and 49 200 cm−3 . The autumn diurnal profile had
tion was ∼ 2× higher than spring and ∼ 4× higher than the a morning (07:00) and an evening peak (21:00), with the
warmer months. In Fig. 2 we compare the seasonal changes concentrations being the lowest during the daytime (13:00).
in aerosol mass and PN concentrations. In contrast to the While hourly averaged PN concentrations for all seasons had
sharp seasonal variation in aerosol mass loadings, PN levels peaks during the morning and the evening, additional midday
had much lower variability. The average PN levels were as peaks were observed during the summer and the monsoon.
follows: winter – 52 500 cm−3 ; spring – 49 000 cm−3 ; sum- In Fig. 3 we also compare the seasonal and diurnal changes
mer – 43 400 cm−3 ; the monsoon – 35 400 cm−3 ; and autumn in PN and PM0.56 concentrations, namely number and mass
– 38 000 cm−3 . The differences in the variability of number concentrations observed from the SMPS. The SMPS-based
and mass concentrations are potentially explained by the dif- mass concentrations follow the diurnal profile similar to
ference in the sources and processes that drive their concen- those of aerosol mass loadings in Delhi (Gani et al., 2019).
trations (Sect. 1). However, PN diurnal profiles do not closely follow those
For each season, PN concentrations varied by the time of PM0.56 (campaign R 2 of the hourly averaged time series
of day (Fig. 3). In winter, average hourly PN concentra- of PNs and PM0.56 = 0.26). The low correlation of aerosol
Atmos. Chem. Phys., 20, 8533–8549, 2020 https://doi.org/10.5194/acp-20-8533-2020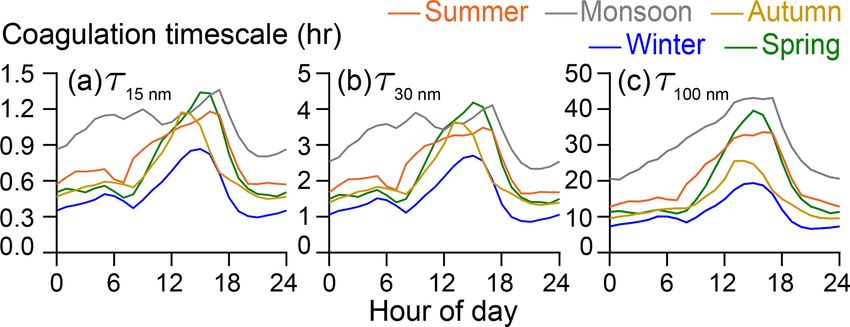
S. Gani et al.: Particle number concentrations and size distribution in a polluted megacity                                    8537

                                                                    and the median particle diameter. In Fig. 5 we present the
                                                                    stacked absolute and fractional diurnal profiles of the PN
                                                                    components for each season to illustrate the varying contri-
                                                                    bution of each size mode to the PN concentrations by season
                                                                    and time of day. Furthermore, in Table 1 we present the sum-
                                                                    mary of the daytime and nighttime averages for all seasons.
                                                                       The nucleation mode particle concentrations were highest
                                                                    (in magnitude and fraction of PNs) during the warmer peri-
                                                                    ods, when particle mass concentrations tend to be lower. The
Figure 4. Average mass concentrations of observed accumulation      average hourly Nnuc peaked around 11:00–12:00 for spring,
mode (100–560 nm) and ultrafine particles (< 100 nm) by season      summer, and the monsoon. These Nnuc peak hourly averaged
and time of day. Estimation of mass concentrations based on as-     concentrations were ∼ 18 000 cm−3 and contributed to al-
sumed particle density of 1.6 g cm−3 .
                                                                    most 40 %–50 % of the PN concentrations for these periods.
                                                                    For the nighttime during spring, summer, and the monsoon
                                                                    and for all times of day for autumn and spring, hourly aver-
number and mass is consistent with UFPs making up a large           aged Nnuc concentrations were usually less than 10 000 cm−3
fraction of the PNs (Sect. 3.2) but contributing much less          and contributed to within 10 %–20 % of the PN concentra-
to the aerosol mass compared to larger accumulation mode            tions. The low particle mass concentrations and high insola-
particles. In Fig. 4, we estimate the aerosol mass loading          tion during the daytime of warmer months act together to fa-
in the ultrafine mode and the accumulation mode particles.          vor nucleation and survival of nucleated particles (Kerminen
While PMacc generally accounted for more than 90 % of the           et al., 2018), resulting in higher Nnuc concentrations during
PM0.56 concentrations, the PMUFP fraction of PM0.56 ranged          these periods. In Sect. 3.3, we discuss the strong condensa-
between 3 % and 10 % depending on the season and time               tion and coagulation sink during extremely polluted periods
of day. The fractional PMUFP contribution to PM0.56 was             (such as winter and autumn) and its role in suppressing Nnuc
highest during the evening traffic rush hours for the sum-          concentrations.
mer and the monsoon and lowest during the nontraffic rush              The Aitken mode particle concentrations generally con-
hours of the winter and autumn. The average wintertime              stituted the largest fraction of the PN concentrations. Nait
PMUFP concentrations ranged from 2.8 µg m−3 for midday              contributed to 40 %–60 % of PN concentrations, depending
to 10.3 µg m−3 during the evening traffic. For the other sea-       on season and time of day. Nait concentrations were high-
sons, average PMUFP concentrations were in the range ∼ 2–           est during the morning and evening hours, i.e., periods with
5 µg m−3 . Overall, the mass contributions of UFPs ranged be-       lower ventilation and high vehicular traffic. The average
tween 2.1 and 10.3 µg m−3 , depending on season and time of         hourly Nait concentrations ranged from 12 000 cm−3 (mon-
day. For contrast, mass concentrations of UFPs have been            soon early morning) to 44 300 cm−3 (winter evening). The
observed to be < 3 µg m−3 in Germany (Brüggemann et al.,            hourly averaged Nait profiles for most seasons had a morn-
2009), < 2 µg m−3 in Taiwan (Cheung et al., 2016), and              ing and an evening peak. For winter, autumn, and spring, the
< 0.2 µg m−3 in California (Xue et al., 2019). Furthermore,         hourly averaged Nait concentrations were lowest during the
even if the fractional contribution to total mass in Delhi re-      midday. However, for summer and the monsoon there was
mains low (< 10 %), the absolute mass concentrations from           another peak during the midday, with the lowest levels ob-
the observed UFPs during polluted periods were nearly as            served early in the morning. The small daytime Nait peaks for
high as the PM2.5 concentrations observed in many cities in         the warmer months are consistent with nucleation mode par-
North America (∼ 8–12 µg m−3 ; Manning et al., 2018).               ticles growing to the Aitken mode (Kulmala et al., 2004). The
                                                                    Nait peaks during the morning and the evening traffic rush
3.2   Size-resolved particle concentrations                         hours are consistent with vehicular emissions contributing to
                                                                    this size range (Paasonen et al., 2016; Kumar et al., 2010).
The PN concentrations and mass loadings are driven by               Studies from other cities – especially from near-roadway
the concentrations of the individual size modes, namely nu-         sites – also observe a large fraction of the Aitken mode par-
cleation (Nnuc ), Aitken (Nait ), and accumulation (Nacc ). It      ticles in the total PN concentrations (Zhu et al., 2002; Wu
should be noted that the Nnuc , Nait , and Nacc refer to the        et al., 2008). In addition to traffic, other sources contributing
specific particle size range and not the individual lognor-         to Aitken mode particles include cooking, industrial activi-
mal modes that constitute the PSDs (Sect. 3.6). While the           ties, solid waste burning, and construction activities (Kumar
Nnuc and Nait constitute the UFP concentrations (UFP =              et al., 2013; Riffault et al., 2015; Chen et al., 2017).
Nnuc + Nait ), Nacc contributes to both the total PN concentra-        Accumulation mode particles contribute to almost all of
tions (PN = Nnuc + Nait + Nacc ) and most of the fine aerosol       the submicron aerosol mass, so it is unsurprising that the di-
mass (Seinfeld and Pandis, 2006). In Fig. 3 we present the          urnal and seasonal variation of Nacc concentrations are sim-
seasonal and diurnal variation of Nnuc , Nait , Nacc , UFPs, PNs,   ilar to those of aerosol mass concentrations (Gani et al.,

https://doi.org/10.5194/acp-20-8533-2020                                             Atmos. Chem. Phys., 20, 8533–8549, 2020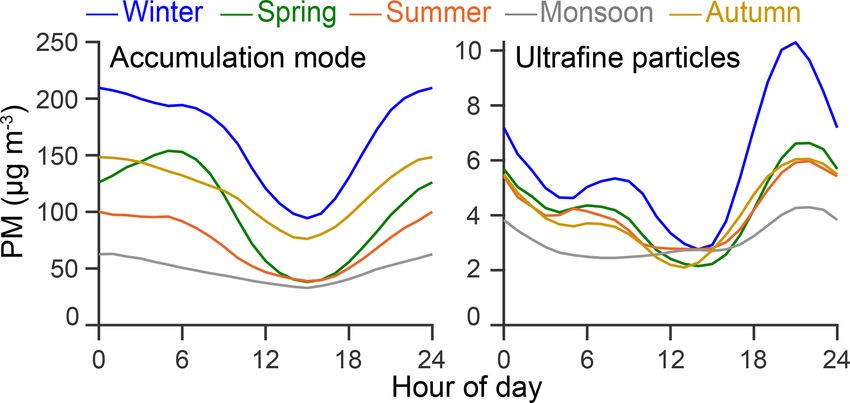
8538                                 S. Gani et al.: Particle number concentrations and size distribution in a polluted megacity

Figure 5. Stacked average absolute and fractional diurnal profiles of Nnuc (Dp < 25 nm), Nait (25 < Dp < 100 nm), and Nacc (Dp > 100 nm)
by season. These averages are based on the observed SMPS data (12 < Dp < 560 nm). We also include seasonal average concentrations for
the PM2.5 concentrations from a regulatory monitor (DPCC; Rama Krishna Puram, 3 km from our site) and mass concentrations estimated
from the observed SMPS data (PM0.56 ).

Table 1. Day and night summary of observations derived from the particle size distributions (PSDs) and meteorological parameters. Arith-
metic mean was used for all species and parameters, except wind direction (for which we used the median to estimate its central tendency).

                                                 Winter               Spring               Summer              Monsoon               Autumn
                                              Day      Night       Day      Night        Day     Night       Day      Night       Day      Night
                 a (×103 cm−3 )
               Nnuc                           7.6         5.0      15.8         9.3      13.4       7.8      13.7        6.9       6.1        3.8
                 a (×103 cm−3 )
               Nait                          21.3       31.4       19.7       27.1       19.6      24.2      18.0       17.6      17.1       20.9
                 a (×103 cm−3 )
               Nacc                          13.4       22.8        8.4       14.8        7.0      12.3       4.9        7.7       9.8       15.8
               UFPb (×103 cm−3 )             28.9       36.4       35.5       36.4       33.0      32.0      31.7       24.5      23.2       24.7
               PNc (×103 cm−3 )              42.3       59.2       43.9       51.2       40.0      44.3      36.6       32.2      33.0       40.5
               UFP/PN                        0.68       0.62       0.81       0.71       0.83      0.72      0.87       0.76      0.70       0.61
               Median Dp (nm)                63.1       81.2       38.5       64.1       43.2      63.4      39.5       58.6      63.1       80.3
               SA (×103 µm2 cm−3 )           2.04       3.24       1.25       2.12       0.99      1.65      0.74       1.06      1.51       2.21
               Vol (µm3 cm−3 )               84.1       128        47.5       81.0       34.3      58.6      25.9       37.3      62.1       87.1
               PMd0.56 (µg m−3 )              135        204       76.0        130       54.9      93.7      41.4       59.8      99.4        139
               Temperature (◦ C)               17         13         26         21         35        31       32          29       28          23
               Relative humidity (%)           60         78         42         59         34        43       71          81       49          67
               Wind speed (m s−1 )             2.7       2.6        3.2        2.6        3.8       2.9       3.4         2.5      2.5         2.1
               Wind direction (◦ N)           300        300       300        300        270       270       250         190      300         250
               PBLH (m)                       920        340      1800       1000       2400      1600      1600         460     1460         880
             a The modes are based on SMPS observations – nucleation (12 < D < 25 nm), Aitken (25 < D < 100 nm), and accumulation
                                                                              p                        p
             (100 < Dp < 560 nm) modes. b UFP = Nnuc + Nait . c PN = UFP + Nacc . d Estimation of PM0.56 concentrations were based on the volume
             concentrations observed by the SMPS and assuming particle density to be 1.6 g cm−3 .

2019). In addition to contributing to most of the fine PM                             lowest concentrations during the daytime (13:00–15:00). In
mass concentrations, Nacc in Delhi also constituted a signif-                         addition to emitting in the Aitken mode, biomass burning
icant fraction of the PN concentrations. The Nacc fraction of                         and older diesel vehicles emit in the accumulation mode as
PNs was the highest for the nighttimes of autumn and win-                             well (Chen et al., 2017; Paasonen et al., 2016; Kumar et al.,
ter (∼ 45 %) and the lowest for the daytimes of the warmer                            2010). Additionally, particles from fresh vehicular emissions
summer and monsoon seasons (∼ 15 %). The average hourly                               can grow rapidly from the Aitken mode at the tailpipe to ac-
Nacc concentrations ranged from 4200 cm−3 (monsoon mid-                               cumulation mode at roadside and ambient locations (Ning
day) to 26 200 cm−3 (winter evening). For all seasons, the                            et al., 2013). We speculate that the traffic-related particles
hourly averaged hourly Nacc concentrations had a morning                              in Delhi may become smaller as India’s vehicle fleet (espe-
(07:00) peak and an evening (20:00–22:00) peak, with the

Atmos. Chem. Phys., 20, 8533–8549, 2020                                                                    https://doi.org/10.5194/acp-20-8533-2020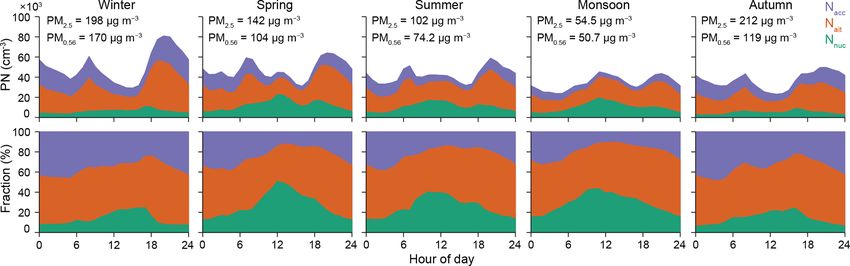
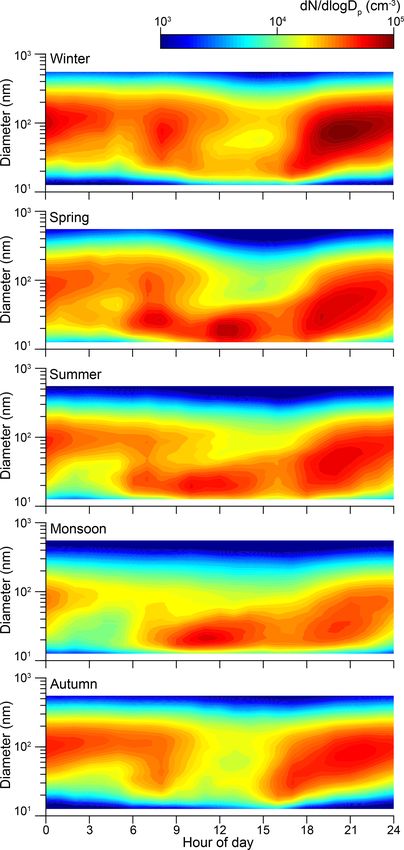
S. Gani et al.: Particle number concentrations and size distribution in a polluted megacity                                  8539

cially heavy-duty trucks) is upgraded (Guttikunda and Mo-
han, 2014; L. Zhou et al., 2020).
   Overall, UFPs contributed to ∼ 65 % of the PN concen-
trations for winter and autumn. The UFP fraction of PN
concentrations was relatively higher for spring (75 %), sum-
mer (78 %), and the monsoon (80 %). The average hourly
UFP concentrations ranged from 17 200 cm−3 (autumn mid-
day) to 52 500 cm−3 (winter evening). For all seasons, UFP
concentrations had peaks in the morning (07:00–09:00) and
the evening (19:00–21:00). For the relatively warmer sea-
sons (summer, monsoon, and spring), there were additional
peaks during the daytime (11:00–13:00). The UFP fraction
of PNs (UFP/PN) was generally the highest during the day-
time in spring, summer, and the monsoon (∼ 85 %). Con-
versely, some of the lowest UFP/PN levels were observed
during the nighttime of winter and autumn (∼ 55 %). The
UFP/PN levels observed in Delhi are generally lower than
those in cleaner cities (Hussein et al., 2004; Rodríguez et al.,
2007; Putaud et al., 2010) and even lower compared to some
other polluted ones where mass concentrations often ex-
ceeded ∼ 100 µg m−3 (Whitby et al., 1975; Laakso et al.,
2006; Wu et al., 2008). As a result of the relatively large frac-
tion of PNs being constituted by non-UFPs (Nacc ) in Delhi,
the median diameter size observed was often much larger
than those observed in these cleaner cities.
   The hourly averaged median diameters were largest during
the nighttime of winter and autumn, reaching up to ∼ 90 nm.
The smallest hourly averaged median diameters (∼ 40 nm)
were observed during the daytime of spring, summer, and the
monsoon. As with the concentrations and fractions of the PN
modes, the median diameters also had sharp seasonal and di-
urnal variations. For winter and autumn, the hourly averaged
median diameters ranged from 50 nm during the late after-
noon (16:00) to 90 nm during the late night/early morning
(03:00). The median diameters were the smallest for the rel-
atively less polluted warmer months (summer, monsoon, and
spring), with the hourly averaged median diameters ranging
from 35 nm (12:00) to 75 nm (03:00). For comparison, the
median diameter in Helsinki (calculated for ∼ 12–560 nm)            Figure 6. Heat map for particles between 12 and 560 nm averaged
was ∼ 30 nm (Hussein et al., 2004). In Los Angeles, the             for each season.
median diameters up to 150 m from a freeway (our site is
∼ 150 m from an arterial road) were < 50 nm (Zhu et al.,
2002). We found that for all seasons, the nighttime had larger      agulation scavenging during polluted periods in selectively
particles than the daytime. For winter and autumn, the av-          suppressing concentrations of smaller particles and resulting
erage median diameters were ∼ 65 nm during the day and              in an increase in the median diameter size.
∼ 80 nm during the night. For the spring, summer, and the
monsoon, the average median diameters were ∼ 40 nm dur-             3.3   Coagulation scavenging
ing the day and ∼ 65 nm during the night.
   In Fig. 6, we present the average observed PSDs evolving         The evolution of ambient particle size distributions reflects
over the day for each season as a heat map. For the spring,         the complex interplay between emissions, atmospheric dilu-
summer, and the monsoon, the average seasonal heat map              tion, and a wide range of aerosol dynamic processes includ-
indicates daytime new particle formation. However, winter           ing new particle formation, evaporation/condensation, and
and autumn had lower concentrations of the smaller particles        coagulation. In this section, we explore the role of coagu-
that are generally associated with new particle formation. In       lation scavenging in suppressing both the existing UFP con-
the following section (Sect. 3.3) we explore the role of co-        centrations and new particle formation during periods with

https://doi.org/10.5194/acp-20-8533-2020                                             Atmos. Chem. Phys., 20, 8533–8549, 2020
8540                             S. Gani et al.: Particle number concentrations and size distribution in a polluted megacity

high aerosol mass loadings corresponding to elevated Nacc            for the smaller particles. The scavenging of UFPs in Delhi
levels. During the polluted winter and autumn seasons, the           during the polluted periods could explain the higher median
daytime UFP levels were often lower than those during the            particle diameters than those usually observed in other urban
same period in the warmer months.                                    environments (Salma et al., 2011). In Table 2, we compare
   In Fig. 7 we present PSD heat maps for an extremely               the characteristic condensation sink (H2 SO4 ) and coagula-
polluted (high aerosol mass loading) period (1–5 February            tion sink (for 1, 5, 10, 15, 30, and 100 nm particles) for Delhi
2017). During the polluted episode (Fig. 7a), the PM0.56             (least and most polluted) with other cities (clean and pol-
concentrations ranged between 100 and 400 µg m−3 and the             luted). Based on the coagulation timescales for these polluted
PN concentrations between 25 000 and 80 000 cm−3 . The               periods, for a 1 h period coagulation scavenging could result
peak PN levels were observed during the evening traffic rush         in removal of ∼ 85 % of the 10 nm particles, ∼ 50 % of the
hours. Even though PN concentrations decreased during the            30 nm particles, and ∼ 10 % of the 100 nm particles present
late evening (∼ 20:00–23:00), the PM0.56 levels kept contin-         at the beginning of the hour. The coagulation sink for UFPs in
uously increasing all night. The Nnuc levels decreased during        Delhi during the polluted periods was ∼ 20 times larger com-
these polluted evening periods even as Nait and Nacc lev-            pared to a clean city (Helsinki). Even for least polluted pe-
els increased (Fig. S13 in the Supplement). This dynamic             riods in Delhi, the coagulation sink for UFPs was ∼ 4 times
suggests that coagulation may be acting as a strong control          larger than Helsinki.
on concentrations of smaller particles, even as emissions are
high. The characteristic timescale for particles smaller than        3.4   New particle formation
15 nm to be lost to coagulation scavenging by larger parti-
cles was less than 15 min for these polluted evenings. The           For the less polluted seasons (Fig. 6), we observed a sharp
size of the particles rapidly increased from the evening to the      increase in the concentration of nucleation mode particles
nighttime (growth rates up to ∼ 10 nm h−1 ), and coagulation         during midday, suggesting new particle formation. In Fig. 7b
may be one of the mechanisms that contributes to this rapid          we present PSD heat maps for a relatively less polluted pe-
growth.                                                              riod (7–11 April 2017). During some days for this period
   Since coagulation only affects particle number concentra-         we observed new particle formation and growth. The growth
tions, and not mass concentrations, PM0.56 increased into the        of particles in the nucleation mode was especially promi-
night, possibly owing to a combination of increased sources          nent for the latter 2 d of this episode when the PM0.56 con-
(e.g., nocturnal truck traffic and biomass burning for cooking       centrations were almost half the PM0.56 concentrations of
and heat) and decreasing ventilation (Guttikunda and Gurjar,         the first 2 d, and consequently both the condensation and
2012; Guttikunda and Calori, 2013; Bhandari et al., 2020).           coagulation sinks (across particle sizes) also decreased by
The PN concentrations dropped after the evening traffic rush         ∼ 50 %. We observed banana-shaped new particle formation
hours and only increased again during the morning traffic            and growth events during these relatively clean conditions,
rush hours.                                                          which were consistent with growth of atmospheric nanoparti-
   We followed Westerdahl et al. (2009) to calculate the co-         cles observed elsewhere (Kulmala and Kerminen, 2008). The
agulation timescales corresponding to the observed PSDs              growth rate of the nucleation mode particles based on the
(Sect. 2.3). When a small particle coagulates onto a larger          average PSDs for these clean conditions was ∼ 5 nm h−1 . It
particle, the small particle is lost and the big particle scarcely   should be noted that our SMPS measurements had a lower
grows. In Fig. 8 we have presented the diurnal and sea-              size cutoff of 12 nm, implying that the particles in the nucle-
sonal profiles for the modeled coagulation timescales for a          ation mode had already grown before being detected.
15, 30, and 100 nm particle. For the nucleation mode parti-             Growth rates depend on particle size, concentrations of
cle (15 nm), the timescales ranged from a few minutes for            condensable gases (H2 SO4 , highly oxygenated molecules,
the polluted periods (mornings and evenings of cooler sea-           etc.), and condensation and coagulation sinks, and they can
sons) to ∼ 1 h for the relatively less polluted periods (midday      range from 0.1 to 10s of nm h−1 across various environments
of warmer seasons). The corresponding range for an Aitken            (Kerminen et al., 2018; Nieminen et al., 2018; Bianchi et al.,
mode particle (30 nm) was ∼ 1–4 h. Finally, for an accumu-           2016). We did not observe banana-shaped new particle for-
lation mode particle (100 nm), coagulation was not a signif-         mation and growth events during the polluted winter or au-
icant sink owing to the extremely long timescales (tens of           tumn seasons as the growth phase was probably disrupted by
hours). Advection timescales across Delhi are ∼ 3–5 h based          coagulation scavenging. For example, during winter, coag-
on a length scale of ∼ 40 km at typical wind speeds.                 ulation timescales for a 15 nm particle were < 1 h (Fig. 8).
   Coagulation scavenging of UFPs onto the larger accumu-            Growth rates for polluted megacities are also usually slower
lation mode particles could explain the suppression in UFP           than 10 nm h−1 (Y. Zhou et al., 2020; Chu et al., 2019). It
concentrations for polluted periods which have high accu-            is likely that a nucleation mode particle is more likely to
mulation mode concentrations. The high aerosol surface area          coagulate with a larger particle than to grow to the Aitken
from particles in the accumulation mode, in addition to con-         or accumulation mode. Overall, the aerosol dynamics are a
tributing to most of the mass, can act as a coagulation sink         complex interplay of both new particle formation and coag-

Atmos. Chem. Phys., 20, 8533–8549, 2020                                                https://doi.org/10.5194/acp-20-8533-2020
S. Gani et al.: Particle number concentrations and size distribution in a polluted megacity                                         8541

Figure 7. Heat map showing the evolution of the PSDs for a (a) polluted period with prominent coagulation scavenging and (b) less polluted
period with some new particle formation and growth. Bulk PN and PM concentrations for the same period as the heat map are also presented
for both periods. The average diurnal profile of the median diameter, along with the PN and PM concentrations over the two periods,
is presented in the right panels. Estimation of PM concentrations were based on the volume concentrations observed by the SMPS and
assuming the particle density to be 1.6 g cm−3 .

                                                                        ulation scavenging, with nucleation mode particles in highly
                                                                        polluted environments generally being susceptible to scav-
                                                                        enging by the accumulation mode particles.
                                                                           Large accumulation mode concentrations also act as a
                                                                        strong condensation sink (Table 2), causing vapors to con-
                                                                        dense onto existing particles instead of forming new particles
                                                                        (Mönkkönen et al., 2004a). During the most polluted time
                                                                        in Delhi (generally 20:00–21:00 during the winter), the con-
                                                                        densation sink was 20 times larger than Helsinki (clean city;
                                                                        Hussein et al., 2004). Even for the least polluted period in
Figure 8. Coagulation timescale (τ ) for 15, 30, and 100 nm particles   Delhi (generally 14:00–15:00 during the monsoon), the con-
by season.                                                              densation sink was ∼ 4 times larger than Helsinki. The con-
                                                                        densation sink for the polluted periods was somewhat higher

https://doi.org/10.5194/acp-20-8533-2020                                                 Atmos. Chem. Phys., 20, 8533–8549, 2020
8542 S. Gani et al.: Particle number concentrations and size distribution in a polluted megacity
Table 2. Characteristic coagulation and condensation sinks for Delhi and comparison with those calculated using PSDs in the literature for
other cities.
DAS (our study) Literature
Most polluteda Least pollutedb Delhic Beijingc Helsinkid
Condensation sink (s−1 ) H2 SO4 1.7 × 10⁻¹ 3.5 × 10⁻² 1.4 ×10⁻¹ 1.1 × 10⁻¹ 8.2 × 10⁻³
1 nm 8.7 × 10⁻² 1.8 × 10⁻² 7.3 × 10⁻² 5.7 × 10⁻² 4.3 × 10⁻³
5 nm 5.7 × 10⁻³ 1.3 × 10⁻³ 4.6 × 10⁻³ 3.4 × 10⁻³ 3.1 × 10⁻⁴
Coagulation sink (s−1 ) 10 nm 1.8 × 10⁻³ 4.2 × 10⁻⁴ 1.4 × 10⁻³ 1.0 × 10⁻³ 1.1 × 10⁻⁴
15 nm 9.2 × 10⁻⁴ 2.3 × 10⁻⁴ 7.2 × 10⁻⁴ 5.2 × 10⁻⁴ 5.6 × 10⁻⁵
30 nm 3.2 × 10⁻⁴ 7.4 × 10⁻⁵ 2.4 × 10⁻⁴ 1.7 × 10⁻⁴ 1.9 × 10⁻⁵
100 nm 3.7 × 10⁻⁵ 6.4 × 10⁻⁶ 3.0 × 10⁻⁵ 7.2 × 10⁻⁵ 1.5 × 10⁻⁶
a Average PSDs for winter 20:00–21:00. b Average PSDs for the monsoon 14:00–15:00. c PSDs from Fig. 2 in Laakso et al. (2006). d PSDs from Table 1
in Hussein et al. (2004).
than Beijing (polluted city; Laakso et al., 2006) but within the reduction in either nucleation or Aitken mode concentra-
same order of magnitude. For spring, summer, and the mon- tions. Parametrization studies suggest that rain is more ef-
soon, we estimated the condensation sink to be more than an fective in scavenging nucleation mode particles compared
order of magnitude lower than the winter and autumn. Conse- to Aitken mode particles (Pryor et al., 2016; Laakso et al.,
quently, unlike winter and autumn, we observed an increase 2003). Lower accumulation mode concentrations following
in daytime UFP concentrations (around 12–30 nm) for the rain events imply lower condensation and coagulation sinks.
relatively less polluted months, which was consistent with While we cannot fully reconcile our observations here with
daytime new particle formation from nucleation events (Kul- theory, possible explanations include (i) differential water
mala et al., 2004; Brines et al., 2015). Based on the sur- solubility by particle size and age or (ii) that the rain washout
vival parameter (P = (CS/104 s−1 )/(GR/nm h−1 )) defined of the nucleation mode particles is “balanced” by the reduc-
in Kulmala et al. (2017), new particle formation would not tion in the condensation and coagulation sink due to the rain
be expected even during some of the least polluted periods in washout of accumulation mode particles.
Delhi. Why we observe any new particle formation events in The lower sensitivity of PNs to ventilation changes can
Delhi – similar to observations from megacities in China – is be explained by the dissimilar sources and atmospheric pro-
still not well understood (Kulmala et al., 2017). cesses that contribute to PN and PM levels. While PNs are
mostly comprised of UFPs, accumulation mode particles
3.5 Role of meteorology constitute most of the fine aerosol mass. Traffic, cooking,
and nucleation events contribute to urban UFPs. A large frac-
In Gani et al. (2019) we showed that meteorology – specifi- tion of accumulation mode particles, in contrast, result from
cally change in ventilation – was an important factor in driv- biomass burning and aging of aerosol, which result in par-
ing the seasonal aerosol mass variations observed in Delhi. ticles often being larger than 100 nm (Janhäll et al., 2010).
However, PN levels did not show similar seasonal variation Periods with lower ventilation that result in high aerosol
(Fig. 2). In Fig. S11, we have presented the 2-week aver- mass loadings also create a large coagulation sink for UFPs
ages for ventilation and PN concentrations (by mode and (Sect. 3.3). While coagulation suppresses the PN levels, the
total). Nacc concentrations decrease as the ventilation coef- aerosol mass remains conserved. While a decrease in venti-
ficient increases. Since accumulation mode particles consti- lation should initially increase concentrations for all particle
tute most of the submicron mass, a decrease in Nacc con- sizes similarly, coagulation causes the smaller UFPs to be se-
centrations with increasing ventilation is consistent with our lectively lost, which causes a larger increase in aerosol mass
previous analysis that showed a decrease in mass loadings compared to number. Conversely, periods with high ventila-
with increasing ventilation. Nait concentrations seem to have tion (daytime of warmer months) also have more nucleation
a smaller slope than accumulation mode concentrations. Nnuc events resulting in increased UFP concentrations but with al-
concentrations increased with increasing ventilation, which most no contribution to aerosol mass (Brines et al., 2015).
is consistent with new particle formation and/or less co- In addition to large condensation sinks from existing parti-
agulation scavenging. Comparing rainy and nonrainy days cles (Sect. 3.4), it is possible that the elevated RH during
during the monsoon, our observations suggest that rain re- the cooler winter and autumn (Fig. 1) could further suppress
duces the accumulation mode concentrations (Fig. S12) as atmospheric nucleation. It has been observed in both clean
observed in other studies (Luan et al., 2019; Hussein et al., and polluted environments that the RH during new particle
2018). However, we do not observe that rain causes a clear formation event days tends to be lower compared to non-
Atmos. Chem. Phys., 20, 8533–8549, 2020 https://doi.org/10.5194/acp-20-8533-2020S. Gani et al.: Particle number concentrations and size distribution in a polluted megacity 8543
event days (Kerminen et al., 2018; Dada et al., 2017; Hamed PN fractions in the third mode. Generally, the midday hour
et al., 2011). Overall, ventilation strongly influences aerosol had some of the highest fractions of PN concentrations in the
mass loadings in Delhi, with higher ventilation often result- ultrafine mode, especially for summer (80 %), the monsoon
ing in reduction of PM concentrations and vice versa. How- (83 %), and spring (81 %). The corresponding levels, while
ever, we do not observe such a simple relationship between much lower for the more polluted autumn (56 %) and win-
ventilation and PN levels. The complex interplay of sources, ter (53 %), were higher than most other times of day within
aerosol dynamics, and atmospheric processes, as discussed those seasons. Even in absolute terms, summer, the monsoon,
previously, make PN levels less sensitive to meteorological and spring had some of the highest PN concentrations in the
changes compared to aerosol mass loadings. ultrafine modes. The high ultrafine mode concentrations –
both magnitude and PN fraction – are potentially from new
3.6 Lessons from multimodal PSD fitting particle formation (Kulmala et al., 2004). We observe charac-
teristic new particle formation followed by some growth for
In this section we present the parameters obtained by fitting the warmer seasons (Fig. 6). However, during the more pol-
multimodal lognormal distributions to the seasonal and char- luted winter and autumn, daytime new particle formation is
acteristic time-of-day averages of the observed PSDs (Ta- not observed – potentially because of the strong coagulation
ble 3). For most seasons and times of day, the PSDs were bi- and condensation sink (Sec 3.4).
modal. Even when there was a third mode, it contained less During the evening rush hour, the PSDs were bimodal for
than 10 % of the total PN concentration. While the smaller winter (35 and 88 nm), autumn (39 and 103 nm), spring (28
mode (ultrafine mode) ranged from 20 to 40 nm depending and 80 nm), and summer (30 and 89 nm). For the monsoon
on season and time of day, the larger mode (accumulation the PSDs were trimodal (27, 76, and 203 nm), with only 5 %
mode) ranged from 80 to 120 nm. For all seasons the late of the PN fraction in the third mode. The relatively smaller
night ultrafine mode concentrations contributed to less than median diameter for the accumulation mode during the traffic
half of the total PN concentration. This observation can be rush hour is consistent with particles from fresh vehicle ex-
explained by fewer sources of UFPs – less traffic and no nu- hausts – both gasoline and diesel – being smaller than those
cleation events – and a large coagulation sink from nighttime from biomass burning and other aged aerosols. While gaso-
aerosol mass loadings (from accumulation mode) which are line engines emit in the ∼ 20–60 nm range, some of the older
often high in part due to unfavorable nighttime meteorology diesel engines still prevalent in India can emit larger accu-
(Gani et al., 2019). Delhi traffic usually peaks around 08:00– mulation mode particles (Kumar et al., 2010). Particles from
11:00 in the morning and 17:00–21:00 in the evening. Re- biomass burning are in the ∼ 50–200 nm size range (Chen
strictions on daytime heavy-duty truck traffic have resulted et al., 2017; Janhäll et al., 2010). For the warmer periods
in increased nocturnal truck traffic after 22:00 (Mishra et al., which have relatively few biomass burning emissions, the
2019; Guttikunda and Calori, 2013). The accumulation mode ultrafine modes contribute to relatively higher fractions of
during late nights had median diameters from 100 nm for the PN – especially during traffic rush hours. These findings are
relatively less polluted summer and monsoon to 120 nm for consistent with studies from cities in high-income countries
spring, winter, and autumn. where traffic and nucleation events are considered the major
During the morning rush hour, the median diameter of source of UFPs (Brines et al., 2015).
the ultrafine and accumulation modes were the smallest for
the summer (21 and 100 nm for ultrafine and accumula-
tion mode) and the monsoon (23 and 110 nm) compared to 4 Conclusions
spring (28 and 122 nm), autumn (35 and 120 nm), and win-
ter (39 and 122 nm). Autumn had three modes (35, 120, and We used continuous, highly time-resolved, and long-term
234 nm), with the ultrafine mode contributing to 58 %, the ac- data to provide a detailed seasonal and diurnal characteri-
cumulation mode to 34 %, and the third mode contributing to zation of Delhi’s PN concentrations. The number of concen-
only 8 % of the total PN concentration. For winter during the trations for each mode (nucleation, Aitken, and accumula-
same period, half of the PN concentrations were in the ultra- tion) varied dynamically by season and by time of day. While
fine mode (∼ 40 nm) and the other half in the accumulation Delhi experiences PM levels 10 times higher than cities in
mode (∼ 120 nm). The fraction of PNs in the ultrafine mode North America and western Europe, PN levels were compa-
during the same period was relatively higher for the other rable to those observed in urban sites in relatively cleaner (in
seasons which had fewer aerosol mass loadings compared to terms of aerosol mass) cities. Observations from other pol-
winter, with the least polluted monsoon having 66 % of the luted cities (e.g., in China) also show that high aerosol mass
PNs in the ultrafine mode. does not necessarily imply similarly high PN concentrations
The midday PSDs were bimodal for winter (26 and (Shen et al., 2011; Wu et al., 2008; Laakso et al., 2006). Fur-
125 nm), autumn (29 and 122 nm), spring (19 and 100 nm), thermore, the seasonal variability of PNs was much less than
and summer (26 and 111 nm). For the monsoon the PSDs that of the PM measured at our site. While it is generally as-
were trimodal (27, 90, and 177 nm), with only 6 % of the sumed that UFPs constitute most of the PN concentrations,
https://doi.org/10.5194/acp-20-8533-2020 Atmos. Chem. Phys., 20, 8533–8549, 20208544 S. Gani et al.: Particle number concentrations and size distribution in a polluted megacity
Table 3. Multimodal lognormal fitting parameters for the average particle size distribution of each season and characteristic times of day.
Mode 1 Mode 2 Mode 3
Dp (nm) σg Ntot %PN Dp (nm) σg Ntot %PN Dp (nm) σg Ntot %PN
(×103 cm−3 ) (×103 cm−3 ) (×103 cm−3 )
Winter 35 1.8 15.8 31 122 1.8 34.5 69 – – – –
Spring 28 1.8 20.0 43 122 1.8 26.2 57 – – – –
02:00–03:00 Summer 23 1.6 9.1 26 100 1.8 26.0 74 – – – –
Monsoon 26 1.8 10.2 38 101 1.8 16.7 62 – – – –
Autumn 35 1.8 10.4 28 122 1.8 26.3 72 – – – –
Winter 39 1.9 31.7 50 122 1.9 31.8 50 – – – –
Spring 28 1.7 37.2 61 122 1.8 24.1 39 – – – –
08:00–09:00 Summer 21 1.6 25.4 56 100 1.9 20.0 44 – – – –
Monsoon 23 1.6 23.5 66 110 1.8 12.2 34 – – – –
Autumn 35 1.7 26.4 58 120 1.6 15.2 34 234 1.6 3.6 8
Winter 26 1.7 17.1 53 125 1.8 15.0 47 – – – –
Spring 19 1.8 41.9 81 100 2.0 9.7 19 – – – –
14:00–15:00 Summer 26 1.9 35.5 80 111 1.7 8.7 20 – – – –
Monsoon 27 1.7 36.5 83 90 1.4 4.7 11 177 1.6 2.7 6
Autumn 29 1.7 14.3 56 122 1.9 11.2 44 – – – –
Winter 35 1.7 20.8 25 88 1.9 63.0 75 – – – –
Spring 28 1.9 38.3 55 80 2.0 31.8 45 – – – –
20:00–21:00 Summer 30 1.8 35.9 57 89 1.9 27.2 43 – – – –
Monsoon 27 1.6 25.4 56 76 1.7 17.7 39 203 1.6 2.2 5
Autumn 39 1.9 24.8 48 103 1.9 26.8 52 – – – –
we observed that a large number of accumulation particles Author contributions. JSA, LHR, GH, SG, and SB designed the
– that constitute most of the fine aerosol mass – contributed study. SG, SB, PS, ZA, and SS carried out the data collection. SG
to almost half of the PN concentrations for some of the ex- carried out the data processing and analyses. All coauthors con-
tremely polluted periods. UFP concentrations were found to tributed to interpretation of results, writing, and reviewing the paper.
be lower during periods with some of the highest mass con-
centrations.
We show that the lack of proportionality between aerosol Competing interests. The authors declare that they have no conflict
of interest.
mass and number concentrations results from the rapid coag-
ulation of UFPs, especially during periods with high accumu-
lation mode concentrations. Furthermore, the accumulation
Acknowledgements. We are thankful to the IIT Delhi for the insti-
mode particles can also act as a strong condensation sink, tutional support. We are grateful to all student and staff members at
causing vapors to condense onto existing particles instead of the Aerosol Research and Characterization Laboratory (especially
forming new particles. Even though coagulation does not af- Nisar Ali Baig and Mohammad Yawar Hasan) and the Environmen-
fect mass concentrations, it can significantly govern PN lev- tal Engineering Laboratory (especially Sanjay Gupta) at IIT Delhi
els with important health and policy implications. Further- for their constant support. We are thankful to Maynard Havlicek
more, implications of a strong accumulation mode coagula- (TSI) for always providing timely technical support for the instru-
tion sink for future air quality control efforts in Delhi are that mentation. Tareq Hussein provided the scripts used for the mode
a reduction in mass concentration may not produce a propor- fitting of the particle size distribution.
tional reduction in PN concentrations. Long-term, continu-
ous observations of PSDs from Delhi will be able to provide
important insights into the role of sources and atmospheric Financial support. This research has been supported by the Cli-
processes that drive aerosol number concentrations. mateWorks Foundation.
Data availability. Hourly PSD data used in this Review statement. This paper was edited by Veli-Matti Kerminen
study are available via the Texas Data Repository at and reviewed by two anonymous referees.
https://doi.org/10.18738/T8/PCO1BP (Gani et al., 2020).
Supplement. The supplement related to this article is available on-
line at: https://doi.org/10.5194/acp-20-8533-2020-supplement.
Atmos. Chem. Phys., 20, 8533–8549, 2020 https://doi.org/10.5194/acp-20-8533-2020S. Gani et al.: Particle number concentrations and size distribution in a polluted megacity 8545
References Charron, A. and Harrison, R. M.: Primary particle forma-
tion from vehicle emissions during exhaust dilution in
the roadside atmosphere, Atmos. Environ., 37, 4109–4119,
Abernethy, R. C., Allen, R. W., McKendry, I. G., and Brauer, https://doi.org/10.1016/S1352-2310(03)00510-7, 2003.
M.: A land use regression model for ultrafine particles in Chen, J., Li, C., Ristovski, Z., Milic, A., Gu, Y., Islam, M. S.,
Vancouver, Canada, Environ. Sci. Technol., 47, 5217–5225, Wang, S., Hao, J., Zhang, H., He, C., Guo, H., Fu, H.,
https://doi.org/10.1021/es304495s, 2013. Miljevic, B., Morawska, L., Thai, P., LAM, Y. F., Pereira,
Apte, J. S., Kirchstetter, T. W., Reich, A. H., Deshpande, S. J., G., Ding, A., Huang, X., and Dumka, U. C.: A review of
Kaushik, G., Chel, A., Marshall, J. D., and Nazaroff, W. W.: Con- biomass burning: Emissions and impacts on air quality, health
centrations of fine, ultrafine, and black carbon particles in auto- and climate in China, Sci. Total Environ., 579, 1000–1034,
rickshaws in New Delhi, India, Atmos. Environ., 45, 4470–4480, https://doi.org/10.1016/j.scitotenv.2016.11.025, 2017.
https://doi.org/10.1016/j.atmosenv.2011.05.028, 2011. Cheung, H. C., Chou, C. C.-K., Chen, M.-J., Huang, W.-R., Huang,
Apte, J. S., Messier, K. P., Gani, S., Brauer, M., Kirchstetter, T. W., S.-H., Tsai, C.-Y., and Lee, C. S. L.: Seasonal variations of
Lunden, M. M., Marshall, J. D., Portier, C. J., Vermeulen, R. C., ultra-fine and submicron aerosols in Taipei, Taiwan: implications
and Hamburg, S. P.: High-resolution air pollution mapping with for particle formation processes in a subtropical urban area, At-
Google Street View cars: Exploiting big data, Environ. Sci. Tech- mos. Chem. Phys., 16, 1317–1330, https://doi.org/10.5194/acp-
nol., 51, 6999–7008, https://doi.org/10.1021/acs.est.7b00891, 16-1317-2016, 2016.
2017. Chu, B., Kerminen, V.-M., Bianchi, F., Yan, C., Petäjä, T., and Kul-
Apte, J. S., Brauer, M., Cohen, A. J., Ezzati, M., and mala, M.: Atmospheric new particle formation in China, Atmos.
Pope, C. A.: Ambient PM2.5 reduces global and regional Chem. Phys., 19, 115–138, https://doi.org/10.5194/acp-19-115-
life expectancy, Environ. Sci. Technol. Lett., 5, 546–551, 2019, 2019.
https://doi.org/10.1021/acs.estlett.8b00360, 2018. Cohen, A. J., Brauer, M., Burnett, R., Anderson, H. R., Frostad, J.,
Bhandari, S., Gani, S., Patel, K., Wang, D. S., Soni, P., Arub, Z., Estep, K., Balakrishnan, K., Brunekreef, B., Dandona, L., Dan-
Habib, G., Apte, J. S., and Hildebrandt Ruiz, L.: Sources and dona, R., Feigin, V., Freedman, G., Hubbell, B., Jobling, A., Kan,
atmospheric dynamics of organic aerosol in New Delhi, India: H., Knibbs, L., Liu, Y., Martin, R., Morawska, L., Pope, C. A.,
insights from receptor modeling, Atmos. Chem. Phys., 20, 735– Shin, H., Straif, K., Shaddick, G., Thomas, M., van Dingenen,
752, https://doi.org/10.5194/acp-20-735-2020, 2020. R., van Donkelaar, A., Vos, T., Murray, C. J. L., and Forouzanfar,
Bianchi, F., Tröstl, J., Junninen, H., Frege, C., Henne, S., Hoyle, M. H.: Estimates and 25-year trends of the global burden of dis-
C. R., Molteni, U., Herrmann, E., Adamov, A., Bukowiecki, N., ease attributable to ambient air pollution: an analysis of data from
Chen, X., Duplissy, J., Gysel, M., Hutterli, M., Kangasluoma, J., the Global Burden of Diseases Study 2015, Lancet, 389, 1907–
Kontkanen, J., Kürten, A., Manninen, H. E., Münch, S., Peräkylä, 1918, https://doi.org/10.1016/S0140-6736(17)30505-6, 2017.
O., Petäjä, T., Rondo, L., Williamson, C., Weingartner, E., Cur- Dada, L., Paasonen, P., Nieminen, T., Buenrostro Mazon, S., Kon-
tius, J., Worsnop, D. R., Kulmala, M., Dommen, J., and Bal- tkanen, J., Peräkylä, O., Lehtipalo, K., Hussein, T., Petäjä,
tensperger, U.: New particle formation in the free troposphere: T., Kerminen, V.-M., Bäck, J., and Kulmala, M.: Long-term
A question of chemistry and timing, Science, 352, 1109–1112, analysis of clear-sky new particle formation events and non-
https://doi.org/10.1126/science.aad5456, 2016. events in Hyytiälä, Atmos. Chem. Phys., 17, 6227–6241,
Brines, M., Dall’Osto, M., Beddows, D. C. S., Harrison, R. https://doi.org/10.5194/acp-17-6227-2017, 2017.
M., Gómez-Moreno, F., Núñez, L., Artíñano, B., Costabile, Fruin, S., Westerdahl, D., Sax, T., Sioutas, C., and Fine, P.: Mea-
F., Gobbi, G. P., Salimi, F., Morawska, L., Sioutas, C., and surements and predictors of on-road ultrafine particle concentra-
Querol, X.: Traffic and nucleation events as main sources of ul- tions and associated pollutants in Los Angeles, Atmos. Environ.,
trafine particles in high-insolation developed world cities, At- 42, 207–219, https://doi.org/10.1016/j.atmosenv.2007.09.057,
mos. Chem. Phys., 15, 5929–5945, https://doi.org/10.5194/acp- 2008.
15-5929-2015, 2015. Gani, S., Bhandari, S., Seraj, S., Wang, D. S., Patel, K., Soni, P.,
Brüggemann, E., Gerwig, H., Gnauk, T., Müller, K., and Her- Arub, Z., Habib, G., Hildebrandt Ruiz, L., and Apte, J. S.: Sub-
rmann, H.: Influence of seasons, air mass origin and day of micron aerosol composition in the world’s most polluted megac-
the week on size-segregated chemical composition of aerosol ity: the Delhi Aerosol Supersite study, Atmos. Chem. Phys., 19,
particles at a kerbside, Atmos. Environ., 43, 2456–2463, 6843–6859, https://doi.org/10.5194/acp-19-6843-2019, 2019.
https://doi.org/10.1016/j.atmosenv.2009.01.054, 2009. Gani, S., Bhandari, S., Patel, K., Seraj, S., Soni, P., Arub,
Buonanno, G., Dell’Isola, M., Stabile, L., and Viola, A.: Uncer- Z., Habib, G., Hildebrandt Ruiz, L., and Apte, J. S.:
tainty Budget of the SMPS–APS System in the Measurement Data published in “Particle number concentrations and size
of PM1 , PM2.5 , and PM10 , Aerosol Sci. Tech., 43, 1130–1141, distribution in a polluted megacity: The Delhi Aerosol
https://doi.org/10.1080/02786820903204078, 2009. Supersite study”, Texas Data Repository Dataverse, V1,
Cai, R. and Jiang, J.: A new balance formula to estimate https://doi.org/10.18738/T8/PCO1BP, 2020.
new particle formation rate: reevaluating the effect of coag- Guo, S., Hu, M., Zamora, M. L., Peng, J., Shang, D., Zheng,
ulation scavenging, Atmos. Chem. Phys., 17, 12659–12675, J., Du, Z., Wu, Z., Shao, M., Zeng, L., Molina, M. J.,
https://doi.org/10.5194/acp-17-12659-2017, 2017. and Zhang, R.: Elucidating severe urban haze formation
Calvo, A., Alves, C., Castro, A., Pont, V., Vicente, A., and Fraile, in China, P. Natl. Acad. Sci. USA, 111, 17373–17378,
R.: Research on aerosol sources and chemical composition: https://doi.org/10.1073/pnas.1419604111, 2014.
Past, current and emerging issues, Atmos. Res., 120–121, 1–28,
https://doi.org/10.1016/j.atmosres.2012.09.021, 2013.
https://doi.org/10.5194/acp-20-8533-2020 Atmos. Chem. Phys., 20, 8533–8549, 2020You can also read