Immunomagnetic sequential ultrafiltration (iSUF) platform for enrichment and purification of extracellular vesicles from biofluids
←
→
Page content transcription
If your browser does not render page correctly, please read the page content below
www.nature.com/scientificreports
OPEN Immunomagnetic sequential
ultrafiltration (iSUF) platform
for enrichment and purification
of extracellular vesicles
from biofluids
Jingjing Zhang1, Luong T. H. Nguyen1, Richard Hickey1, Nicole Walters1, Xinyu Wang1,
Kwang Joo Kwak1, L. James Lee1, Andre F. Palmer1 & Eduardo Reátegui1,2*
Extracellular vesicles (EVs) derived from tumor cells have the potential to provide a much-needed
source of non-invasive molecular biomarkers for liquid biopsies. However, current methods for
EV isolation have limited specificity towards tumor-derived EVs that limit their clinical use. Here,
we present an approach called immunomagnetic sequential ultrafiltration (iSUF) that consists of
sequential stages of purification and enrichment of EVs in approximately 2 h. In iSUF, EVs present
in different volumes of biofluids (0.5–100 mL) can be significantly enriched (up to 1000 times),
with up to 99% removal of contaminating proteins (e.g., albumin). The EV recovery rate by iSUF
for cell culture media (CCM), serum, and urine corresponded to 98.0% ± 3.6%, 96.0% ± 2.0% and
94.0% ± 1.9%, respectively (p > 0.05). The final step of iSUF enables the separation of tumor-specific
EVs by incorporating immunomagnetic beads to target EV subpopulations. Serum from a cohort of
clinical samples from metastatic breast cancer (BC) patients and healthy donors were processed by the
iSUF platform and the isolated EVs from patients showed significantly higher expression levels of BC
biomarkers (i.e., HER2, CD24, and miR21).
Extracellular vesicles (EVs) are increasingly recognized as relevant diagnostic and therapeutic entities present
in different b iofluids1. EVs are lipid particles with sizes that vary from 30 nm to a few m
icrons2. EVs are endog-
enously shed from the surface of cells through distinct mechanisms, leading to different types of vesicles3. Multi-
vesicular bodies that contain smaller vesicles can fuse with the plasma membrane to release their internal vesicles
(i.e., exosomes)4. Larger lipid vesicles can directly bud from the plasma membrane as microvesicles5. EVs carry
various biological cargo, including proteins, RNA, and DNA fragments, giving EVs unique roles in regulating
cell–cell communication6. Moreover, it has been shown that tumor EVs (tEVs) can tune cellular microenviron-
ments at distant sites to promote angiogenesis, invasiveness, immunosuppression, and m etastasis7–10.
Different proof of concept studies have used tEVs to develop liquid biopsy assays to diagnose and monitor
cancer at different s tages11,12. EVs are more abundant than other circulating biomarkers (e.g., circulating tumor
cells), and they are structurally more robust13. However, tEVs present in biofluids are surrounded by massive
amounts of normal EVs (nEVs; secreted by healthy cells), and other biomolecules (e.g., albumin, lipoproteins,
ribonucleoproteins, globulins)14, thus novel purification methods are required to isolate t EVs15. A recent survey
on the methods used for isolation and characterization of EVs from research laboratories around the world
reveals that more than 80% of researchers use ultracentrifugation (UC) for the isolation of EVs and western blot-
ting for protein characterization16. Although UC and density gradient methods can be used to process different
biofluids, they are labor-intensive, produce protein aggregate contaminants, and are nonspecific towards EV type
(derived from a tumor or normal cells)17–19. Other EV isolation methods, including polymeric or salt precipitation
kits20, size exclusion chromatography (SEC) columns (e.g., qEVs)21, and nano/microdevices have limitations22.
Precipitation kits have low EV recovery rates, lack specificity, and have low purity23. qEVs can separate EVs into
different size fractions with high purity and low protein contamination, but have low EV recovery rates and are
1
William G. Lowrie Department of Chemical and Biomolecular Engineering, The Ohio State University, Columbus,
OH 43210, USA. 2Comprehensive Cancer Center, The Ohio State University, Columbus, OH 43210, USA. *email:
reategui.8@osu.edu
Scientific Reports | (2021) 11:8034 | https://doi.org/10.1038/s41598-021-86910-y 1
Vol.:(0123456789)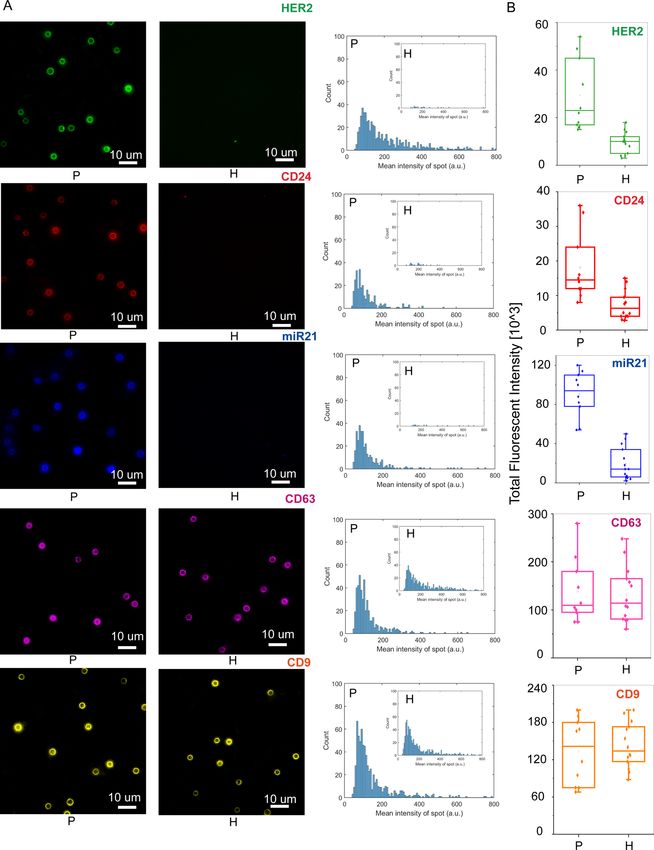
www.nature.com/scientificreports/
nonspecific for EV subpopulation24. Recently, immunoaffinity methods that were developed for cell separation
have been adapted for specific EV isolation25. Microfluidic and plasmonic devices have been functionalized
with antibodies to target different EV p opulations26,27. However, the majority of these approaches target tet-
raspanins and annexins, which are ubiquitous proteins present in all EVs28. Other attempts used epithelial cell
adhesion molecule (EpCAM); however, this antigen is also expressed on normal epithelial EVs29. Recently, we
demonstrated the use of nanostructured polymeric brushes conjugated with epidermal growth factor receptor
(EGFR) and integrated into a microfluidic channel to enhance specificity towards tumor-derived EVs isolated
from glioblastoma (GBM) patients30. Although this approach can achieve a remarkable 94% specificity towards
tEVs, the limited amount of biofluid processed (1–1.5 mL of serum or plasma) and the retention of albumin,
roteomics31.
significantly limits its use for p
Here, we present a novel approach termed immunomagnetic sequential ultrafiltration (iSUF) that over-
comes current limitations for EV enrichment and purification. iSUF combines three stages of ultrafiltration
and immunoaffinity separation: a tangential flow filtration (TFF) step, a standard centrifugal enrichment step,
and a magnetic-bead antibody-based EV capture step. Using iSUF, we demonstrate that small or large volumes
of biofluid can be processed (~ 0.5 mL or 100 mL) while concomitantly removing up to 99% of contaminating
proteins (e.g., albumin). We have demonstrated the use of iSUF to enrich EVs present in three different types of
biofluids: cell culture media (CCM), serum, and urine for which the sample processing time was approximately
2 h. Another feature of iSUF is that it can enrich EVs up to 1000 times with an EV recovery rate higher than
94%, which overcomes the limitations of other commercially available methods. To further validate the clinical
utility of iSUF, we have processed serum samples from 10 metastatic breast cancer (BC) patients and demon-
strated the presence of HER2, CD24 and miR21 biomarkers at significantly higher levels compared to healthy
controls (p < 0.05).
Materials and methods
Ethics. Healthy donors (HDs) were enrolled via an approved Institutional Review Board at The Ohio State
University (IRB# 2018H0268 and 2019C0189). All HDs participants provided written informed consent. We
also confirm that all experiments were carried out following relevant guidelines and regulations.
Materials. Polysulfone hollow fiber cartridges were used (molecular weight cut off, MWCO: 500 kDa;
Repligen, Rancho Dominguez, CA). Amicon ultra-15 centrifugal filter units (MWCO: 3, 10, and 30 kDa) were
purchased from MilliporeSigma (Burlington, MA). Streptavidin-coated magnetic particles (3.0–3.9 μm) were
obtained from Spherotech (Lake Forest, IL). For capturing EVs, EGFR (Cetuximab) was purchased from Imclone
Systems LLC (Branchburg, NJ). EpCAM (#AF960), and HER2 (#AF1129) antibodies were purchased from R&D
Systems (Minneapolis, MN). Antibodies were biotinylated using an EZ-Link micro Sulfo-NHS-biotinylation kit
(Thermo Fisher Scientific, Waltham, MA).
Cell culture and supernatant collection. U-251 glioblastoma (GBM), MCF-7 breast, and A375 mela-
noma cancer cell lines were supplied by American Type Culture Collection (ATCC, Manassas, VA). Cell lines
were cultured in their recommended culture medium32 containing 10% FBS and 1% penicillin–streptomycin
at 37 °C in a 5% CO2 incubator. For isolation of EVs from CCM, U251, MCF7, and A375 cells were grown in
T75 flasks to 90% cell confluence, followed by washing the cells twice with PBS. Culture medium with 10% EV-
depleted FBS was added to cells for 24 h. CCM was centrifuged at 1, 000×g for 5 min at room temperature (RT)
to discard cell debris before further processing. EV-depleted FBS was prepared by using the permeate of FBS
filtered by tangential flow filtration (TFF) (MWCO: 300 kDa).
Healthy donor serum collection. 10 mL of whole blood from healthy donors was collected into BD SST
serum tubes (Thermo Fisher Scientific, Waltham, MA). Tubes were rocked 10 times and then gently placed
upright to coagulate for 60 min. Then, the tubes were centrifuged at RT at 1100×g for 10 min. The serum was
subsequently aspirated carefully and stored in 1 mL aliquots at − 80 °C. Additionally, we used six healthy donor
serum samples from Zen-Bio (Research Triangle Park, NC) collected according to FDA guidelines.
Healthy donor urine collection. Urine was also collected from the same healthy donors, by either a first-
morning or second-morning standard collection p rotocol33. The urine volume collected was 10–100 mL. Urine
was collected in sterilized 50-mL centrifuge tubes containing 4.2 mL protease inhibitor—a mixture of 1.67 mL
100 mM sodium azide (NaN3), 2.5 mL phenylmethylsulfonyl fluoride (PMSF), and 50 μl Leupeptin (Millipore-
Sigma)34. After collection, urine samples were frozen at − 80 °C until processing time.
Cancer patient samples. 1 mL of serum was collected from 10 metastatic BC patients. Samples were
stored at − 80 °C until use. All patient samples were collected from the biospecimens biobank through the Total
Cancer Care (TCC) Program at the James Comprehensive Cancer Center at The Ohio State University.
Processing biofluids using the iSUF platform. The schematic workflow of the iSUF platform is shown
in Fig. 1. In stage 1, TFF was used to enrich and diafiltrate EVs from the biofluid. Thus, biofluid from the sample
feed reservoir was removed as filtrate/permeate from the TFF filter. Diafiltration is a fractionation process that
removes smaller molecules (filtrate/permeate) through the filter and leaves larger molecules in the reservoir
by adding a diafiltration solution into the reservoir at the same rate as the filtrate is generated. Briefly, a TFF
pump circulates the biofluid through a hollow fiber filter cartridge at a controlled flow rate. Sample fractiona-
Scientific Reports | (2021) 11:8034 | https://doi.org/10.1038/s41598-021-86910-y 2
Vol:.(1234567890)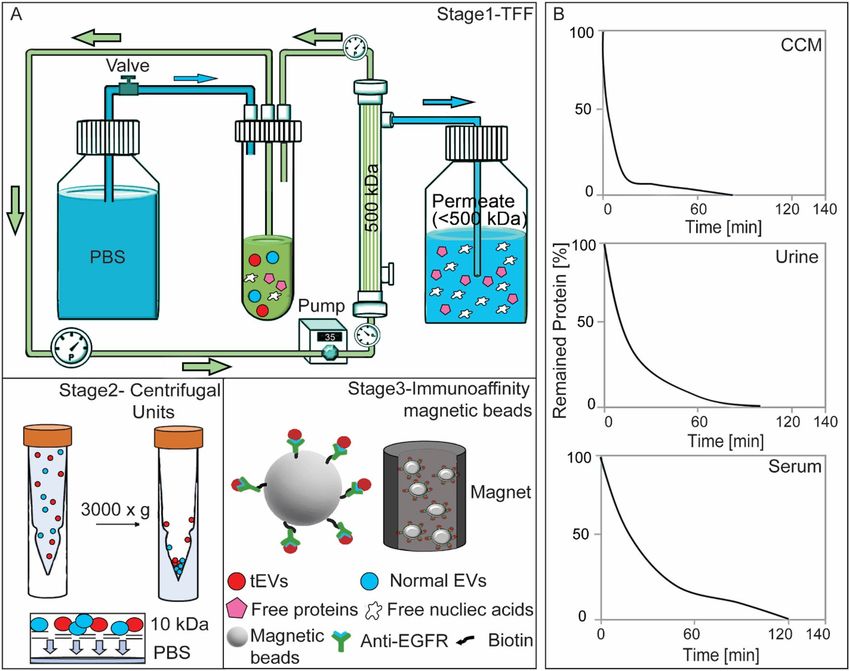
www.nature.com/scientificreports/
Figure 1. The Immunomagnetic sequential ultrafiltration (iSUF) platform. (A) Schematic representation of
iSUF stages 1, 2, 3, including tangential flow filtration (TFF) purification, centrifugal unit enrichment, and tEV
immunoaffinity isolation, respectively. In stage 1, biofluids were processed using a 500 kDa TFF filter, EVs were
retained in the retentate and enriched in 7 mL while free proteins and nucleic acids permeated through the TFF
filter. Then the PBS valve was opened to start TFF diafiltration until removing up to 99% of free proteins. Finally,
EVs were recovered in 2 mL of PBS after flushing the TFF system with air. In stage 2, EVs were centrifuged using
a 10 kDa centrifugal unit at 3000×g and enriched in 100 μL. In stage 3, tEVs were captured using antibodies
immobilized to streptavidin-coated magnetic beads (i.e., EGFR) and subsequently pulled out with a magnet. (B)
iSUF stage 1 purification performance for different biofluids. Cell supernatant (CCM), urine, and serum took
80, 100, and 120 min to obtain up to 99% efficiency of free protein and nucleic acid removal.
tion depends on the hollow fiber membrane pore size (MWCO), which should be large enough to permeate
proteins and free nucleic acids while small enough to retain EVs. During the enrichment step, freely permeable
molecules are partially removed. To remove the remaining contaminants, a diafiltration step with PBS is neces-
sary. The diafiltration processing time is proportional to the biofluid volume in the system35, so diafiltration
started with a total biofluid volume of 7 mL, which was the sum of the dead volume of the self-build TFF system
(2 mL in the product container) and 5 mL remaining in the different tubing of the setup. Liquid in the tubing
was necessary to protect the EVs from drying out and to enable constant volume diafiltration. Hence, CCM and
urine were pre-enriched to a total volume of 7 mL. For the processing of serum, 0.5 mL of sample was diluted to
a total volume of 7 mL in PBS and then processed with diafiltration. The input flow rate was kept at 35 mL/min
using a peristaltic pump (Cole-Parmer, Vernon Hills, IL). The sample volume after stage 1 was approximately
2 mL (dead volume of the TFF system). At stage 2, ultra-centrifugal units with 10 kDa MWCO were used to
further enrich the samples to 100 μL at 3000×g for 20 min. For specific isolation of subpopulations of EVs, stage
3 of iSUF, streptavidin-coated magnetic beads were functionalized with biotinylated antibodies (e.g., EGFR,
EpCAM, HER2) overnight at 4 °C to target tEVs. 100 μL of the processed sample (after stage 2) was incubated
with the antibody-coated beads for 1 h at RT. The efficiency of the iSUF platform for isolating tEVs was evaluated
using flow cytometry and total internal reflection fluorescent (TIRF) microscopy. EVs were also characterized
for their size, concentration, morphology, and molecular content (e.g., protein, RNA).
Processing biofluids using ultracentrifugation (UC). CCM, serum, and urine samples were filtered
using a syringe filter (pore size: 1.0 μm, Tisch Scientific, North Bend, OH) and transferred to ultracentrifuge
tubes (Beckman Coulter, Brea, CA) gently using a syringe and blunt needle (Becton, Dickinson and Company,
Franklin Lakes, NJ). Ultracentrifuge tubes were sealed with a cordless tube topper (Beckman Coulter) after
Scientific Reports | (2021) 11:8034 | https://doi.org/10.1038/s41598-021-86910-y 3
Vol.:(0123456789)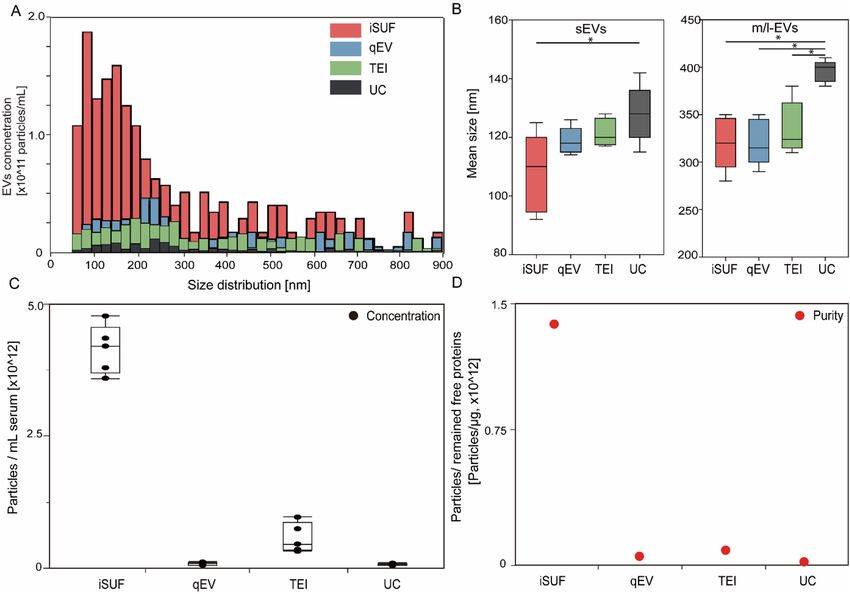
www.nature.com/scientificreports/
balancing, then were placed in a Type 55.2 Ti rotor (Beckman Coulter) and centrifuged in the Optima L-80 XP
ultracentrifuge (Beckman Coulter) for 90 min at 4 °C at 100,000×g. The supernatants were discarded carefully
after UC, and pellets were re-suspended in 100 μL of PBS.
Processing biofluids using commercially available EV isolation kits. Using the Total Exosome Iso-
lation method (TEI, Invitrogen, Carlsbad, CA), EVs were isolated from 0.5 mL serum according to the manu-
facturer’s instructions. Briefly, 0.5 mL of serum was mixed with a proprietary reagent provided in a kit and incu-
bated for 30 min at 4 °C. After mixing, the sample was centrifuged at 10,000×g for 10 min at RT. EVs pellets were
resuspended in 100 μL PBS. For size-exclusion chromatography, 0.5 mL serum was loaded into a qEV column
(Izon Science, Medford, MA), and flushed with PBS, fractions 7–12 were collected and pooled in 3 mL according
to the manufacturer’s instructions.
EV quantification. The size and concentration of EVs were measured using a tunable resistive pulse sensing
(TRPS) method (qNano, Izon Science). Samples were filtered before processed in the qNano instrument using
a 1-μm syringe filter (Tisch Scientific, North Bend, OH). 45 μL of biofluid was pipetted into different nanopore
stretchable membranes (NP150, NP300, NP600, NP800, and NP1000 from Izon Science) to cover the wide size
range of EVs36. A pressure of 1 kPa and different voltages (0.38 V, 0.32 V, 0.26 V, 0.18 V and 0.12 V) were applied.
Polystyrene nanoparticles of different known sizes and concentrations were used for calibration (CPC70, 70 nm;
CPC100, 100 nm; CPC200, 200 nm; CPC400, 400 nm; CPC800, 800 nm; CPC1000, 1000 nm from Izon Science,
Medford, MA). EVs with a size range of 70–1000 nm were characterized.
Immunofluorescence staining. After the second stage of iSUF, purified EVs were incubated with anti-
body-coated magnetic beads for 1 h. Capture antibodies included EGFR, EpCAM, and HER2. Then the captured
EVs on the beads were blocked with 3% (w/v) BSA and 0.05% (v/v) Tween 20 in PBS for 1 h at RT. Finally,
EVs were stained with HER2-PE monoclonal antibody (#98710S, Cell Signaling Technology, Danvers, MA),
CD24-Alexa Fluor 594 monoclonal antibody (#NB10077903AF594, Novus Biologicals), CD63-Alexa Fluor 488
monoclonal antibody (#sc-5275, Santa Cruz Biotechnology, Dallas, TX), and CD9-Alexa Fluor 594 monoclonal
antibody (#sc-59140, Santa Cruz Biotechnology).
Molecular beacon design and quantification. Molecular beacon (MB) (listed 5′–3′) targeting miR-21
used in this study was T+CA A+CA/iCy3/+TCA+GT+C T+GA TAA GCT AAC TTA TCA GAC TGA/3BHQ_2.
Locked nucleic acid (LNA) nucleotides (positive sign (+) bases) were incorporated into oligonucleotide strands
to improve the thermal stability and nuclease resistance of MBs for incubation at 37 °C. The designed MBs were
custom synthesized and purified by Sigma-Aldrich (Burlington, MA). An aqueous solution of MBs in PBS was
vigorously mixed with a lipid formulation of dioleoyl-3-trimethylammonium propane (DOTAP), cholesterol,
phosphatidylcholine (POPC), and 1, 2-distearoyl-sn-glycero-3-phosphoethanolamine-poly(ethylene glycol)
(DSPE-PEG) in 200 proof ethanol, and then sonicated for 5 min using an ultrasonic bath. The MB/lipid mixture
was subsequently injected into PBS, vortexed, and sonicated for 5 min. Finally, it was dialyzed with a 20 kDa
MWCO dialysis bag to remove free MBs. After EVs were captured on magnetic beads, they were incubated with
the prepared MBs for 2 h at 37 °C before imaging.
Flow cytometry and total internal reflection fluorescence (TIRF) microscopy. tEVs from U251
GBM cells were stained with a lipophilic fluorescent dye, SP-DiOC18(3) (Thermo Fisher Scientific) for 20 min,
the excess dye was washed out using TFF. 100 μL fluorescent EVs (~ 1011 particles/mL) were then spiked into
500 μL of serum (~ 1012 particles/mL) and 100 mL of urine (~ 109 particles/mL) from healthy donors. Each of
the samples was processed by iSUF and recovered in 100 μL of PBS (stage 1–3). Non-spiked fluorescent tEVs
were also captured on functionalized beads as a positive control. After washing with PBS, the captured EVs
were analyzed by imaging flow cytometry (Amnis, ImageStreamX Mark II Imaging Flow Cytometer, Luminex-
corp, Austin, TX); also images were taken using a TIRF microscope (Eclipse Ti Inverted Microscope System,
Nikon, Melville, NY) with a 100 × oil immersion lens. For comparison, samples were also processed by UC and
resuspended in 100 μL PBS. For total RNA quantification, captured EVs were lysed, and RNA was extracted and
quantified using the same procedures mentioned above.
Definition of terms used in this study.
CTFF × VTFF
TFF Recovery Rate (%) = × 100% (1)
CE0 × VE0
where VE0 and CE0 are the initial volume and concentration of the sample; VTFF (in 2 mL) and CTFF (measured
by qNano pore size [NP150, NP300, NP600, NP800, and NP1000]) are the final volume and concentration of
the TFF product.
CPt × Vt
Remaining Protein (%) = × 100% (2)
CP0 × V0
where V0 and CP0 are the initial volume of the sample and concentration of free proteins in the sample, respec-
tively; Vt and CPt are the volume of the TFF retentate and concentration of free proteins in the retentate at a
specified time t, respectively. Concentration of free proteins was measured using the bicinchoninic acid (BCA)
Scientific Reports | (2021) 11:8034 | https://doi.org/10.1038/s41598-021-86910-y 4
Vol:.(1234567890)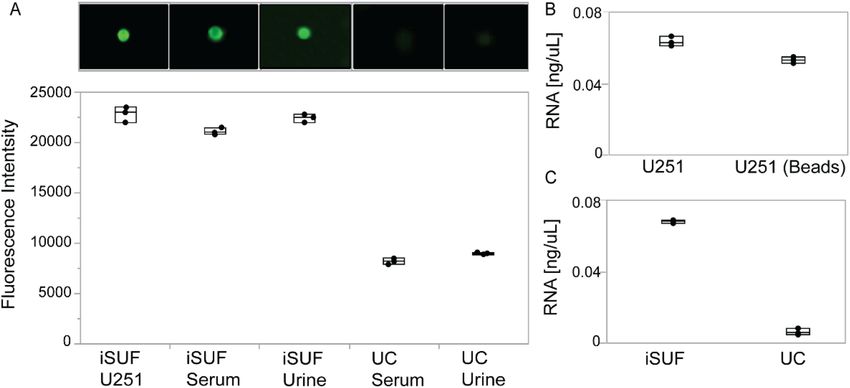
www.nature.com/scientificreports/
assay. The free protein removal efficiency can be calculated by subtracting the percentage of remaining protein
in the final TFF product from 100%.
CEf
Enrichment Factor = (3)
CE0
where CE0 is the EV concentration in the initial sample; CEf is the EV concentration in the final iSUF product.
Concentration of samples were measured by qNano pore size [NP150, NP300, NP600, NP800, and NP1000]).
CEf × VEf
Recovery Rate (%) = × 100% (4)
CE0 × VE0
where VE0 is the initial volume of the product; VEf is the volume of the final iSUF product.
CEf
Purity = × 100% (5)
CPf
where CEf is the final concentration of the iSUF product (in 100 μL); CPf is the remained free protein concentra-
tion in the product.
σ
Coefficient of variation =
µ
× 100% (6)
The coefficient of variation (CV) is a measure of relative variability. It is the ratio of the standard deviation
(σ) to the mean (μ).
Statistical analysis. Data are expressed as the mean ± STD. A significant test between different mean values
was evaluated using one-way ANOVA in JMP Pro 16 software provided by The Ohio State University. Differ-
ences between samples were considered statistically significant for p < 0.05.
Exponential simulation. Curve fitting and probability distribution calculation were conducted using
exponential simulation in JMP Pro 16. The goodness of fit test was validated using Kolmogorov D. Hypothesis is
the data comes from the exponential distribution (significance level α = 0.05).
Results
Optimization of the iSUF platform. To overcome current limitations of the enrichment and purification
of EVs and on-demand EV subpopulation characterization, we developed the iSUF platform (Fig. 1 A) which
includes three stages: (1) tangential flow filtration (TFF) for the enrichment and purification of EVs, (2) centrifu-
gation for further enrichment of EVs, and (3) immunomagnetic affinity selection for desired EV subpopulation
isolation. We used the iSUF platform to process various volumes (0.5–100 mL) of different biofluids (CCM,
serum, and urine).
To design stage 1, many parameters of TFF processing required optimization, including the selection of
membrane pore size (MWCO), sample processing temperature, sample flow rate, pressure, and sample protein
concentration. We tested membrane filters with two MWCO sizes (300 and 500 kDa) to determine the optimal
MWCO that maximizes the removal of free proteins and nucleic acids while reducing processing time. Our
experiments showed that 500 kDa filter membranes were able to remove up to 99% of free proteins with over
99% EV recovery rate (Eq. 1, Supplementary Fig. 1). When a 300 kDa membrane filter was used, only 80% of
free proteins were removed. Moreover, a 500 kDa membrane filter was chosen since it processed samples 2–3
times faster than a 300 kDa membrane filter (Supplementary Table 1). The TFF stage 1 of iSUF ran at 4 °C to
minimize EV degradation37. We further tried to optimize sample processing time, which was highly dependent
on the flow rate. The flow rate was linearly associated with the shear rate generated by the filter based on the
manufacturer’s protocol (Repligen), which exerted a shear force on the EVs. Then, we used a flow rate of 35 mL/
min to maintain a shear rate below 5000/s38. High flow rates increased the system pressure, mainly when the
protein concentration of the sample was high (> 15 mg/mL). We kept the pressure of the system below 68.9 kPa
to avoid leakage and maximize the lifespan of the 500 kDa filter. We used dilutions of fetal bovine serum (FBS)
to test the effect of protein concentration on system pressure at 35 mL/min. Our results showed that protein
concentration must be equal or lower than 15 mg/mL to maintain the pressure of the system below 68.9 kPa to
protect the filter (Supplementary Fig. 2).
At stage 2 of iSUF, EVs were loaded into centrifugal filter units and were spun down at 3000×g. We compared
the recovery rates of EVs and processing time for different filter pore sizes. A 3 kDa filter unit obtained over
99% recovery rate and took 60 min to spin down, while a 10 kDa unit obtained a 95% recovery rate in 20 min,
and a 30 kDa filter obtained only a 70% recovery rate and took 15 min to spin down (Supplementary Fig. 3). We
selected the 10 kDa filter unit to maintain a high recovery rate while reducing sample processing time. To enrich
tEVs (stage 3 of iSUF), we tested incubation of 3 μm magnetic beads with different concentrations of biotinylated
antibodies (10, 20, 100 μg/mL) for 1 h, 2 h, and 12 h at RT, and 4 °C. Overnight incubation with 20 μg/mL of
antibody was able to yield an optimal bead-antibody coverage. Then, we examined the volume ratio of beads to
EVs at 5 μL/100 μL, 20 μL/100 μL, and 80 μL/100 μL during the bead/tEVs incubation step. The 20/100 μL ratio
achieved the highest bead-tEVs capture efficiency (> 90%).
Scientific Reports | (2021) 11:8034 | https://doi.org/10.1038/s41598-021-86910-y 5
Vol.:(0123456789)www.nature.com/scientificreports/
iSUF platform for processing biofluids. A flow rate of 35 mL/min for stage 1 of iSUF was applied since
the protein concentrations of the different biofluids were below 15 mg/mL (Supplementary Table 2). We tested
the ability of our platform to purify and enrich EVs from three different biofluids (i.e., CCM, serum, and urine;
Fig. 1B). 50 mL of CCM, and 100 mL of urine were enriched to 7 mL. Subsequently, PBS diafiltration buffer was
used to remove the remaining protein contaminants from CCM and urine in 80 min and 100 min, respectively.
The percentage of remaining protein is defined as the mass of free proteins in the TFF retentate at a specified
time divided by their initial mass in the sample (Eq. 2). For serum, the initial high concentration of proteins
(> 80 mg/mL) required an initial dilution of 0.5 mL of the sample in 7 mL of PBS. Subsequently, PBS diafiltration
buffer was used to remove the remaining protein contaminants from serum in 120 min. We first tested iSUF with
a 10% BSA solution for which an SDS-PAGE gel showed extensive removal of albumin (Supplementary Fig. 4).
Moreover, analysis of the purified samples by an SDS-PAGE gel indicated that iSUF removed BSA from CCM,
human serum albumin (HSA) and globulins from serum, and Tamm-Horsfall glycoprotein (THF) and HSA
from urine. (Supplementary Fig. 5, 6, 7).
Concentration, size distribution and microscopy characterization of EVs. For 50 mL of CCM,
0.5 mL of serum, and 100 mL of urine, the enrichment factors were 489 ± 18, 4.8 ± 0.1, and 942 ± 19, respectively
(n = 5; Fig. 2A) (Eq. 3). Accordingly, the EV recovery rate (the ratio of the total number of EVs post-processing
by iSUF to the total number of EVs pre-processing) was 98% ± 3.6%, 96% ± 2.0% and 94% ± 1.9% for CCM,
serum, and urine, respectively (Eq. 4). Considering that EVs are heterogeneous in size, we also tested the enrich-
ment factor across a wide size range of EVs (70 nm–1 μm) in CCM with similar results (n = 5; p > 0.05; Fig. 2B).
Moreover, the EV concentrations obtained by iSUF was greater than the concentrations obtained by UC. This
difference was consistent across the 70 nm–1 μm size range (n = 5; p < 0.05; Fig. 2C), with iSUF enriching EVs
at two to three orders of magnitude higher than UC (approximately 1011 EVs concentrated by iSUF and 109 for
UC). Similar results were obtained with comparisons for the enrichment of EVs present in serum and urine.
With iSUF, EVs from serum and urine were enriched almost at the same level (1012 EVs/mL; Fig. 2D). We con-
firmed the presence of EVs by using atomic force and electron microscopy on the different biofluids processed.
The majority of isolated EVs exhibited a round morphology with heterogeneous size distribution. Cryo trans-
mission electron microscopy images (TEM) images of isolated EVs showed the presence of a double-layered
lipid membrane, a representative characteristic of EVs39 (Fig. 2E, F).
To further test our iSUF platform, we performed comparative studies with different commercially available
EV isolation methods: qEV, TEI, and UC. 0.5 mL of serum from healthy donors were processed with different
EV isolation platforms. EVs have shown a comparable size range for all platforms, but iSUF obtained a higher EV
concentration within the 70 nm–1 μm size range (Fig. 3A, Supplementary Fig. 8). Notice that all plots presented
a right-skewed distribution. Moreover, we plotted the probability distribution as reported previously (Supple-
mentary Fig. 9)40, which showed an exponential decay trend for all the isolation methods that were verified by
the Kolmogorov D test (p > 0.05)40. However, qEV, TEI, and UC did not show this trend clearly (Fig. 3A) due to
large losses of EVs during the isolation process. Following the MISEV2018 guidelines, subpopulations of EVs can
be described independently of the EV biogenesis pathway36. Such that subpopulations of small EVs (sEVs) and
medium/large EVs (m/l-EVs) can be defined based on size, with EVs smaller than 100 nm or 200 nm as sEVs and
EVs larger than 200 nm as m/l-EVs. Considering that the stretchable nanopore membranes NP150 and NP300
cover the corresponding size range for sEVs and m/l-EVs, respectively41. we compared the mean size of these EV
subpopulations by different EV isolation methods (Fig. 3B). For sEVs, EVs processed by iSUF were significantly
smaller than UC (n = 5; p < 0.05). For m/l-EVs, EVs purified by UC were larger than all other techniques (n = 5;
p < 0.05). Then, we compared the total concentration and purity of isolated EVs using different methods. iSUF
enriched EVs significantly more efficiently than all the tested methods (n = 5; p < 0.05; Fig. 3C). The concentration
of EVs enriched by iSUF was on average 51, 7, and 56 times higher than qEV, TEI, and UC. The purity of isolated
EVs was normalized and evaluated in terms of the ratio between EV concentration and remaining contaminating
protein concentration present in samples after purification using the different methods (Eq. 5). The purity of the
isolated EVs by iSUF was 100–10,000 times higher than the different tested methods (Fig. 3D).
Repeatability experiments for the EV recovery rate and protein removal efficiency from samples processed
by iSUF were also conducted (CCM, n = 10; serum, n = 10; Urine, n = 10). Both sEVs and m/l-EVs in all biofluids
demonstrated a mean value above 94% for the EV recovery rate. The recovery rate of sEVs in CCM, serum, and
urine exhibited 4.2%, 3.7%, and 2.4% coefficient variations, respectively, while m/l-EVs showed 3.7%, 3.3%, and
2.5% coefficient variations (Eq. 6). Protein removal efficiencies were also tested, CCM, serum, and urine pre-
sented up to 99% removal efficiency with coefficient variations of 0.9%, 4.0%, and 2.1% (Supplementary Fig. 10).
Molecular content quantification and characterization of EVs. We quantified the total amount of
protein and RNA present in EVs isolated by iSUF. For CCM, the quantity of RNA obtained was 11 ± 8.2 ng/mL,
thus giving a ninefold higher concentration of RNA when compared to UC (Fig. 4A). For protein analysis, the
protein concentration was 6 ± 1.8 μg/mL, almost eightfold more protein obtained than when the same biofluid
was processed by UC (Fig. 4B). Total RNA and protein quantification were carried out for serum and urine
from 5 healthy donors. 0.5 mL of serum and 100 mL of urine processed by iSUF produced 54 ± 40 ng/mL and
0.3 ± 0.1 ng/mL of RNA, respectively (Fig. 4C). The protein concentration was 1250 ± 480 μg/mL for serum and
3.1 ± 3.0 μg/mL for urine (Fig. 4D). The differences in protein concentration of EVs in original CCM, processed
by UC, and processed by iSUF were also demonstrated using CD63 and CD9 western blot analysis. Also, the
expression level of CD9 and CD63 in original urine and serum samples, and after iSUF processing demon-
strated superiority enrichment and purification performance of the iSUF (Fig. 4E). Full-length western blot
images are displayed in (Supplementary Fig. 11). Moreover, we compared the RNA content obtained from EVs
Scientific Reports | (2021) 11:8034 | https://doi.org/10.1038/s41598-021-86910-y 6
Vol:.(1234567890)www.nature.com/scientificreports/
Figure 2. iSUF enrichment performance and characterization of EVs separated from CCM, serum and urine
using iSUF. (A) Enrichment factor (EF) for EVs present in CCM, urine, and serum after iSUF (n = 5 for each
biofluid; p > 0.05) (mean ± STD). Enrichment factors (EFs) were calculated as the ratio of EV concentration in
biofluids present before and after iSUF processing. CCM was processed for U-251, MCF-7 and A375 cell lines.
(B) EFs for different size ranges of EVs for CCM (n = 3; p > 0.05) (mean ± STD). (C) qNano measurements
of the size distribution and concentration of EVs in the original CCM, after iSUF processing, and after UC
processing. The EV concentration after iSUF was significantly higher than in the original CCM and after UC
processing (n = 3; p < 0.05) (mean ± STD). (D) qNano measurements of the size distribution and concentration
of EVs in serum and urine after iSUF processing. (E) AFM and SEM images of EVs from U251 CCM after iSUF
processing and UC processing. Images were also obtained for EVs in serum and urine after iSUF processing. (F)
Transmission-EM images of EVs present in CCM after iSUF processing.
Scientific Reports | (2021) 11:8034 | https://doi.org/10.1038/s41598-021-86910-y 7
Vol.:(0123456789)www.nature.com/scientificreports/
Figure 3. Comparison of size distribution and purity of EVs isolated with different platforms. (A) Size
distribution of EVs isolated from serum using different platforms. iSUF demonstrated the highest EV
concentration within the 70 nm–1 μm size range. (B) Left. Mean size boxplot for small EVs (sEVs, < 200 nm,
measured by NP150). Right. Mean size boxplot for medium/large EVs (m/l-EVs, > 200 nm, measured by
NP300). (C) Concentration of isolated EVs using different platforms. Black boxplots were the absolute
concentration of EVs isolated from 0.5 mL of serum. (D) Red dots were purities defined as the EV concentration
divided by the remaining free protein concentration. iSUF isolated EVs from serum most efficiently with high
purity (n = 5; p < 0.05) (mean ± STD), qEV yielded pure EVs, but at a lower concentration, TEI isolated more EVs
but at relatively low purity, and UC recovered EVs with the lowest concentration and purity.
enriched from 0.5 mL of serum using different commercially available methods (Supplementary Table 3). The
total RNA content obtained using iSUF was 54 ± 41 ng, which was significantly higher than other methods that
only obtained 10 ± 9.8 ng (Fig. 4F).
Next, we processed different volumes of serum and urine with iSUF to identify the equivalent volumes of bio-
fluid that will produce comparable concentrations of EVs, total RNA, and total protein. We started with 0.5 mL of
serum and different volumes of urine (i.e., 100, 75, 65, 10 mL). We found that the enriched concentrations of EVs
were comparable (~ 1012 particles/mL, Supplementary Fig. 12). The total RNA content obtained from EVs from
serum and urine also exhibited comparable values of 60 ± 35 ng and 75 ± 40 ng, respectively. However, analysis of
protein content of the isolated EVs from both biofluids showed that the protein content of EVs isolated from urine
was tenfold lower than the protein content of EVs in serum, which was 0.4 ± 0.1 mg and 40 ± 10 mg, respectively.
Immunomagnetic affinity selection of the iSUF platform. tEVs are outnumbered by EVs from non-
tumor cells that require removal to perform accurate molecular a nalysis42. One way to isolate tEVs is to exploit
the presence of specific surface markers43. Our iSUF platform enables the separation of subpopulations of EVs
by capturing them on magnetic beads through immunoaffinity. To demonstrate our approach, we used a model
system that consisted of spiking fluorescently labeled tEVs from a cancer cell line (i.e., U251 EVs) in 0.5 mL of
serum and 100 mL of urine from healthy donors (n = 3). 3-μm magnetic beads were functionalized with EGFR
as the capture antibody. All samples were processed through all stages of iSUF, and the captured subpopulation
of EVs was characterized and quantified using TIRF and imaging flow cytometry (Fig. 5A). A comparable fluo-
rescent signal was obtained between the positive control (tEVs from U251 cells) and spiked samples processed
in serum and urine (88% ± 1% for serum, and 93% ± 2% for urine), which verified the high recovery efficiency
and their purity of tEVs. The biofluids spiked with tEVs were also processed by UC, which yielded a significantly
lower fluorescent signal (3.1 ± 0.1 times lower, Fig. 5A). Furthermore, to determine tEV RNA isolation efficiency
by iSUF, lysed U251-EVs (positive control) and bead-isolated U251-EVs were extracted. iSUF showed over 90%
RNA isolation efficiency for the EGFR+ tEVs (Fig. 5B). Moreover, the RNA content of bead-extracted tEVs from
serum using the iSUF platform was sevenfold higher than UC, which was mainly attributed to the high yield of
Scientific Reports | (2021) 11:8034 | https://doi.org/10.1038/s41598-021-86910-y 8
Vol:.(1234567890)www.nature.com/scientificreports/
total EVs recovered in iSUF (Fig. 5C). The high RNA content of tEVs from serum isolated using iSUF also con-
firmed the ability of iSUF to enrich and retrieve tumor targets from mixed populations of EVs.
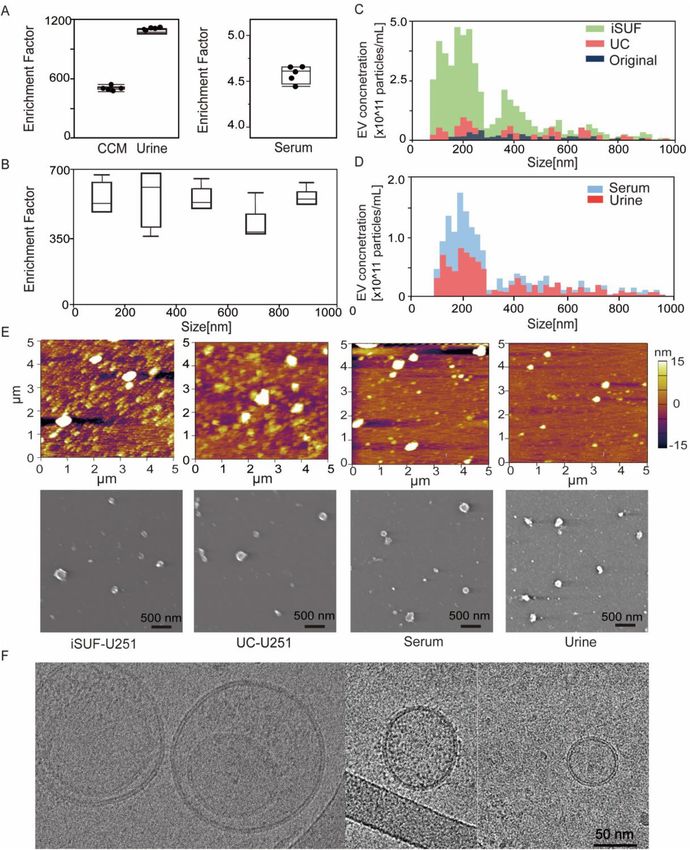
Detection of proteins and miRNA in EVs from clinical samples. The emergence of targeted thera-
pies require a precise characterization of the molecular subtypes of a patient’s tumor44. For BC patients (e.g.,
luminal A/B, triple-negative), the molecular subtype is typically determined by testing a tissue biopsy for the
presence or absence of three essential proteins: estrogen receptor (ER), progesterone receptor (PR), and human
epidermal growth factor receptor 2 (HER2)45. However, a tissue-based tumor profile is subject to sampling bias,
provides only a snapshot of tumor heterogeneity, and cannot be obtained r epeatedly46. These limitations restrict
early cancer detection and significantly contribute to the overdiagnosis and overtreatment of BC patients47. The
analysis of EVs present in cancer patients biofluids provides a minimally invasive method to quantify differ-
ent biomarkers that would enable precise diagnosis or response to t reatment48. To test the potential use of the
iSUF platform in screening biomarkers for BC, we processed 0.5 mL of serum from 10 metastatic BC patients
and quantified the expression levels of HER2, CD24, and miR21 on patient isolated EVs49–51. After stage 3 of
iSUF, magnetic beads were isolated using a magnet and incubated with detection antibodies and MBs. Then, the
magnetic beads were processed with imaging flow cytometry and TIRF microscopy. Similar volumes of serum
from healthy donors were processed and analyzed. The age of the healthy donors was between 21 and 68 years
old. Although the age range was wider than from our BC patient cohort, a comparison of levels of expression
for HER2, CD24, and miR21 between healthy donors samples did not show statistically significant differences
(p > 0.05, Supplementary Fig. 13. We obtained representative images and histograms that quantify the number
of beads and their corresponding fluorescent intensities (Fig. 6A, B) for BC patient and healthy donor samples.
Both protein and miRNA show significantly higher expression in BC patient samples (p < 0.05; Fig. 6B), which
suggested that iSUF can differentiate tumor biomarkers (Supplementary Table 4). Moreover, we have character-
ized the CD9 and CD63 levels of protein expression in serum samples from both cohort of samples. Although in
this case, similar levels of expression were obtained (p > 0.05, Fig. 6A, B).
Discussion
Recently, EVs have been explored for diagnostic and therapeutic applications, including liquid biopsy assays
for cancer diagnostics, and nanocarriers for drugs and nucleic a cids52,53. The large number of tEVs compared
to other rare biomarkers (i.e., circulating tumor cells, CTCs) makes them more statistical reliable54. Innova-
tive methods developed for the enrichment and purification of EVs should remove all contaminants (e.g., free
proteins), have a high yield, work amongst different biofluids, and maintain the integrity of the EVs. We have
engineered a new platform that includes a TFF enrichment and purification stage, a centrifugal-unit enrichment
stage, and a magnetic separation stage for specific isolation of subpopulations of EVs (e.g., tEVs). In stages 1 and
2, iSUF performs enrichment and purification of all EVs (e.g., tEVs and nEVs). In stage 3, tEVs are isolated based
on their tumor-specific surface markers. 300 kDa and 500 kDa TFF filters were initially selected for this study
because the molecular weights of the major free proteins in CCM (e.g., BSA, 65 kDa), serum (e.g., HSA, 65 kDa)
and urine (e.g., THP, 98 kDa) were below 300 kDa55–57. After testing, a 500 kDa TFF filter was finally chosen for
subsequent experiments because of its minimal EV loss and faster processing time (~ 2 h).
Different biofluids required different TFF diafiltration buffer volumes and different scale of TFF hollow
fiber filters to remove most contaminants. CCM and urine contain relatively low concentrations of protein
contaminants58,59, so a small total diafiltration buffer volume was required to remove the majority of free proteins.
Unlike CCM and urine, the serum has a significant amount of free p roteins60. Therefore, a large total diafiltration
buffer was necessary to remove the free protein in serum. iSUF was able to achieve up to 99% of free protein
removal efficiency. Free proteins removed by iSUF were shown as decreased bands on the SDS-PAGE gel. Other
bands were increasing on the SDS-PAGE gel because those correspond to different proteins present on EVs,
which were enriched by the iSUF61–65. Also, there are very-low-density lipoproteins (VLDL)) that overlap in size
with EVs that also might be enriched2,66,67.
Although TFF can concentrate and purify samples, the final product volume is mostly dependent on the dead
volume of the specific TFF system. Therefore, further enrichment is necessary to concentrate the samples (e.g.,
spin down to 100 μL) for applications such as the diagnosis of rare biomarkers68. Centrifugal units with different
MWCOs (3, 10, and 30 kDa) were evaluated in terms of processing time and yield in our study. A larger MWCO
size required shorter centrifugation time, but more EVs were lost because prolonged high-speed centrifugation
elongated EVs into an oval shape which made them squeeze through the filter membrane69,70. The centrifugal
unit with the 10 kDa MWCO was optimal with the shortest processing time and highest yield.
We also compared EVs purified from serum and urine samples of healthy donors. EVs from urine and serum
can serve as prognosis biomarkers for clinical analysis71,72. Serum is the most commonly used biofluid in the
clinical setting with the highest EV concentration73. Compared to serum, urine collection is minimally invasive
and can be obtained in larger volumes74, but it usually suffers from much lower EV concentration75. Interestingly,
using our iSUF platform, the EV RNA concentration in the final products of urine samples (originating from
~ 100 mL of collected sample volume) were comparable to those of serum samples (originating from 0.5 mL of
collected sample volume). This suggests that clinical diagnosis by urinary EVs is possible. However, there is still
a concern towards urinary EV collection because of large variabilities in the urine volume and its EV concentra-
tion. More efforts are needed to come up with a gold standard protocol for urine collection and processing. For
protein in urinary EVs, we found that the amount of protein was lower than the amount of protein obtained
from serum EVs, which might be explained by the degradation of EV membrane proteins by urine p roteases76.
In this study, we compared the performance of iSUF with three different EV isolation techniques (TEI,
qEV, and UC) to determine EV concentration, purity, and quantity of RNA recovered. As other authors have
Scientific Reports | (2021) 11:8034 | https://doi.org/10.1038/s41598-021-86910-y 9
Vol.:(0123456789)www.nature.com/scientificreports/
Scientific Reports | (2021) 11:8034 | https://doi.org/10.1038/s41598-021-86910-y 10
Vol:.(1234567890)www.nature.com/scientificreports/
▸ Figure 4. Characterization of protein and RNA content of EVs isolated from different biofluids. (A) Quantity of
total RNA extracted from CCM-EVs using UC and iSUF (n = 6; p < 0.05). (B) Comparison of proteins extracted
from CCM-EVs using UC and iSUF (n = 6; p < 0.05). (C) Quantification of total RNA extracted from serum and
urine EVs isolated by iSUF. (D) Quantification of EV proteins isolated from serum and urine EVs isolated by
iSUF. (E) Western blot analysis of CD63 and CD9 expression in original CCM, CCM-EVs processed using iSUF
and UC, original serum and urine, serum and urine-EVs processed using iSUF. The expression level of CD63
and CD9 was calculated using an equal mass (40 μg) of protein lysates from samples. (F). Total RNA of EVs
isolated using different EV isolation methods. Black boxplots were the absolute amount of RNA isolated from
0.5 mL of serum. iSUF isolated the most RNA contents from serum EVs (n = 5; p < 0.05) (mean ± STD).
Figure 5. Characterization of stained tEVs isolated from U251-CCM and spiked in different biofluids.
(A) Upper. Fluorescence images of tEVs on magnetic beads using TIRF microscopy. Lower. Comparison of
fluorescence intensities quantified using imaging flow cytometry. Stained U251-EVs isolated by iSUF was
a positive control. tEVs isolated from serum and urine samples using iSUF demonstrated no significant
difference (n = 3; p > 0.05), while UC isolated tEVs differed with iSUF and the positive control (n = 3; p < 0.05)
(mean ± STD). (B) Quantification of total RNA isolated from U251-EVs before and after bead extraction showed
no differences (n = 3; p > 0.05). (C) Total RNA extracted from serum samples using iSUF was significantly higher
than using UC (n = 3; p < 0.05) (mean ± STD).
discussed77,78, we found that UC, a traditional method for EV isolation, has raised concerns about the integrity,
yield, and purity of EVs after purification. Interestingly, we found UC-isolated EVs were larger than other plat-
forms, one possible explanation is the presence of extensive levels of protein aggregates that cause bias. For our
UC method, washing steps using multi-rounds ultracentrifugation were not applied, since it was shown that
purity of the samples did not increase significantly when adding washing steps, and a significant loss of enriched
EVs could occur55,79–83. Moreover, although qEV obtained a relatively pure product, its recovery rate was low; TEI
obtained a relatively higher EV number, while retaining massive amounts of free protein (Fig. 3C, D). Therefore,
low EV concentration and purity will impact the accuracy of molecular analysis of EVs84.
We used the MISEV 2018 guidelines to define EVs: small EVs (sEVs) and medium and large EVs (m/l-EVs)36.
Following these definitions, we found that the concentration and average size of EVs in patient samples and
healthy controls varied (Supplementary Table 4). Different factors may explain these differences. Subtypes and
stages of BC in the patient cohort, may contribute to the difference in the metrics. Moreover, we obtained our
patient samples from a biobank, we had minimal control of the storage conditions, thus it was possible that some
degradation of the samples could occur. It is known that factors such as material of the container, temperature
of storage, and cycles of freezing and thawing may also influence the concentration and mean size of E Vs85–88.
Considering all these aspects, the size distributions and concentrations of EVs that we obtained for the different
samples are within the reported values in the literature. Previously concentrations of EVs in serum from cancer
patients are between 1 09 and 1011 particles/mL89–92.
Differentiating EV particles and other non-EV particles (e.g., lipoproteins) when measuring size distribution
and concentration is challenging for all current methods, including TRPS and nanoparticle tracking analysis
(NTA)66,93–97. This is because the size range of different lipoproteins [e.g., 7–13 nm (HDL); 21–27 nm (LDL);
and 30–90 nm (VLDL)]98 may overlap with the reported size ranges for sEVs and m/l-EVs36. Thus, current
methods for EV size characterization and concentration have certain limitations88,99–101. For iSUF, we used the
TRPS method to measure size distribution and concentration of EVs. Different nanopore stretchable mem-
branes (NP150, NP300, NP600, NP800, and NP1000) were selected, covering a broad size range of EVs such
as 70–1000 nm102. The 70 nm cut-off were chosen since EVs in samples processed by iSUF, exhibited a range
Scientific Reports | (2021) 11:8034 | https://doi.org/10.1038/s41598-021-86910-y 11
Vol.:(0123456789)www.nature.com/scientificreports/
Scientific Reports | (2021) 11:8034 | https://doi.org/10.1038/s41598-021-86910-y 12
Vol:.(1234567890)www.nature.com/scientificreports/
◂Figure 6. Characterization of tEVs isolated breast cancer (BC) patient serum using iSUF. (A) Left.
Characteristic fluorescence images of HER2, CD24, miR21, CD63, and CD9 expression on isolated EVs
immobilized on magnetic beads from BC patients and healthy donors. Right. Fluorescence intensity histograms
of HER2, CD24, miR21, CD63, and CD9 of isolated EVs for BC patients (n = 10) and healthy donors (n = 14).
(B) Total fluorescence intensity quantification of HER2, CD24, miR21, CD63, and CD9 expression level on
isolated EVs from BC patients and healthy donors. Patients demonstrated higher expression levels of HER2,
CD24, and miR21 than healthy donors (p < 0.05). Patients and HDs demonstrated similar expression level of
CD63 and CD9 (p > 0.05). P patient; H healthy donor.
above 70 nm. Choosing a small stretchable membrane such as NP100 and NP80 that have limits of detection of
50 nm and 40 nm, respectively, did not change the size ranges of EVs in our samples after iSUF (Supplementary
Fig. 14). Thus, iSUF intrinsically filters out the majority of lipoproteins and EVs that overlap in size. This effect
is beneficial since we are trying to characterize EVs with minimal contribution of lipoproteins. We consider the
70 nm cut-off used for the TRPS measurements as appropriate. Moreover, above this value the different charac-
terization metrics are considered accurate. The particle count measurements can verify this for each one of the
methods used in our study (Supplementary Fig. 15). A linear relationship indicates an accurate measurement30.
In Fig. 3, we found that the lower limit of detection varies for the different methods, indicating an intrinsic loss
of EVs during processing samples with different methods. However, iSUF shows better recovery for sEVs and
m/l-EVs. The wide upper range showed by UC could be indicative that we measure aggregates of EVs103–106. Our
measurements are in agreement with MISEV 2018 since sEVs, and m/l-EVs are in the 100–150 nm and larger
than 200 nm, r espectively36,63,107–111.
We are interested in the enrichment and isolation of tEVs to characterize tumor-related proteins and RNAs.
Like other immunoaffinity methods112–114, iSUF captured and isolated EVs using specific tumor surface proteins.
iSUF differentiated metastatic BC patients from healthy donors by detecting significantly higher expression levels
of proteins and RNA biomarkers present in EVs (e.g., HER2, CD24, and miR21). Based on previous reports,
HER2 and miR21 are cancer-associated protein and microRNA species, and are known to be overexpressed in
metastatic BCs115,116. Compared to miR21 and HER2, CD24 is relatively less investigated in BC but was previ-
ously identified as being released from BC stem cells117. Furthermore, a recent study indicated that serum CD24
is elevated among BC patients118. Moreover, it is important to note that one of these biomarkers may not be a
reliable predictor of BC alone. However, the combination of several biomarkers can serve as a tool for BC risk
assessment.
In conclusion, iSUF was proposed for rapid, efficient, and specific isolation of EVs from different biofluids.
The EV recovery rate mean value was above 94%, with 90% tumor RNA isolation efficiency and negligible
concentrations of free proteins and nucleic acids. Although iSUF does not process a sample in the shortest time
(80–120 min), its versatility working with different biofluids, sample volumes, and high purity after sample
processing constitutes unmatched advantages over current methods used in the field. Overall, we found that the
iSUF platform isolated and enriched EVs from a scaled-up sample volume with high purity and yield in a sterile
and quick manner simultaneously, and isolated tEVs with high specificity, while other current methods could
not guarantee all of those conditions at the same time. Furthermore, we recognize that the iSUF platform has
potentially broad clinical applications beyond liquid biopsies for cancer diagnosis or monitoring.
Received: 15 May 2020; Accepted: 22 March 2021
References
1. Raposo, G. & Stoorvogel, W. J. Extracellular vesicles: Exosomes, microvesicles, and friends. J. Cell Biol. 200, 373–383 (2013).
2. Mathieu, M., Martin-Jaular, L., Lavieu, G. & Théry, C. Specificities of secretion and uptake of exosomes and other extracellular
vesicles for cell-to-cell communication. Nat. Cell Biol. 21, 9–17. https://doi.org/10.1038/s41556-018-0250-9 (2019).
3. Yáñez-Mó, M. et al. Biological properties of extracellular vesicles and their physiological functions. J. Extracell. Vesicl. 4, 27066.
https://doi.org/10.3402/jev.v4.27066 (2015).
4. Théry, C., Zitvogel, L. & Amigorena, S. Exosomes: Composition, biogenesis and function. Nat. Rev. Immunol. 2, 569–579. https://
doi.org/10.1038/nri855 (2002).
5. Cocucci, E., Racchetti, G. & Meldolesi, J. Shedding microvesicles: Artefacts no more. Trends Cell Biol. 19, 43–51. https://doi.
org/10.1016/j.tcb.2008.11.003 (2009).
6. Hessvik, N. P. & Llorente, A. Current knowledge on exosome biogenesis and release. Cell. Mol. Life Sci. 75, 193–208. https://doi.
org/10.1007/s00018-017-2595-9 (2018).
7. Filipazzi, P., Bürdek, M., Villa, A., Rivoltini, L. & Huber, V. Recent advances on the role of tumor exosomes in immunosuppres-
sion and disease progression. Semin. Cancer Biol. 22, 342–349. https://doi.org/10.1016/j.semcancer.2012.02.005 (2012).
8. Kahlert, C. & Kalluri, R. Exosomes in tumor microenvironment influence cancer progression and metastasis. J. Mol. Med. 91,
431–437 (2013).
9. Li, K., Chen, Y., Li, A., Tan, C. & Liu, X. Exosomes play roles in sequential processes of tumor metastasis. Int. J. Cancer 144,
1486–1495. https://doi.org/10.1002/ijc.31774 (2019).
10. Wang, J. et al. Multiple myeloma exosomes establish a favourable bone marrow microenvironment with enhanced angiogenesis
and immunosuppression. J. Pathol. 239, 162–173. https://doi.org/10.1002/path.4712 (2016).
11. Brock, G., Castellanos-Rizaldos, E., Hu, L., Coticchia, C. & Skog, J. Liquid biopsy for cancer screening, patient stratification and
monitoring. Transl. Cancer Res. 4, 280–290 (2015).
12. Li, A., Zhang, T., Zheng, M., Liu, Y. & Chen, Z. Exosomal proteins as potential markers of tumor diagnosis. J. Hematol. Oncol.
10, 175. https://doi.org/10.1186/s13045-017-0542-8 (2017).
13. Zhang, W. et al. Liquid biopsy for cancer: Circulating tumor cells, circulating free DNA or exosomes?. Cell Physiol. Biochem. 41,
755–768. https://doi.org/10.1159/000458736 (2017).
Scientific Reports | (2021) 11:8034 | https://doi.org/10.1038/s41598-021-86910-y 13
Vol.:(0123456789)www.nature.com/scientificreports/
14. Théry, C., Amigorena, S., Raposo, G. & Clayton, A. Isolation and characterization of exosomes from cell culture supernatants
and biological fluids. Curr. Protoc. Cell Biol. Chapter 3, Unit 3 22. https://doi.org/10.1002/0471143030.cb0322s30 (2006).
15. Li, P., Kaslan, M., Lee, S. H., Yao, J. & Gao, Z. Progress in exosome isolation techniques. Theranostics 7, 789–804. https://doi.
org/10.7150/thno.18133 (2017).
16. Momen-Heravi, F. in Extracellular Vesicles 25–32 (Springer, 2017).
17. Mol, E. A., Goumans, M. J., Doevendans, P. A., Sluijter, J. P. G. & Vader, P. Higher functionality of extracellular vesicles isolated
using size-exclusion chromatography compared to ultracentrifugation. Nanomedicine 13, 2061–2065. https://doi.org/10.1016/j.
nano.2017.03.011 (2017).
18. Yuana, Y., Levels, J., Grootemaat, A., Sturk, A. & Nieuwland, R. Co-isolation of extracellular vesicles and high-density lipoproteins
using density gradient ultracentrifugation. J. Extracell. Vesicl. https://doi.org/10.3402/jev.v3.23262 (2014).
19. Koh, Y. Q., Almughlliq, F. B., Vaswani, K., Peiris, H. N. & Mitchell, M. D. Exosome enrichment by ultracentrifugation and size
exclusion chromatography. Front Biosci Landmark Ed 23, 865–874. https://doi.org/10.2741/4621 (2018).
20. Furi, I., Momen-Heravi, F. & Szabo, G. Extracellular vesicle isolation: Present and future. Ann. Transl. Med. 5, 263–263. https://
doi.org/10.21037/atm.2017.03.95 (2017).
21. Gámez-Valero, A. et al. Size-exclusion chromatography-based isolation minimally alters extracellular vesicles’ characteristics
compared to precipitating agents. Sci. Rep. 6, 33641 (2016).
22. Kang, Y. T. et al. High-purity capture and release of circulating exosomes using an exosome-specific dual-patterned immuno-
filtration (ExoDIF) device. Nanoscale 9, 13495–13505. https://doi.org/10.1039/c7nr04557c (2017).
23. Rekker, K. et al. Comparison of serum exosome isolation methods for microRNA profiling. Clin. Biochem. 47, 135–138. https://
doi.org/10.1016/j.clinbiochem.2013.10.020 (2014).
24. Stranska, R. et al. Comparison of membrane affinity-based method with size-exclusion chromatography for isolation of exosome-
like vesicles from human plasma. J. Transl. Med. 16, 1. https://doi.org/10.1186/s12967-017-1374-6 (2018).
25. Yang, F., Liao, X., Tian, Y. & Li, G. Exosome separation using microfluidic systems: size-based, immunoaffinity-based and
dynamic methodologies. Biotechnol. J. https://doi.org/10.1002/biot.201600699 (2017).
26. Liga, A., Vliegenthart, A. D., Oosthuyzen, W., Dear, J. W. & Kersaudy-Kerhoas, M. Exosome isolation: A microfluidic road-map.
Lab Chip 15, 2388–2394. https://doi.org/10.1039/c5lc00240k (2015).
27. Im, H. et al. Label-free detection and molecular profiling of exosomes with a nano-plasmonic sensor. Nat. Biotechnol. 32,
490–495. https://doi.org/10.1038/nbt.2886 (2014).
28. Lin, J. et al. Exosomes: Novel biomarkers for clinical diagnosis. Sci. World J. 657086–657086, 2015. https://doi.org/10.1155/
2015/657086 (2015).
29. Jiang, L. et al. EpCAM-dependent extracellular vesicles from intestinal epithelial cells maintain intestinal tract immune balance.
Nat. Commun. 7, 13045. https://doi.org/10.1038/ncomms13045 (2016).
30. Reategui, E. et al. Engineered nanointerfaces for microfluidic isolation and molecular profiling of tumor-specific extracellular
vesicles. Nat. Commun. 9, 175. https://doi.org/10.1038/s41467-017-02261-1 (2018).
31. Abramowicz, A., Widlak, P. & Pietrowska, M. Proteomic analysis of exosomal cargo: The challenge of high purity vesicle isola-
tion. Mol. Biosyst. 12, 1407–1419. https://doi.org/10.1039/c6mb00082g (2016).
32. ATCC. Cell Culture Guides. ATCC online (2016).
33. Zhou, H. et al. Collection, storage, preservation, and normalization of human urinary exosomes for biomarker discovery. Kidney
Int. 69, 1471–1476 (2006).
34. Pisitkun, T., Shen, R. F. & Knepper, M. A. Identification and proteomic profiling of exosomes in human urine. Proc. Natl. Acad.
Sci. USA 101, 13368–13373 (2004).
35. Schwartz, L. S., K. Introduction to Tangential Flow Filtration for Laboratory and Process Development Applications. PALL Corp.
(2014).
36. Théry, C. et al. Minimal information for studies of extracellular vesicles 2018 (MISEV2018): A position statement of the Inter-
national Society for Extracellular Vesicles and update of the MISEV2014 guidelines. J. Extracell. Vesicl. 7, 1535750. https://doi.
org/10.1080/20013078.2018.1535750 (2018).
37. Lee, M., Ban, J.-J., Im, W. & Kim, M. Influence of storage condition on exosome recovery. Biotechnol. Bioprocess. Eng. 21, 299–304.
https://doi.org/10.1007/s12257-015-0781-x (2016).
38. Laboratories, S. MicroKros and MidiKros Hollow Fiber membranes for Tangential Laboratory Separations.
39. Doyle, L. M. & Wang, M. Z. Overview of extracellular vesicles, their origin, composition, purpose, and methods for exosome
isolation and analysis. Cells 8, 727. https://doi.org/10.3390/cells8070727 (2019).
40. Paulaitis, M., Agarwal, K. & Nana-Sinkam, P. Dynamic scaling of exosome sizes. Langmuir 34, 9387–9393. https://doi.org/10.
1021/acs.langmuir.7b04080 (2018).
41. Science, I. Measure Nanoparticles with Unparalleled Precision. https://izon.com/nanoparticlemeasurement/.
42. Soung, Y. H., Ford, S., Zhang, V. & Chung, J. Exosomes in cancer diagnostics. Cancers 9, 66 (2017).
43. Xu, R., Greening, D. W., Zhu, H. J., Takahashi, N. & Simpson, R. J. Extracellular vesicle isolation and characterization: Toward
clinical application. J. Clin. Invest. 126, 1152–1162 (2016).
44. Guo, L. & Guo, N. Exosomes: Potent regulators of tumor malignancy and potential bio-tools in clinical application. Crit. Rev.
Oncol. Hematol. 95, 346–358. https://doi.org/10.1016/j.critrevonc.2015.04.002 (2015).
45. Onitilo, A. A., Engel, J. M., Greenlee, R. T. & Mukesh, B. N. Breast cancer subtypes based on ER/PR and Her2 expression:
Comparison of clinicopathologic features and survival. Clin. Med. Res. 7, 4–13 (2009).
46. Halvaei, S. et al. Exosomes in cancer liquid biopsy: A focus on breast cancer. Mol. Ther. Nucleic Acids 10, 131–141 (2018).
47. Shimomura, A. et al. Novel combination of serum microRNA for detecting breast cancer in the early stage. Cancer Sci. 107,
326–334 (2016).
48. Lässer, C. Exosomes in diagnostic and therapeutic applications: biomarker, vaccine and RNA interference delivery vehicle.
Expert Opin. Biol. Ther. 15, 103–117. https://doi.org/10.1517/14712598.2015.977250 (2015).
49. Krishnamurti, U. & Silverman, J. F. HER2 in breast cancer: A review and update. Adv. Anat. Pathol. 21, 66 (2014).
50. Li, S., Yang, X., Yang, J., Zhen, J. & Zhang, D. Serum microRNA-21 as a potential diagnostic biomarker for breast cancer: A
systematic review and meta-analysis. Clin. Exp. Med. 16, 29–35. https://doi.org/10.1007/s10238-014-0332-3 (2016).
51. Sims, A. H., Howell, A., Howell, S. J. & Clarke, R. B. Origins of breast cancer subtypes and therapeutic implications. Nat. Clin.
Pract. Oncol. 4, 516–525. https://doi.org/10.1038/ncponc0908 (2007).
52. Kalluri, R. The biology and function of exosomes in cancer. J. Clin. Investig. 126, 1208–1215. https://doi.org/10.1172/JCI81135
(2016).
53. De Toro, J., Herschlik, L., Waldner, C. & Mongini, C. Emerging roles of exosomes in normal and pathological conditions: New
insights for diagnosis and therapeutic applications. Front. Immunol. 6, 203. https://doi.org/10.3389/fimmu.2015.00203 (2015).
54. Sheridan, C. Exosome cancer diagnostic reaches market. Nat. Biotechnol. 34, 359–360. https://doi.org/10.1038/nbt0416-359
(2016).
55. Lobb, R. J. et al. Optimized exosome isolation protocol for cell culture supernatant and human plasma. J. Extracell. Vesicl. 4,
27031–27031. https://doi.org/10.3402/jev.v4.27031 (2015).
56. Grigor’eva, A. E. et al. Contamination of exosome preparations, isolated from biological fluids. Biochem. Moscow Suppl. Ser. B
Biomed. Chem. 11, 265–271. https://doi.org/10.1134/S1990750817030040 (2017).
Scientific Reports | (2021) 11:8034 | https://doi.org/10.1038/s41598-021-86910-y 14
Vol:.(1234567890)You can also read